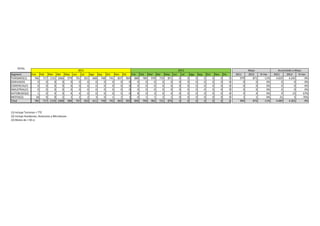
The document compares tourism data from 2011 and 2012 in a location. It contains a table with monthly and cumulative figures for different transportation segments from January to May each year. The number of tourist vehicles decreased by 11% from 984 in 2011 to 876 in 2012. Similarly, the cumulative total across all segments decreased by 9% from 4,689 vehicles in 2011 to 4,265 vehicles in 2012. Motorcycles saw the biggest decrease at 76% from 21 vehicles in 2011 to 5 vehicles in 2012.


![Eletropaulo 1 q10_eng_final [modo de compatibilidade]](https://cdn.slidesharecdn.com/ss_thumbnails/eletropaulo1q10engfinalmododecompatibilidade-100517082821-phpapp01-thumbnail.jpg?width=640&height=640&fit=bounds)


