Download to read offline
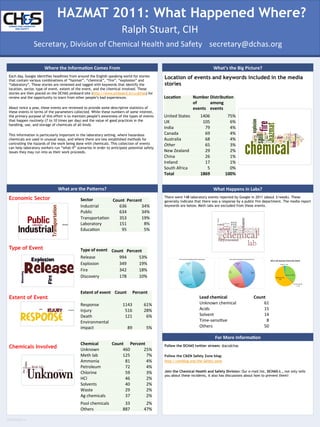

The document summarizes hazmat incidents reported in the media in 2011, with 1869 total events reported. The United States accounted for the largest number at 1406 events, followed by the UK, India, and Canada. Most events occurred in industrial settings and involved releases or explosions. Laboratory incidents accounted for 151 events, with the majority resulting in a fire department response and some injuries but few deaths. Common chemicals involved included unknown substances, acids, and solvents. The information aims to increase awareness of routine hazmat incidents and promote safe chemical handling practices.


