Download as PDF, PPTX
![# Overhead Command Shared Object Symbol
# ........ ............... ..................... ......
#
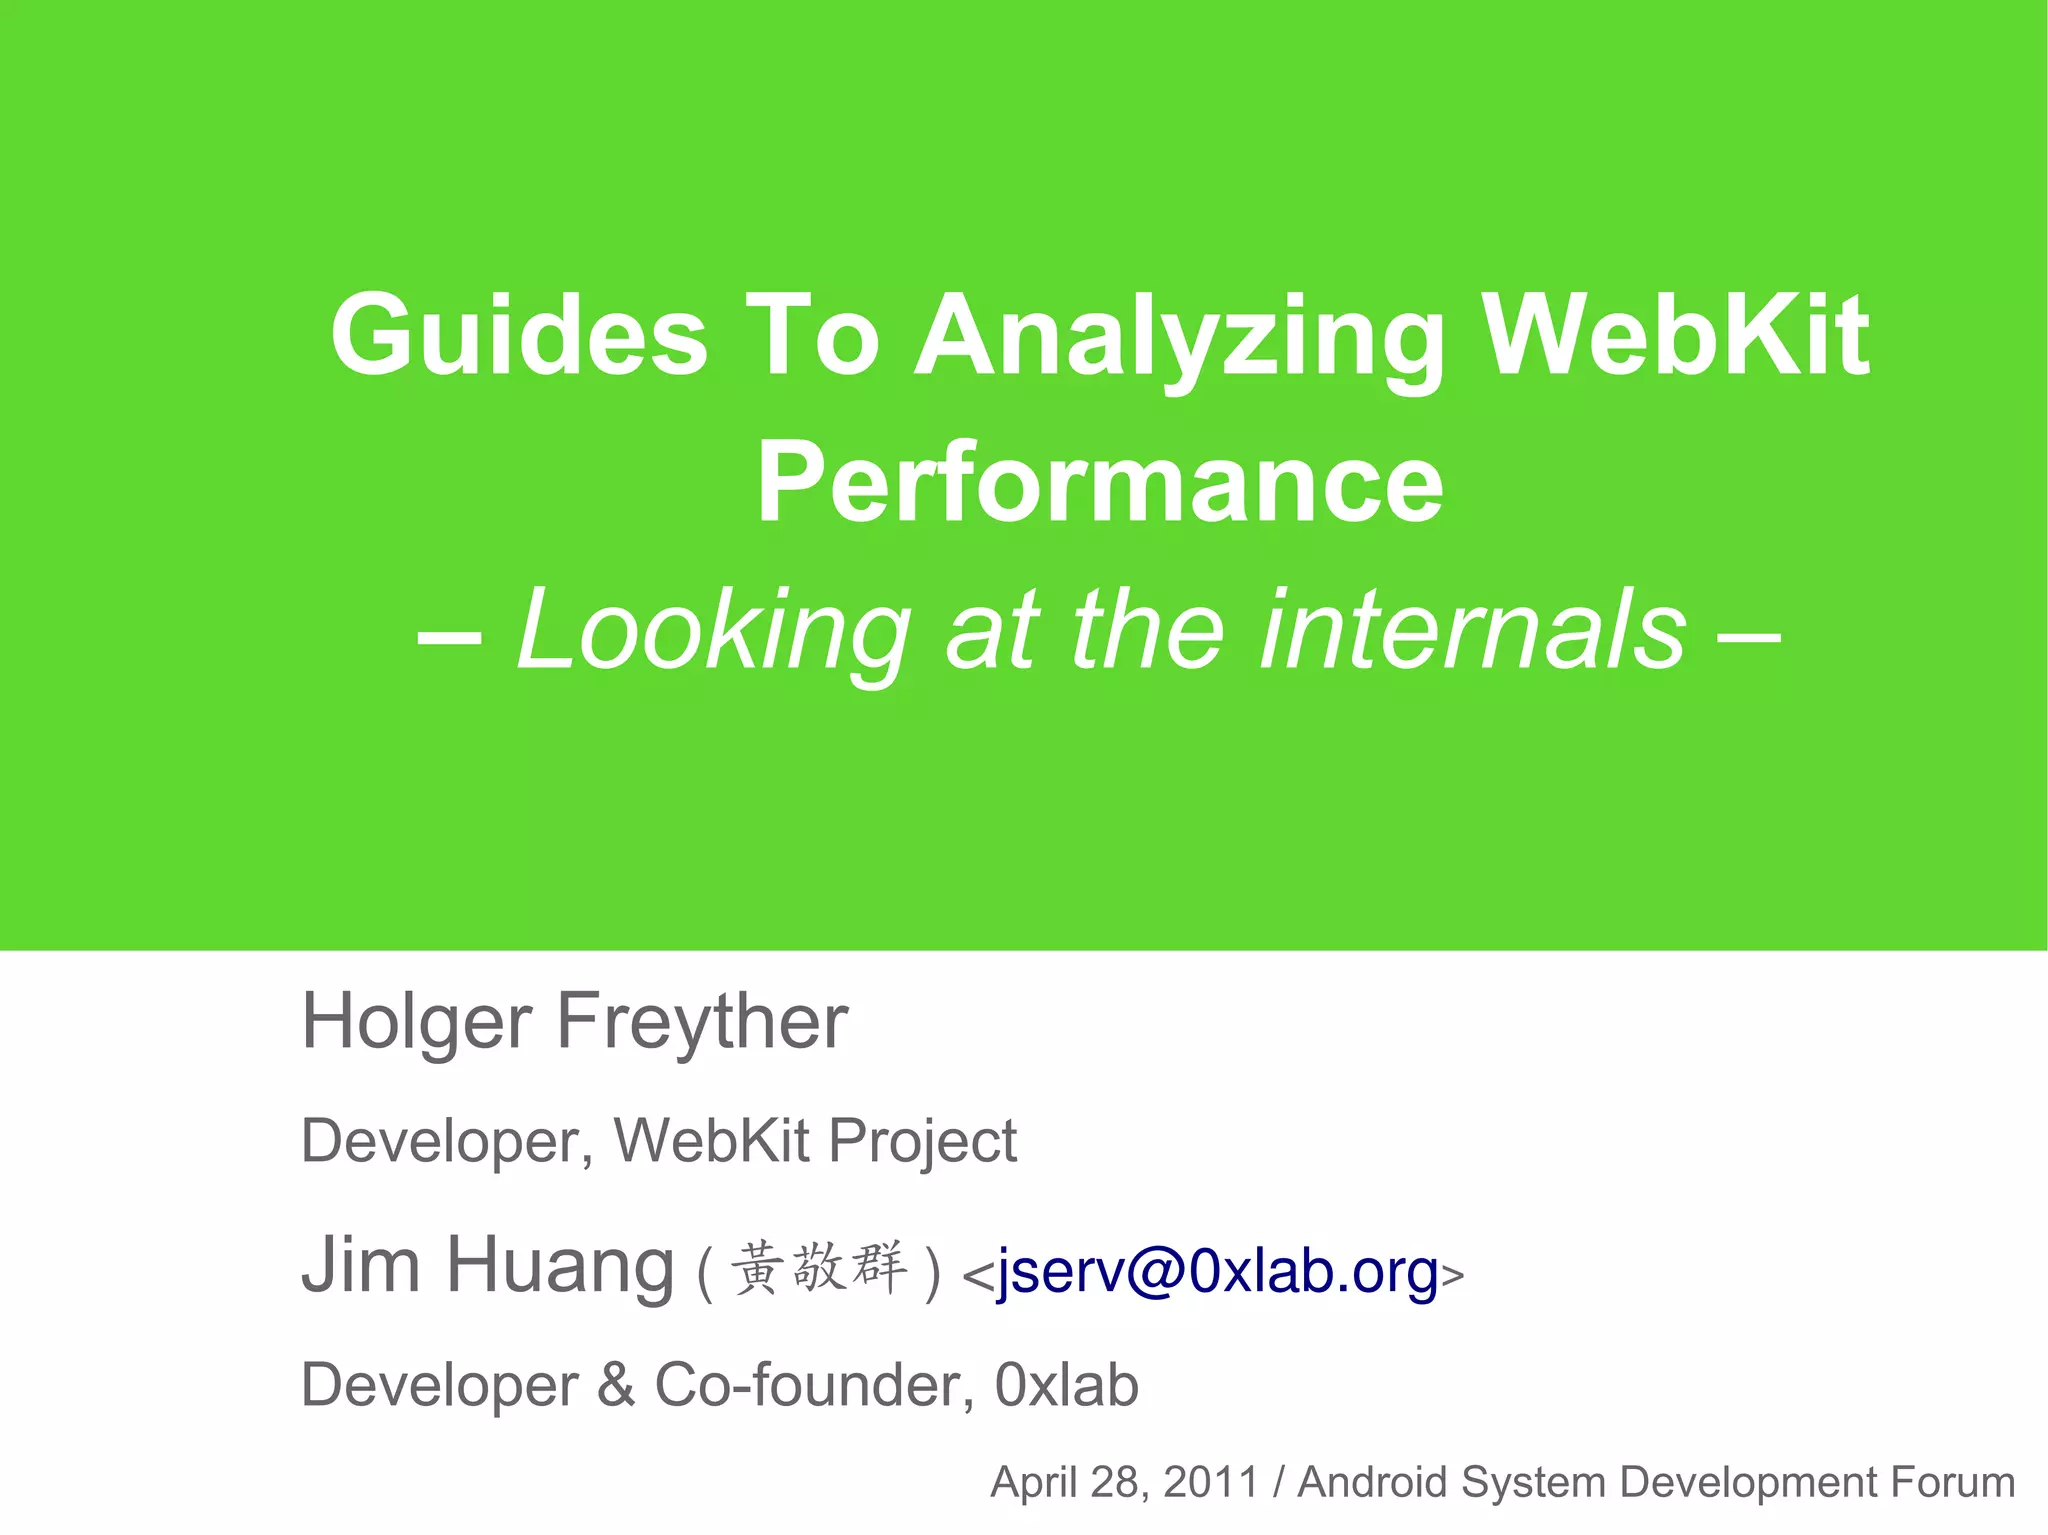
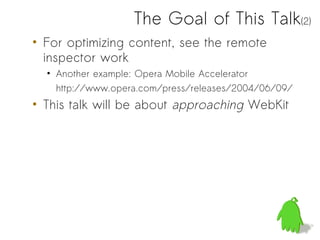
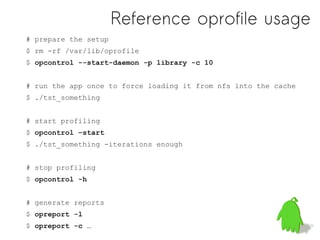
89.23% system_server 2b0c6c [.] 0x000000002b0c6c
1.26% MLVdo_thread [kernel_helper] [k] 0x0000000017aa90
1.05% d.process.acore libskia.so [.] S32A_Opaque_BlitRow32_arm
0.83% d.process.acore libcutils.so [.] android_memset32
0.63% system_server libc.so [.] memcpy
0.63% d.process.acore libc.so [.] memset
system_server is the process name of Android
system_server is the process name of Android
Framework runtime. ItItoccupies most of CPU
Framework runtime. occupies most of CPU
resources, but ititis hard to figure out details
resources, but is hard to figure out details
only by native tools like perf.
only by native tools like perf.
We can always optimize known performance hotspot
We can always optimize known performance hotspot
routines such as S32A_Opaque_BlitRow32_arm but
routines such as S32A_Opaque_BlitRow32_arm but
should be measured in advance.
should be measured in advance.](https://image.slidesharecdn.com/androidwebkit-2011-110520103423-phpapp02/85/Guides-To-Analyzing-WebKit-Performance-32-320.jpg)
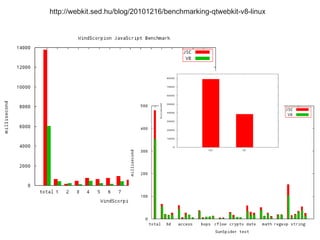


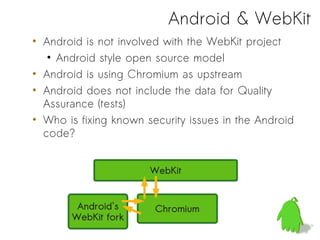
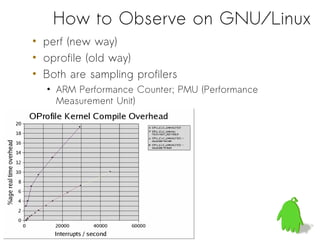
The document discusses optimizing WebKit performance, particularly in the context of Android system development. It emphasizes the importance of measuring performance rather than guessing, detailing various methods and tools for performance analysis on both GNU/Linux and Android platforms. Additionally, the text introduces the Methanol framework for benchmarking and addresses the challenges associated with performance measurement in web applications.


![[KOR][E-Kor-Seminar 2014][2/8] Webkit EFL (Ryuan)](https://cdn.slidesharecdn.com/ss_thumbnails/3-150413172904-conversion-gate01-thumbnail.jpg?width=640&height=640&fit=bounds)