Download as PDF, PPTX

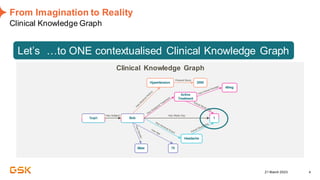
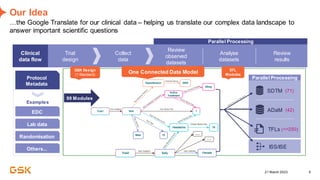
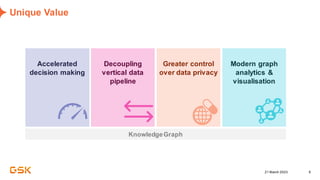
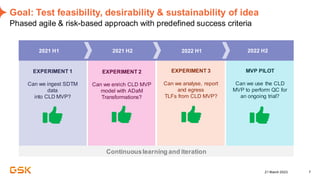
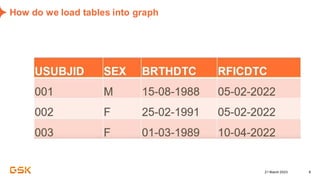
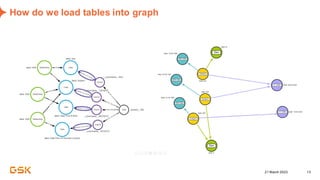
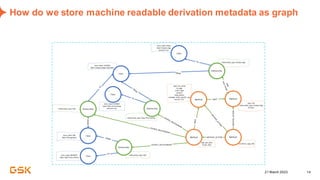
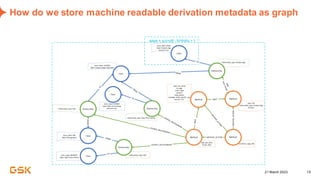
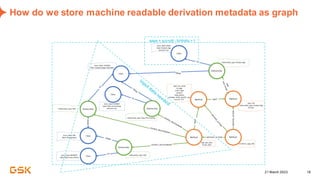
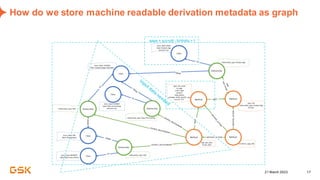
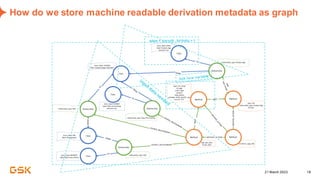
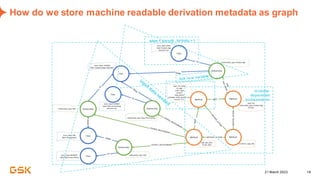
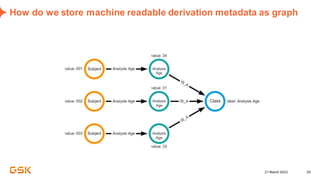
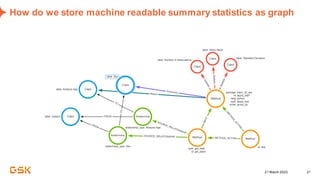
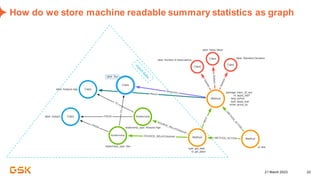
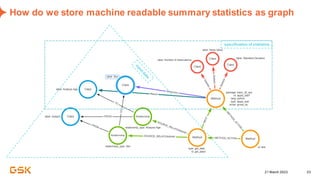
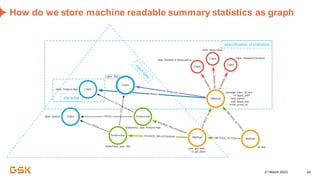

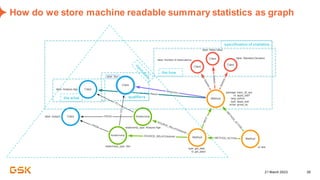
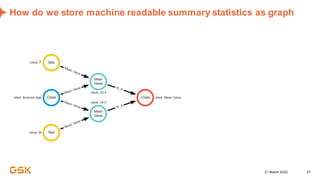
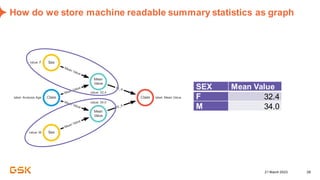
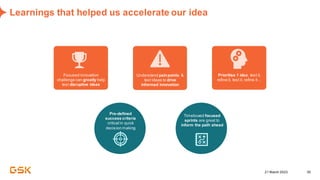


This document discusses GSK's efforts to use knowledge graphs to improve clinical reporting workflows. It describes GSK's current multi-step clinical data flow process and the resources required. The document envisions a future where a clinical knowledge graph could provide a single connected data model, parallel processing, and accelerated decision making. GSK plans to test building a minimum viable product knowledge graph to ingest and analyze clinical trial data and derive metrics. The goal is to demonstrate feasibility and inform further development through a phased agile approach.