Apidays New York 2024 - Accelerating FinTech Innovation by Vasa Krishnan, Fin...
Graph Problems06
1. Graphing
Graphs are a useful tool in science. The visual characteristics of a graph make trends in data easy
to see. One of the most valuable uses for graphs is to "predict" data that is not measured on the
graph.
1. Extrapolate: extending the graph, along the same slope, above or below measured data.
2. Interpolate: predicting data between two measured points on the graph.
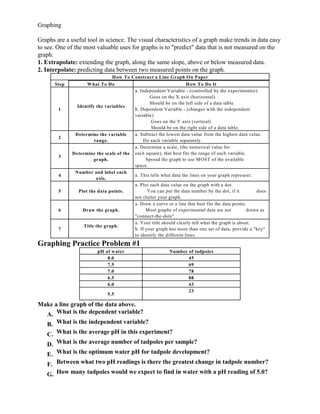
How To Construct a Line Graph On Paper
Step W hat To Do How To Do It
a. Independent Variable - (controlled by the experimentor)
Goes on the X axis (horizontal)
Should be on the left side of a data table.
Identify the variables
1 b. Dependent Variable - (changes with the independent
variable)
Goes on the Y axis (vertical)
Should be on the right side of a data table.
Determine the variable a. Subtract the lowest data value from the highest data value.
2
range. Do each variable separately.
a. Determine a scale, (the numerical value for
Determine the scale of the each square), that best fits the range of each variable.
3
graph. Spread the graph to use MOST of the available
space.
Number and label each
4 a. This tells what data the lines on your graph represent.
axis.
a. Plot each data value on the graph with a dot.
5 Plot the data points. You can put the data number by the dot, if it does
not clutter your graph.
a. Draw a curve or a line that best fits the data points.
6 Draw the graph. Most graphs of experimental data are not drawn as
"connect-the-dots".
a. Your title should clearly tell what the graph is about.
Title the graph.
7 b. If your graph has more than one set of data, provide a "key"
to identify the different lines.
Graphing Practice Problem #1
pH of water Number of tadpoles
8.0 45
7.5 69
7.0 78
6.5 88
6.0 43
23
5.5
Make a line graph of the data above.
A. What is the dependent variable?
B. What is the independent variable?
C. What is the average pH in this experiment?
D. What is the average number of tadpoles per sample?
E. What is the optimum water pH for tadpole development?
F. Between what two pH readings is there the greatest change in tadpole number?
G. How many tadpoles would we expect to find in water with a pH reading of 5.0?
2. Graphing Practice Problem #2
The energy needed to remove the most loosely held electron in an atom is called the First
Ionization Energy. This energy for the first 18 elements is shown in the table below.
Atomic Number 1st I.E. (volts)
1 13.53
2 24.46
3 5.64
4 9.28
5 8.26
6 11.22
7 14.48
8 13.55
9 17.34
10 21.47
11 5.12
12 7.61
13 5.96
14 8.12
15 10.9
16 10.3
17 12.95
15.68
18
A. This data is very accurately measured. Plot the data points and then draw a line
graph in "connect-the-dot" fashion.
Graphing Practice Problem #3
According to Charles' Law, the volume of a gas decreases as the temperature of the gas
decreases. A sample of gas was collected at 100 degrees Celsius and then cooled. The
changes in the volume of the sample are shown below.
Temperature ( oC ) Volume ( ml )
100 317
80 297
60 288
40 278
30 252
20 243
10 236
0 233
-10 227
-30 202
A. Graph the data above.
B. Use one full sheet of graph paper to construct another graph that will allow you to
extrapolate (extend the graph beyond measured data) the graph you made in part A
to reach a gas volume of zero milliliters.
The temperature at which the volume of the gas reaches zero is the theoretical
temperature of Absolute Zero. From your graph, what is the Celsius Temperature
for Absolute Zero?