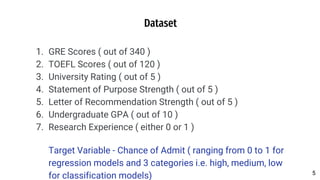
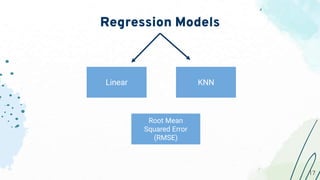
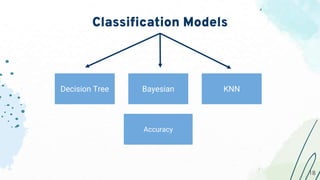
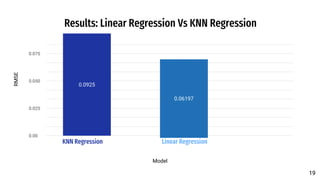
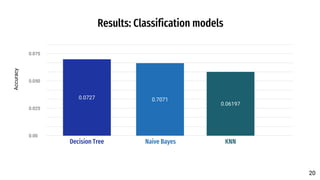
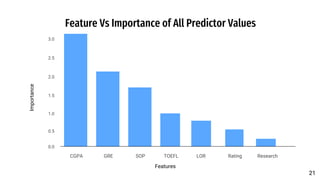
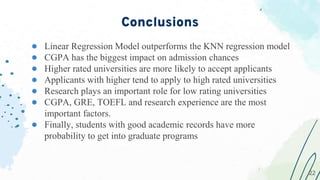
Graduate Admission Prediction:
Comparing Regression and Classification
models
1
1
Data Analytics (ECMP5005D)
Team 4
Sebastian Duque Salazar
Faiza Ullah
Muskaan Sultana Shaik
2
2
Introduction
● As international graduate students, the foremost
concern is determining the chances of admission
to reputable universities.
● To address this, a predictive model employing two
regression and three classification techniques
have been developed.
● The dataset, sourced from Kaggle, is credited to
Mohan S Acharya and draws inspiration from the
UCLA dataset.
● It is useful for the graduate students as a
prediction tool to check their chances of getting
into the university of their choice.
3
3
Overview
● We have developed two regression models: Linear
regression and KNN. This will be a tool for students.
● The models that are developed in classification are:
Decision Tree Model, Bayesian model, KNN.
● The models will predict student’s chances of being
accepted based on their characteristics. This will help
students to save time.
● There is an increase in graduate students in recent years
and they do not know their chances to get admitted to a
certain university.
4
4
Dataset
5
5
1. GRE Scores ( out of 340 )
2. TOEFL Scores ( out of 120 )
3. University Rating ( out of 5 )
4. Statement of Purpose Strength ( out of 5 )
5. Letter of Recommendation Strength ( out of 5 )
6. Undergraduate GPA ( out of 10 )
7. Research Experience ( either 0 or 1 )
Target Variable - Chance of Admit ( ranging from 0 to 1 for
regression models and 3 categories i.e. high, medium, low
for classification models)
Methodology
Data extraction
Data Exploratory
Analysis (EDA)
Data cleaning Model creation
and predictions
Regression and
Classification
6
6
Methodology - Data cleaning and data splitting
Data cleaning
● Null observations were removed
● Remove unnecessary features and rename variables
● Transform categorical variables into factors
● Standardization of data
● Outliers and leverages were removed
Data splitting
Train Dataset -
80%
Test Dataset
20% 7
7
Methodology - Data Exploratory Analysis
Helped us to understand the relations and patterns of our data.
8
8
Methodology - Regression Models creation
Linear Regression
● Step backward model was used as feature selection
● We got an adjusted R-squared of 0.823
● Outliers were removed
The model accomplished all the assumptions: Linearity, Normality,
Heteroscedasticity and Multicollinearity
Chance= −1.359 + 0.00216×GRE + 0.00266×TOEFL + 0.00782×Rating +
0.01271×LOR + 0.12003×CGPA + 0.02375×Research
Final equation
9
9
Methodology - Regression Models creation
KNN
● 10-fold cross validation was used for tuning hyperparameter K.
● A 10-40 search grid was defined
● The best K was 21. Which is very close to √500 = 22.3
10
10
Transformation of target variable
● Target variable chance was transformed into 3 categories: low,
medium and high.
11
11
Chance of being admitted
low
Medium
High
Methodology - Classification Models creation
KNN
● 10-fold cross validation was used for tuning hyperparameter K.
● A 10-40 search grid was defined
● The best K was 15
12
12
Methodology - Classification Models creation
Decision Tree
13
13
Methodology - Classification Models creation
Bayesian Model
14
14
● Naive Bayes function was used
● Confusion matrix was used to assess the model’s performance
Predicted Low Medium High
Low 19 6 0
Medium 5 16 14
High 1 3 35
Accuracy was 0.71
Methodology - Regression Models creation
Linear Regression
● Step backward model was used as feature selection
● We got an adjusted R-squared of 0.823
● Outliers were removed
The model accomplished all the assumptions: Linearity, Normality,
Heteroscedasticity and Multicollinearity
Chance= −1.359 + 0.00216×GRE + 0.00266×TOEFL + 0.00782×Rating +
0.01271×LOR + 0.12003×CGPA + 0.02375×Research
Final equation
15
15
What were the results of the
regression models?
16
16
Regression Models
Linear KNN
Root Mean
Squared Error
(RMSE)
17
17
Classification Models
Decision Tree KNN
Accuracy
18
18
Bayesian
Results: Linear Regression Vs KNN Regression
0.00
0.025
0.050
0.075
0.0925
0.06197
KNN Regression Linear Regression
Model
RMSE
19
19
Results: Classification models
0.00
0.025
0.050
0.075
0.0727 0.7071
Decision Tree
Accuracy
20
20
0.06197
Naive Bayes KNN
Feature Vs Importance of All Predictor Values
0.5
0.0
1.5
1.0
2.5
2.0
3.0
CGPA GRE SOP TOEFL LOR Rating Research
Importance
Features
21
21
● Linear Regression Model outperforms the KNN regression model
● CGPA has the biggest impact on admission chances
● Higher rated universities are more likely to accept applicants
● Applicants with higher tend to apply to high rated universities
● Research plays an important role for low rating universities
● CGPA, GRE, TOEFL and research experience are the most
important factors.
● Finally, students with good academic records have more
probability to get into graduate programs
Conclusions
22
22
CREDITS: This presentation template was created
by Slidesgo, including icons by Flaticon,
infographics & images by Freepik
Thank You
Q&A
23
23

Graduate admission Prediction: Comparing Regression and Classification models

  • 1.
    Graduate Admission Prediction: ComparingRegression and Classification models 1 1
  • 2.
    Data Analytics (ECMP5005D) Team4 Sebastian Duque Salazar Faiza Ullah Muskaan Sultana Shaik 2 2
  • 3.
    Introduction ● As internationalgraduate students, the foremost concern is determining the chances of admission to reputable universities. ● To address this, a predictive model employing two regression and three classification techniques have been developed. ● The dataset, sourced from Kaggle, is credited to Mohan S Acharya and draws inspiration from the UCLA dataset. ● It is useful for the graduate students as a prediction tool to check their chances of getting into the university of their choice. 3 3
  • 4.
    Overview ● We havedeveloped two regression models: Linear regression and KNN. This will be a tool for students. ● The models that are developed in classification are: Decision Tree Model, Bayesian model, KNN. ● The models will predict student’s chances of being accepted based on their characteristics. This will help students to save time. ● There is an increase in graduate students in recent years and they do not know their chances to get admitted to a certain university. 4 4
  • 5.
    Dataset 5 5 1. GRE Scores( out of 340 ) 2. TOEFL Scores ( out of 120 ) 3. University Rating ( out of 5 ) 4. Statement of Purpose Strength ( out of 5 ) 5. Letter of Recommendation Strength ( out of 5 ) 6. Undergraduate GPA ( out of 10 ) 7. Research Experience ( either 0 or 1 ) Target Variable - Chance of Admit ( ranging from 0 to 1 for regression models and 3 categories i.e. high, medium, low for classification models)
  • 6.
    Methodology Data extraction Data Exploratory Analysis(EDA) Data cleaning Model creation and predictions Regression and Classification 6 6
  • 7.
    Methodology - Datacleaning and data splitting Data cleaning ● Null observations were removed ● Remove unnecessary features and rename variables ● Transform categorical variables into factors ● Standardization of data ● Outliers and leverages were removed Data splitting Train Dataset - 80% Test Dataset 20% 7 7
  • 8.
    Methodology - DataExploratory Analysis Helped us to understand the relations and patterns of our data. 8 8
  • 9.
    Methodology - RegressionModels creation Linear Regression ● Step backward model was used as feature selection ● We got an adjusted R-squared of 0.823 ● Outliers were removed The model accomplished all the assumptions: Linearity, Normality, Heteroscedasticity and Multicollinearity Chance= −1.359 + 0.00216×GRE + 0.00266×TOEFL + 0.00782×Rating + 0.01271×LOR + 0.12003×CGPA + 0.02375×Research Final equation 9 9
  • 10.
    Methodology - RegressionModels creation KNN ● 10-fold cross validation was used for tuning hyperparameter K. ● A 10-40 search grid was defined ● The best K was 21. Which is very close to √500 = 22.3 10 10
  • 11.
    Transformation of targetvariable ● Target variable chance was transformed into 3 categories: low, medium and high. 11 11 Chance of being admitted low Medium High
  • 12.
    Methodology - ClassificationModels creation KNN ● 10-fold cross validation was used for tuning hyperparameter K. ● A 10-40 search grid was defined ● The best K was 15 12 12
  • 13.
    Methodology - ClassificationModels creation Decision Tree 13 13
  • 14.
    Methodology - ClassificationModels creation Bayesian Model 14 14 ● Naive Bayes function was used ● Confusion matrix was used to assess the model’s performance Predicted Low Medium High Low 19 6 0 Medium 5 16 14 High 1 3 35 Accuracy was 0.71
  • 15.
    Methodology - RegressionModels creation Linear Regression ● Step backward model was used as feature selection ● We got an adjusted R-squared of 0.823 ● Outliers were removed The model accomplished all the assumptions: Linearity, Normality, Heteroscedasticity and Multicollinearity Chance= −1.359 + 0.00216×GRE + 0.00266×TOEFL + 0.00782×Rating + 0.01271×LOR + 0.12003×CGPA + 0.02375×Research Final equation 15 15
  • 16.
    What were theresults of the regression models? 16 16
  • 17.
    Regression Models Linear KNN RootMean Squared Error (RMSE) 17 17
  • 18.
    Classification Models Decision TreeKNN Accuracy 18 18 Bayesian
  • 19.
    Results: Linear RegressionVs KNN Regression 0.00 0.025 0.050 0.075 0.0925 0.06197 KNN Regression Linear Regression Model RMSE 19 19
  • 20.
    Results: Classification models 0.00 0.025 0.050 0.075 0.07270.7071 Decision Tree Accuracy 20 20 0.06197 Naive Bayes KNN
  • 21.
    Feature Vs Importanceof All Predictor Values 0.5 0.0 1.5 1.0 2.5 2.0 3.0 CGPA GRE SOP TOEFL LOR Rating Research Importance Features 21 21
  • 22.
    ● Linear RegressionModel outperforms the KNN regression model ● CGPA has the biggest impact on admission chances ● Higher rated universities are more likely to accept applicants ● Applicants with higher tend to apply to high rated universities ● Research plays an important role for low rating universities ● CGPA, GRE, TOEFL and research experience are the most important factors. ● Finally, students with good academic records have more probability to get into graduate programs Conclusions 22 22
  • 23.
    CREDITS: This presentationtemplate was created by Slidesgo, including icons by Flaticon, infographics & images by Freepik Thank You Q&A 23 23

Editor's Notes

  • #18 As we performed regression model on trained datasets, we used the Linear and KNN. We chose RMSE to compare the models as RMSE tells us how close are the predictions to the real values. A lower RMSE indicates better predictive performance. It means that, on average, the model’s predictions are closer to the actual values. Based on the RMSE values we can conclude that: The regression model has a lower RMSE (0.06197) compared to the KNN regression model (0.09257). Therefore, the regression model performs better in terms of predictive accuracy, as it has smaller prediction errors on average. Based on the RMSE values, the regression model is better at predicting the target variable (chances of getting admitted) compared to the KNN regression model 3.1691703 2.1650358 1.7036939 0.9789503 0.7842604 0.4695493 0.2816644 This a box plot which shows the importance of each feature for admission requirement. CGPA is the most important criteria for graduate admission followed by GRE and SOP score.
  • #19 As we performed regression model on trained datasets, we used the Linear and KNN. We chose RMSE to compare the models as RMSE tells us how close are the predictions to the real values. A lower RMSE indicates better predictive performance. It means that, on average, the model’s predictions are closer to the actual values. Based on the RMSE values we can conclude that: The regression model has a lower RMSE (0.06197) compared to the KNN regression model (0.09257). Therefore, the regression model performs better in terms of predictive accuracy, as it has smaller prediction errors on average. Based on the RMSE values, the regression model is better at predicting the target variable (chances of getting admitted) compared to the KNN regression model 3.1691703 2.1650358 1.7036939 0.9789503 0.7842604 0.4695493 0.2816644 This a box plot which shows the importance of each feature for admission requirement. CGPA is the most important criteria for graduate admission followed by GRE and SOP score.
  • #24 As we performed regression model on trained datasets, we used the Linear and KNN. We chose RMSE to compare the models as RMSE tells us how close are the predictions to the real values. A lower RMSE indicates better predictive performance. It means that, on average, the model’s predictions are closer to the actual values.