Maxwell's formulation - differential forms on euclidean space
GR analysis techniques
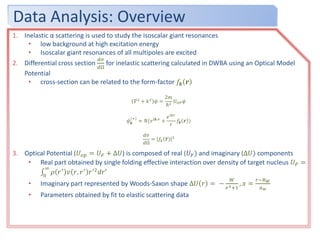
1. Data Analysis: Overview
1. Inelastic α scattering is used to study the isoscalar giant resonances
• low background at high excitation energy
• Isoscalar giant resonances of all multipoles are excited
2. Differential cross section
𝑑𝜎
𝑑Ω
for inelastic scattering calculated in DWBA using an Optical Model
Potential
• cross-section can be related to the form-factor 𝑓𝒌 𝒓
𝛻2
+ 𝑘2
𝜓 =
2𝑚
ℏ2
𝑈 𝑂𝑃 𝜓
𝜓 𝒌
+
≈ 𝑁(𝑒 𝑖𝒌⋅𝒓
+
𝑒 𝑖𝑘𝑟
𝑟
𝑓𝒌 𝒓 )
𝑑𝜎
𝑑Ω
= 𝑓𝑘 𝒓 2
3. Optical Potential (𝑈 𝑜𝑝 = 𝑈 𝐹 + Δ𝑈) is composed of real (𝑈 𝐹) and imaginary (Δ𝑈) components
• Real part obtained by single folding effective interaction over density of target nucleus 𝑈 𝐹 =
0
∞
𝜌 𝑟′
𝑣 𝑟, 𝑟′
𝑟′2
𝑑𝑟′
• Imaginary part represented by Woods-Saxon shape Δ𝑈 𝑟 = −
𝑊
𝑒 𝑥+1
, 𝑥 =
𝑟−𝑅 𝑊
𝑎 𝑤
• Parameters obtained by fit to elastic scattering data
2. Data Analysis: Overview
4. Target Densities
• Fermi shape for ground-state density 𝜌 𝑟 =
𝜌0
1+𝑒
𝑟−𝑐
𝑎
• Transition densities to different multipoles obtained by deformation of ground-state
density
5. Transition Potentials obtained by single-folding effective interaction over the target nucleus
transition density
6. DWBA used to calculate differential cross-section of transition to each multipole
• Due to angular range, difficult to distinguish L>4
• Strength of calculated L=0-4 multipoles varied to fit to experimental differential cross-
section
• Obtain Energy Weighted Sum Rule (EWSR) for L=0-4 multipoles: sum of transition
possibilities from ground to excited, multiplied by excitation energy
𝑆 𝑄 ≡
𝑛
𝐸 𝑛 − 𝐸0 𝑛 𝑄 0
2
=
1
2
0 𝑄, 𝐻, 𝑄 0
3. Transition Densities
Generate transition density by ground-state density deformation or nuclear structure
calculation (e.g. RPA)
• Bohr-Mottleson form: 𝑔ℓ
𝐵𝑀
𝑟 = −𝛿ℓ
𝑚 𝑑𝜌 𝑟
𝑑𝑟
• The transition density for excitation of low-lying vibrational states
• Used for GR with ℓ ≥ 2
• For GMR transition density, the “breathing mode”:
𝑔0 𝑟 = −𝛼0
𝑚
3𝜌 𝑟 + 𝑟
𝑑𝜌 𝑟
𝑑𝑟
RPA calculations tend to give TD similar to this form
4. Transition Densities cont.
The dipole transition density is less transparent. The above form for l=1
corresponds to small displacement of the center of mass without change of shape.
The form used for the dipole, as derived by Harakeh and Dieperink:
𝜌 𝑟 = −
𝛽1
𝑅
3𝑟2
𝑑
𝑑𝑟
+ 10𝑟 −
5
3
𝑟2
𝑑
𝑑𝑟
+ 𝜖 𝑟
𝑑2
𝑑𝑟2
+ 4
𝑑
𝑑𝑟
𝜌0(𝑟)
where, R is the half-density radius of the Fermi mass distribution, β1 is the
coupling collective parameter
𝛽1
2
=
6𝜋ℏ2
𝑚𝐴𝐸 𝑥
𝑅2
(11 𝑟4
−
25
3
𝑟2 2
− 10𝜖 𝑟2
)
𝜖 =
1
3𝑚𝐴
4
𝐸2
+
5
𝐸0
ℏ2
5. Effective Interaction
• N-N interaction is averaged over
density distribution of 𝜶 particle,
represented by Gaussian with
complex strength (𝒕 = 𝟏. 𝟗𝟒 𝐟𝐦)
• Hybrid approach where real and
complex parts have different radial
shapes (phenomenological W-S for
imaginary part)
• Correction to strength 𝑣 by making
interaction density dependent
• Dynamic correction to density
dependence when applied to inelastic
scattering and density becomes
deformed. This correction reduces
strength in the interior.
𝒗 𝒈 𝒔 = − 𝒗 + 𝒊𝒘 𝒆
−
𝒔 𝟐
𝒕 𝟐
Im𝑈 𝑟 = −
𝑊
𝑒 𝑥 + 1
, 𝑥 =
𝑟 − 𝑅 𝑊
𝑎 𝑤
𝑣 𝐷𝐷𝐺 𝑠, 𝜌 = 𝑣 𝐺 𝑠 𝑓 𝜌
𝑓 𝜌 = 1 − 𝛼𝜌 𝑟′ 𝛽
, 𝛽 =
2
3
When applied to inelastic scattering the density is deformed
and this affects the interaction 𝜌 → 𝜌 + 𝛿𝜌 and
𝑣 𝜌 → 𝑣(𝜌 + 𝛿𝜌)
𝑣′
𝜌 = 𝑣 𝜌 +
𝜌𝜕𝑣 𝜌
𝜕𝜌
𝛼′
= 𝛼 1 + 𝛽 =
5
3
𝛼
𝑓′
𝜌 = 1 − 𝛼 1 + 𝛽 𝜌 𝑟′ 𝛽
6. Effective Interaction
• N-N interaction is averaged over
density distribution of 𝛼 particle,
represented by Gaussian with complex
strength (𝑡 = 1.94 𝑓𝑚)
• Hybrid approach where real and
complex parts have different radial
shapes (phenomenological W-S for
imaginary part)
• Correction to strength 𝑣 by making
interaction density dependent
• Dynamic correction to density
dependence when applied to inelastic
scattering and density becomes
deformed. This correction reduces
strength in the interior.
𝑣𝑔 𝑠 = − 𝑣 + 𝑖𝑤 𝑒
−
𝑠2
𝑡2
𝐈𝐦𝑼 𝒓 = −
𝑾
𝒆 𝒙 + 𝟏
, 𝒙 =
𝒓 − 𝑹 𝑾
𝒂 𝒘
𝑣 𝐷𝐷𝐺 𝑠, 𝜌 = 𝑣 𝐺 𝑠 𝑓 𝜌
𝑓 𝜌 = 1 − 𝛼𝜌 𝑟′ 𝛽
, 𝛽 =
2
3
When applied to inelastic scattering the density is deformed
and this affects the interaction 𝜌 → 𝜌 + 𝛿𝜌 and
𝑣 𝜌 → 𝑣(𝜌 + 𝛿𝜌)
𝑣′
𝜌 = 𝑣 𝜌 +
𝜌𝜕𝑣 𝜌
𝜕𝜌
𝛼′
= 𝛼 1 + 𝛽 =
5
3
𝛼
𝑓′
𝜌 = 1 − 𝛼 1 + 𝛽 𝜌 𝑟′ 𝛽
7. Effective Interactions
• N-N interaction is averaged over
density distribution of 𝛼 particle,
represented by Gaussian with complex
strength (𝑡 = 1.94 𝑓𝑚)
• Hybrid approach where real and
complex parts have different radial
shapes (phenomenological W-S for
imaginary part)
• Correction to strength 𝒗 by making
interaction density dependent
• Dynamic correction to density
dependence when applied to inelastic
scattering and density becomes
deformed. This correction reduces
strength in the interior.
𝑣𝑔 𝑠 = − 𝑣 + 𝑖𝑤 𝑒
−
𝑠2
𝑡2
𝐼𝑚𝑈 𝑟 = −
𝑊
𝑒 𝑥 + 1
, 𝑥 =
𝑟 − 𝑅 𝑊
𝑎 𝑤
𝒗 𝑫𝑫𝑮 𝒔, 𝝆 = 𝒗 𝑮 𝒔 𝒇 𝝆
𝒇 𝝆 = 𝟏 − 𝜶𝝆 𝒓′ 𝜷
, 𝜷 =
𝟐
𝟑
When applied to inelastic scattering the density is deformed
and this affects the interaction 𝜌 → 𝜌 + 𝛿𝜌 and
𝑣 𝜌 → 𝑣(𝜌 + 𝛿𝜌)
𝑣′
𝜌 = 𝑣 𝜌 +
𝜌𝜕𝑣 𝜌
𝜕𝜌
𝛼′
= 𝛼 1 + 𝛽 =
5
3
𝛼
𝑓′
𝜌 = 1 − 𝛼 1 + 𝛽 𝜌 𝑟′ 𝛽
8. Effective Interactions
• N-N interaction is averaged over
density distribution of 𝛼 particle,
represented by Gaussian with complex
strength (𝑡 = 1.94 𝑓𝑚)
• Hybrid approach where real and
complex parts have different radial
shapes (phenomenological W-S for
imaginary part)
• Correction to strength 𝑣 by making
interaction density dependent
• Dynamic correction to density
dependence when applied to inelastic
scattering and density becomes
deformed. This correction reduces
strength in the interior.
𝑣𝑔 𝑠 = − 𝑣 + 𝑖𝑤 𝑒
−
𝑠2
𝑡2
𝐼𝑚𝑈 𝑟 = −
𝑊
𝑒 𝑥 + 1
, 𝑥 =
𝑟 − 𝑅 𝑊
𝑎 𝑤
𝑣 𝐷𝐷𝐺 𝑠, 𝜌 = 𝑣 𝐺 𝑠 𝑓 𝜌
𝑓 𝜌 = 1 − 𝛼𝜌 𝑟′ 𝛽
, 𝛽 =
2
3
When applied to inelastic scattering the density is deformed
and this affects the interaction 𝝆 → 𝝆 + 𝜹𝝆 and
𝒗 𝝆 → 𝒗(𝝆 + 𝜹𝝆)
𝒗′
𝝆 = 𝒗 𝝆 +
𝝆𝝏𝒗 𝝆
𝝏𝝆
𝜶′
= 𝜶 𝟏 + 𝜷 =
𝟓
𝟑
𝜶
𝒇′
𝝆 = 𝟏 − 𝜶 𝟏 + 𝜷 𝝆 𝒓′ 𝜷
9. Continuum Subtraction
• Each spectrum divided into peak
and continuum – straight line at
high excitation joined to fermi shape
at low excitation
• Results in a distribution which is the
weighted average of distributions
created using different continuum
choices
0
1000
2000
3000
4000
5000
6000
7000
8000
9000
0 50
Counts Ex (MeV)
θAVG = 4.3°
0
1000
2000
3000
4000
5000
6000
7000
8000
9000
0 50
Counts
Ex (MeV)
θAVG = 1.1°44Ca
Inelastic α spectra obtained for 44Ca are shown. The
lines are examples of continua chosen for analyses.
10. Fit to data
• Divide peak and continuum cross-
sections into bins by excitation
energy
• By comparing experimental angular
distributions to the DWBA calculation,
strengths of isoscalar L=0-4
contributions varied to minimize χ2
• IVGDR contributions are calculated
and held fixed in the fits
• Uncertainty determined for each
multipole fit by incrementing or
decrementing strength of that
multipole, adjusting strengths of other
multipoles by fitting to the data,
continuing until new χ2 is 1 unit larger
than the best-fit total χ2
GR peak “sliced” into 300 keV bins for
multipole decomposition analysis
11. Fit to data
• Divide peak and continuum cross-
sections into bins by excitation
energy
• By comparing experimental angular
distributions to the DWBA
calculation, strengths of isoscalar
L=0-4 contributions varied to
minimize χ2
• IVGDR contributions are calculated
and held fixed in the fits
• Uncertainty determined for each
multipole fit by incrementing or
decrementing strength of that
multipole, adjusting strengths of
other multipoles by fitting to the
data, continuing until new χ2 is 1 unit
larger than the best-fit total χ2
0.1
1
10
100
0 2 4 6 8
Cont.
15.9 MeV
0.1
1
10
100
0 2 4 6 8
dσ/dΩ(mb/sr)
Peak
15.9 MeV
44Ca
L=0
L=2
L=1, T=1
0.1
1
10
100
0 2 4 6 8
dσ/dΩ(mb/sr)
Peak
20.2 MeV
L=1, T=0
0.1
1
10
100
0 2 4 6 8
Cont.
20.2 MeV
0.1
1
10
0 2 4 6 8
dσ/dΩ(mb/sr)
θcm(deg.)
Peak
25.5 MeV
L=4
L=3
0.1
1
10
100
0 2 4 6 8
θcm(deg.)
Cont.
25.5 MeV
The angular distributions of the 44Ca cross sections for three
excitation ranges of the GR peak and the continuum are plotted vs.
center-of-mass scattering angle.
12. Fit to data
• Divide peak and continuum cross-
sections into bins by excitation
energy
• By comparing experimental angular
distributions to the DWBA
calculation, strengths of isoscalar L=0-
4 contributions varied to minimize χ2
• IVGDR contributions are calculated
and held fixed in the fits
• Uncertainty determined for each
multipole fit by incrementing or
decrementing strength of that
multipole, adjusting strengths of
other multipoles by fitting to the
data, continuing until new χ2 is 1 unit
larger than the best-fit total χ2
0
0.03
0.06
0.09
5 25
FractionEWSR/MeV
E044Ca
0
0.02
0.04
0.06
0.08
5 15 25 35
E1
0
0.05
0.1
5 25
FractionEWSR/MeV
Ex (MeV)
E2
0
0.005
0.01
0.015
0.02
0.025
0.03
5 15 25 35
Ex (MeV)
E3+E4
Strength distributions obtained for 44Ca
are shown by the histograms.