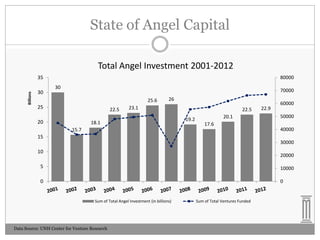
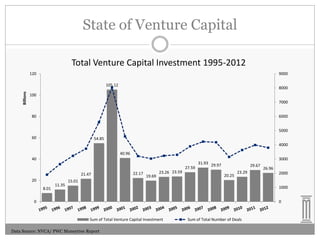
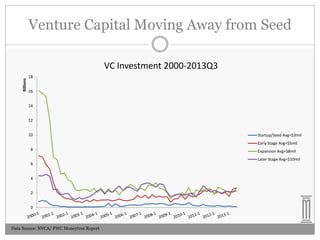
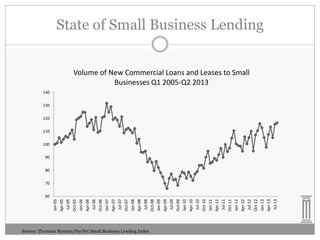
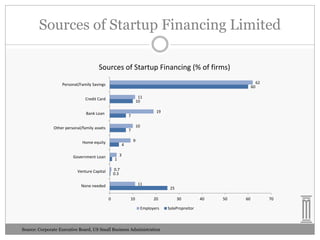
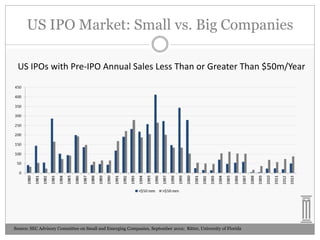
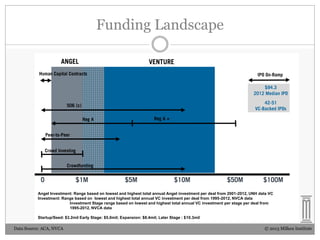
HBSAB Panel: Crowdfunding Part II
DANIEL GORFINE
DIRECTOR OF FINANCIAL MARKET POLICY AND
LEGAL COUNSEL, MILKEN INSTITUTE
DECEMBER 4, 2013
State of Angel Capital
Total Angel Investment 2001-2012
Billions

35

30

80000
30

70000

25.6

25

22.5

20

26

23.1

18.1

22.5
19.2

20.1
17.6

15.7

22.9

60000

50000
40000

15
30000

10

20000

5

10000

0

0

Sum of Total Angel Investment (in billions)

Data Source: UNH Center for Venture Research

Sum of Total Ventures Funded
State of Venture Capital
Total Venture Capital Investment 1995-2012
120

9000

Billions

105.12

8000

100
7000
80

6000
5000

60

54.85
4000
40.96

40
21.47
20
8.01

11.35

22.17

19.69

23.26 23.59

27.59

3000

31.93 29.97

29.67
20.25

23.29

26.96
2000

15.01
1000

0

0

Sum of Total Venture Capital Investment
Data Source: NVCA/ PWC Moneytree Report

Sum of Total Number of Deals
Venture Capital Moving Away from Seed

Billions

VC Investment 2000-2013Q3
18
16
14
12
10

Startup/Seed Avg=$3mil
Early Stage Avg=$5mil

8

Expansion Avg=$8mil
Later Stage Avg=$10mil

6
4
2
0

Data Source: NVCA/ PWC Moneytree Report
Jan-05
Apr-05
Jul-05
Oct-05
Jan-06
Apr-06
Jul-06
Oct-06
Jan-07
Apr-07
Jul-07
Oct-07
Jan-08
Apr-08
Jul-08
Oct-08
Jan-09
Apr-09
Jul-09
Oct-09
Jan-10
Apr-10
Jul-10
Oct-10
Jan-11
Apr-11
Jul-11
Oct-11
Jan-12
Apr-12
Jul-12
Oct-12
Jan-13
Apr-13
Jul-13

State of Small Business Lending
Volume of New Commercial Loans and Leases to Small
Businesses Q1 2005-Q2 2013

140

130

120

110

100

90

80

70

60

Source: Thomson Reuters/PayNet Small Business Lending Index
Sources of Startup Financing Limited
Sources of Startup Financing (% of firms)
Personal/Family Savings

60

62

11
10

Credit Card
Bank Loan

19

7

Other personal/family assets

10

7

Home equity

4

Government Loan

1

9

3

0.7
0.3

Venture Capital

11

None needed
0

10

25
20

Employers

Source: Corporate Executive Board, US Small Business Administration

30
SolePropreitor

40

50

60

70
US IPO Market: Small vs. Big Companies
US IPOs with Pre-IPO Annual Sales Less Than or Greater Than $50m/Year

Source: SEC Advisory Committee on Small and Emerging Companies, September 2012; Ritter, University of Florida
Public vs. Private Market
2012: Public Market Totaled $1.2tn

Private Market Totaled $1.7tn

Billions

Aggregate Capital Raise 2009-2012 by Offering Method

Source: Ivanov, SEC
New Capital Access Tools

© 2013 Milken Institute
Funding Landscape

Angel Investment: Range based on lowest and highest total annual Angel investment per deal from 2001-2012, UNH data VC
Investment: Range based on lowest and highest total annual VC investment per deal from 1995-2012, NVCA data
Investment Stage range based on lowest and highest total annual VC investment per stage per deal from
1995-2012, NVCA data
Startup/Seed: $3.2mil Early Stage: $5.0mil; Expansion: $8.4mil; Later Stage : $10.3mil

Data Source: ACA, NVCA

© 2013 Milken Institute
Donation-Based Crowdfunding in 2012

Source: TechCrunch, massoultion
Crowd Investing: Title III JOBS Act

Source: Fundable, Earn MBA degree.
Crowd Investing Disclosures Vary by
Offering Amount
Crowd Investing Offering
Amount (including offerings in
preceding 12 mo.)

Disclosure Requirements

Up to $100,000

Most recent income tax returns;
financial statements certified by
issuer’s executive officer

$100,000 - $500,000

Financial statements reviewed by
independent public accountant

$500,000+

Audited financial statements

Source: sec.gov
SEC Proposed Rules
Title III
Investment Advice/
Recommendations

Portal
Compensation
Models
Ongoing
Disclosures

Investor Education
Requirement
Rule 506(c) Investing
 Title II of the JOBS Act
 Ban on General Solicitation Lifted
 Accredited Investor Verification Required
 Reasonable Belief Investor Accredited
 Proposed Rules
Regulation A+
 Small Company IPOs have declined as a share of overall market
 Total filing expenses under Regulation A+ are estimated to decrease by
50% when compared to smaller reporting company S-1 filings, and by
71% when compared to traditional S-1 filings
IPOS in US % of Total Number of Deals
79%
73%

54%

$100+mil

58%

56%

51%

47%

49%

59%

57%

52%

51%
41%

25%
$50-100mil

30%

24%

27%

19%
10%

$25-50mil
$0-50mil

29%

11%

10%
15%

12%

25%

9%

Data Source: WR Hambrecht + Co, Dealogic

4%

19%

18%
8%

8%

34%

30%

15%

6%
12%

28%

6%

4%
9%

0%
3%

4%
3%

8%
1%

5%
3%

Crowdfunding Panel at Harvard Business School (Dec 4, 2013)

  • 1.
    HBSAB Panel: CrowdfundingPart II DANIEL GORFINE DIRECTOR OF FINANCIAL MARKET POLICY AND LEGAL COUNSEL, MILKEN INSTITUTE DECEMBER 4, 2013
  • 2.
    State of AngelCapital Total Angel Investment 2001-2012 Billions 35 30 80000 30 70000 25.6 25 22.5 20 26 23.1 18.1 22.5 19.2 20.1 17.6 15.7 22.9 60000 50000 40000 15 30000 10 20000 5 10000 0 0 Sum of Total Angel Investment (in billions) Data Source: UNH Center for Venture Research Sum of Total Ventures Funded
  • 3.
    State of VentureCapital Total Venture Capital Investment 1995-2012 120 9000 Billions 105.12 8000 100 7000 80 6000 5000 60 54.85 4000 40.96 40 21.47 20 8.01 11.35 22.17 19.69 23.26 23.59 27.59 3000 31.93 29.97 29.67 20.25 23.29 26.96 2000 15.01 1000 0 0 Sum of Total Venture Capital Investment Data Source: NVCA/ PWC Moneytree Report Sum of Total Number of Deals
  • 4.
    Venture Capital MovingAway from Seed Billions VC Investment 2000-2013Q3 18 16 14 12 10 Startup/Seed Avg=$3mil Early Stage Avg=$5mil 8 Expansion Avg=$8mil Later Stage Avg=$10mil 6 4 2 0 Data Source: NVCA/ PWC Moneytree Report
  • 5.
    Jan-05 Apr-05 Jul-05 Oct-05 Jan-06 Apr-06 Jul-06 Oct-06 Jan-07 Apr-07 Jul-07 Oct-07 Jan-08 Apr-08 Jul-08 Oct-08 Jan-09 Apr-09 Jul-09 Oct-09 Jan-10 Apr-10 Jul-10 Oct-10 Jan-11 Apr-11 Jul-11 Oct-11 Jan-12 Apr-12 Jul-12 Oct-12 Jan-13 Apr-13 Jul-13 State of SmallBusiness Lending Volume of New Commercial Loans and Leases to Small Businesses Q1 2005-Q2 2013 140 130 120 110 100 90 80 70 60 Source: Thomson Reuters/PayNet Small Business Lending Index
  • 6.
    Sources of StartupFinancing Limited Sources of Startup Financing (% of firms) Personal/Family Savings 60 62 11 10 Credit Card Bank Loan 19 7 Other personal/family assets 10 7 Home equity 4 Government Loan 1 9 3 0.7 0.3 Venture Capital 11 None needed 0 10 25 20 Employers Source: Corporate Executive Board, US Small Business Administration 30 SolePropreitor 40 50 60 70
  • 7.
    US IPO Market:Small vs. Big Companies US IPOs with Pre-IPO Annual Sales Less Than or Greater Than $50m/Year Source: SEC Advisory Committee on Small and Emerging Companies, September 2012; Ritter, University of Florida
  • 8.
    Public vs. PrivateMarket 2012: Public Market Totaled $1.2tn Private Market Totaled $1.7tn Billions Aggregate Capital Raise 2009-2012 by Offering Method Source: Ivanov, SEC
  • 9.
    New Capital AccessTools © 2013 Milken Institute
  • 10.
    © 2013 MilkenInstitute
  • 11.
    Funding Landscape Angel Investment:Range based on lowest and highest total annual Angel investment per deal from 2001-2012, UNH data VC Investment: Range based on lowest and highest total annual VC investment per deal from 1995-2012, NVCA data Investment Stage range based on lowest and highest total annual VC investment per stage per deal from 1995-2012, NVCA data Startup/Seed: $3.2mil Early Stage: $5.0mil; Expansion: $8.4mil; Later Stage : $10.3mil Data Source: ACA, NVCA © 2013 Milken Institute
  • 12.
    Donation-Based Crowdfunding in2012 Source: TechCrunch, massoultion
  • 13.
    Crowd Investing: TitleIII JOBS Act Source: Fundable, Earn MBA degree.
  • 14.
    Crowd Investing DisclosuresVary by Offering Amount Crowd Investing Offering Amount (including offerings in preceding 12 mo.) Disclosure Requirements Up to $100,000 Most recent income tax returns; financial statements certified by issuer’s executive officer $100,000 - $500,000 Financial statements reviewed by independent public accountant $500,000+ Audited financial statements Source: sec.gov
  • 15.
    SEC Proposed Rules TitleIII Investment Advice/ Recommendations Portal Compensation Models Ongoing Disclosures Investor Education Requirement
  • 16.
    Rule 506(c) Investing Title II of the JOBS Act  Ban on General Solicitation Lifted  Accredited Investor Verification Required  Reasonable Belief Investor Accredited  Proposed Rules
  • 17.
    Regulation A+  SmallCompany IPOs have declined as a share of overall market  Total filing expenses under Regulation A+ are estimated to decrease by 50% when compared to smaller reporting company S-1 filings, and by 71% when compared to traditional S-1 filings IPOS in US % of Total Number of Deals 79% 73% 54% $100+mil 58% 56% 51% 47% 49% 59% 57% 52% 51% 41% 25% $50-100mil 30% 24% 27% 19% 10% $25-50mil $0-50mil 29% 11% 10% 15% 12% 25% 9% Data Source: WR Hambrecht + Co, Dealogic 4% 19% 18% 8% 8% 34% 30% 15% 6% 12% 28% 6% 4% 9% 0% 3% 4% 3% 8% 1% 5% 3%