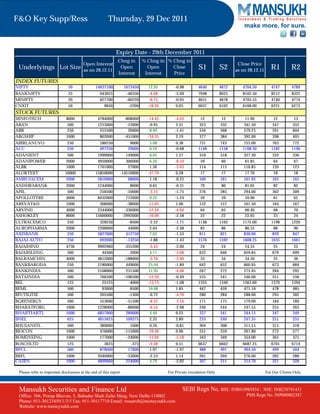
1) The document reports on changes in open interest and closing prices for various stock and index futures contracts expiring on December 29, 2011.
2) It shows that open interest increased over 12% for Nifty futures but decreased for Bank Nifty, Mini Nifty, and CNXIT futures between December 28-29.
3) Stock futures saw more significant changes in open interest over the period, with declines of over 30% for stocks like ABG Shipyard and Alok Industries.
- The document is a summary of key support and resistance levels for various stock futures contracts expiring on December 29, 2011.
- It provides information such as open interest, changes in open interest, support and resistance price levels, and closing prices for various stocks.
- Stocks mentioned include NIFTY, BANKNIFTY, MINIFTY, CNXIT and many others across sectors such as banking, pharmaceuticals, automobiles and more.
The document is a summary of key support and resistance levels for various stock and index futures contracts expiring on January 25, 2012. It shows the open interest, change in open interest, and change in closing price for each contract compared to the previous day. Key support and resistance levels are also indicated to watch for potential upside or downside moves in prices before expiration.
The document provides a summary of key support and resistance levels for various stock futures contracts expiring on January 25, 2012. It lists the underlying stocks, lot size, open interest as of January 11, change in open interest, change in price, support and resistance levels, and closing price for each stock future. The information is presented in a tabular format for easy reference.
- The document is a summary of futures and options data for various stocks and indices as of January 16, 2012, with an expiry date of January 25, 2012.
- It provides information on the open interest, change in open interest, change in price, support and resistance levels, and closing price for each underlying asset.
- The underlying assets include stock futures, index futures, and individual stocks across various sectors such as banking, oil and gas, automobiles, pharmaceuticals, and textiles.
Go Ahead for Future levels Report 6th August 2011-Mansukh Investment and Trading Solution
Insights for trading Futures - 8th September by Mansukh Investment and Trading Solutions
The document provides a summary of futures contracts for various indices and stocks trading on Indian exchanges as of November 22, 2011. It includes details such as the open interest, changes in open interest from the previous day, and closing prices. Some key points are that open interest decreased for many contracts such as Nifty, Bank Nifty, CNXIT and several individual stocks, while it increased for others such as Nifty, SBI, and Cipla. Closing prices increased for some contracts like Nifty, Cipla and decreased for others like Bank Nifty, Asian Paints.
The document provides a summary of futures trading data for various indices and stocks for an expiry date of February 23, 2012. It includes information such as the open interest, changes in open interest, support and resistance levels, and closing prices for different contracts. Overall, the data shows mixed performance across indices and stocks with some seeing an increase in open interest while others saw a decrease.
The document is a market report that provides key information on futures and options contracts expiring on March 29, 2012. It includes details such as the change in open interest, percentage change in open interest, change in closing price, support and resistance levels for various stocks and indices trading in the Indian markets. The report summarizes the performance and activity of over 50 stocks, indices and their derivative contracts.
- The document is an analysis of futures and options data from December 29, 2011 with an expiry date of January 25, 2012.
- It provides information on the open interest, change in open interest, change in price, support and resistance levels for various indices and stocks.
- The data shows the movement in open interest and price for futures contracts of indices like Nifty, Banknifty, Minifity and stocks from various sectors like banking, FMCG, infrastructure etc.
The document provides a summary of future levels for various stock indexes and individual stocks in India. It includes information such as the open interest, changes in open interest, closing price levels, and support and resistance price points for each underlying asset as of June 28, 2011. Over 50 stocks from various sectors are mentioned across industries such as banking, oil and gas, pharmaceuticals, automobiles and more.
This document provides a summary of key stock futures data as of December 20, 2011 for the expiry date of December 29, 2011. It includes information such as the open interest, changes in open interest, and closing prices for various stocks. For each stock, support and resistance levels are also provided, along with the previous day's closing price and potential price ranges. Over 50 stocks are mentioned, across sectors such as banking, automobiles, pharmaceuticals, and other industries.
The document is a market report that provides key support and resistance levels for various indices and stocks trading on futures exchanges. It includes the open interest, changes in open interest from the previous day, and support and resistance price levels for Nifty, Bank Nifty, CNXIT and individual stocks. The report indicates modest changes in open interest across most contracts and provides technical analysis indicators like support and resistance price levels.
- The document is a report on key stock futures and index futures data as of January 27, 2012 with an expiry date of February 23, 2012.
- It provides information such as the open interest, change in open interest, change in price, support and resistance levels for various stocks and indices.
- Stocks and indices shown include Nifty, Banknifty, CNXIT, 3iInfotech, ABAN, ABB, ACC, AdaniPorts, AmbujaCem, AxisBank, Bajaj Auto, Bank of Baroda, Bharti Airtel, BHEL, Cairn India, and Canara Bank among others.
The document provides stock and index futures data for the Indian markets, including open interest levels, changes in open interest, and support and resistance levels, as of April 16, 2012. Key indices like Nifty and Banknifty saw increases in open interest of over 5%, while open interest decreased for some individual stocks. Support and resistance levels are provided to analyze likely price movement.
The document is a market report that provides key information on futures and options contracts expiring on December 29, 2011. It includes details such as the change in open interest, price changes, and support and resistance levels for various stock indexes and individual stocks. The report summarizes key data on derivatives trading activity and technical indicators for over 50 underlying stocks and indexes.
The document provides a summary of futures and options data for various Indian stocks and indices for an expiry date of November 29, 2012. It includes details such as the open interest, changes in open interest from the previous day, and support and resistance levels for each underlying asset. Overall, the document analyzes the movement and activity in the Indian futures and options market for a selection of stocks and indices.
The document is a summary of futures and options data for various stocks and indices for an expiry date of February 23, 2012. It provides information such as the open interest, changes in open interest from a previous date, and support and resistance levels for each underlying asset. Overall, it shows the trading activity and price levels for a variety of Indian equities, indices, and commodities in the derivatives market on that date.
This document provides a summary of key support and resistance levels as well as open interest data for various stock futures contracts expiring on February 28, 2013. Nifty futures saw an increase in open interest of 1,168,250 contracts or 9.71% compared to the previous day, while closing at 6,038.05 points, down 0.48%. Bank Nifty futures open interest rose 10.85% with a closing price down 0.72%. A total of 38 individual stock futures contracts are summarized, with details on open interest changes and support and resistance price levels for each contract.
This document provides a summary of key information on futures and options contracts for various indices and stocks trading on Indian exchanges. It includes details such as the open interest, changes in open interest from the previous day, and support and resistance levels for different underlying assets. The information is as of September 8, 2011 and covers futures contracts expiring on September 29, 2011.
The document provides a summary of key stock and index futures data as of November 29, 2011 including open interest, changes in open interest, support and resistance levels, and closing prices. Some key points:
- Nifty index futures saw an increase in open interest of 7.6% and closed at 4812 points.
- Bank Nifty futures open interest rose 3.6% and closed at 8623 points.
- Among individual stocks, Bharati Airtel saw the largest rise in open interest of 17.62% while Federal Bank saw a fall of 3.75%.
- Closing prices for most major stocks and indices fell between 1-5% from the previous day.
This document provides a summary of key support and resistance levels, as well as changes in open interest and closing prices, for various stock futures contracts expiring on February 28, 2013. The Nifty index saw a 0.46% decrease in closing price and a 35.63% increase in open interest. Bank Nifty had a 0.68% decrease in closing price and a 50.90% increase in open interest.
1) The document provides key data on futures and options contracts expiring on January 25, 2012 for various indices and stocks, including open interest, changes in open interest, support and resistance levels, and closing prices from January 23, 2012.
2) For each underlying, data is given on lot size, open interest, percentage change in open interest, percentage change in closing price, support level 1 (S1), support level 2 (S2), closing price on January 23, closing price range 1 (R1), and closing price range 2 (R2).
3) A large number of stocks and indices are listed, with varying levels of open interest, changes in open interest and closing price, and different support
- The document provides data on changes in open interest and closing prices for various stock and index futures contracts expiring on December 29, 2011 based on information as of December 15, 2011.
- It shows the underlying, lot size, open interest as of December 15, changes in open interest, changes in closing prices, support and resistance levels, and closing prices for each contract.
- The data indicates mixed changes in open interest and closing prices across different contracts over this period with some seeing increases and others seeing decreases.
The document provides a summary of key support and resistance levels for various stock and index futures contracts expiring on May 31, 2012. It lists the underlying asset, lot size, open interest as of April 26, current price levels and expected price range over the next period based on technical analysis. Key information includes the open interest increasing or decreasing for most contracts and prices changing between -5.8% to 4.5% across different contracts.
1. The document provides key data on futures and options contracts for various Indian indices and stocks, including open interest levels, changes in open interest, support and resistance levels, and previous day's closing prices.
2. Open interest levels increased for many contracts like Nifty, Banknifty, 3iInfotech, ABG Shipyard, while decreasing for some like Minifity, Alok Textiles, BHEL.
3. Closing prices moved up for many stocks like ACC, Areva T&D, Bank of Baroda, while declining for others such as 3iInfotech, Apollo Tyres, Bajaj Hindusthan.
4. Support and resistance levels are provided
The document provides a summary of open interest and price information for various stock and index futures contracts expiring on June 28, 2012. It lists the underlying asset, lot size, open interest as of May 31, current changes in open interest and price, support and resistance levels, and closing price from May 31 for each contract. Over 40 stock and index futures contracts are summarized with relevant trading data in a table format.
The document provides a summary of key information on futures and options contracts expiring on August 25, 2011. It includes details such as the open interest, changes in open interest from the previous day, and support and resistance levels for various indices and stocks. The open interest across most contracts saw increases, with a few seeing decreases. Support and resistance levels are provided to indicate likely price ranges in the coming trading sessions.
The document is a market report that provides key information on futures and options contracts expiring on December 29, 2011 for various indices and stocks. It includes details such as open interest, changes in open interest, support and resistance levels, and previous day's closing prices. The report indicates mixed performance across indices and stocks, with some seeing increased open interest and others seeing declines.
- The document is a summary of key support and resistance levels for various stock and index futures contracts trading on Indian exchanges, along with open interest data and price movements from December 16th, 2011.
- It provides information on over 50 individual stocks, indices and sectors, including Nifty, Bank Nifty, CNXIT, stocks across various industries like banking, auto, pharmaceuticals, energy and more.
- For each contract, it lists the lot size, open interest as of December 16th, changes in open interest, support and resistance price levels, and closing price on December 16th.
- The document provides data on changes in open interest and closing prices for various stock and index futures contracts expiring on December 29, 2011.
- It shows that the open interest decreased for many contracts from December 27 to December 28, with declines over 10% for some stocks like APIL and BALRAMCHIN.
- The closing prices on December 27 also decreased for many contracts compared to the previous day, with falls of over 1% for several stocks like ADANIPOWER and ARVIND.
- Support and resistance levels are provided to analyze where prices may find support or resistance in the near future.
The document is a market report that provides key information on futures and options contracts expiring on January 25, 2012. It includes details such as the underlying asset, open interest levels as of December 30, 2011, changes in open interest levels, and current support and resistance price levels for each contract. Over 50 contracts across indices, stocks and commodities are summarized with relevant data points.
- The document is an analysis of futures and options data from January 18, 2012 for various Indian stocks and indices.
- It provides information such as the open interest, changes in open interest, support and resistance levels, and closing prices for each underlying asset.
- The assets include stock futures, index futures, and individual stocks across various sectors trading on Indian exchanges.
For the upcoming sessions we believe sentiments remain gloomy though we think 4680-4700 could be the materialistic support at current juncture . Any drift below this level may further spoils the sentiment and we might see 4500-4530 level in the short term where possibility of bounce back couldn’t be rule out.
This document provides a summary of key stock futures data as of December 19, 2011 for the expiry date of December 29, 2011. It includes information such as the underlying stock, lot size, open interest as of December 19, changes in open interest, changes in closing price, support and resistance levels, and closing price for each stock future. A total of over 50 Indian stock futures are summarized.
- The document provides data on changes in open interest and closing prices for various stock futures contracts expiring on November 24, 2011.
- It shows that for many contracts like Nifty, Banknifty, and Minifity, open interest increased between 5-7% while closing prices decreased around 2%.
- For some individual stocks, open interest increased significantly like for Adanient (+12.5%), Bank of India (+11.74%), and Bharti Airtel (+12.78%) while their closing prices decreased.
- However, for other individual stocks open interest decreased with falling closing prices as well, such as for Apollo Tyres (-6.92%), Bajaj Auto (-5.
- The document is an analysis of changes in open interest and closing prices of various stock and index futures contracts expiring on November 24, 2011.
- It provides data on the open interest as of November 18, 2011, the change and percentage change in open interest, and the change in closing prices for each contract.
- Support and resistance levels are also given to analyze where prices may pause or reverse direction.
The document provides information on futures contracts for various indices and stocks trading on Indian exchanges, including the open interest, changes in open interest, and support and resistance levels. Specifically, it lists the underlying asset, lot size, open interest as of August 12th, change in open interest, percentage changes in open and close prices, and support and resistance levels for settlement on August 25th. Over 50 stocks and indices are mentioned, with details on their futures contract activity and technical analysis levels.
The document provides a summary of futures and options data for various indices and stocks as of May 10, 2012. It includes details such as the open interest, changes in open interest from the previous day, closing price and resistance and support levels for different contracts that are set to expire on May 31, 2012. A total of over 80 stocks and indices are mentioned along with their corresponding futures contract details.
1) The document provides stock futures data including open interest, changes in open interest, and closing prices as of November 30, 2011 for various Indian stocks and indices.
2) Key data shown includes the underlying asset, lot size, open interest as of November 30th, change in open interest, change in closing price, support and resistance levels, and closing price as of November 30th.
3) Stocks and indices covered include the Nifty, Bank Nifty, CNXIT, stocks across various sectors such as banking, FMCG, autos, and support and resistance levels are provided to analyze price movement.
The document provides a summary of futures contracts for various Indian stocks and indices as of August 18, 2011. It lists details such as the open interest, changes in open interest from the previous day, and price changes for futures contracts set to expire on August 25, 2011. For each underlying asset, it provides the lot size, open interest, one day and percentage changes in open and closing prices, and support and resistance price levels.
1) The document provides data on changes in open interest and closing prices for various stock and index futures contracts trading on Indian exchanges as of November 1, 2011.
2) It shows that over the previous day, open interest increased for many contracts such as Nifty, Banknifty, 3iInfotech, ArevaT&D, AxisBank, and Canara Bank while decreasing for some others including Minifity, Abg Shipyard, Apcotex, and Century Textiles.
3) Closing prices on November 1, 2011 declined for the majority of contracts compared to the previous day, with falls of over 1% for indexes like Nifty, Banknifty and Minifity and
The document provides a summary of open interest and price changes for various stock and index futures contracts expiring on November 24, 2011. It shows the open interest, change in open interest, and change in closing price for each contract as of October 31, 2011. Key support and resistance levels are also provided for each underlying.
- The document is an analysis of futures and options data from November 25, 2011 for various Indian stocks and indices.
- It provides information such as the open interest, changes in open interest, and closing prices for futures contracts of stocks/indices expiring on December 29, 2011.
- Stocks/indices are grouped into index futures, stock futures, and key data points like lot size, open interest, changes in open interest and closing prices are provided for analysis.
- The document is an analysis of futures and options data from January 5th, 2012 with an expiry date of January 25th, 2012.
- It provides information on the open interest, change in open interest, and change in closing price for various stock indexes and individual stocks.
- The data shows the current values as well as support and resistance levels for each underlying asset.
- The document is an analysis of futures and options data from January 5th, 2012 with an expiry date of January 25th, 2012.
- It provides information such as open interest, changes in open interest, changes in closing price for various stocks and indices.
- The stocks and indices include Nifty, Bank Nifty, CNXIT, 3IINFOTECH, ABAN, ABB, and many others across various sectors. Metrics like lot size, open interest, support and resistance levels are provided.
Similar to Go Ahead for F&O Report 29 December 2011-Mansukh Investment and Trading Solution (20)
The document provides quarterly financial results for PNB, UCO Bank, and City Union Bank. For PNB, revenue saw a marginal increase for the quarter ended September 2013 while profit declined 52.56%. UCO Bank reported a 5.92% rise in revenue and a remarkable 285.88% increase in net profit for the quarter. City Union Bank's revenue grew 20.48% while net profit growth was modest at 4.89% for the quarter.
The revenue and profits of India Cements declined in the quarter ended September 2013 compared to the same period last year. The net loss for the quarter was Rs. 225.30 million versus a net profit of Rs. 490.80 million last year. Operating profit also decreased from Rs. 2082.30 million to Rs. 1119.00 million.
In contrast, Tech Mahindra saw significant growth in the September 2013 quarter over the corresponding period last year. Total revenue increased 175.64% to Rs. 41562.40 million. Net profit rose sharply by 298.83% to Rs. 6386.40 million. Operating profit also grew from Rs. 2352.80 million to Rs. 8989
The revenue of Indraprastha Gas zoomed 18.11% for the quarter ended September 2013 compared to the same period last year. However, the Net Profit registered a slight decline of 6.51%. Glaxo Consumer Healthcare witnessed an 18.23% growth in revenue but Net Profit grew only 14.3% for the quarter. BHEL's sales declined 14.93% for the quarter while Net Profit fell sharply by 64.22% compared to the corresponding quarter of the previous year. Operating profit also decreased for BHEL.
This document provides key support and resistance levels for various stock indexes and individual stocks along with their open interest, change in open interest, and closing price information as of November 5, 2013. It lists Nifty, Bank Nifty, CNXIT, and various individual stock futures with their lot size, open interest, change in open interest, support levels 1 and 2 (S1 and S2), resistance levels 1 and 2 (R1 and R2), and closing price on November 5.
- Nifty futures closed at 6298.80 on Tuesday, at a premium of 45.65 points over the spot closing of 6253.15. Nifty December 2013 futures ended at a premium of 92.05 points over the spot closing.
- The put call ratio for Nifty options was 1.31, indicating higher open interest in put options. The put call ratio for Bank Nifty options was 0.97.
- For the upcoming session, the market seems bullish. However, 6317 and 6343 could act as crucial resistance levels, while 6210 and 6170 may serve as near-term support levels.
- The document provides key support and resistance levels for various stocks and indices based on their open interest as of October 30, 2013, the day before expiry. It notes the change in open interest and closing price for each underlying from the previous day. Support levels 1 and 2 (S1, S2) and resistance levels 1 and 2 (R1, R2) are given.
- Open interest increased for Nifty futures but decreased for Bank Nifty and CNXIT futures. Several individual stocks saw significant decreases in open interest, including Adani Power, Hindalco, HDIL, and JSW Steel, while open interest grew for IndusInd Bank, HDFC, and Kotak Bank.
-
The Nifty futures closed at 6,255, up 0.5% from the previous day's close. Trading volumes declined across most derivative products. Put call ratios for both Nifty and Bank Nifty options were above 1, indicating greater open interest for put options. The report provides closing prices and open interest figures for various stocks. It also outlines the most actively traded call and put options, and recommends a bearish options strategy for Nifty.
This document provides key support and resistance levels for futures contracts of various stocks trading on Indian exchanges, based on their open interest and closing price on October 29, 2013. It lists over 50 stocks, along with their lot size, open interest, change in open interest from the previous day, support and resistance levels, and closing price. The expiry date for the contracts is October 31, 2013.
The document is a daily derivative report that provides the following key information:
- Nifty futures closed at 6231.10, a premium of 10.20 points over the spot closing of 6220.90. Open interest on Nifty October futures contracted by 1.3 million units to 12.82 million units.
- Several stock futures like Tata Steel, Yes Bank, DLF, and ICICI Bank traded at discounts to their spot closing prices.
- Put call ratios for Nifty and Bank Nifty options were 1.66 and 1.27 respectively, indicating higher put open interest.
- Total futures and options turnover increased 94.24% compared to the previous day, with gains
This document provides key support and resistance levels for various stock futures contracts expiring on October 31, 2013. It lists underlying stocks, their lot size, open interest, change in open interest, percentage change in open interest and closing price from October 28, 2013. It also provides support levels S1 and S2 and resistance levels R1 and R2 for each stock future contract based on technical analysis.
This document provides key support and resistance levels for various stock indexes and futures as of October 25, 2013. It lists underlying assets, their lot size, open interest, changes in open interest, support and resistance levels, and closing prices from the previous day. The expiry date for the futures contracts is October 31, 2013. It contains this information for indexes like Nifty, Bank Nifty, CNXIT and over 50 stock futures.
The document is a daily derivatives report that provides key information on the NIFTY futures market. Some of the key details included in the summary are:
- NIFTY futures closed at 6,141, down 19.45 points (0.32%) from the previous day's close.
- Total futures and options volume declined 21.02% compared to the previous day.
- The put call ratio for Nifty and Bank Nifty options was 1.45 and 1.08 respectively, indicating higher put open interest.
- Most active stock futures like DLF, ITC, Yes Bank and Tata Steel were trading at premiums between 0.25-2.90 points compared to their spot prices
- Nifty futures closed at 6177.00 on Thursday, at a premium of 12.65 points over the spot closing of 6164.35. Nifty November 2013 futures ended at 6227.05, at a premium of 62.70 points over the spot closing.
- Trading volumes increased for index futures (10.78%), index options (10.21%) and decreased for stock futures (-6.60%) and stock options (-11.76%).
- Key support and resistance levels for Nifty are seen at 6105/6032 and 6235/6280 respectively.
This document provides a summary of futures trading data for various stocks and indices for the expiry date of 31st October 2013. It lists the underlying asset, lot size, open interest, change in open interest, support and resistance levels, and closing price from 23rd October 2013. Key details include an overall increase in open interest for Nifty futures of 6.54% and Bank Nifty futures of 4.06%, while open interest decreased for CNXIT futures by 7.9%. Support and resistance levels are provided to indicate possible price movement ranges.
Nifty futures closed lower at 6,178.35 points, down 0.39% from the previous day's close. Trading volumes increased across all derivative segments. Put call ratios for both Nifty and Bank Nifty options were above 1, indicating greater open interest in put options. Most active calls and puts were seen in the 6,100-6,300 strike price range for the October 31 expiry. The report provides an outlook for Nifty, noting key resistance and support levels. It also includes a sample options strategy for Nifty and a tracker of previous strategies.
Nifty futures closed lower at 6,178.35 points, down 0.39% from the previous day's close. Trading volumes increased across all derivative segments. Put call ratios for both Nifty and Bank Nifty options indicate a bearish sentiment. Most active calls and puts were seen in the 6,100-6,300 strike prices for the October 31 expiry. The report provides an outlook for Nifty, noting key resistance and support levels. It also includes the most and least active stocks by change in open interest. Strategies tracked show profits booked from positions in Nifty futures and options.
This document provides key support and resistance levels for various stock indexes and futures as of October 22, 2013. It lists underlying assets, their lot sizes, open interest levels and changes, and support and resistance price levels. The expiry date for futures contracts is October 31, 2013. Overall, open interest increased for many indexes and stocks compared to the previous day.
- The document provides key support and resistance levels for various stocks and indices in the futures and options market. It lists the underlying, lot size, open interest, change in open interest, closing price and support and resistance levels for each stock.
- The highest changes in open interest were seen in Federal Bank (44.72%), IDFC (10.08%), and Cairn India (10.99%) while the largest falls were in HDFCBank (-2.22%) and LIC Housing Finance (-1.49%).
- The expiry date for the futures and options contracts is 31st October 2013.
- The Nifty futures closed at 6236.00 on Monday, a premium of 31.05 points over the spot closing of 6,204.95.
- Put call ratios for Nifty and Bank Nifty options were 1.59 and 1.06 respectively, indicating higher put open interest.
- Total futures and options turnover decreased by 17.43% on Monday compared to the previous day, with index options seeing the largest fall of 19.52%.
More from Mansukh Investment & Trading Solutions (20)
At Techbox Square, in Singapore, we're not just creative web designers and developers, we're the driving force behind your brand identity. Contact us today.
Company Valuation webinar series - Tuesday, 4 June 2024FelixPerez547899
This session provided an update as to the latest valuation data in the UK and then delved into a discussion on the upcoming election and the impacts on valuation. We finished, as always with a Q&A
Anny Serafina Love - Letter of Recommendation by Kellen Harkins, MS.AnnySerafinaLove
This letter, written by Kellen Harkins, Course Director at Full Sail University, commends Anny Love's exemplary performance in the Video Sharing Platforms class. It highlights her dedication, willingness to challenge herself, and exceptional skills in production, editing, and marketing across various video platforms like YouTube, TikTok, and Instagram.
The APCO Geopolitical Radar - Q3 2024 The Global Operating Environment for Bu...APCO
The Radar reflects input from APCO’s teams located around the world. It distils a host of interconnected events and trends into insights to inform operational and strategic decisions. Issues covered in this edition include:
Building Your Employer Brand with Social MediaLuanWise
Presented at The Global HR Summit, 6th June 2024
In this keynote, Luan Wise will provide invaluable insights to elevate your employer brand on social media platforms including LinkedIn, Facebook, Instagram, X (formerly Twitter) and TikTok. You'll learn how compelling content can authentically showcase your company culture, values, and employee experiences to support your talent acquisition and retention objectives. Additionally, you'll understand the power of employee advocacy to amplify reach and engagement – helping to position your organization as an employer of choice in today's competitive talent landscape.
Event Report - SAP Sapphire 2024 Orlando - lots of innovation and old challengesHolger Mueller
Holger Mueller of Constellation Research shares his key takeaways from SAP's Sapphire confernece, held in Orlando, June 3rd till 5th 2024, in the Orange Convention Center.
Zodiac Signs and Food Preferences_ What Your Sign Says About Your Tastemy Pandit
Know what your zodiac sign says about your taste in food! Explore how the 12 zodiac signs influence your culinary preferences with insights from MyPandit. Dive into astrology and flavors!
How to Implement a Strategy: Transform Your Strategy with BSC Designer's Comp...Aleksey Savkin
The Strategy Implementation System offers a structured approach to translating stakeholder needs into actionable strategies using high-level and low-level scorecards. It involves stakeholder analysis, strategy decomposition, adoption of strategic frameworks like Balanced Scorecard or OKR, and alignment of goals, initiatives, and KPIs.
Key Components:
- Stakeholder Analysis
- Strategy Decomposition
- Adoption of Business Frameworks
- Goal Setting
- Initiatives and Action Plans
- KPIs and Performance Metrics
- Learning and Adaptation
- Alignment and Cascading of Scorecards
Benefits:
- Systematic strategy formulation and execution.
- Framework flexibility and automation.
- Enhanced alignment and strategic focus across the organization.
How to Implement a Real Estate CRM SoftwareSalesTown
To implement a CRM for real estate, set clear goals, choose a CRM with key real estate features, and customize it to your needs. Migrate your data, train your team, and use automation to save time. Monitor performance, ensure data security, and use the CRM to enhance marketing. Regularly check its effectiveness to improve your business.
IMPACT Silver is a pure silver zinc producer with over $260 million in revenue since 2008 and a large 100% owned 210km Mexico land package - 2024 catalysts includes new 14% grade zinc Plomosas mine and 20,000m of fully funded exploration drilling.
[To download this presentation, visit:
https://www.oeconsulting.com.sg/training-presentations]
This PowerPoint compilation offers a comprehensive overview of 20 leading innovation management frameworks and methodologies, selected for their broad applicability across various industries and organizational contexts. These frameworks are valuable resources for a wide range of users, including business professionals, educators, and consultants.
Each framework is presented with visually engaging diagrams and templates, ensuring the content is both informative and appealing. While this compilation is thorough, please note that the slides are intended as supplementary resources and may not be sufficient for standalone instructional purposes.
This compilation is ideal for anyone looking to enhance their understanding of innovation management and drive meaningful change within their organization. Whether you aim to improve product development processes, enhance customer experiences, or drive digital transformation, these frameworks offer valuable insights and tools to help you achieve your goals.
INCLUDED FRAMEWORKS/MODELS:
1. Stanford’s Design Thinking
2. IDEO’s Human-Centered Design
3. Strategyzer’s Business Model Innovation
4. Lean Startup Methodology
5. Agile Innovation Framework
6. Doblin’s Ten Types of Innovation
7. McKinsey’s Three Horizons of Growth
8. Customer Journey Map
9. Christensen’s Disruptive Innovation Theory
10. Blue Ocean Strategy
11. Strategyn’s Jobs-To-Be-Done (JTBD) Framework with Job Map
12. Design Sprint Framework
13. The Double Diamond
14. Lean Six Sigma DMAIC
15. TRIZ Problem-Solving Framework
16. Edward de Bono’s Six Thinking Hats
17. Stage-Gate Model
18. Toyota’s Six Steps of Kaizen
19. Microsoft’s Digital Transformation Framework
20. Design for Six Sigma (DFSS)
To download this presentation, visit:
https://www.oeconsulting.com.sg/training-presentations
3 Simple Steps To Buy Verified Payoneer Account In 2024SEOSMMEARTH
Buy Verified Payoneer Account: Quick and Secure Way to Receive Payments
Buy Verified Payoneer Account With 100% secure documents, [ USA, UK, CA ]. Are you looking for a reliable and safe way to receive payments online? Then you need buy verified Payoneer account ! Payoneer is a global payment platform that allows businesses and individuals to send and receive money in over 200 countries.
If You Want To More Information just Contact Now:
Skype: SEOSMMEARTH
Telegram: @seosmmearth
Gmail: seosmmearth@gmail.com
Industrial Tech SW: Category Renewal and CreationChristian Dahlen
Every industrial revolution has created a new set of categories and a new set of players.
Multiple new technologies have emerged, but Samsara and C3.ai are only two companies which have gone public so far.
Manufacturing startups constitute the largest pipeline share of unicorns and IPO candidates in the SF Bay Area, and software startups dominate in Germany.
6. F&O Key Supp/Ress
make more, for sure.
NAME DESIGNATION E-MAIL
Varun Gupta Head - Research varungupta@moneysukh.com
Pashupati Nath Jha Research Analyst pashupatinathjha@moneysukh.com
Vikram Singh Research Analyst vikram_research@moneysukh.com
This report is for the personal information of the authorized recipient and does not construe to be any investment, legal or taxation advice to you.
Mansukh Securities and Finance Ltd (hereinafter referred as MSFL) is not soliciting any action based on it. This report is not for public distribution and
has been furnished to you solely for your information and should not be reproduced or redistributed to any person in any form.
The report is based upon information that we consider reliable, but we do not represent that it is accurate or complete. MSFL or any of its affiliates or
employees shall not be in any way responsible for any loss or damage that may arise to any person from any inadvertent error in the information
contained in this report. MSFL or any of its affiliates or employees do not provide, at any time, any express or implied warranty of any kind, regarding
any matter pertaining to this report, including without limitation the implied warranties of merchantability, fitness for a particular purpose, and non-
infringement. The recipients of this report should rely on their own investigations.
MSFL and/or its affiliates and/or employees may have interests/positions, financial or otherwise in the securities mentioned in this report. This
information is subject to change without any prior notice. MSFL reserves the right to make modifications and alterations to this statement as may be
required from time to time. Nevertheless, MSFL is committed to providing independent and transparent recommendations to its clients, and would be
happy to provide information in response to specific client queries.
Please refer to important disclosures at the end of this report For Private circulation Only For Our Clients Only
Mansukh Securities and Finance Ltd SEBI Regn No. BSE: INB010985834 / NSE: INB230781431
Office: 306, Pratap Bhavan, 5, Bahadur Shah Zafar Marg, New Delhi-110002 PMS Regn No. INP000002387
Phone: 011-30123450/1/3/5 Fax: 011-30117710 Email: research@moneysukh.com
Website: www.moneysukh.com