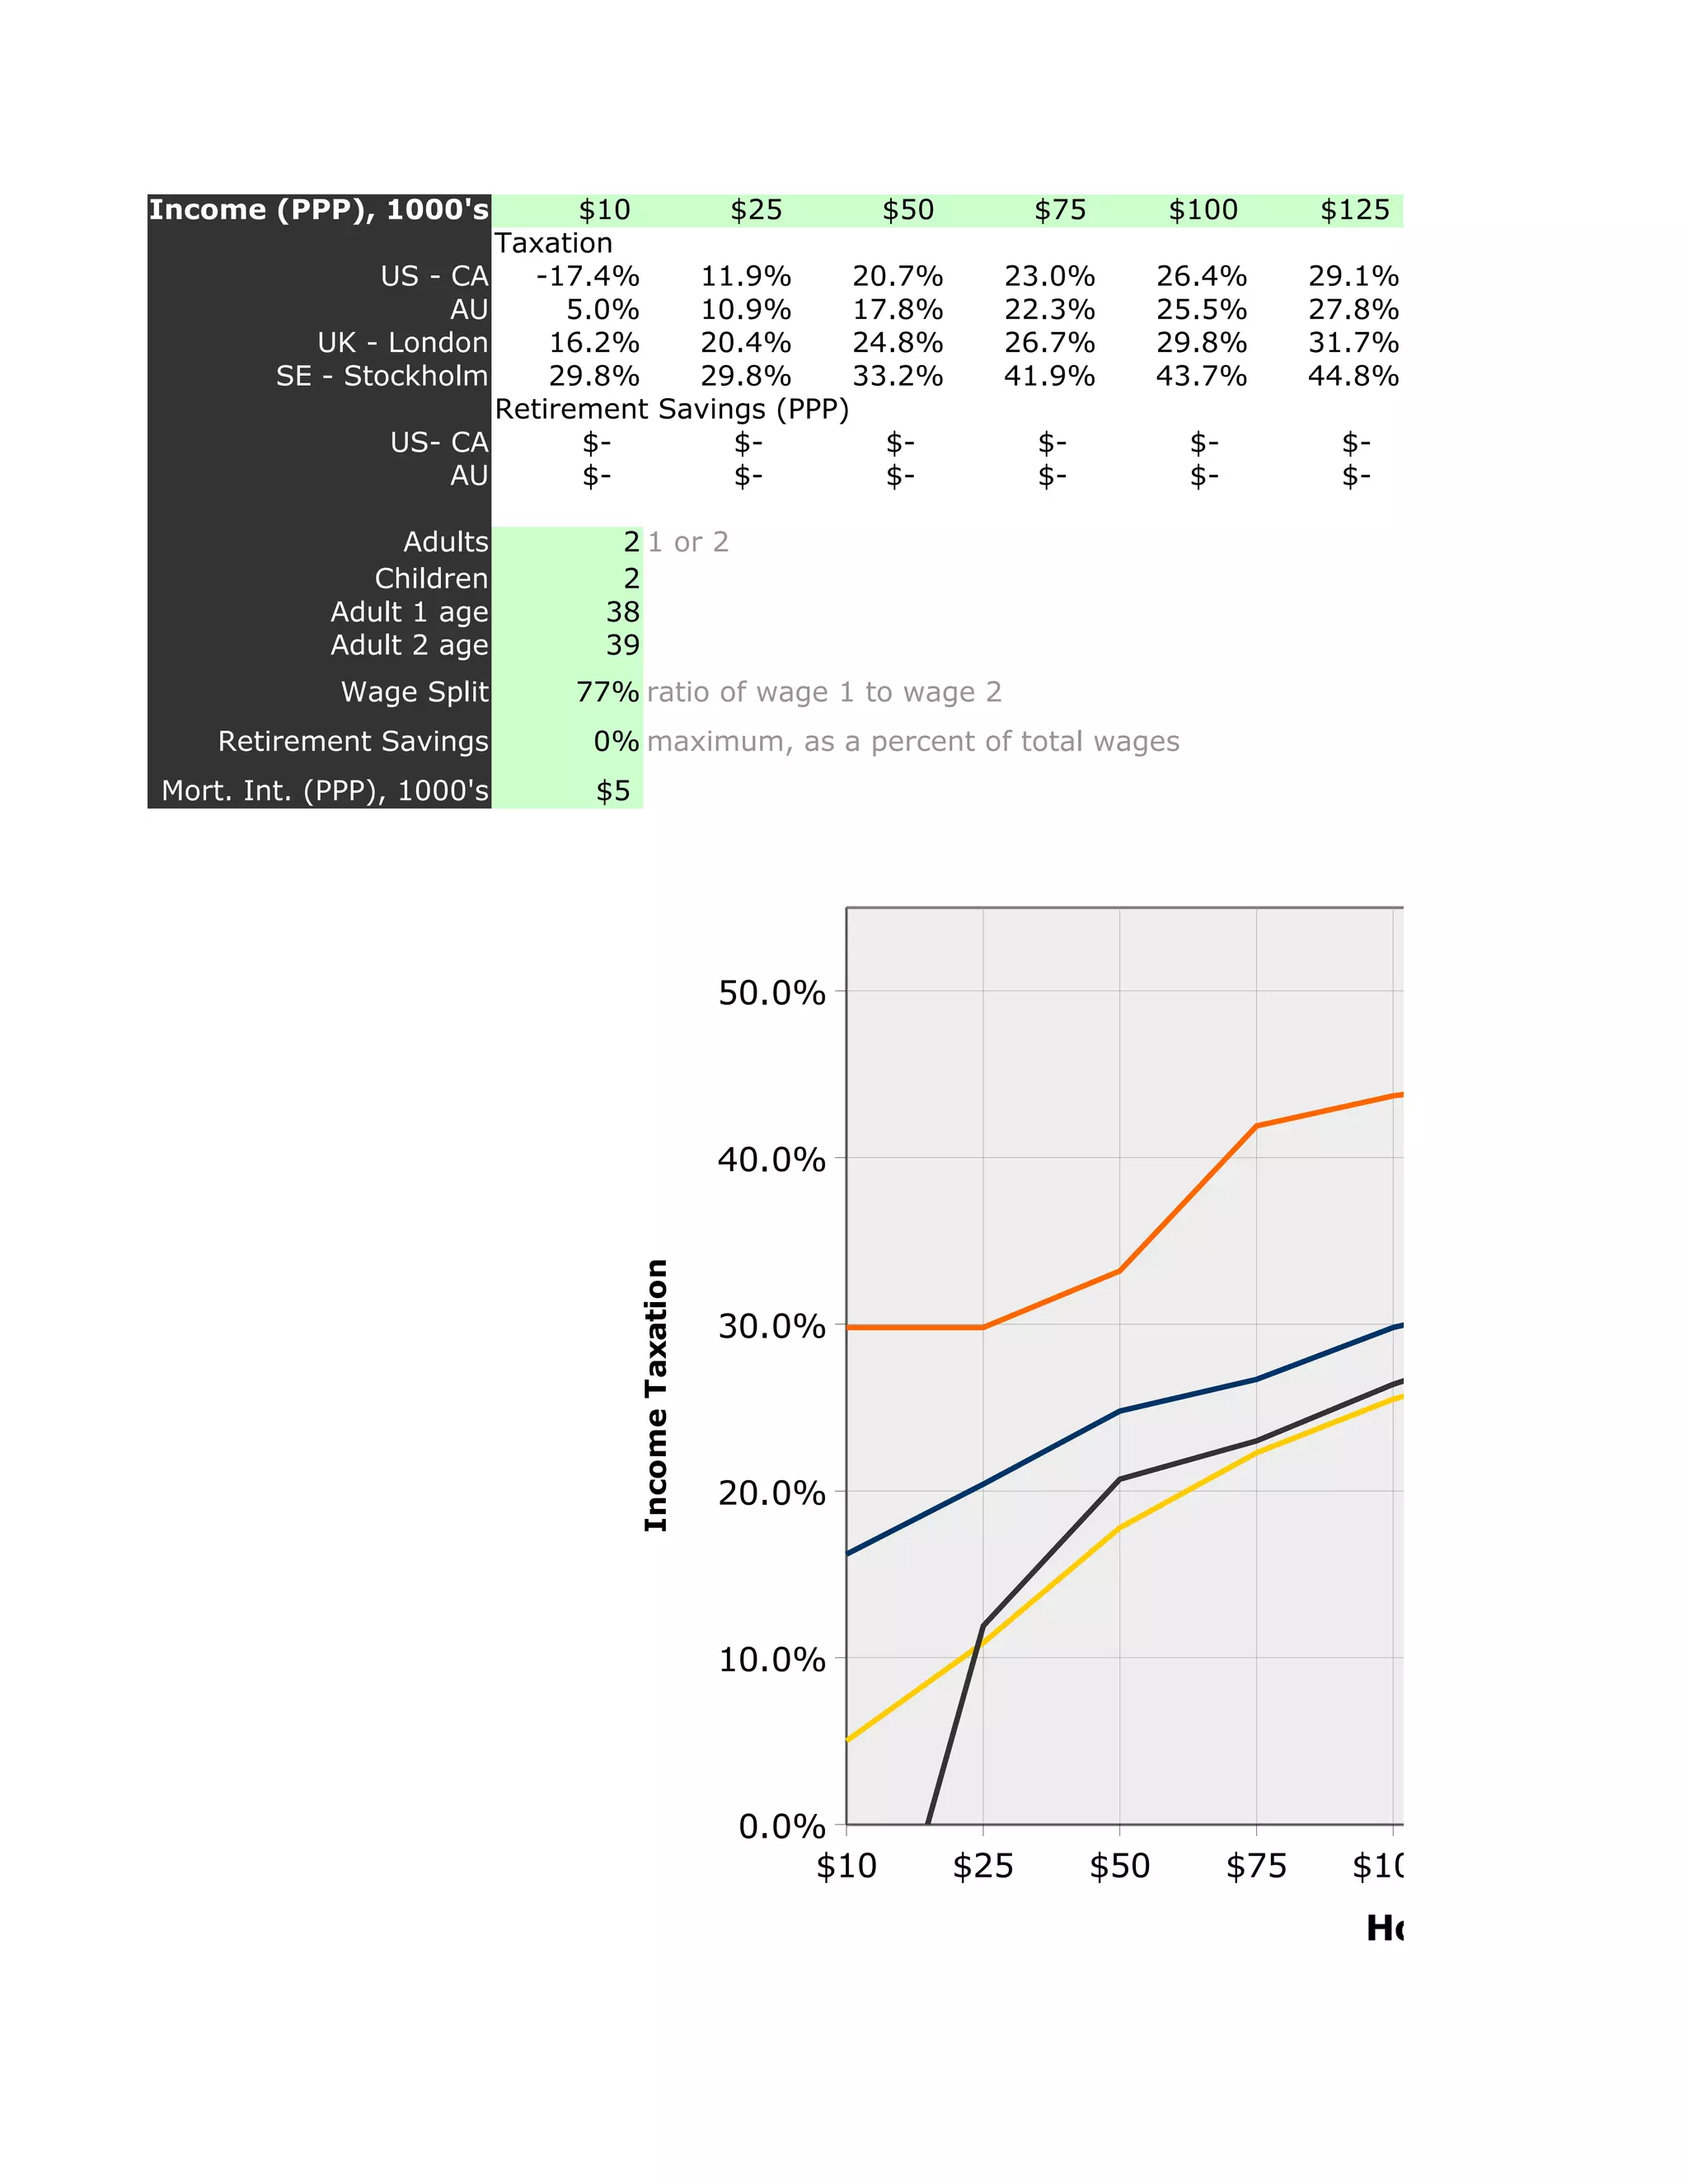
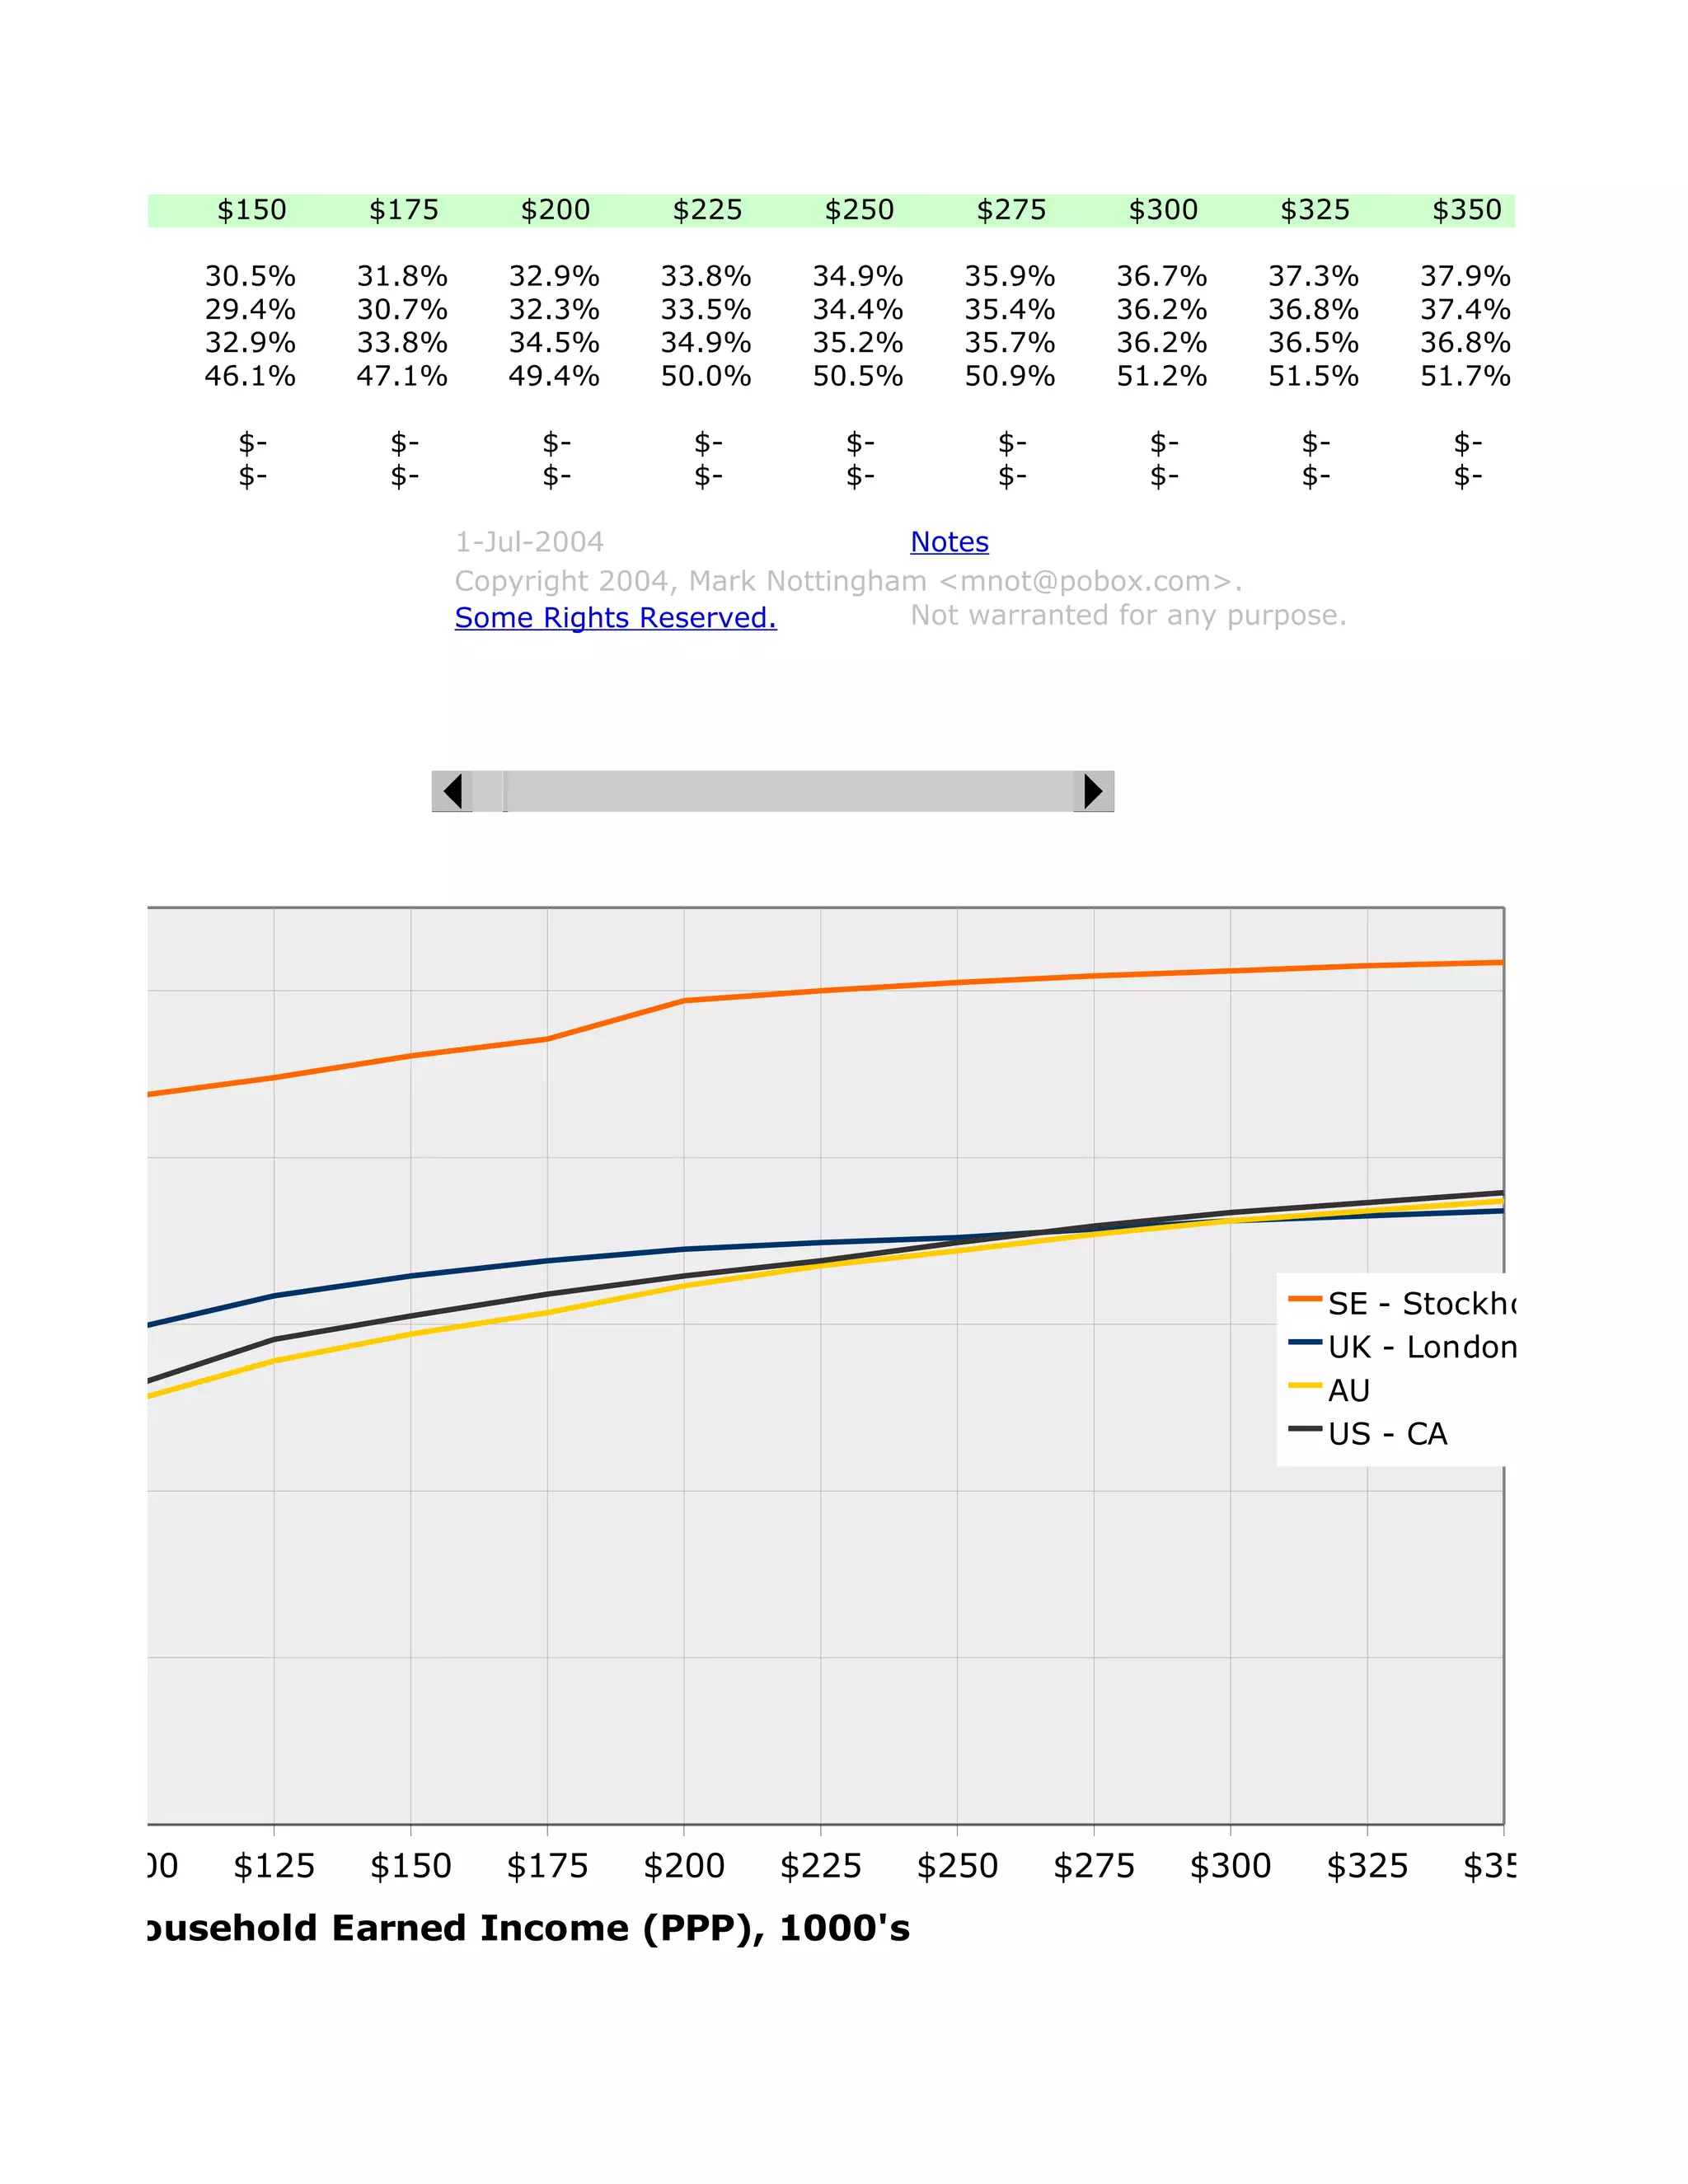
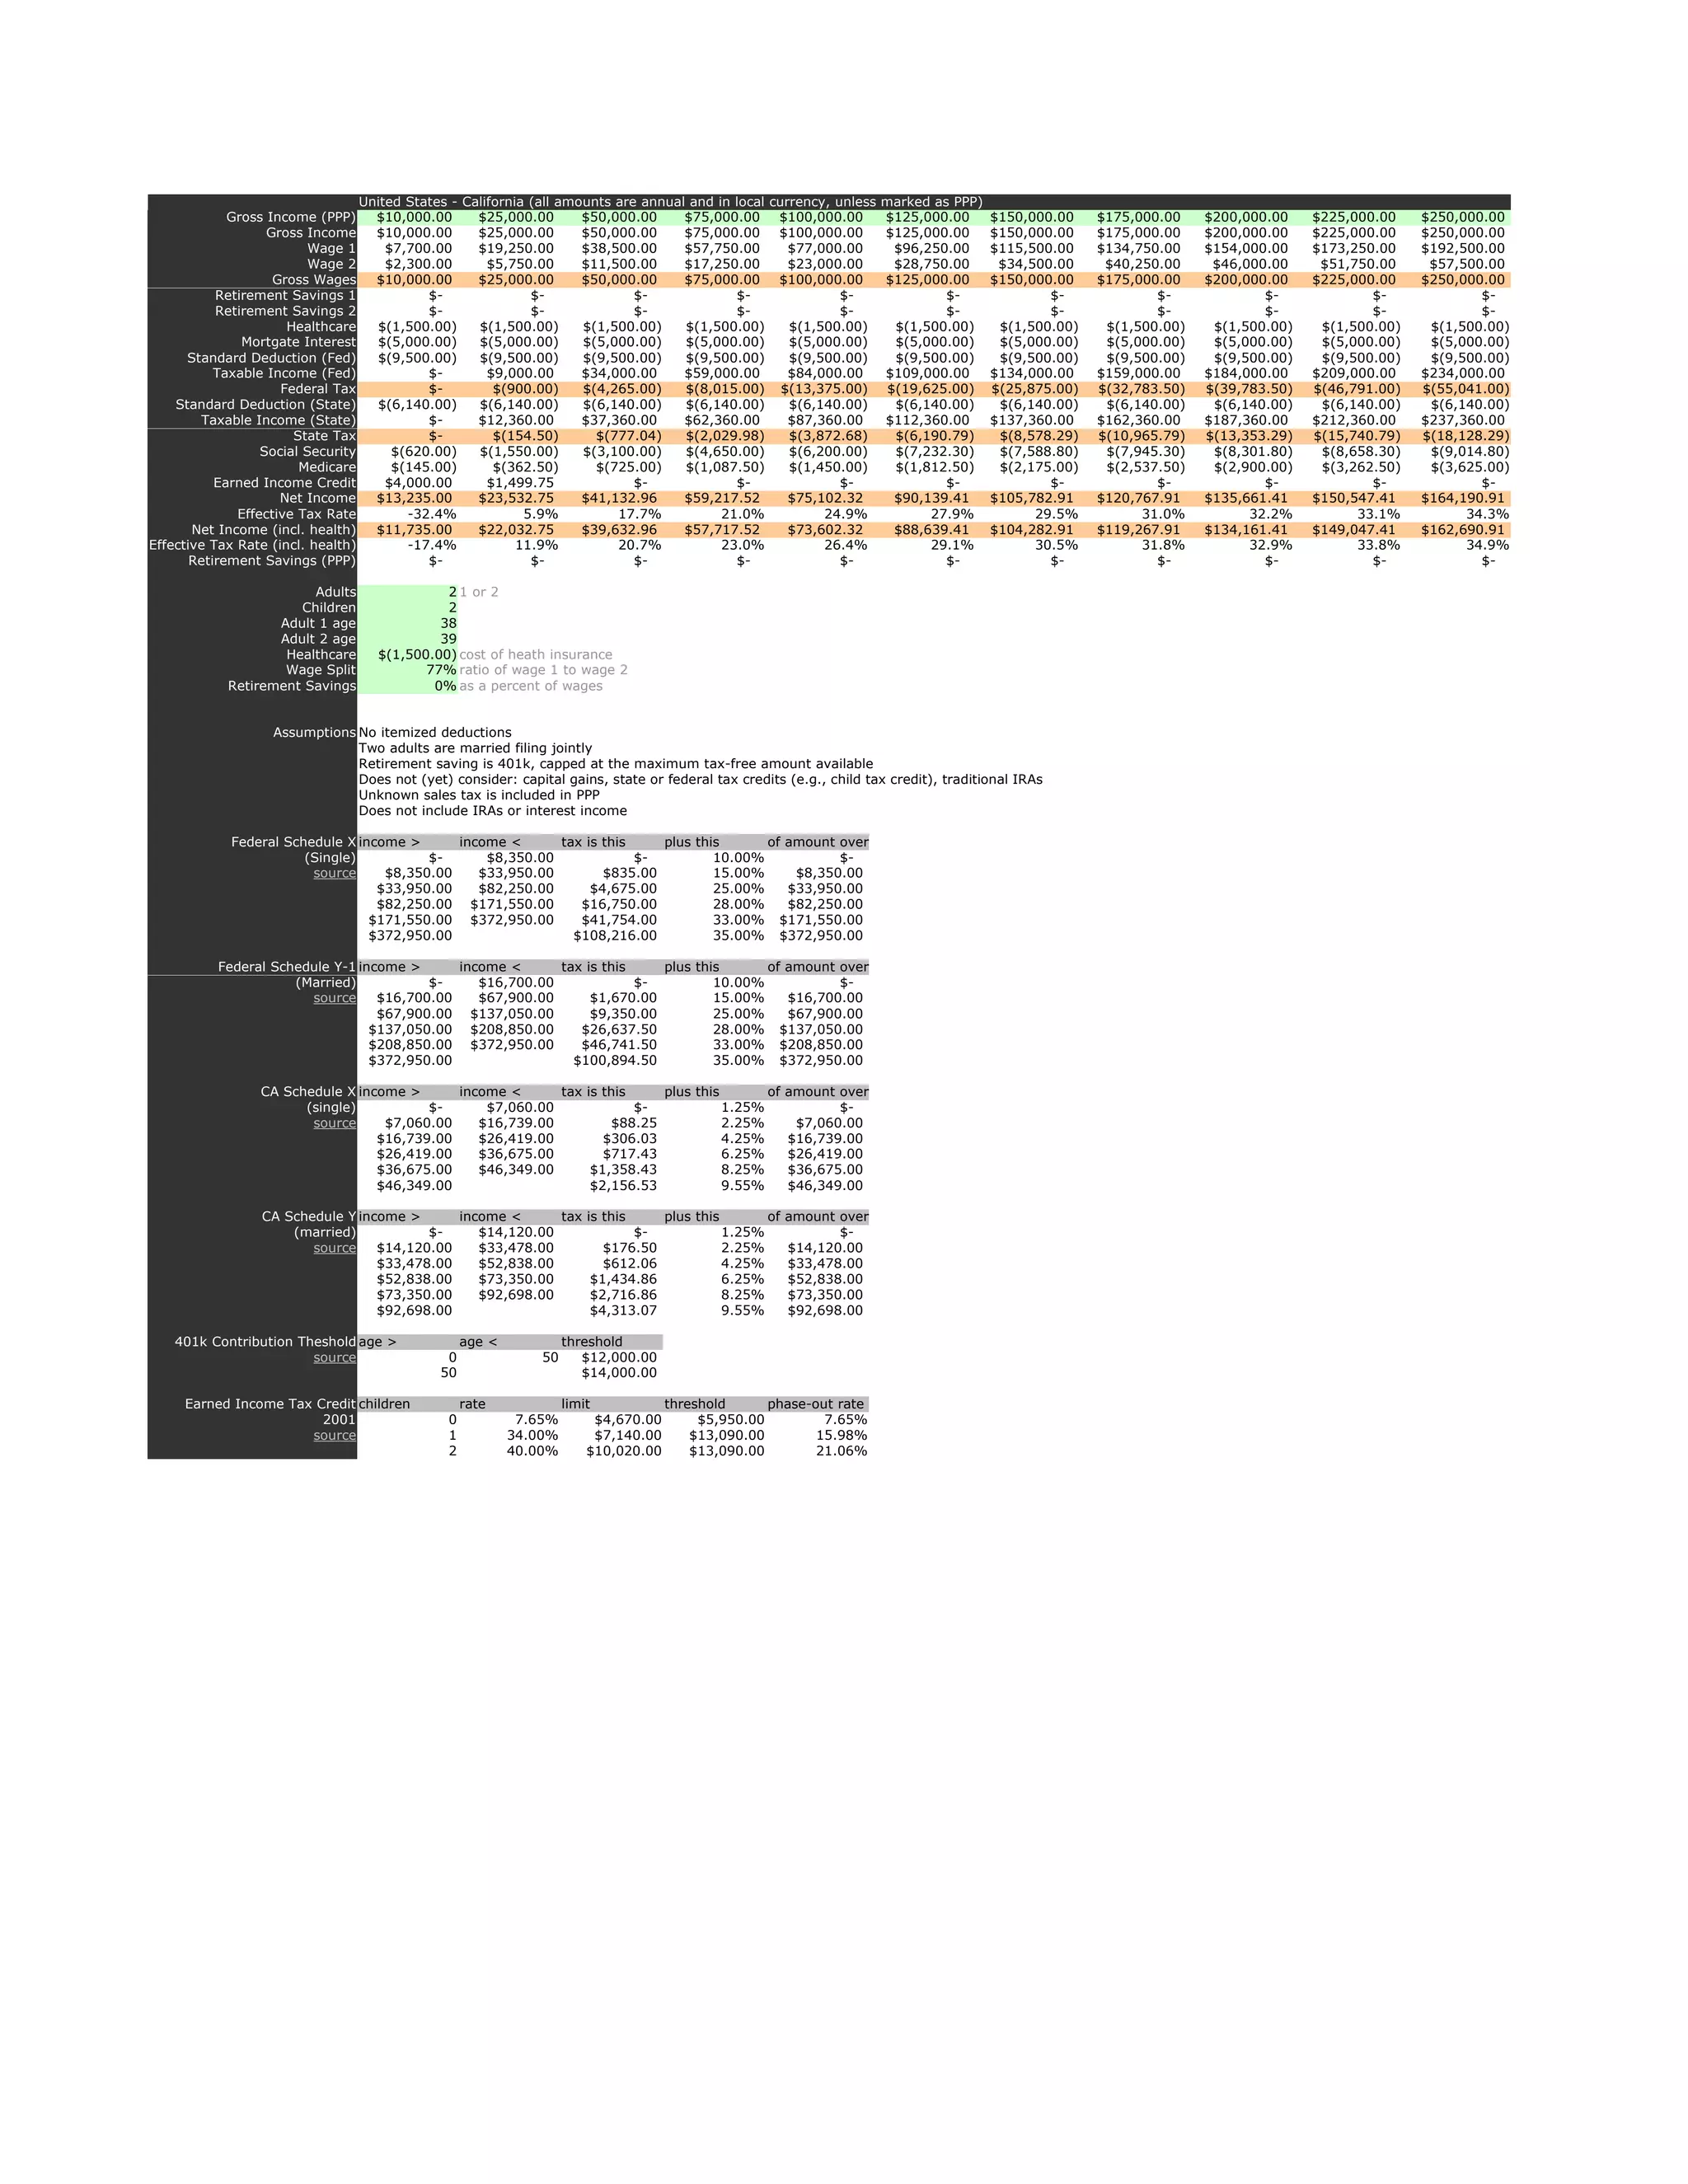
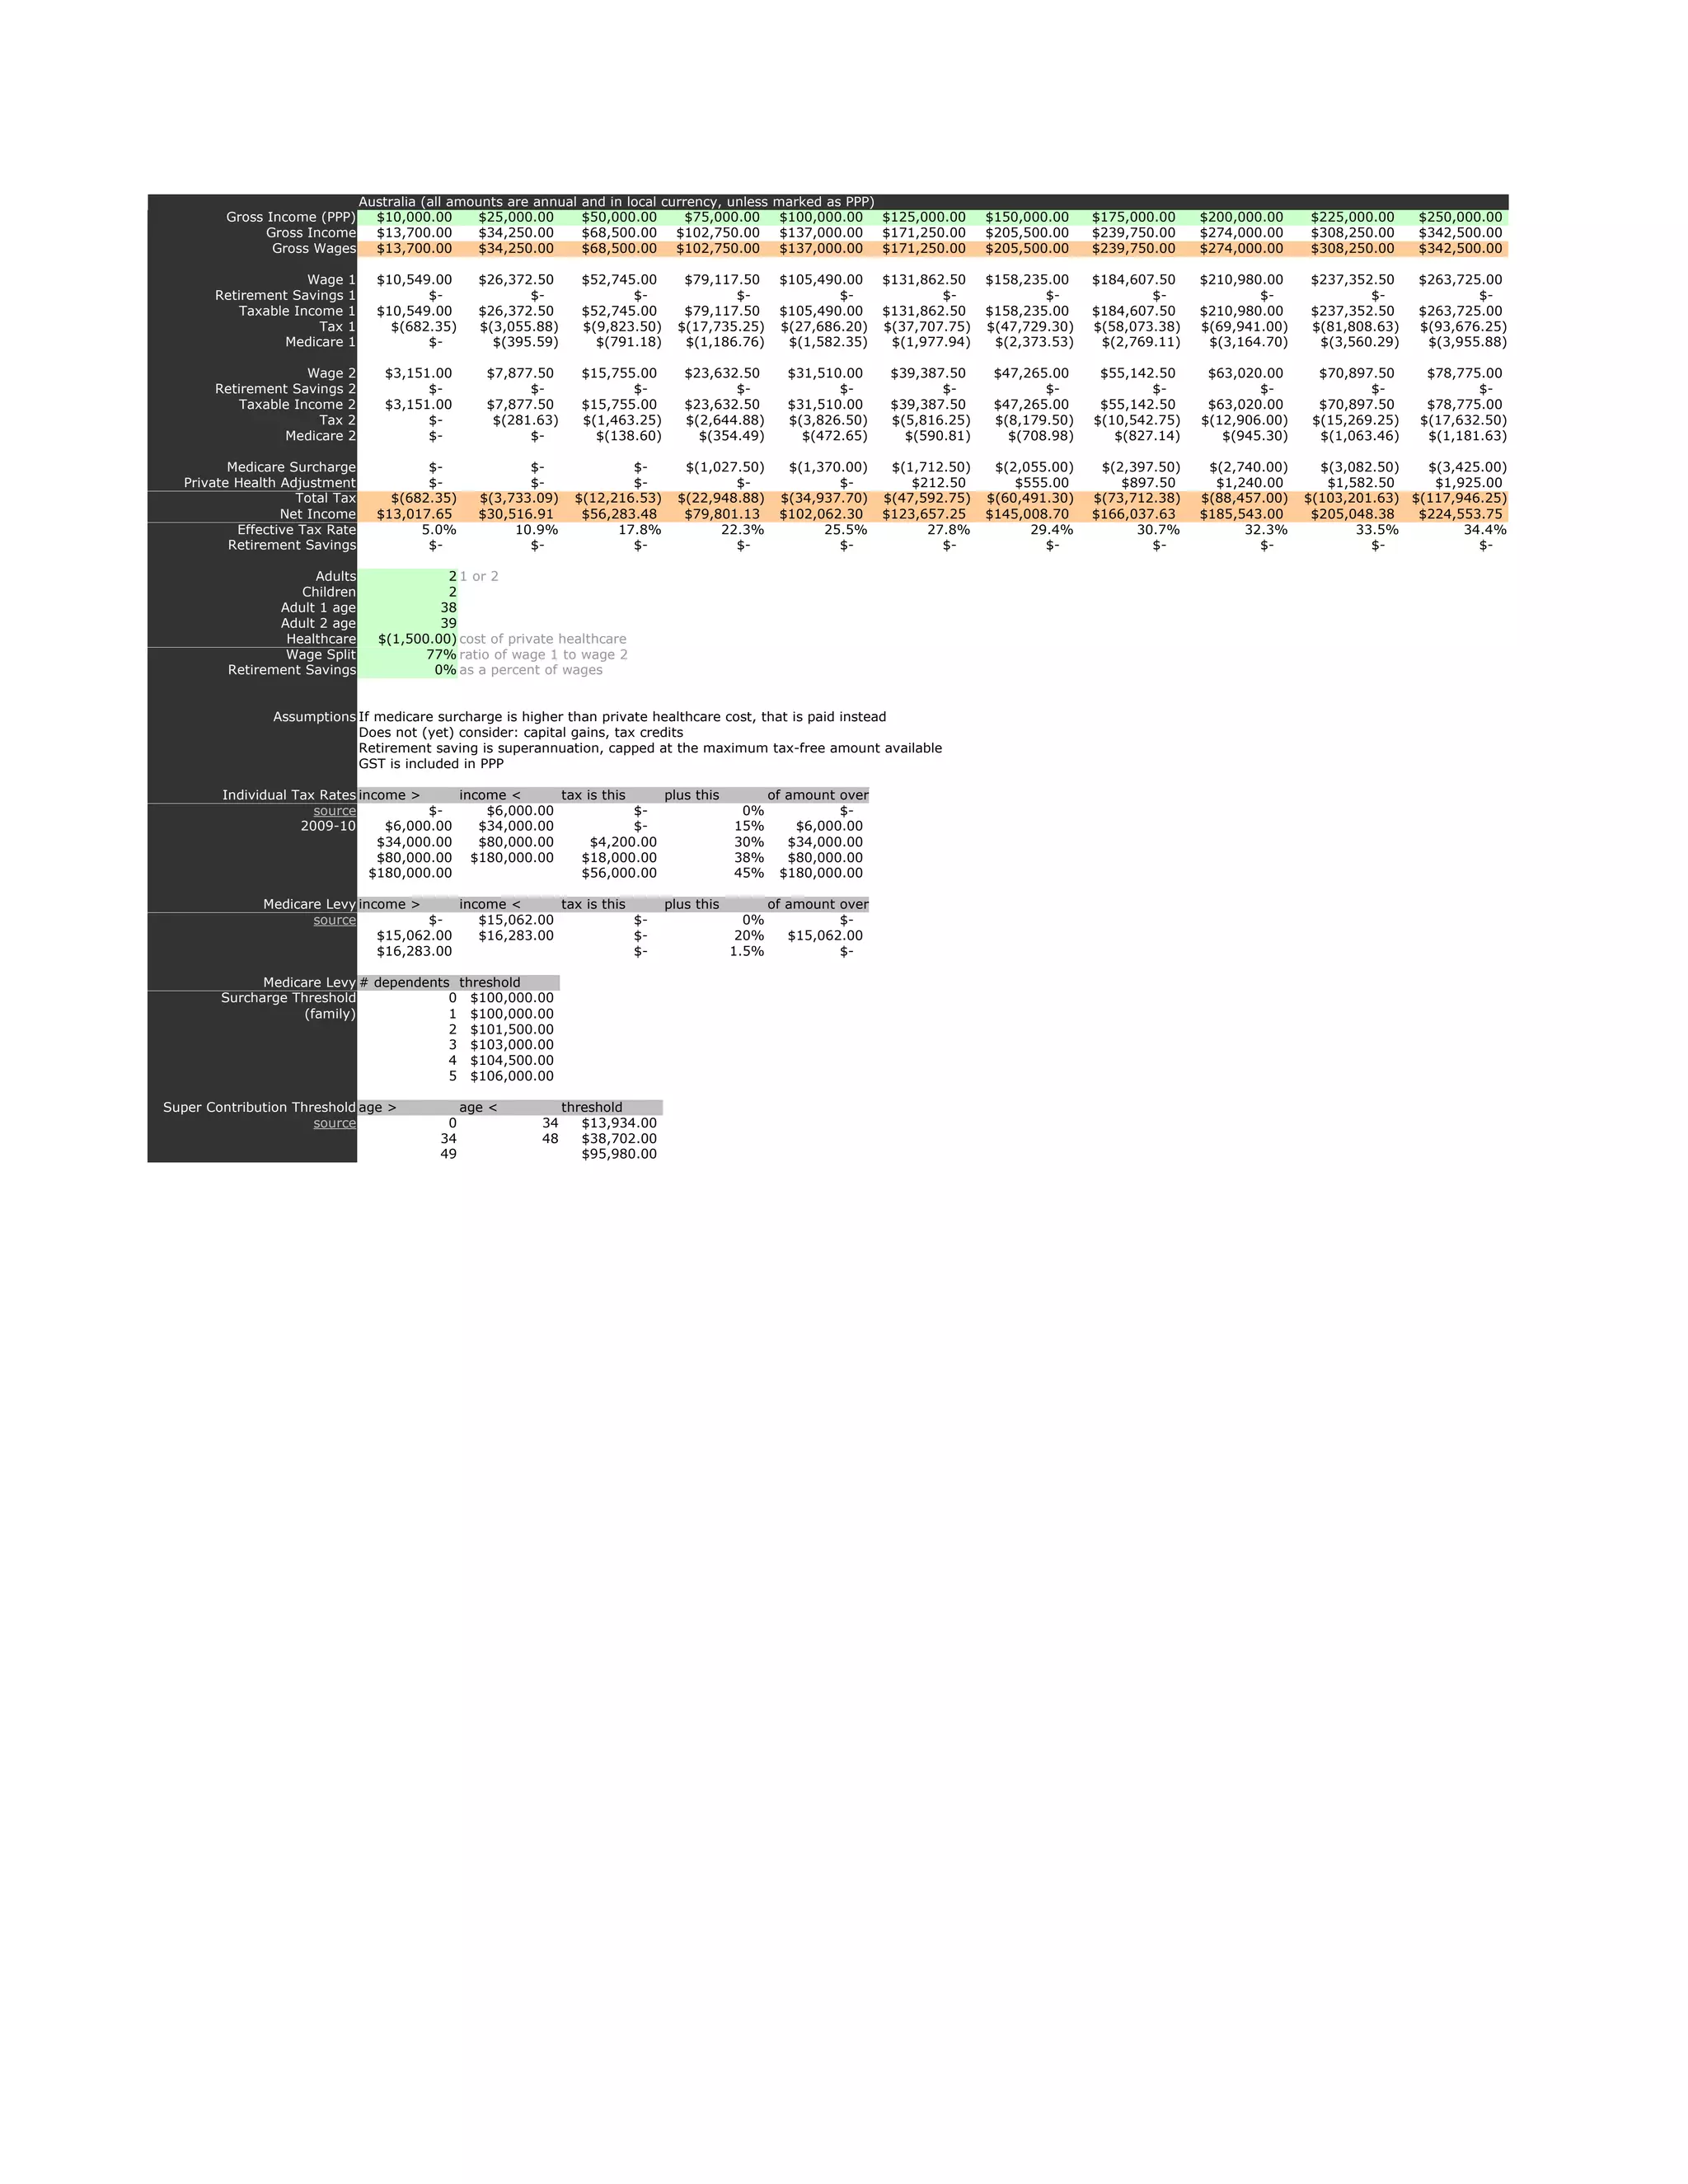
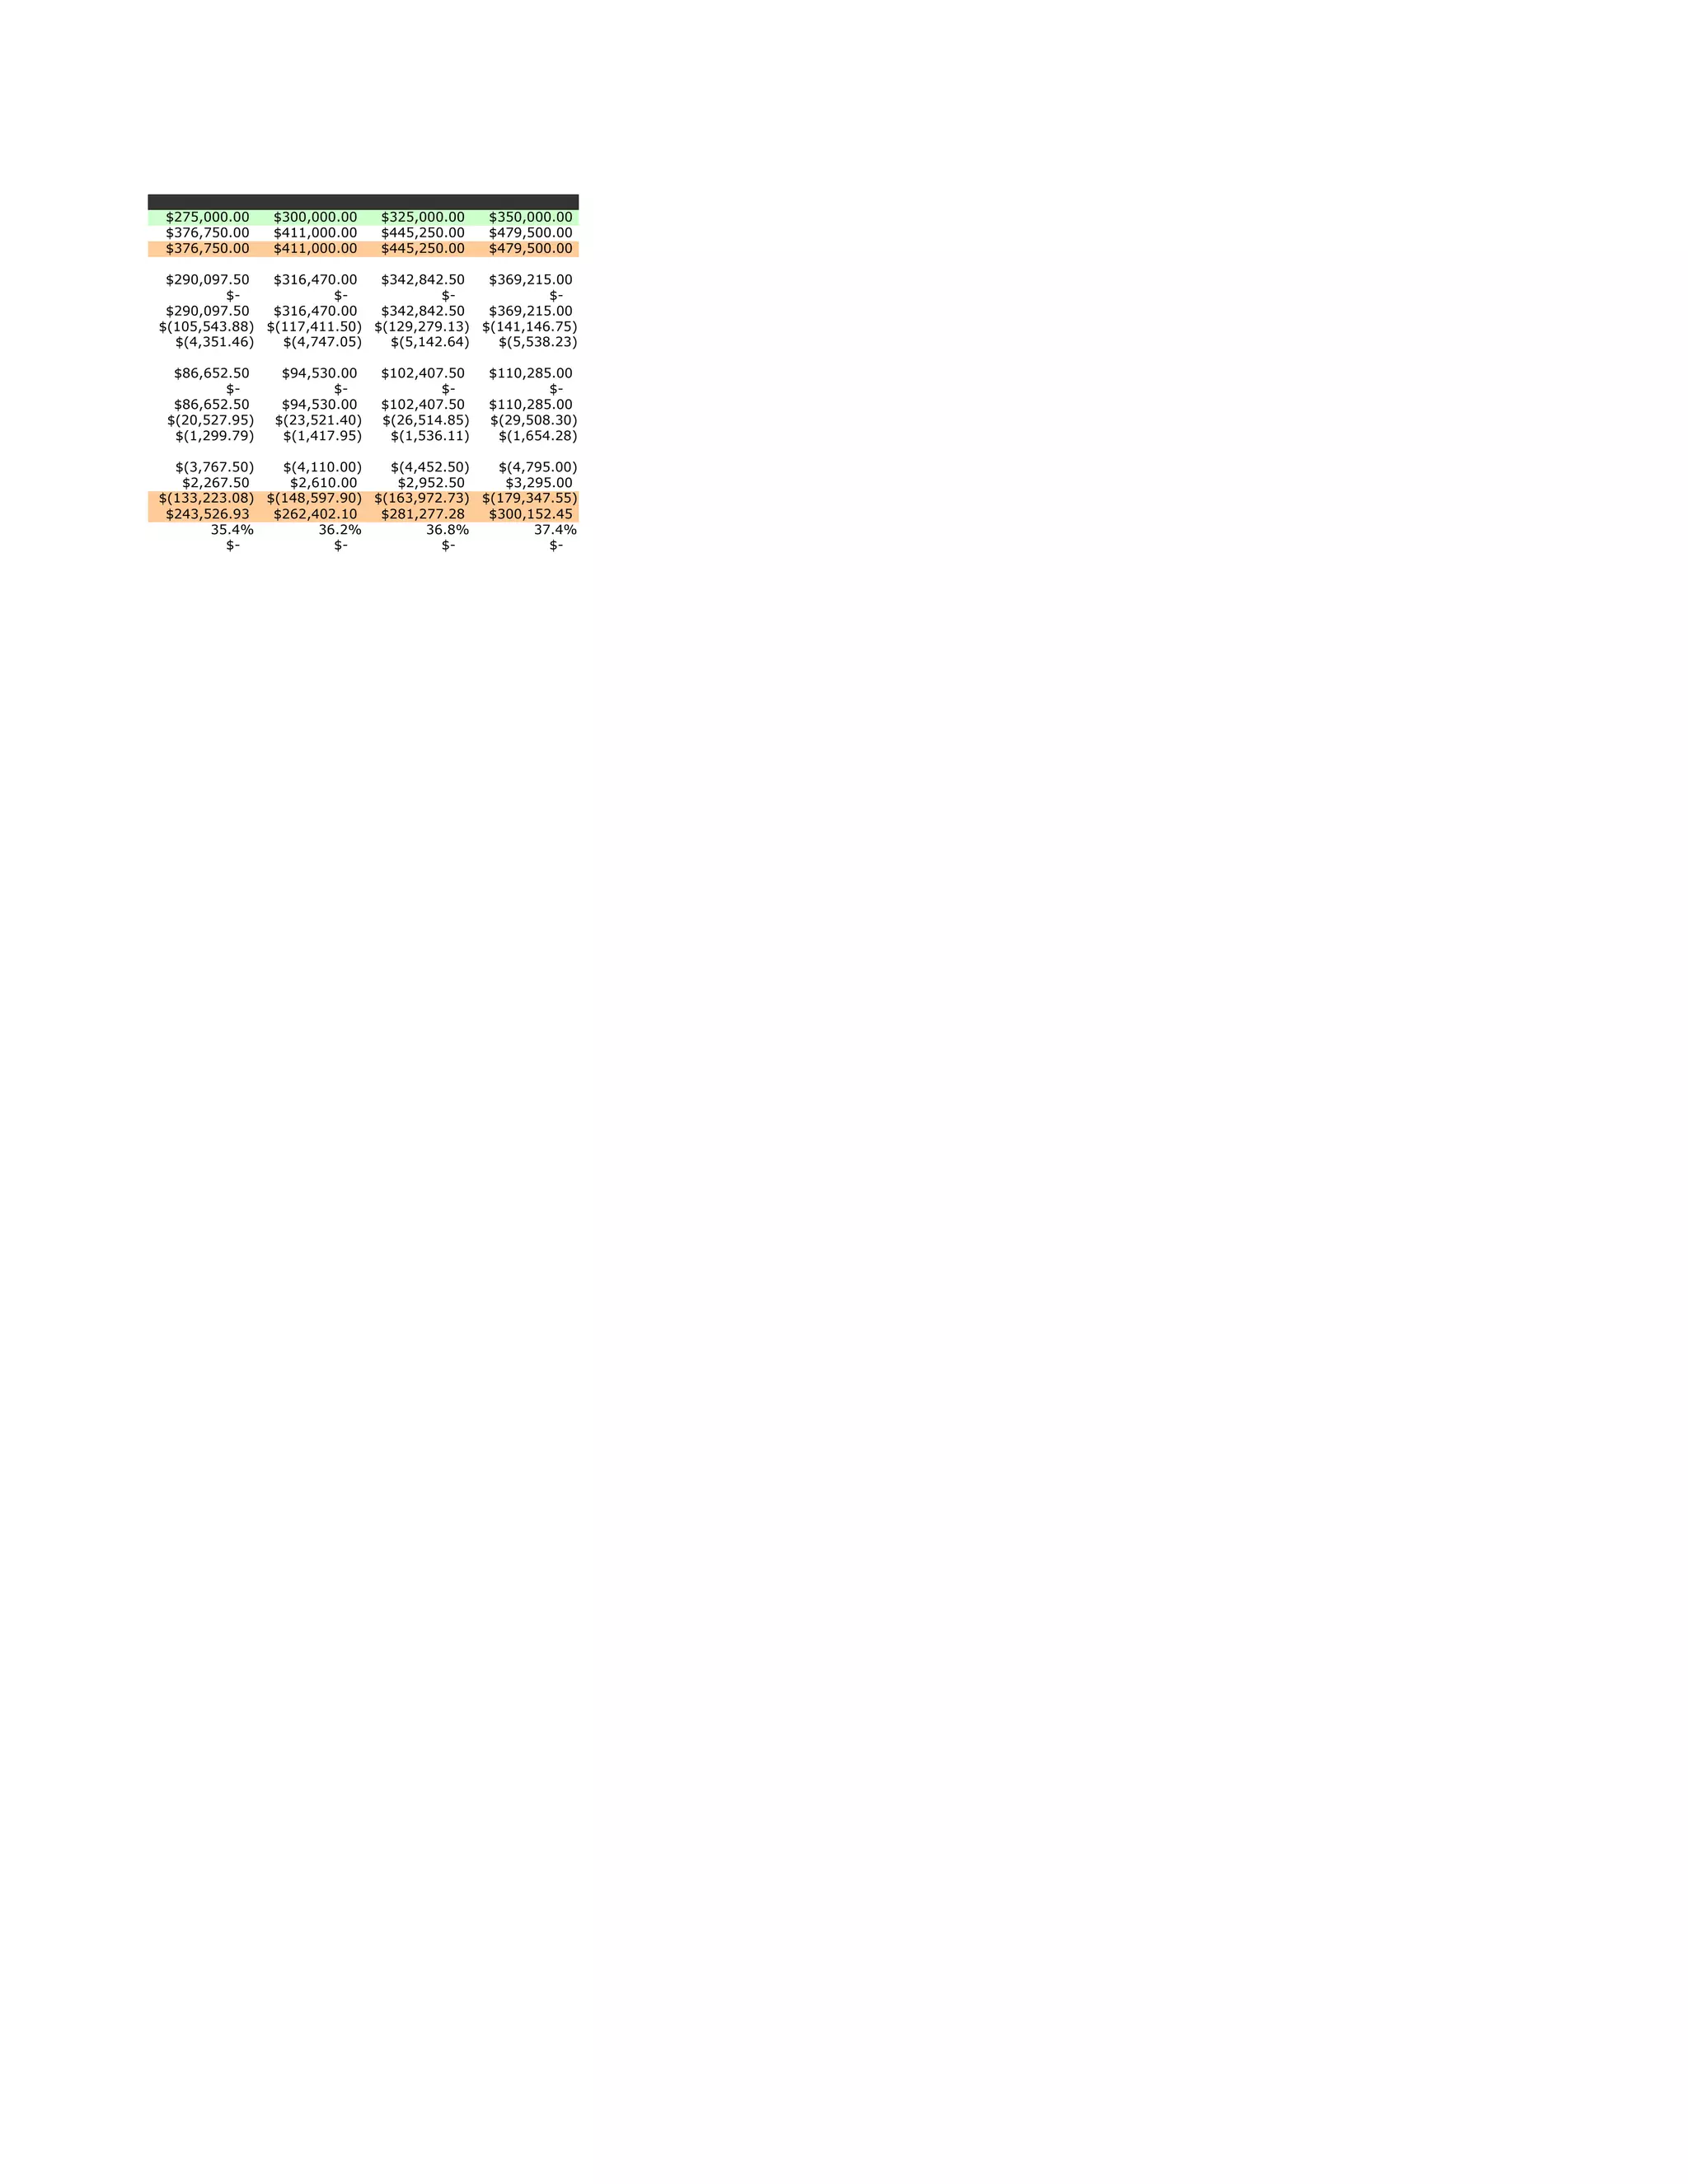
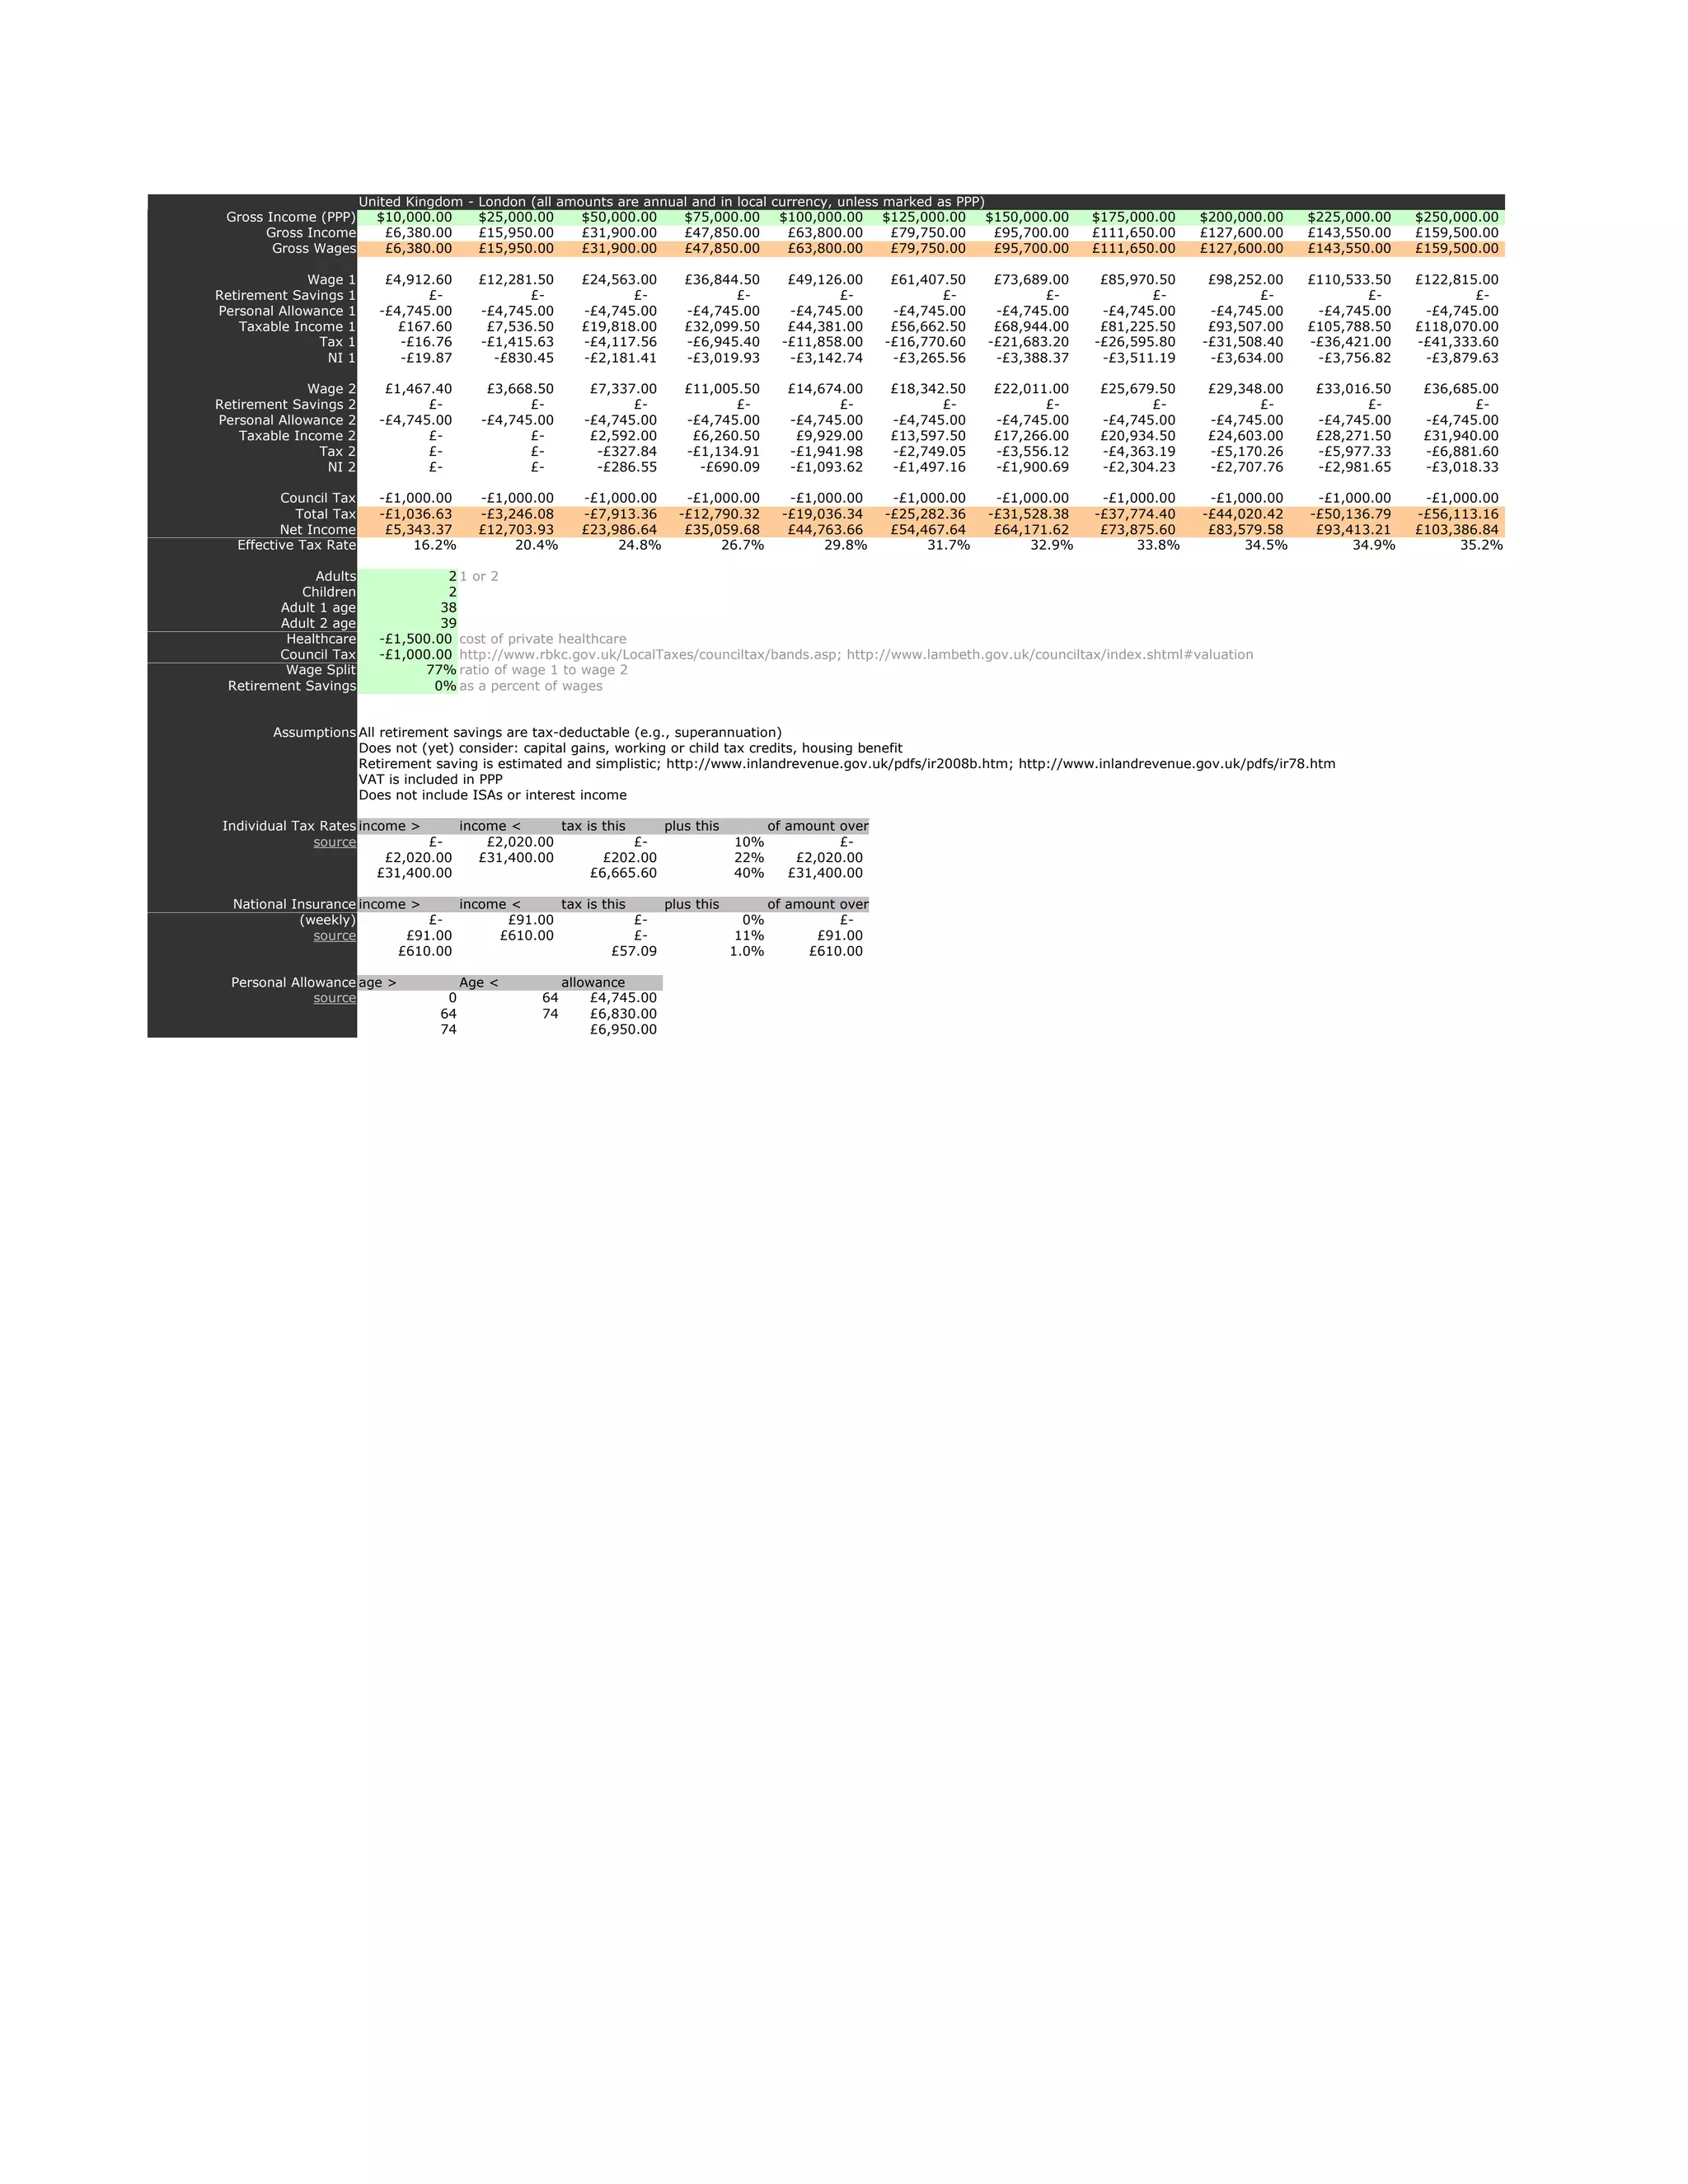
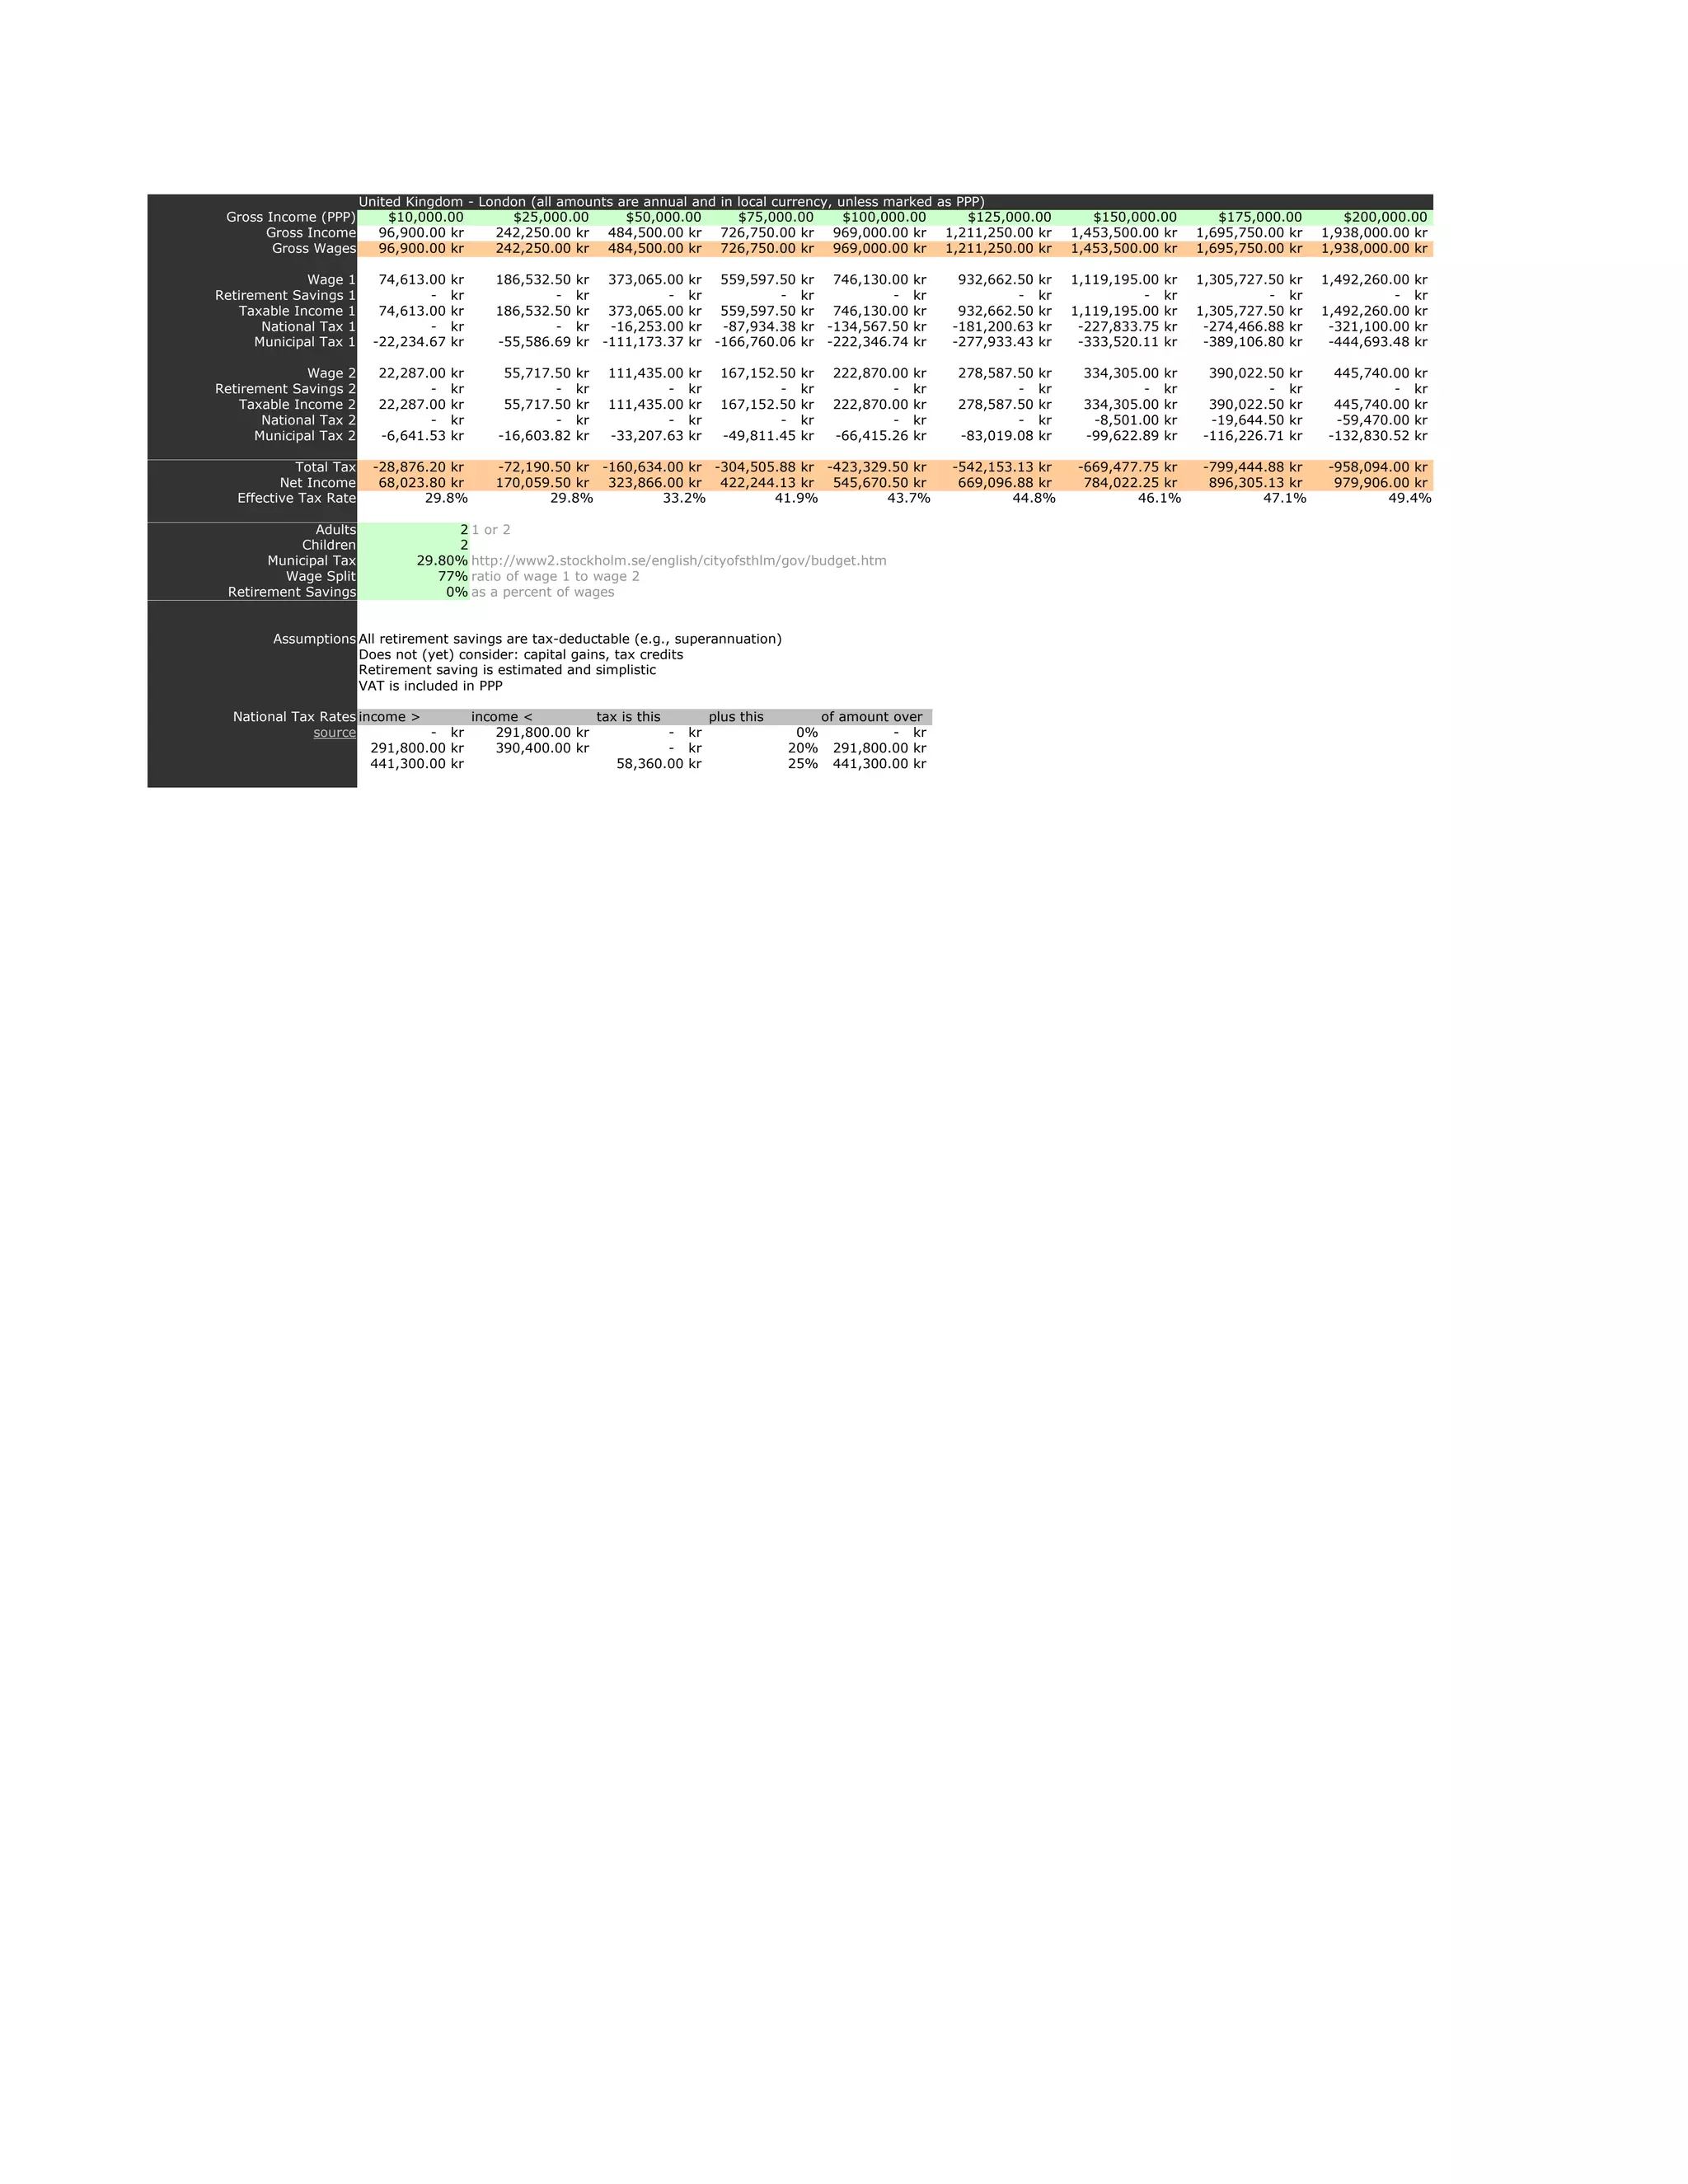
SlideShare a Scribd company logo
Income (PPP), 1000's         $10       $25        $50               $75         $100        $125
                       Taxation
               US - CA    -17.4%    11.9%       20.7%           23.0%           26.4%       29.1%
                    AU      5.0%    10.9%       17.8%           22.3%           25.5%       27.8%
           UK - London     16.2%    20.4%       24.8%           26.7%           29.8%       31.7%
        SE - Stockholm     29.8%    29.8%       33.2%           41.9%           43.7%       44.8%
                       Retirement Savings (PPP)
                US- CA       $-        $-         $-                $-           $-          $-
                    AU       $-        $-         $-                $-           $-          $-

                 Adults        2 1 or 2
              Children         2
            Adult 1 age       38
            Adult 2 age       39
             Wage Split     77% ratio of wage 1 to wage 2
    Retirement Savings       0% maximum, as a percent of total wages
Mort. Int. (PPP), 1000's     $5


                                                    50.0%


                                                    40.0%
                                  Income Taxation


                                                    30.0%


                                                    20.0%


                                                    10.0%


                                                    0.0%
                                                        $10   $25         $50         $75     $100   $125   $150
                                                                                               Household Earne
$1

                                          $1


Tax-Free Retirement Contributions (PPP)
                                          $1

                                          $1

                                          $1

                                          $1

                                          $0

                                          $0

                                          $0

                                          $0

                                          $-
                                               $10   $25   $50   $75   $100   $125   $150   $17
                                                                        Household Earned Inc
$150    $175        $200      $225      $250       $275      $300            $325     $350

            30.5%   31.8%      32.9%     33.8%      34.9%     35.9%      36.7%       37.3%        37.9%
            29.4%   30.7%      32.3%     33.5%      34.4%     35.4%      36.2%       36.8%        37.4%
            32.9%   33.8%      34.5%     34.9%      35.2%     35.7%      36.2%       36.5%        36.8%
            46.1%   47.1%      49.4%     50.0%      50.5%     50.9%      51.2%       51.5%        51.7%

             $-      $-          $-         $-        $-        $-           $-           $-       $-
             $-      $-          $-         $-        $-        $-           $-           $-       $-

                            1-Jul-2004                    Notes
                            Copyright 2004, Mark Nottingham <mnot@pobox.com>.
                            Some Rights Reserved.         Not warranted for any purpose.

                                                                   77
                                                                     0


                                                                                           SE - Stockholm
                                                                                           UK - London
                                                                                           AU
                                                                                           US - CA


75   $100    $125   $150       $175     $200     $225       $250      $275        $300     $325     $350
     Household Earned Income (PPP), 1000's
AU
                                                                     US- CA


100   $125   $150   $175   $200   $225   $250   $275   $300   $325   $350
Household Earned Income (PPP), 1000's
E - Stockholm
K - London
U
S - CA


325   $350
United States - California (all amounts are annual and in local currency, unless   marked as PPP)
             Gross Income (PPP)       $10,000.00      $25,000.00       $50,000.00     $75,000.00 $100,000.00           $125,000.00      $150,000.00    $175,000.00    $200,000.00    $225,000.00    $250,000.00
                   Gross Income       $10,000.00      $25,000.00       $50,000.00     $75,000.00 $100,000.00           $125,000.00      $150,000.00    $175,000.00    $200,000.00    $225,000.00    $250,000.00
                         Wage 1         $7,700.00     $19,250.00       $38,500.00     $57,750.00       $77,000.00        $96,250.00     $115,500.00    $134,750.00    $154,000.00    $173,250.00    $192,500.00
                         Wage 2         $2,300.00       $5,750.00      $11,500.00     $17,250.00       $23,000.00        $28,750.00      $34,500.00     $40,250.00     $46,000.00     $51,750.00     $57,500.00
                    Gross Wages       $10,000.00      $25,000.00       $50,000.00     $75,000.00 $100,000.00           $125,000.00      $150,000.00    $175,000.00    $200,000.00    $225,000.00    $250,000.00
           Retirement Savings 1               $-               $-              $-             $-               $-               $-              $-             $-             $-             $-             $-
           Retirement Savings 2               $-               $-              $-             $-               $-               $-              $-             $-             $-             $-             $-
                      Healthcare      $(1,500.00)     $(1,500.00)      $(1,500.00)    $(1,500.00)      $(1,500.00)       $(1,500.00)     $(1,500.00)    $(1,500.00)    $(1,500.00)    $(1,500.00)    $(1,500.00)
               Mortgate Interest      $(5,000.00)     $(5,000.00)      $(5,000.00)    $(5,000.00)      $(5,000.00)       $(5,000.00)     $(5,000.00)    $(5,000.00)    $(5,000.00)    $(5,000.00)    $(5,000.00)
      Standard Deduction (Fed)        $(9,500.00)     $(9,500.00)      $(9,500.00)    $(9,500.00)      $(9,500.00)       $(9,500.00)     $(9,500.00)    $(9,500.00)    $(9,500.00)    $(9,500.00)    $(9,500.00)
           Taxable Income (Fed)               $-        $9,000.00      $34,000.00     $59,000.00       $84,000.00      $109,000.00      $134,000.00    $159,000.00    $184,000.00    $209,000.00    $234,000.00
                     Federal Tax              $-         $(900.00)     $(4,265.00)    $(8,015.00) $(13,375.00)          $(19,625.00)    $(25,875.00)   $(32,783.50)   $(39,783.50)   $(46,791.00)   $(55,041.00)
    Standard Deduction (State)        $(6,140.00)     $(6,140.00)      $(6,140.00)    $(6,140.00)      $(6,140.00)       $(6,140.00)     $(6,140.00)    $(6,140.00)    $(6,140.00)    $(6,140.00)    $(6,140.00)
         Taxable Income (State)               $-      $12,360.00       $37,360.00     $62,360.00       $87,360.00      $112,360.00      $137,360.00    $162,360.00    $187,360.00    $212,360.00    $237,360.00
                       State Tax              $-         $(154.50)       $(777.04)    $(2,029.98)      $(3,872.68)       $(6,190.79)     $(8,578.29)   $(10,965.79)   $(13,353.29)   $(15,740.79)   $(18,128.29)
                  Social Security        $(620.00)    $(1,550.00)      $(3,100.00)    $(4,650.00)      $(6,200.00)       $(7,232.30)     $(7,588.80)    $(7,945.30)    $(8,301.80)    $(8,658.30)    $(9,014.80)
                        Medicare         $(145.00)       $(362.50)       $(725.00)    $(1,087.50)      $(1,450.00)       $(1,812.50)     $(2,175.00)    $(2,537.50)    $(2,900.00)    $(3,262.50)    $(3,625.00)
           Earned Income Credit         $4,000.00       $1,499.75              $-             $-               $-               $-              $-             $-             $-             $-             $-
                     Net Income       $13,235.00      $23,532.75       $41,132.96     $59,217.52       $75,102.32        $90,139.41     $105,782.91    $120,767.91    $135,661.41    $150,547.41    $164,190.91
              Effective Tax Rate           -32.4%             5.9%          17.7%           21.0%           24.9%             27.9%           29.5%          31.0%          32.2%          33.1%          34.3%
       Net Income (incl. health)      $11,735.00      $22,032.75       $39,632.96     $57,717.52       $73,602.32        $88,639.41     $104,282.91    $119,267.91    $134,161.41    $149,047.41    $162,690.91
Effective Tax Rate (incl. health)          -17.4%            11.9%          20.7%           23.0%           26.4%             29.1%           30.5%          31.8%          32.9%          33.8%          34.9%
       Retirement Savings (PPP)               $-               $-              $-             $-               $-               $-              $-             $-             $-             $-             $-

                        Adults                  2 1 or 2
                      Children                  2
                   Adult 1 age                 38
                   Adult 2 age                 39
                    Healthcare        $(1,500.00) cost of heath insurance
                    Wage Split               77% ratio of wage 1 to wage 2
            Retirement Savings                0% as a percent of wages


                   Assumptions No itemized deductions
                               Two adults are married filing jointly
                               Retirement saving is 401k, capped at the maximum tax-free amount available
                               Does not (yet) consider: capital gains, state or federal tax credits (e.g., child tax credit), traditional IRAs
                               Unknown sales tax is included in PPP
                               Does not include IRAs or interest income

             Federal Schedule X income >      income <      tax is this    plus this      of amount over
                        (Single)          $-      $8,350.00             $-         10.00%           $-
                         source     $8,350.00    $33,950.00        $835.00         15.00%     $8,350.00
                                   $33,950.00    $82,250.00      $4,675.00         25.00%    $33,950.00
                                   $82,250.00 $171,550.00      $16,750.00          28.00%    $82,250.00
                                  $171,550.00 $372,950.00      $41,754.00          33.00% $171,550.00
                                  $372,950.00                 $108,216.00          35.00% $372,950.00

           Federal Schedule Y-1 income >      income <      tax is this    plus this      of amount over
                      (Married)           $-     $16,700.00             $-         10.00%           $-
                        source     $16,700.00    $67,900.00      $1,670.00         15.00%    $16,700.00
                                   $67,900.00 $137,050.00        $9,350.00         25.00%    $67,900.00
                                  $137,050.00 $208,850.00      $26,637.50          28.00% $137,050.00
                                  $208,850.00 $372,950.00      $46,741.50          33.00% $208,850.00
                                  $372,950.00                 $100,894.50          35.00% $372,950.00

                 CA Schedule X income >      income <      tax is this    plus this       of            amount over
                       (single)          $-      $7,060.00             $-           1.25%                      $-
                        source     $7,060.00    $16,739.00         $88.25           2.25%                $7,060.00
                                  $16,739.00    $26,419.00        $306.03           4.25%               $16,739.00
                                  $26,419.00    $36,675.00        $717.43           6.25%               $26,419.00
                                  $36,675.00    $46,349.00      $1,358.43           8.25%               $36,675.00
                                  $46,349.00                    $2,156.53           9.55%               $46,349.00

                 CA Schedule Y income >      income <      tax is this    plus this       of            amount over
                     (married)           $-     $14,120.00             $-           1.25%                      $-
                        source    $14,120.00    $33,478.00        $176.50           2.25%               $14,120.00
                                  $33,478.00    $52,838.00        $612.06           4.25%               $33,478.00
                                  $52,838.00    $73,350.00      $1,434.86           6.25%               $52,838.00
                                  $73,350.00    $92,698.00      $2,716.86           8.25%               $73,350.00
                                  $92,698.00                    $4,313.07           9.55%               $92,698.00

    401k Contribution Theshold age >                 age <            threshold
                        source                   0               50      $12,000.00
                                                50                       $14,000.00

     Earned Income Tax Credit children               rate             limit            threshold      phase-out rate
                        2001                     0            7.65%        $4,670.00        $5,950.00         7.65%
                      source                     1           34.00%        $7,140.00       $13,090.00        15.98%
                                                 2           40.00%       $10,020.00       $13,090.00        21.06%
$275,000.00    $300,000.00    $325,000.00    $350,000.00
$275,000.00    $300,000.00    $325,000.00    $350,000.00
$211,750.00    $231,000.00    $250,250.00    $269,500.00
 $63,250.00     $69,000.00     $74,750.00     $80,500.00
$275,000.00    $300,000.00    $325,000.00    $350,000.00
        $-             $-             $-             $-
        $-             $-             $-             $-
 $(1,500.00)    $(1,500.00)    $(1,500.00)    $(1,500.00)
 $(5,000.00)    $(5,000.00)    $(5,000.00)    $(5,000.00)
 $(9,500.00)    $(9,500.00)    $(9,500.00)    $(9,500.00)
$259,000.00    $284,000.00    $309,000.00    $334,000.00
$(63,291.00)   $(71,541.00)   $(79,791.00)   $(88,041.00)
 $(6,140.00)    $(6,140.00)    $(6,140.00)    $(6,140.00)
$262,360.00    $287,360.00    $312,360.00    $337,360.00
$(20,515.79)   $(22,903.29)   $(25,290.79)   $(27,678.29)
 $(9,371.30)    $(9,727.80)   $(10,084.30)   $(10,440.80)
 $(3,987.50)    $(4,350.00)    $(4,712.50)    $(5,075.00)
        $-             $-             $-             $-
$177,834.41    $191,477.91    $205,121.41    $218,764.91
      35.3%          36.2%          36.9%          37.5%
$176,334.41    $189,977.91    $203,621.41    $217,264.91
      35.9%          36.7%          37.3%          37.9%
        $-             $-             $-             $-
Source


http://www.irs.gov/formspubs/article/0,,id=109877,00.html
http://www.ftb.ca.gov/individuals/faq/net/902.html


http://www.ssa.gov/OACT/COLA/cbb.html#Series
Working Wife


0,.25,.5


             Page 10
Australia (all amounts are annual   and in local currency, unless    marked as PPP)
         Gross Income (PPP)        $10,000.00      $25,000.00        $50,000.00       $75,000.00       $100,000.00 $125,000.00        $150,000.00    $175,000.00    $200,000.00    $225,000.00     $250,000.00
               Gross Income        $13,700.00      $34,250.00        $68,500.00 $102,750.00            $137,000.00 $171,250.00        $205,500.00    $239,750.00    $274,000.00    $308,250.00     $342,500.00
                Gross Wages        $13,700.00      $34,250.00        $68,500.00 $102,750.00            $137,000.00 $171,250.00        $205,500.00    $239,750.00    $274,000.00    $308,250.00     $342,500.00

                     Wage    1     $10,549.00       $26,372.50       $52,745.00       $79,117.50       $105,490.00     $131,862.50    $158,235.00    $184,607.50    $210,980.00    $237,352.50     $263,725.00
       Retirement Savings    1            $-               $-               $-               $-                $-              $-             $-             $-             $-             $-              $-
           Taxable Income    1     $10,549.00       $26,372.50       $52,745.00       $79,117.50       $105,490.00     $131,862.50    $158,235.00    $184,607.50    $210,980.00    $237,352.50     $263,725.00
                       Tax   1       $(682.35)      $(3,055.88)      $(9,823.50)     $(17,735.25)      $(27,686.20)    $(37,707.75)   $(47,729.30)   $(58,073.38)   $(69,941.00)   $(81,808.63)    $(93,676.25)
                 Medicare    1            $-          $(395.59)        $(791.18)      $(1,186.76)       $(1,582.35)     $(1,977.94)    $(2,373.53)    $(2,769.11)    $(3,164.70)    $(3,560.29)     $(3,955.88)

                     Wage    2      $3,151.00        $7,877.50       $15,755.00       $23,632.50        $31,510.00      $39,387.50     $47,265.00     $55,142.50     $63,020.00      $70,897.50     $78,775.00
       Retirement Savings    2            $-               $-               $-               $-                $-              $-             $-             $-             $-              $-             $-
           Taxable Income    2      $3,151.00        $7,877.50       $15,755.00       $23,632.50        $31,510.00      $39,387.50     $47,265.00     $55,142.50     $63,020.00      $70,897.50     $78,775.00
                       Tax   2            $-          $(281.63)      $(1,463.25)      $(2,644.88)       $(3,826.50)     $(5,816.25)    $(8,179.50)   $(10,542.75)   $(12,906.00)    $(15,269.25)   $(17,632.50)
                 Medicare    2            $-               $-          $(138.60)        $(354.49)         $(472.65)       $(590.81)      $(708.98)      $(827.14)      $(945.30)     $(1,063.46)    $(1,181.63)

          Medicare Surcharge              $-               $-              $-         $(1,027.50)       $(1,370.00)     $(1,712.50)    $(2,055.00)    $(2,397.50)    $(2,740.00)     $(3,082.50)   $(3,425.00)
   Private Health Adjustment              $-               $-              $-                $-                $-          $212.50        $555.00        $897.50      $1,240.00       $1,582.50     $1,925.00
                    Total Tax        $(682.35)      $(3,733.09)    $(12,216.53)      $(22,948.88)      $(34,937.70)    $(47,592.75)   $(60,491.30)   $(73,712.38)   $(88,457.00)   $(103,201.63) $(117,946.25)
                  Net Income       $13,017.65       $30,516.91      $56,283.48        $79,801.13       $102,062.30     $123,657.25    $145,008.70    $166,037.63    $185,543.00     $205,048.38   $224,553.75
           Effective Tax Rate            5.0%            10.9%           17.8%             22.3%             25.5%           27.8%          29.4%          30.7%          32.3%           33.5%         34.4%
          Retirement Savings              $-               $-              $-                $-                $-              $-             $-             $-             $-              $-            $-

                     Adults                  2 1 or 2
                   Children                  2
                Adult 1 age                 38
                Adult 2 age                 39
                 Healthcare        $(1,500.00) cost of private healthcare
                 Wage Split               77% ratio of wage 1 to wage 2
         Retirement Savings                0% as a percent of wages


                Assumptions If medicare surcharge is higher than private healthcare cost, that is paid instead
                            Does not (yet) consider: capital gains, tax credits
                            Retirement saving is superannuation, capped at the maximum tax-free amount available
                            GST is included in PPP

        Individual Tax Rates income >      income <      tax is this    plus this                     of amount over
                      source           $-      $6,000.00             $-                         0%              $-
                    2009-10      $6,000.00    $34,000.00             $-                        15%        $6,000.00
                                $34,000.00    $80,000.00      $4,200.00                        30%       $34,000.00
                                $80,000.00 $180,000.00      $18,000.00                         38%       $80,000.00
                               $180,000.00                  $56,000.00                         45%      $180,000.00

              Medicare Levy income >      income <      tax is this                plus this          of amount over
                     source           $-     $15,062.00             $-                           0%             $-
                               $15,062.00    $16,283.00             $-                          20%      $15,062.00
                               $16,283.00                           $-                         1.5%             $-

              Medicare Levy # dependents threshold
        Surcharge Threshold             0 $100,000.00
                    (family)            1 $100,000.00
                                        2 $101,500.00
                                        3 $103,000.00
                                        4 $104,500.00
                                        5 $106,000.00

Super Contribution Threshold age >                age <           threshold
                      source                  0             34       $13,934.00
                                             34             48       $38,702.00
                                             49                      $95,980.00
$275,000.00     $300,000.00    $325,000.00    $350,000.00
$376,750.00     $411,000.00    $445,250.00    $479,500.00
$376,750.00     $411,000.00    $445,250.00    $479,500.00

 $290,097.50   $316,470.00   $342,842.50   $369,215.00
         $-            $-            $-            $-
 $290,097.50   $316,470.00   $342,842.50   $369,215.00
$(105,543.88) $(117,411.50) $(129,279.13) $(141,146.75)
  $(4,351.46)   $(4,747.05)   $(5,142.64)   $(5,538.23)

  $86,652.50     $94,530.00    $102,407.50    $110,285.00
         $-             $-             $-             $-
  $86,652.50     $94,530.00    $102,407.50    $110,285.00
 $(20,527.95)   $(23,521.40)   $(26,514.85)   $(29,508.30)
  $(1,299.79)    $(1,417.95)    $(1,536.11)    $(1,654.28)

  $(3,767.50)   $(4,110.00)   $(4,452.50)   $(4,795.00)
   $2,267.50     $2,610.00     $2,952.50     $3,295.00
$(133,223.08) $(148,597.90) $(163,972.73) $(179,347.55)
 $243,526.93   $262,402.10   $281,277.28   $300,152.45
       35.4%         36.2%         36.8%         37.4%
         $-            $-            $-            $-
Source


http://www.ato.gov.au/individuals/content.asp?doc=/content/12333.htm&page=1#P11_197
http://www.ato.gov.au/individuals/content.asp?doc=/content/17482.htm&page=2#P82_4536
United Kingdom - London (all amounts are annual and in local currency, unless   marked as PPP)
 Gross Income (PPP)         $10,000.00     $25,000.00     $50,000.00    $75,000.00 $100,000.00            $125,000.00 $150,000.00     $175,000.00   $200,000.00   $225,000.00   $250,000.00
       Gross Income           £6,380.00    £15,950.00     £31,900.00    £47,850.00       £63,800.00        £79,750.00    £95,700.00   £111,650.00   £127,600.00   £143,550.00   £159,500.00
        Gross Wages           £6,380.00    £15,950.00     £31,900.00    £47,850.00       £63,800.00        £79,750.00    £95,700.00   £111,650.00   £127,600.00   £143,550.00   £159,500.00

              Wage    1       £4,912.60      £12,281.50     £24,563.00     £36,844.50      £49,126.00      £61,407.50    £73,689.00    £85,970.50    £98,252.00   £110,533.50   £122,815.00
Retirement Savings    1             £-              £-             £-             £-              £-              £-            £-            £-            £-            £-            £-
Personal Allowance    1      -£4,745.00      -£4,745.00     -£4,745.00     -£4,745.00      -£4,745.00      -£4,745.00    -£4,745.00    -£4,745.00    -£4,745.00    -£4,745.00    -£4,745.00
    Taxable Income    1         £167.60       £7,536.50     £19,818.00     £32,099.50      £44,381.00      £56,662.50    £68,944.00    £81,225.50    £93,507.00   £105,788.50   £118,070.00
                Tax   1         -£16.76      -£1,415.63     -£4,117.56     -£6,945.40     -£11,858.00     -£16,770.60   -£21,683.20   -£26,595.80   -£31,508.40   -£36,421.00   -£41,333.60
                 NI   1         -£19.87        -£830.45     -£2,181.41     -£3,019.93      -£3,142.74      -£3,265.56    -£3,388.37    -£3,511.19    -£3,634.00    -£3,756.82    -£3,879.63

              Wage    2       £1,467.40       £3,668.50       £7,337.00    £11,005.50      £14,674.00      £18,342.50   £22,011.00     £25,679.50    £29,348.00    £33,016.50    £36,685.00
Retirement Savings    2             £-              £-              £-            £-              £-              £-           £-             £-            £-            £-            £-
Personal Allowance    2      -£4,745.00      -£4,745.00      -£4,745.00    -£4,745.00      -£4,745.00      -£4,745.00   -£4,745.00     -£4,745.00    -£4,745.00    -£4,745.00    -£4,745.00
    Taxable Income    2             £-              £-        £2,592.00     £6,260.50       £9,929.00      £13,597.50   £17,266.00     £20,934.50    £24,603.00    £28,271.50    £31,940.00
                Tax   2             £-              £-         -£327.84    -£1,134.91      -£1,941.98      -£2,749.05   -£3,556.12     -£4,363.19    -£5,170.26    -£5,977.33    -£6,881.60
                 NI   2             £-              £-         -£286.55      -£690.09      -£1,093.62      -£1,497.16   -£1,900.69     -£2,304.23    -£2,707.76    -£2,981.65    -£3,018.33

          Council Tax        -£1,000.00      -£1,000.00     -£1,000.00      -£1,000.00     -£1,000.00      -£1,000.00    -£1,000.00    -£1,000.00    -£1,000.00    -£1,000.00    -£1,000.00
            Total Tax        -£1,036.63      -£3,246.08     -£7,913.36     -£12,790.32    -£19,036.34     -£25,282.36   -£31,528.38   -£37,774.40   -£44,020.42   -£50,136.79   -£56,113.16
          Net Income          £5,343.37      £12,703.93     £23,986.64      £35,059.68     £44,763.66      £54,467.64    £64,171.62    £73,875.60    £83,579.58    £93,413.21   £103,386.84
   Effective Tax Rate             16.2%           20.4%          24.8%           26.7%          29.8%           31.7%         32.9%         33.8%         34.5%         34.9%         35.2%

             Adults                    2 1 or 2
           Children                    2
        Adult 1 age                   38
        Adult 2 age                   39
         Healthcare          -£1,500.00 cost of private healthcare
        Council Tax          -£1,000.00 http://www.rbkc.gov.uk/LocalTaxes/counciltax/bands.asp; http://www.lambeth.gov.uk/counciltax/index.shtml#valuation
         Wage Split                77% ratio of wage 1 to wage 2
 Retirement Savings                  0% as a percent of wages


        Assumptions All retirement savings are tax-deductable (e.g., superannuation)
                    Does not (yet) consider: capital gains, working or child tax credits, housing benefit
                    Retirement saving is estimated and simplistic; http://www.inlandrevenue.gov.uk/pdfs/ir2008b.htm; http://www.inlandrevenue.gov.uk/pdfs/ir78.htm
                    VAT is included in PPP
                    Does not include ISAs or interest income

 Individual Tax Rates income >      income <      tax is this    plus this               of amount over
               source           £-      £2,020.00             £-                  10%              £-
                          £2,020.00    £31,400.00        £202.00                  22%        £2,020.00
                         £31,400.00                    £6,665.60                  40%       £31,400.00

  National Insurance income >     income <     tax is this    plus this      of amount over
            (weekly)          £-        £91.00             £-             0%           £-
              source       £91.00      £610.00             £-            11%       £91.00
                          £610.00                      £57.09           1.0%      £610.00

  Personal Allowance age >                 Age <          allowance
               source                  0             64        £4,745.00
                                      64             74        £6,830.00
                                      74                       £6,950.00
$275,000.00   $300,000.00   $325,000.00   $350,000.00
£175,450.00   £191,400.00   £207,350.00   £223,300.00
£175,450.00   £191,400.00   £207,350.00   £223,300.00

£135,096.50   £147,378.00   £159,659.50   £171,941.00
        £-            £-            £-            £-
 -£4,745.00    -£4,745.00    -£4,745.00    -£4,745.00
£130,351.50   £142,633.00   £154,914.50   £167,196.00
-£46,246.20   -£51,158.80   -£56,071.40   -£60,984.00
 -£4,002.45    -£4,125.26    -£4,248.08    -£4,370.89

 £40,353.50    £44,022.00    £47,690.50    £51,359.00
        £-            £-            £-            £-
 -£4,745.00    -£4,745.00    -£4,745.00    -£4,745.00
 £35,608.50    £39,277.00    £42,945.50    £46,614.00
 -£8,349.00    -£9,816.40   -£11,283.80   -£12,751.20
 -£3,055.02    -£3,091.70    -£3,128.39    -£3,165.07

 -£1,000.00    -£1,000.00    -£1,000.00    -£1,000.00
-£62,652.66   -£69,192.16   -£75,731.66   -£82,271.16
£112,797.34   £122,207.84   £131,618.34   £141,028.84
      35.7%         36.2%         36.5%         36.8%
Source
United Kingdom - London (all amounts are annual and in local currency, unless marked as PPP)
 Gross Income (PPP)           $10,000.00       $25,000.00       $50,000.00       $75,000.00       $100,000.00       $125,000.00               $150,000.00         $175,000.00         $200,000.00
       Gross Income          96,900.00 kr    242,250.00 kr 484,500.00 kr 726,750.00 kr 969,000.00 kr 1,211,250.00 kr                       1,453,500.00 kr     1,695,750.00 kr     1,938,000.00 kr
        Gross Wages          96,900.00 kr    242,250.00 kr 484,500.00 kr 726,750.00 kr 969,000.00 kr 1,211,250.00 kr                       1,453,500.00 kr     1,695,750.00 kr     1,938,000.00 kr

              Wage    1      74,613.00   kr   186,532.50   kr    373,065.00   kr 559,597.50     kr    746,130.00   kr    932,662.50   kr   1,119,195.00   kr   1,305,727.50   kr   1,492,260.00   kr
Retirement Savings    1             -    kr           -    kr            -    kr          -     kr            -    kr            -    kr             -    kr             -    kr             -    kr
    Taxable Income    1      74,613.00   kr   186,532.50   kr    373,065.00   kr 559,597.50     kr    746,130.00   kr    932,662.50   kr   1,119,195.00   kr   1,305,727.50   kr   1,492,260.00   kr
       National Tax   1             -    kr           -    kr    -16,253.00   kr  -87,934.38    kr   -134,567.50   kr   -181,200.63   kr    -227,833.75   kr    -274,466.88   kr    -321,100.00   kr
      Municipal Tax   1     -22,234.67   kr   -55,586.69   kr   -111,173.37   kr -166,760.06    kr   -222,346.74   kr   -277,933.43   kr    -333,520.11   kr    -389,106.80   kr    -444,693.48   kr

              Wage    2     22,287.00    kr    55,717.50   kr   111,435.00    kr   167,152.50   kr    222,870.00   kr   278,587.50    kr    334,305.00    kr     390,022.50   kr     445,740.00   kr
Retirement Savings    2            -     kr           -    kr           -     kr           -    kr            -    kr           -     kr            -     kr             -    kr             -    kr
    Taxable Income    2     22,287.00    kr    55,717.50   kr   111,435.00    kr   167,152.50   kr    222,870.00   kr   278,587.50    kr    334,305.00    kr     390,022.50   kr     445,740.00   kr
       National Tax   2            -     kr           -    kr           -     kr           -    kr            -    kr           -     kr     -8,501.00    kr     -19,644.50   kr     -59,470.00   kr
      Municipal Tax   2     -6,641.53    kr   -16,603.82   kr   -33,207.63    kr   -49,811.45   kr    -66,415.26   kr   -83,019.08    kr    -99,622.89    kr    -116,226.71   kr    -132,830.52   kr

            Total Tax       -28,876.20 kr     -72,190.50 kr -160,634.00 kr -304,505.88 kr -423,329.50 kr                -542,153.13 kr      -669,477.75 kr      -799,444.88 kr      -958,094.00 kr
          Net Income         68,023.80 kr     170,059.50 kr 323,866.00 kr 422,244.13 kr 545,670.50 kr                    669,096.88 kr       784,022.25 kr       896,305.13 kr       979,906.00 kr
   Effective Tax Rate              29.8%             29.8%          33.2%          41.9%          43.7%                         44.8%               46.1%               47.1%               49.4%

              Adults                   2 1 or 2
            Children                   2
       Municipal Tax              29.80% http://www2.stockholm.se/english/cityofsthlm/gov/budget.htm
         Wage Split                  77% ratio of wage 1 to wage 2
 Retirement Savings                   0% as a percent of wages


        Assumptions All retirement savings are tax-deductable (e.g., superannuation)
                    Does not (yet) consider: capital gains, tax credits
                    Retirement saving is estimated and simplistic
                    VAT is included in PPP

  National Tax Rates income >        income <          tax is this      plus this                    of amount over
              source           - kr      291,800.00 kr             - kr                     0%                 - kr
                       291,800.00 kr     390,400.00 kr             - kr                    20%         291,800.00 kr
                       441,300.00 kr                      58,360.00 kr                     25%         441,300.00 kr
$225,000.00         $250,000.00         $275,000.00         $300,000.00         $325,000.00         $350,000.00
2,180,250.00 kr     2,422,500.00 kr     2,664,750.00 kr     2,907,000.00 kr     3,149,250.00 kr     3,391,500.00 kr

1,678,792.50   kr   1,865,325.00   kr   2,051,857.50   kr   2,238,390.00   kr   2,424,922.50   kr   2,611,455.00   kr
          -    kr             -    kr             -    kr             -    kr             -    kr             -    kr
1,678,792.50   kr   1,865,325.00   kr   2,051,857.50   kr   2,238,390.00   kr   2,424,922.50   kr   2,611,455.00   kr
 -367,733.13   kr    -414,366.25   kr    -460,999.38   kr    -507,632.50   kr    -554,265.63   kr    -600,898.75   kr
 -500,280.17   kr    -555,866.85   kr    -611,453.54   kr    -667,040.22   kr    -722,626.91   kr    -778,213.59   kr

  501,457.50   kr     557,175.00   kr     612,892.50   kr     668,610.00   kr     724,327.50   kr     780,045.00   kr
          -    kr             -    kr             -    kr             -    kr             -    kr             -    kr
  501,457.50   kr     557,175.00   kr     612,892.50   kr     668,610.00   kr     724,327.50   kr     780,045.00   kr
  -73,399.38   kr     -87,328.75   kr    -101,258.13   kr    -115,187.50   kr    -129,116.88   kr    -143,046.25   kr
 -149,434.34   kr    -166,038.15   kr    -182,641.97   kr    -199,245.78   kr    -215,849.60   kr    -232,453.41   kr

-1,090,847.00 kr -1,223,600.00 kr -1,356,353.00 kr -1,489,106.00 kr -1,621,859.00 kr -1,754,612.00 kr
 1,089,403.00 kr 1,198,900.00 kr 1,308,397.00 kr 1,417,894.00 kr 1,527,391.00 kr 1,636,888.00 kr
          50.0%            50.5%            50.9%            51.2%            51.5%            51.7%
Source
Country   PPP           source
US              1.000
AU              1.370
UK              0.638
SE              9.690

More Related Content

What's hot

Poliedres millionaire copia
Poliedres millionaire copiaPoliedres millionaire copia
Poliedres millionaire copia
puntmat
 
Millionaire Chapter 5 Review
Millionaire Chapter 5 Review Millionaire Chapter 5 Review
Millionaire Chapter 5 Review Damaris Munoz
 
V3 milyoner
V3 milyonerV3 milyoner
V3 milyonerihsan
 
Front Office Millionaire
Front Office MillionaireFront Office Millionaire
Front Office Millionaire
robcarrot
 
H W 2010 Q3 De 12 Mo
H W 2010 Q3 De 12 MoH W 2010 Q3 De 12 Mo
H W 2010 Q3 De 12 Mochipwags
 
How does it work artifact
How does it work artifactHow does it work artifact
How does it work artifact
ab0046bn
 
Wag Report 2009 Q4 De 12 Mo
Wag Report 2009 Q4 De 12 MoWag Report 2009 Q4 De 12 Mo
Wag Report 2009 Q4 De 12 Mo
chipwags
 
Whowantstobea millionaire
Whowantstobea millionaireWhowantstobea millionaire
Whowantstobea millionairemollyswabbs
 
Whowantstobea millionaire
Whowantstobea millionaireWhowantstobea millionaire
Whowantstobea millionairehb0910bn
 
January 2011 Austin Real Estate Market Stats
January 2011 Austin Real Estate Market StatsJanuary 2011 Austin Real Estate Market Stats
January 2011 Austin Real Estate Market StatsKristee Leonard
 
百萬富翁 03
百萬富翁 03百萬富翁 03
百萬富翁 03Aska Chiu
 
sempra energy 2005 Annual Report
sempra energy 2005 Annual Reportsempra energy 2005 Annual Report
sempra energy 2005 Annual Reportfinance24
 
Who wants to be drug specialist (Darshan Mehta)
Who wants to be drug specialist (Darshan Mehta)Who wants to be drug specialist (Darshan Mehta)
Who wants to be drug specialist (Darshan Mehta)
mehta786
 
10%20 Year%20 Interest
10%20 Year%20 Interest10%20 Year%20 Interest
10%20 Year%20 InterestAmanda Meckley
 
22 millionaire review
22 millionaire review22 millionaire review
22 millionaire reviewTeamMadsen
 
Who wants to be a millionaire
Who wants to be a millionaireWho wants to be a millionaire
Who wants to be a millionairekrystals13
 

What's hot (18)

Poliedres millionaire copia
Poliedres millionaire copiaPoliedres millionaire copia
Poliedres millionaire copia
 
Millionaire Chapter 5 Review
Millionaire Chapter 5 Review Millionaire Chapter 5 Review
Millionaire Chapter 5 Review
 
V3 milyoner
V3 milyonerV3 milyoner
V3 milyoner
 
Front Office Millionaire
Front Office MillionaireFront Office Millionaire
Front Office Millionaire
 
H W 2010 Q3 De 12 Mo
H W 2010 Q3 De 12 MoH W 2010 Q3 De 12 Mo
H W 2010 Q3 De 12 Mo
 
Millionaire 5è
Millionaire 5èMillionaire 5è
Millionaire 5è
 
Jiahua million afrikaans
Jiahua million afrikaansJiahua million afrikaans
Jiahua million afrikaans
 
How does it work artifact
How does it work artifactHow does it work artifact
How does it work artifact
 
Wag Report 2009 Q4 De 12 Mo
Wag Report 2009 Q4 De 12 MoWag Report 2009 Q4 De 12 Mo
Wag Report 2009 Q4 De 12 Mo
 
Whowantstobea millionaire
Whowantstobea millionaireWhowantstobea millionaire
Whowantstobea millionaire
 
Whowantstobea millionaire
Whowantstobea millionaireWhowantstobea millionaire
Whowantstobea millionaire
 
January 2011 Austin Real Estate Market Stats
January 2011 Austin Real Estate Market StatsJanuary 2011 Austin Real Estate Market Stats
January 2011 Austin Real Estate Market Stats
 
百萬富翁 03
百萬富翁 03百萬富翁 03
百萬富翁 03
 
sempra energy 2005 Annual Report
sempra energy 2005 Annual Reportsempra energy 2005 Annual Report
sempra energy 2005 Annual Report
 
Who wants to be drug specialist (Darshan Mehta)
Who wants to be drug specialist (Darshan Mehta)Who wants to be drug specialist (Darshan Mehta)
Who wants to be drug specialist (Darshan Mehta)
 
10%20 Year%20 Interest
10%20 Year%20 Interest10%20 Year%20 Interest
10%20 Year%20 Interest
 
22 millionaire review
22 millionaire review22 millionaire review
22 millionaire review
 
Who wants to be a millionaire
Who wants to be a millionaireWho wants to be a millionaire
Who wants to be a millionaire
 

Similar to Global Taxation Arbitrage

pitney bowes Monahan_2
pitney bowes  Monahan_2pitney bowes  Monahan_2
pitney bowes Monahan_2finance47
 
pitney bowes Monahan_2
pitney bowes  Monahan_2pitney bowes  Monahan_2
pitney bowes Monahan_2finance47
 
Social Media Marketing Budget Template
Social Media Marketing Budget TemplateSocial Media Marketing Budget Template
Social Media Marketing Budget Template
Demand Metric
 
Analysis Coversheet Final
Analysis Coversheet FinalAnalysis Coversheet Final
Analysis Coversheet Final
John_Nuckel1
 
Executive Summary Rough Draft #3
Executive Summary Rough Draft #3Executive Summary Rough Draft #3
Executive Summary Rough Draft #3
AVINRAM
 
Executive Summary Final
Executive Summary FinalExecutive Summary Final
Executive Summary FinalAVINRAM
 
2010 q3 google_earnings_slides
2010 q3 google_earnings_slides2010 q3 google_earnings_slides
2010 q3 google_earnings_slides
rabier
 
39348363 google-earnings-slides-q3-2010
39348363 google-earnings-slides-q3-201039348363 google-earnings-slides-q3-2010
39348363 google-earnings-slides-q3-2010Pranav Bhatnagar
 
Conference Budget Template
Conference Budget TemplateConference Budget Template
Conference Budget Template
Demand Metric
 
Present and Future of Company
Present and Future of CompanyPresent and Future of Company
Present and Future of Company
Othón A. León, Adm.A.
 
Copy Tested Of Imc09 Payback Analysis Jc 072209
Copy Tested  Of Imc09 Payback Analysis Jc 072209Copy Tested  Of Imc09 Payback Analysis Jc 072209
Copy Tested Of Imc09 Payback Analysis Jc 072209
ccaywood
 
Mafia Wars Expense Guide
Mafia Wars Expense GuideMafia Wars Expense Guide
Mafia Wars Expense Guide
guest26cede
 
Startup Financial Modeling
Startup Financial ModelingStartup Financial Modeling
Startup Financial Modeling
Bryan Hassin
 
Bond Valuation
Bond ValuationBond Valuation
Bond Valuationashutoshpo
 
WSE Cuban Proposal
WSE Cuban ProposalWSE Cuban Proposal
WSE Cuban Proposal
nharlan
 
Economic Inequality
Economic InequalityEconomic Inequality
Economic Inequality
Dale DeBoer
 
Innovation in higher education
Innovation in higher educationInnovation in higher education
Innovation in higher education
cityofls
 

Similar to Global Taxation Arbitrage (20)

pitney bowes Monahan_2
pitney bowes  Monahan_2pitney bowes  Monahan_2
pitney bowes Monahan_2
 
pitney bowes Monahan_2
pitney bowes  Monahan_2pitney bowes  Monahan_2
pitney bowes Monahan_2
 
Social Media Marketing Budget Template
Social Media Marketing Budget TemplateSocial Media Marketing Budget Template
Social Media Marketing Budget Template
 
Analysis Coversheet Final
Analysis Coversheet FinalAnalysis Coversheet Final
Analysis Coversheet Final
 
Car Net Business Plan
Car Net Business PlanCar Net Business Plan
Car Net Business Plan
 
Executive Summary Rough Draft #3
Executive Summary Rough Draft #3Executive Summary Rough Draft #3
Executive Summary Rough Draft #3
 
Aoc63
Aoc63Aoc63
Aoc63
 
Executive Summary Final
Executive Summary FinalExecutive Summary Final
Executive Summary Final
 
2010 q3 google_earnings_slides
2010 q3 google_earnings_slides2010 q3 google_earnings_slides
2010 q3 google_earnings_slides
 
39348363 google-earnings-slides-q3-2010
39348363 google-earnings-slides-q3-201039348363 google-earnings-slides-q3-2010
39348363 google-earnings-slides-q3-2010
 
Conference Budget Template
Conference Budget TemplateConference Budget Template
Conference Budget Template
 
Present and Future of Company
Present and Future of CompanyPresent and Future of Company
Present and Future of Company
 
Copy Tested Of Imc09 Payback Analysis Jc 072209
Copy Tested  Of Imc09 Payback Analysis Jc 072209Copy Tested  Of Imc09 Payback Analysis Jc 072209
Copy Tested Of Imc09 Payback Analysis Jc 072209
 
Mafia Wars Expense Guide
Mafia Wars Expense GuideMafia Wars Expense Guide
Mafia Wars Expense Guide
 
Startup Financial Modeling
Startup Financial ModelingStartup Financial Modeling
Startup Financial Modeling
 
Google Earnings Slides 2009 Q2
Google Earnings Slides 2009 Q2Google Earnings Slides 2009 Q2
Google Earnings Slides 2009 Q2
 
Bond Valuation
Bond ValuationBond Valuation
Bond Valuation
 
WSE Cuban Proposal
WSE Cuban ProposalWSE Cuban Proposal
WSE Cuban Proposal
 
Economic Inequality
Economic InequalityEconomic Inequality
Economic Inequality
 
Innovation in higher education
Innovation in higher educationInnovation in higher education
Innovation in higher education
 

More from Mark Nottingham

What HTTP/2.0 Will Do For You
What HTTP/2.0 Will Do For YouWhat HTTP/2.0 Will Do For You
What HTTP/2.0 Will Do For You
Mark Nottingham
 
Browser Caching and You: A Love Story
Browser Caching and You: A Love StoryBrowser Caching and You: A Love Story
Browser Caching and You: A Love Story
Mark Nottingham
 
Stupid Web Caching Tricks
Stupid Web Caching TricksStupid Web Caching Tricks
Stupid Web Caching Tricks
Mark Nottingham
 
Shiny New HTTP Shit
Shiny New HTTP ShitShiny New HTTP Shit
Shiny New HTTP Shit
Mark Nottingham
 
Introducing REDbot
Introducing REDbotIntroducing REDbot
Introducing REDbot
Mark Nottingham
 
Leveraging the Web for Services at Yahoo!
Leveraging the Web for Services at Yahoo!Leveraging the Web for Services at Yahoo!
Leveraging the Web for Services at Yahoo!
Mark Nottingham
 
Web 2.0 on Speed
Web 2.0 on SpeedWeb 2.0 on Speed
Web 2.0 on Speed
Mark Nottingham
 
What's up with HTTP?
What's up with HTTP?What's up with HTTP?
What's up with HTTP?
Mark Nottingham
 

More from Mark Nottingham (8)

What HTTP/2.0 Will Do For You
What HTTP/2.0 Will Do For YouWhat HTTP/2.0 Will Do For You
What HTTP/2.0 Will Do For You
 
Browser Caching and You: A Love Story
Browser Caching and You: A Love StoryBrowser Caching and You: A Love Story
Browser Caching and You: A Love Story
 
Stupid Web Caching Tricks
Stupid Web Caching TricksStupid Web Caching Tricks
Stupid Web Caching Tricks
 
Shiny New HTTP Shit
Shiny New HTTP ShitShiny New HTTP Shit
Shiny New HTTP Shit
 
Introducing REDbot
Introducing REDbotIntroducing REDbot
Introducing REDbot
 
Leveraging the Web for Services at Yahoo!
Leveraging the Web for Services at Yahoo!Leveraging the Web for Services at Yahoo!
Leveraging the Web for Services at Yahoo!
 
Web 2.0 on Speed
Web 2.0 on SpeedWeb 2.0 on Speed
Web 2.0 on Speed
 
What's up with HTTP?
What's up with HTTP?What's up with HTTP?
What's up with HTTP?
 

Recently uploaded

Pensions and housing - Pensions PlayPen - 4 June 2024 v3 (1).pdf
Pensions and housing - Pensions PlayPen - 4 June 2024 v3 (1).pdfPensions and housing - Pensions PlayPen - 4 June 2024 v3 (1).pdf
Pensions and housing - Pensions PlayPen - 4 June 2024 v3 (1).pdf
Henry Tapper
 
Seminar: Gender Board Diversity through Ownership Networks
Seminar: Gender Board Diversity through Ownership NetworksSeminar: Gender Board Diversity through Ownership Networks
Seminar: Gender Board Diversity through Ownership Networks
GRAPE
 
How Non-Banking Financial Companies Empower Startups With Venture Debt Financing
How Non-Banking Financial Companies Empower Startups With Venture Debt FinancingHow Non-Banking Financial Companies Empower Startups With Venture Debt Financing
How Non-Banking Financial Companies Empower Startups With Venture Debt Financing
Vighnesh Shashtri
 
This assessment plan proposal is to outline a structured approach to evaluati...
This assessment plan proposal is to outline a structured approach to evaluati...This assessment plan proposal is to outline a structured approach to evaluati...
This assessment plan proposal is to outline a structured approach to evaluati...
lamluanvan.net Viết thuê luận văn
 
Abhay Bhutada Leads Poonawalla Fincorp To Record Low NPA And Unprecedented Gr...
Abhay Bhutada Leads Poonawalla Fincorp To Record Low NPA And Unprecedented Gr...Abhay Bhutada Leads Poonawalla Fincorp To Record Low NPA And Unprecedented Gr...
Abhay Bhutada Leads Poonawalla Fincorp To Record Low NPA And Unprecedented Gr...
Vighnesh Shashtri
 
can I really make money with pi network.
can I really make money with pi network.can I really make money with pi network.
can I really make money with pi network.
DOT TECH
 
What website can I sell pi coins securely.
What website can I sell pi coins securely.What website can I sell pi coins securely.
What website can I sell pi coins securely.
DOT TECH
 
Instant Issue Debit Cards
Instant Issue Debit CardsInstant Issue Debit Cards
Instant Issue Debit Cards
egoetzinger
 
where can I find a legit pi merchant online
where can I find a legit pi merchant onlinewhere can I find a legit pi merchant online
where can I find a legit pi merchant online
DOT TECH
 
when will pi network coin be available on crypto exchange.
when will pi network coin be available on crypto exchange.when will pi network coin be available on crypto exchange.
when will pi network coin be available on crypto exchange.
DOT TECH
 
一比一原版(IC毕业证)帝国理工大学毕业证如何办理
一比一原版(IC毕业证)帝国理工大学毕业证如何办理一比一原版(IC毕业证)帝国理工大学毕业证如何办理
一比一原版(IC毕业证)帝国理工大学毕业证如何办理
conose1
 
The secret way to sell pi coins effortlessly.
The secret way to sell pi coins effortlessly.The secret way to sell pi coins effortlessly.
The secret way to sell pi coins effortlessly.
DOT TECH
 
Globalization (Nike) Presentation PPT Poster Infographic.pdf
Globalization (Nike) Presentation PPT Poster Infographic.pdfGlobalization (Nike) Presentation PPT Poster Infographic.pdf
Globalization (Nike) Presentation PPT Poster Infographic.pdf
VohnArchieEdjan
 
Tdasx: Unveiling the Trillion-Dollar Potential of Bitcoin DeFi
Tdasx: Unveiling the Trillion-Dollar Potential of Bitcoin DeFiTdasx: Unveiling the Trillion-Dollar Potential of Bitcoin DeFi
Tdasx: Unveiling the Trillion-Dollar Potential of Bitcoin DeFi
nimaruinazawa258
 
BONKMILLON Unleashes Its Bonkers Potential on Solana.pdf
BONKMILLON Unleashes Its Bonkers Potential on Solana.pdfBONKMILLON Unleashes Its Bonkers Potential on Solana.pdf
BONKMILLON Unleashes Its Bonkers Potential on Solana.pdf
coingabbar
 
SWAIAP Fraud Risk Mitigation Prof Oyedokun.pptx
SWAIAP Fraud Risk Mitigation   Prof Oyedokun.pptxSWAIAP Fraud Risk Mitigation   Prof Oyedokun.pptx
SWAIAP Fraud Risk Mitigation Prof Oyedokun.pptx
Godwin Emmanuel Oyedokun MBA MSc PhD FCA FCTI FCNA CFE FFAR
 
一比一原版(UoB毕业证)伯明翰大学毕业证如何办理
一比一原版(UoB毕业证)伯明翰大学毕业证如何办理一比一原版(UoB毕业证)伯明翰大学毕业证如何办理
一比一原版(UoB毕业证)伯明翰大学毕业证如何办理
nexop1
 
Donald Trump Presentation and his life.pptx
Donald Trump Presentation and his life.pptxDonald Trump Presentation and his life.pptx
Donald Trump Presentation and his life.pptx
SerdarHudaykuliyew
 
一比一原版(UCSB毕业证)圣芭芭拉分校毕业证如何办理
一比一原版(UCSB毕业证)圣芭芭拉分校毕业证如何办理一比一原版(UCSB毕业证)圣芭芭拉分校毕业证如何办理
一比一原版(UCSB毕业证)圣芭芭拉分校毕业证如何办理
bbeucd
 
GeM ppt in railway for presentation on gem
GeM ppt in railway  for presentation on gemGeM ppt in railway  for presentation on gem
GeM ppt in railway for presentation on gem
CwierAsn
 

Recently uploaded (20)

Pensions and housing - Pensions PlayPen - 4 June 2024 v3 (1).pdf
Pensions and housing - Pensions PlayPen - 4 June 2024 v3 (1).pdfPensions and housing - Pensions PlayPen - 4 June 2024 v3 (1).pdf
Pensions and housing - Pensions PlayPen - 4 June 2024 v3 (1).pdf
 
Seminar: Gender Board Diversity through Ownership Networks
Seminar: Gender Board Diversity through Ownership NetworksSeminar: Gender Board Diversity through Ownership Networks
Seminar: Gender Board Diversity through Ownership Networks
 
How Non-Banking Financial Companies Empower Startups With Venture Debt Financing
How Non-Banking Financial Companies Empower Startups With Venture Debt FinancingHow Non-Banking Financial Companies Empower Startups With Venture Debt Financing
How Non-Banking Financial Companies Empower Startups With Venture Debt Financing
 
This assessment plan proposal is to outline a structured approach to evaluati...
This assessment plan proposal is to outline a structured approach to evaluati...This assessment plan proposal is to outline a structured approach to evaluati...
This assessment plan proposal is to outline a structured approach to evaluati...
 
Abhay Bhutada Leads Poonawalla Fincorp To Record Low NPA And Unprecedented Gr...
Abhay Bhutada Leads Poonawalla Fincorp To Record Low NPA And Unprecedented Gr...Abhay Bhutada Leads Poonawalla Fincorp To Record Low NPA And Unprecedented Gr...
Abhay Bhutada Leads Poonawalla Fincorp To Record Low NPA And Unprecedented Gr...
 
can I really make money with pi network.
can I really make money with pi network.can I really make money with pi network.
can I really make money with pi network.
 
What website can I sell pi coins securely.
What website can I sell pi coins securely.What website can I sell pi coins securely.
What website can I sell pi coins securely.
 
Instant Issue Debit Cards
Instant Issue Debit CardsInstant Issue Debit Cards
Instant Issue Debit Cards
 
where can I find a legit pi merchant online
where can I find a legit pi merchant onlinewhere can I find a legit pi merchant online
where can I find a legit pi merchant online
 
when will pi network coin be available on crypto exchange.
when will pi network coin be available on crypto exchange.when will pi network coin be available on crypto exchange.
when will pi network coin be available on crypto exchange.
 
一比一原版(IC毕业证)帝国理工大学毕业证如何办理
一比一原版(IC毕业证)帝国理工大学毕业证如何办理一比一原版(IC毕业证)帝国理工大学毕业证如何办理
一比一原版(IC毕业证)帝国理工大学毕业证如何办理
 
The secret way to sell pi coins effortlessly.
The secret way to sell pi coins effortlessly.The secret way to sell pi coins effortlessly.
The secret way to sell pi coins effortlessly.
 
Globalization (Nike) Presentation PPT Poster Infographic.pdf
Globalization (Nike) Presentation PPT Poster Infographic.pdfGlobalization (Nike) Presentation PPT Poster Infographic.pdf
Globalization (Nike) Presentation PPT Poster Infographic.pdf
 
Tdasx: Unveiling the Trillion-Dollar Potential of Bitcoin DeFi
Tdasx: Unveiling the Trillion-Dollar Potential of Bitcoin DeFiTdasx: Unveiling the Trillion-Dollar Potential of Bitcoin DeFi
Tdasx: Unveiling the Trillion-Dollar Potential of Bitcoin DeFi
 
BONKMILLON Unleashes Its Bonkers Potential on Solana.pdf
BONKMILLON Unleashes Its Bonkers Potential on Solana.pdfBONKMILLON Unleashes Its Bonkers Potential on Solana.pdf
BONKMILLON Unleashes Its Bonkers Potential on Solana.pdf
 
SWAIAP Fraud Risk Mitigation Prof Oyedokun.pptx
SWAIAP Fraud Risk Mitigation   Prof Oyedokun.pptxSWAIAP Fraud Risk Mitigation   Prof Oyedokun.pptx
SWAIAP Fraud Risk Mitigation Prof Oyedokun.pptx
 
一比一原版(UoB毕业证)伯明翰大学毕业证如何办理
一比一原版(UoB毕业证)伯明翰大学毕业证如何办理一比一原版(UoB毕业证)伯明翰大学毕业证如何办理
一比一原版(UoB毕业证)伯明翰大学毕业证如何办理
 
Donald Trump Presentation and his life.pptx
Donald Trump Presentation and his life.pptxDonald Trump Presentation and his life.pptx
Donald Trump Presentation and his life.pptx
 
一比一原版(UCSB毕业证)圣芭芭拉分校毕业证如何办理
一比一原版(UCSB毕业证)圣芭芭拉分校毕业证如何办理一比一原版(UCSB毕业证)圣芭芭拉分校毕业证如何办理
一比一原版(UCSB毕业证)圣芭芭拉分校毕业证如何办理
 
GeM ppt in railway for presentation on gem
GeM ppt in railway  for presentation on gemGeM ppt in railway  for presentation on gem
GeM ppt in railway for presentation on gem
 

Global Taxation Arbitrage

  • 1. Income (PPP), 1000's $10 $25 $50 $75 $100 $125 Taxation US - CA -17.4% 11.9% 20.7% 23.0% 26.4% 29.1% AU 5.0% 10.9% 17.8% 22.3% 25.5% 27.8% UK - London 16.2% 20.4% 24.8% 26.7% 29.8% 31.7% SE - Stockholm 29.8% 29.8% 33.2% 41.9% 43.7% 44.8% Retirement Savings (PPP) US- CA $- $- $- $- $- $- AU $- $- $- $- $- $- Adults 2 1 or 2 Children 2 Adult 1 age 38 Adult 2 age 39 Wage Split 77% ratio of wage 1 to wage 2 Retirement Savings 0% maximum, as a percent of total wages Mort. Int. (PPP), 1000's $5 50.0% 40.0% Income Taxation 30.0% 20.0% 10.0% 0.0% $10 $25 $50 $75 $100 $125 $150 Household Earne
  • 2. $1 $1 Tax-Free Retirement Contributions (PPP) $1 $1 $1 $1 $0 $0 $0 $0 $- $10 $25 $50 $75 $100 $125 $150 $17 Household Earned Inc
  • 3. $150 $175 $200 $225 $250 $275 $300 $325 $350 30.5% 31.8% 32.9% 33.8% 34.9% 35.9% 36.7% 37.3% 37.9% 29.4% 30.7% 32.3% 33.5% 34.4% 35.4% 36.2% 36.8% 37.4% 32.9% 33.8% 34.5% 34.9% 35.2% 35.7% 36.2% 36.5% 36.8% 46.1% 47.1% 49.4% 50.0% 50.5% 50.9% 51.2% 51.5% 51.7% $- $- $- $- $- $- $- $- $- $- $- $- $- $- $- $- $- $- 1-Jul-2004 Notes Copyright 2004, Mark Nottingham <mnot@pobox.com>. Some Rights Reserved. Not warranted for any purpose. 77 0 SE - Stockholm UK - London AU US - CA 75 $100 $125 $150 $175 $200 $225 $250 $275 $300 $325 $350 Household Earned Income (PPP), 1000's
  • 4. AU US- CA 100 $125 $150 $175 $200 $225 $250 $275 $300 $325 $350 Household Earned Income (PPP), 1000's
  • 5. E - Stockholm K - London U S - CA 325 $350
  • 6.
  • 7. United States - California (all amounts are annual and in local currency, unless marked as PPP) Gross Income (PPP) $10,000.00 $25,000.00 $50,000.00 $75,000.00 $100,000.00 $125,000.00 $150,000.00 $175,000.00 $200,000.00 $225,000.00 $250,000.00 Gross Income $10,000.00 $25,000.00 $50,000.00 $75,000.00 $100,000.00 $125,000.00 $150,000.00 $175,000.00 $200,000.00 $225,000.00 $250,000.00 Wage 1 $7,700.00 $19,250.00 $38,500.00 $57,750.00 $77,000.00 $96,250.00 $115,500.00 $134,750.00 $154,000.00 $173,250.00 $192,500.00 Wage 2 $2,300.00 $5,750.00 $11,500.00 $17,250.00 $23,000.00 $28,750.00 $34,500.00 $40,250.00 $46,000.00 $51,750.00 $57,500.00 Gross Wages $10,000.00 $25,000.00 $50,000.00 $75,000.00 $100,000.00 $125,000.00 $150,000.00 $175,000.00 $200,000.00 $225,000.00 $250,000.00 Retirement Savings 1 $- $- $- $- $- $- $- $- $- $- $- Retirement Savings 2 $- $- $- $- $- $- $- $- $- $- $- Healthcare $(1,500.00) $(1,500.00) $(1,500.00) $(1,500.00) $(1,500.00) $(1,500.00) $(1,500.00) $(1,500.00) $(1,500.00) $(1,500.00) $(1,500.00) Mortgate Interest $(5,000.00) $(5,000.00) $(5,000.00) $(5,000.00) $(5,000.00) $(5,000.00) $(5,000.00) $(5,000.00) $(5,000.00) $(5,000.00) $(5,000.00) Standard Deduction (Fed) $(9,500.00) $(9,500.00) $(9,500.00) $(9,500.00) $(9,500.00) $(9,500.00) $(9,500.00) $(9,500.00) $(9,500.00) $(9,500.00) $(9,500.00) Taxable Income (Fed) $- $9,000.00 $34,000.00 $59,000.00 $84,000.00 $109,000.00 $134,000.00 $159,000.00 $184,000.00 $209,000.00 $234,000.00 Federal Tax $- $(900.00) $(4,265.00) $(8,015.00) $(13,375.00) $(19,625.00) $(25,875.00) $(32,783.50) $(39,783.50) $(46,791.00) $(55,041.00) Standard Deduction (State) $(6,140.00) $(6,140.00) $(6,140.00) $(6,140.00) $(6,140.00) $(6,140.00) $(6,140.00) $(6,140.00) $(6,140.00) $(6,140.00) $(6,140.00) Taxable Income (State) $- $12,360.00 $37,360.00 $62,360.00 $87,360.00 $112,360.00 $137,360.00 $162,360.00 $187,360.00 $212,360.00 $237,360.00 State Tax $- $(154.50) $(777.04) $(2,029.98) $(3,872.68) $(6,190.79) $(8,578.29) $(10,965.79) $(13,353.29) $(15,740.79) $(18,128.29) Social Security $(620.00) $(1,550.00) $(3,100.00) $(4,650.00) $(6,200.00) $(7,232.30) $(7,588.80) $(7,945.30) $(8,301.80) $(8,658.30) $(9,014.80) Medicare $(145.00) $(362.50) $(725.00) $(1,087.50) $(1,450.00) $(1,812.50) $(2,175.00) $(2,537.50) $(2,900.00) $(3,262.50) $(3,625.00) Earned Income Credit $4,000.00 $1,499.75 $- $- $- $- $- $- $- $- $- Net Income $13,235.00 $23,532.75 $41,132.96 $59,217.52 $75,102.32 $90,139.41 $105,782.91 $120,767.91 $135,661.41 $150,547.41 $164,190.91 Effective Tax Rate -32.4% 5.9% 17.7% 21.0% 24.9% 27.9% 29.5% 31.0% 32.2% 33.1% 34.3% Net Income (incl. health) $11,735.00 $22,032.75 $39,632.96 $57,717.52 $73,602.32 $88,639.41 $104,282.91 $119,267.91 $134,161.41 $149,047.41 $162,690.91 Effective Tax Rate (incl. health) -17.4% 11.9% 20.7% 23.0% 26.4% 29.1% 30.5% 31.8% 32.9% 33.8% 34.9% Retirement Savings (PPP) $- $- $- $- $- $- $- $- $- $- $- Adults 2 1 or 2 Children 2 Adult 1 age 38 Adult 2 age 39 Healthcare $(1,500.00) cost of heath insurance Wage Split 77% ratio of wage 1 to wage 2 Retirement Savings 0% as a percent of wages Assumptions No itemized deductions Two adults are married filing jointly Retirement saving is 401k, capped at the maximum tax-free amount available Does not (yet) consider: capital gains, state or federal tax credits (e.g., child tax credit), traditional IRAs Unknown sales tax is included in PPP Does not include IRAs or interest income Federal Schedule X income > income < tax is this plus this of amount over (Single) $- $8,350.00 $- 10.00% $- source $8,350.00 $33,950.00 $835.00 15.00% $8,350.00 $33,950.00 $82,250.00 $4,675.00 25.00% $33,950.00 $82,250.00 $171,550.00 $16,750.00 28.00% $82,250.00 $171,550.00 $372,950.00 $41,754.00 33.00% $171,550.00 $372,950.00 $108,216.00 35.00% $372,950.00 Federal Schedule Y-1 income > income < tax is this plus this of amount over (Married) $- $16,700.00 $- 10.00% $- source $16,700.00 $67,900.00 $1,670.00 15.00% $16,700.00 $67,900.00 $137,050.00 $9,350.00 25.00% $67,900.00 $137,050.00 $208,850.00 $26,637.50 28.00% $137,050.00 $208,850.00 $372,950.00 $46,741.50 33.00% $208,850.00 $372,950.00 $100,894.50 35.00% $372,950.00 CA Schedule X income > income < tax is this plus this of amount over (single) $- $7,060.00 $- 1.25% $- source $7,060.00 $16,739.00 $88.25 2.25% $7,060.00 $16,739.00 $26,419.00 $306.03 4.25% $16,739.00 $26,419.00 $36,675.00 $717.43 6.25% $26,419.00 $36,675.00 $46,349.00 $1,358.43 8.25% $36,675.00 $46,349.00 $2,156.53 9.55% $46,349.00 CA Schedule Y income > income < tax is this plus this of amount over (married) $- $14,120.00 $- 1.25% $- source $14,120.00 $33,478.00 $176.50 2.25% $14,120.00 $33,478.00 $52,838.00 $612.06 4.25% $33,478.00 $52,838.00 $73,350.00 $1,434.86 6.25% $52,838.00 $73,350.00 $92,698.00 $2,716.86 8.25% $73,350.00 $92,698.00 $4,313.07 9.55% $92,698.00 401k Contribution Theshold age > age < threshold source 0 50 $12,000.00 50 $14,000.00 Earned Income Tax Credit children rate limit threshold phase-out rate 2001 0 7.65% $4,670.00 $5,950.00 7.65% source 1 34.00% $7,140.00 $13,090.00 15.98% 2 40.00% $10,020.00 $13,090.00 21.06%
  • 8. $275,000.00 $300,000.00 $325,000.00 $350,000.00 $275,000.00 $300,000.00 $325,000.00 $350,000.00 $211,750.00 $231,000.00 $250,250.00 $269,500.00 $63,250.00 $69,000.00 $74,750.00 $80,500.00 $275,000.00 $300,000.00 $325,000.00 $350,000.00 $- $- $- $- $- $- $- $- $(1,500.00) $(1,500.00) $(1,500.00) $(1,500.00) $(5,000.00) $(5,000.00) $(5,000.00) $(5,000.00) $(9,500.00) $(9,500.00) $(9,500.00) $(9,500.00) $259,000.00 $284,000.00 $309,000.00 $334,000.00 $(63,291.00) $(71,541.00) $(79,791.00) $(88,041.00) $(6,140.00) $(6,140.00) $(6,140.00) $(6,140.00) $262,360.00 $287,360.00 $312,360.00 $337,360.00 $(20,515.79) $(22,903.29) $(25,290.79) $(27,678.29) $(9,371.30) $(9,727.80) $(10,084.30) $(10,440.80) $(3,987.50) $(4,350.00) $(4,712.50) $(5,075.00) $- $- $- $- $177,834.41 $191,477.91 $205,121.41 $218,764.91 35.3% 36.2% 36.9% 37.5% $176,334.41 $189,977.91 $203,621.41 $217,264.91 35.9% 36.7% 37.3% 37.9% $- $- $- $-
  • 11. Australia (all amounts are annual and in local currency, unless marked as PPP) Gross Income (PPP) $10,000.00 $25,000.00 $50,000.00 $75,000.00 $100,000.00 $125,000.00 $150,000.00 $175,000.00 $200,000.00 $225,000.00 $250,000.00 Gross Income $13,700.00 $34,250.00 $68,500.00 $102,750.00 $137,000.00 $171,250.00 $205,500.00 $239,750.00 $274,000.00 $308,250.00 $342,500.00 Gross Wages $13,700.00 $34,250.00 $68,500.00 $102,750.00 $137,000.00 $171,250.00 $205,500.00 $239,750.00 $274,000.00 $308,250.00 $342,500.00 Wage 1 $10,549.00 $26,372.50 $52,745.00 $79,117.50 $105,490.00 $131,862.50 $158,235.00 $184,607.50 $210,980.00 $237,352.50 $263,725.00 Retirement Savings 1 $- $- $- $- $- $- $- $- $- $- $- Taxable Income 1 $10,549.00 $26,372.50 $52,745.00 $79,117.50 $105,490.00 $131,862.50 $158,235.00 $184,607.50 $210,980.00 $237,352.50 $263,725.00 Tax 1 $(682.35) $(3,055.88) $(9,823.50) $(17,735.25) $(27,686.20) $(37,707.75) $(47,729.30) $(58,073.38) $(69,941.00) $(81,808.63) $(93,676.25) Medicare 1 $- $(395.59) $(791.18) $(1,186.76) $(1,582.35) $(1,977.94) $(2,373.53) $(2,769.11) $(3,164.70) $(3,560.29) $(3,955.88) Wage 2 $3,151.00 $7,877.50 $15,755.00 $23,632.50 $31,510.00 $39,387.50 $47,265.00 $55,142.50 $63,020.00 $70,897.50 $78,775.00 Retirement Savings 2 $- $- $- $- $- $- $- $- $- $- $- Taxable Income 2 $3,151.00 $7,877.50 $15,755.00 $23,632.50 $31,510.00 $39,387.50 $47,265.00 $55,142.50 $63,020.00 $70,897.50 $78,775.00 Tax 2 $- $(281.63) $(1,463.25) $(2,644.88) $(3,826.50) $(5,816.25) $(8,179.50) $(10,542.75) $(12,906.00) $(15,269.25) $(17,632.50) Medicare 2 $- $- $(138.60) $(354.49) $(472.65) $(590.81) $(708.98) $(827.14) $(945.30) $(1,063.46) $(1,181.63) Medicare Surcharge $- $- $- $(1,027.50) $(1,370.00) $(1,712.50) $(2,055.00) $(2,397.50) $(2,740.00) $(3,082.50) $(3,425.00) Private Health Adjustment $- $- $- $- $- $212.50 $555.00 $897.50 $1,240.00 $1,582.50 $1,925.00 Total Tax $(682.35) $(3,733.09) $(12,216.53) $(22,948.88) $(34,937.70) $(47,592.75) $(60,491.30) $(73,712.38) $(88,457.00) $(103,201.63) $(117,946.25) Net Income $13,017.65 $30,516.91 $56,283.48 $79,801.13 $102,062.30 $123,657.25 $145,008.70 $166,037.63 $185,543.00 $205,048.38 $224,553.75 Effective Tax Rate 5.0% 10.9% 17.8% 22.3% 25.5% 27.8% 29.4% 30.7% 32.3% 33.5% 34.4% Retirement Savings $- $- $- $- $- $- $- $- $- $- $- Adults 2 1 or 2 Children 2 Adult 1 age 38 Adult 2 age 39 Healthcare $(1,500.00) cost of private healthcare Wage Split 77% ratio of wage 1 to wage 2 Retirement Savings 0% as a percent of wages Assumptions If medicare surcharge is higher than private healthcare cost, that is paid instead Does not (yet) consider: capital gains, tax credits Retirement saving is superannuation, capped at the maximum tax-free amount available GST is included in PPP Individual Tax Rates income > income < tax is this plus this of amount over source $- $6,000.00 $- 0% $- 2009-10 $6,000.00 $34,000.00 $- 15% $6,000.00 $34,000.00 $80,000.00 $4,200.00 30% $34,000.00 $80,000.00 $180,000.00 $18,000.00 38% $80,000.00 $180,000.00 $56,000.00 45% $180,000.00 Medicare Levy income > income < tax is this plus this of amount over source $- $15,062.00 $- 0% $- $15,062.00 $16,283.00 $- 20% $15,062.00 $16,283.00 $- 1.5% $- Medicare Levy # dependents threshold Surcharge Threshold 0 $100,000.00 (family) 1 $100,000.00 2 $101,500.00 3 $103,000.00 4 $104,500.00 5 $106,000.00 Super Contribution Threshold age > age < threshold source 0 34 $13,934.00 34 48 $38,702.00 49 $95,980.00
  • 12. $275,000.00 $300,000.00 $325,000.00 $350,000.00 $376,750.00 $411,000.00 $445,250.00 $479,500.00 $376,750.00 $411,000.00 $445,250.00 $479,500.00 $290,097.50 $316,470.00 $342,842.50 $369,215.00 $- $- $- $- $290,097.50 $316,470.00 $342,842.50 $369,215.00 $(105,543.88) $(117,411.50) $(129,279.13) $(141,146.75) $(4,351.46) $(4,747.05) $(5,142.64) $(5,538.23) $86,652.50 $94,530.00 $102,407.50 $110,285.00 $- $- $- $- $86,652.50 $94,530.00 $102,407.50 $110,285.00 $(20,527.95) $(23,521.40) $(26,514.85) $(29,508.30) $(1,299.79) $(1,417.95) $(1,536.11) $(1,654.28) $(3,767.50) $(4,110.00) $(4,452.50) $(4,795.00) $2,267.50 $2,610.00 $2,952.50 $3,295.00 $(133,223.08) $(148,597.90) $(163,972.73) $(179,347.55) $243,526.93 $262,402.10 $281,277.28 $300,152.45 35.4% 36.2% 36.8% 37.4% $- $- $- $-
  • 14. United Kingdom - London (all amounts are annual and in local currency, unless marked as PPP) Gross Income (PPP) $10,000.00 $25,000.00 $50,000.00 $75,000.00 $100,000.00 $125,000.00 $150,000.00 $175,000.00 $200,000.00 $225,000.00 $250,000.00 Gross Income £6,380.00 £15,950.00 £31,900.00 £47,850.00 £63,800.00 £79,750.00 £95,700.00 £111,650.00 £127,600.00 £143,550.00 £159,500.00 Gross Wages £6,380.00 £15,950.00 £31,900.00 £47,850.00 £63,800.00 £79,750.00 £95,700.00 £111,650.00 £127,600.00 £143,550.00 £159,500.00 Wage 1 £4,912.60 £12,281.50 £24,563.00 £36,844.50 £49,126.00 £61,407.50 £73,689.00 £85,970.50 £98,252.00 £110,533.50 £122,815.00 Retirement Savings 1 £- £- £- £- £- £- £- £- £- £- £- Personal Allowance 1 -£4,745.00 -£4,745.00 -£4,745.00 -£4,745.00 -£4,745.00 -£4,745.00 -£4,745.00 -£4,745.00 -£4,745.00 -£4,745.00 -£4,745.00 Taxable Income 1 £167.60 £7,536.50 £19,818.00 £32,099.50 £44,381.00 £56,662.50 £68,944.00 £81,225.50 £93,507.00 £105,788.50 £118,070.00 Tax 1 -£16.76 -£1,415.63 -£4,117.56 -£6,945.40 -£11,858.00 -£16,770.60 -£21,683.20 -£26,595.80 -£31,508.40 -£36,421.00 -£41,333.60 NI 1 -£19.87 -£830.45 -£2,181.41 -£3,019.93 -£3,142.74 -£3,265.56 -£3,388.37 -£3,511.19 -£3,634.00 -£3,756.82 -£3,879.63 Wage 2 £1,467.40 £3,668.50 £7,337.00 £11,005.50 £14,674.00 £18,342.50 £22,011.00 £25,679.50 £29,348.00 £33,016.50 £36,685.00 Retirement Savings 2 £- £- £- £- £- £- £- £- £- £- £- Personal Allowance 2 -£4,745.00 -£4,745.00 -£4,745.00 -£4,745.00 -£4,745.00 -£4,745.00 -£4,745.00 -£4,745.00 -£4,745.00 -£4,745.00 -£4,745.00 Taxable Income 2 £- £- £2,592.00 £6,260.50 £9,929.00 £13,597.50 £17,266.00 £20,934.50 £24,603.00 £28,271.50 £31,940.00 Tax 2 £- £- -£327.84 -£1,134.91 -£1,941.98 -£2,749.05 -£3,556.12 -£4,363.19 -£5,170.26 -£5,977.33 -£6,881.60 NI 2 £- £- -£286.55 -£690.09 -£1,093.62 -£1,497.16 -£1,900.69 -£2,304.23 -£2,707.76 -£2,981.65 -£3,018.33 Council Tax -£1,000.00 -£1,000.00 -£1,000.00 -£1,000.00 -£1,000.00 -£1,000.00 -£1,000.00 -£1,000.00 -£1,000.00 -£1,000.00 -£1,000.00 Total Tax -£1,036.63 -£3,246.08 -£7,913.36 -£12,790.32 -£19,036.34 -£25,282.36 -£31,528.38 -£37,774.40 -£44,020.42 -£50,136.79 -£56,113.16 Net Income £5,343.37 £12,703.93 £23,986.64 £35,059.68 £44,763.66 £54,467.64 £64,171.62 £73,875.60 £83,579.58 £93,413.21 £103,386.84 Effective Tax Rate 16.2% 20.4% 24.8% 26.7% 29.8% 31.7% 32.9% 33.8% 34.5% 34.9% 35.2% Adults 2 1 or 2 Children 2 Adult 1 age 38 Adult 2 age 39 Healthcare -£1,500.00 cost of private healthcare Council Tax -£1,000.00 http://www.rbkc.gov.uk/LocalTaxes/counciltax/bands.asp; http://www.lambeth.gov.uk/counciltax/index.shtml#valuation Wage Split 77% ratio of wage 1 to wage 2 Retirement Savings 0% as a percent of wages Assumptions All retirement savings are tax-deductable (e.g., superannuation) Does not (yet) consider: capital gains, working or child tax credits, housing benefit Retirement saving is estimated and simplistic; http://www.inlandrevenue.gov.uk/pdfs/ir2008b.htm; http://www.inlandrevenue.gov.uk/pdfs/ir78.htm VAT is included in PPP Does not include ISAs or interest income Individual Tax Rates income > income < tax is this plus this of amount over source £- £2,020.00 £- 10% £- £2,020.00 £31,400.00 £202.00 22% £2,020.00 £31,400.00 £6,665.60 40% £31,400.00 National Insurance income > income < tax is this plus this of amount over (weekly) £- £91.00 £- 0% £- source £91.00 £610.00 £- 11% £91.00 £610.00 £57.09 1.0% £610.00 Personal Allowance age > Age < allowance source 0 64 £4,745.00 64 74 £6,830.00 74 £6,950.00
  • 15. $275,000.00 $300,000.00 $325,000.00 $350,000.00 £175,450.00 £191,400.00 £207,350.00 £223,300.00 £175,450.00 £191,400.00 £207,350.00 £223,300.00 £135,096.50 £147,378.00 £159,659.50 £171,941.00 £- £- £- £- -£4,745.00 -£4,745.00 -£4,745.00 -£4,745.00 £130,351.50 £142,633.00 £154,914.50 £167,196.00 -£46,246.20 -£51,158.80 -£56,071.40 -£60,984.00 -£4,002.45 -£4,125.26 -£4,248.08 -£4,370.89 £40,353.50 £44,022.00 £47,690.50 £51,359.00 £- £- £- £- -£4,745.00 -£4,745.00 -£4,745.00 -£4,745.00 £35,608.50 £39,277.00 £42,945.50 £46,614.00 -£8,349.00 -£9,816.40 -£11,283.80 -£12,751.20 -£3,055.02 -£3,091.70 -£3,128.39 -£3,165.07 -£1,000.00 -£1,000.00 -£1,000.00 -£1,000.00 -£62,652.66 -£69,192.16 -£75,731.66 -£82,271.16 £112,797.34 £122,207.84 £131,618.34 £141,028.84 35.7% 36.2% 36.5% 36.8%
  • 17. United Kingdom - London (all amounts are annual and in local currency, unless marked as PPP) Gross Income (PPP) $10,000.00 $25,000.00 $50,000.00 $75,000.00 $100,000.00 $125,000.00 $150,000.00 $175,000.00 $200,000.00 Gross Income 96,900.00 kr 242,250.00 kr 484,500.00 kr 726,750.00 kr 969,000.00 kr 1,211,250.00 kr 1,453,500.00 kr 1,695,750.00 kr 1,938,000.00 kr Gross Wages 96,900.00 kr 242,250.00 kr 484,500.00 kr 726,750.00 kr 969,000.00 kr 1,211,250.00 kr 1,453,500.00 kr 1,695,750.00 kr 1,938,000.00 kr Wage 1 74,613.00 kr 186,532.50 kr 373,065.00 kr 559,597.50 kr 746,130.00 kr 932,662.50 kr 1,119,195.00 kr 1,305,727.50 kr 1,492,260.00 kr Retirement Savings 1 - kr - kr - kr - kr - kr - kr - kr - kr - kr Taxable Income 1 74,613.00 kr 186,532.50 kr 373,065.00 kr 559,597.50 kr 746,130.00 kr 932,662.50 kr 1,119,195.00 kr 1,305,727.50 kr 1,492,260.00 kr National Tax 1 - kr - kr -16,253.00 kr -87,934.38 kr -134,567.50 kr -181,200.63 kr -227,833.75 kr -274,466.88 kr -321,100.00 kr Municipal Tax 1 -22,234.67 kr -55,586.69 kr -111,173.37 kr -166,760.06 kr -222,346.74 kr -277,933.43 kr -333,520.11 kr -389,106.80 kr -444,693.48 kr Wage 2 22,287.00 kr 55,717.50 kr 111,435.00 kr 167,152.50 kr 222,870.00 kr 278,587.50 kr 334,305.00 kr 390,022.50 kr 445,740.00 kr Retirement Savings 2 - kr - kr - kr - kr - kr - kr - kr - kr - kr Taxable Income 2 22,287.00 kr 55,717.50 kr 111,435.00 kr 167,152.50 kr 222,870.00 kr 278,587.50 kr 334,305.00 kr 390,022.50 kr 445,740.00 kr National Tax 2 - kr - kr - kr - kr - kr - kr -8,501.00 kr -19,644.50 kr -59,470.00 kr Municipal Tax 2 -6,641.53 kr -16,603.82 kr -33,207.63 kr -49,811.45 kr -66,415.26 kr -83,019.08 kr -99,622.89 kr -116,226.71 kr -132,830.52 kr Total Tax -28,876.20 kr -72,190.50 kr -160,634.00 kr -304,505.88 kr -423,329.50 kr -542,153.13 kr -669,477.75 kr -799,444.88 kr -958,094.00 kr Net Income 68,023.80 kr 170,059.50 kr 323,866.00 kr 422,244.13 kr 545,670.50 kr 669,096.88 kr 784,022.25 kr 896,305.13 kr 979,906.00 kr Effective Tax Rate 29.8% 29.8% 33.2% 41.9% 43.7% 44.8% 46.1% 47.1% 49.4% Adults 2 1 or 2 Children 2 Municipal Tax 29.80% http://www2.stockholm.se/english/cityofsthlm/gov/budget.htm Wage Split 77% ratio of wage 1 to wage 2 Retirement Savings 0% as a percent of wages Assumptions All retirement savings are tax-deductable (e.g., superannuation) Does not (yet) consider: capital gains, tax credits Retirement saving is estimated and simplistic VAT is included in PPP National Tax Rates income > income < tax is this plus this of amount over source - kr 291,800.00 kr - kr 0% - kr 291,800.00 kr 390,400.00 kr - kr 20% 291,800.00 kr 441,300.00 kr 58,360.00 kr 25% 441,300.00 kr
  • 18. $225,000.00 $250,000.00 $275,000.00 $300,000.00 $325,000.00 $350,000.00 2,180,250.00 kr 2,422,500.00 kr 2,664,750.00 kr 2,907,000.00 kr 3,149,250.00 kr 3,391,500.00 kr 2,180,250.00 kr 2,422,500.00 kr 2,664,750.00 kr 2,907,000.00 kr 3,149,250.00 kr 3,391,500.00 kr 1,678,792.50 kr 1,865,325.00 kr 2,051,857.50 kr 2,238,390.00 kr 2,424,922.50 kr 2,611,455.00 kr - kr - kr - kr - kr - kr - kr 1,678,792.50 kr 1,865,325.00 kr 2,051,857.50 kr 2,238,390.00 kr 2,424,922.50 kr 2,611,455.00 kr -367,733.13 kr -414,366.25 kr -460,999.38 kr -507,632.50 kr -554,265.63 kr -600,898.75 kr -500,280.17 kr -555,866.85 kr -611,453.54 kr -667,040.22 kr -722,626.91 kr -778,213.59 kr 501,457.50 kr 557,175.00 kr 612,892.50 kr 668,610.00 kr 724,327.50 kr 780,045.00 kr - kr - kr - kr - kr - kr - kr 501,457.50 kr 557,175.00 kr 612,892.50 kr 668,610.00 kr 724,327.50 kr 780,045.00 kr -73,399.38 kr -87,328.75 kr -101,258.13 kr -115,187.50 kr -129,116.88 kr -143,046.25 kr -149,434.34 kr -166,038.15 kr -182,641.97 kr -199,245.78 kr -215,849.60 kr -232,453.41 kr -1,090,847.00 kr -1,223,600.00 kr -1,356,353.00 kr -1,489,106.00 kr -1,621,859.00 kr -1,754,612.00 kr 1,089,403.00 kr 1,198,900.00 kr 1,308,397.00 kr 1,417,894.00 kr 1,527,391.00 kr 1,636,888.00 kr 50.0% 50.5% 50.9% 51.2% 51.5% 51.7%
  • 20. Country PPP source US 1.000 AU 1.370 UK 0.638 SE 9.690