The Global Soda Ash Market has been analyzed By Product Type (Light, Dense), By Process Type (Natural, Synthetic) and By Application (Glass and Ceramics, Soaps and Detergents, Chemical, Metallurgy, Others). Request free Sample of this Report @ http://azothanalytics.com/report/chemicals/global-soda-ash-market-volume-value-analysis-by-product-type-light-dense-process-type-natural-synthetic-by-application-glass-and-ceramics-soaps-and-detergents-chemical-metallurgical-by-region-by-country-2019-edition-opportunities-and-forecast-2014-2024-r33212
Visit us: http://azothanalytics.com/research/chemicals-c6
Ilham Kadri at Solvay 2019 shareholders meetingSolvay Group
Solvay invites all shareholders, regardless of the number of shares they hold, to take part in the Shareholders’ Meeting. The Meeting is a special opportunity to talk with Solvay’s Management, learn about the Group’s results and objectives, and take part in the decision-making process.
We updated investors in London on our portfolio, with next generation mobility & resource efficiency as key markets and key levers that will enable us to deliver superior and #sustainable value growth. Our transformation and innovation-focused growth have delivered strong profits and cash in the past few years. Looking ahead, we will leverage on our differentiated technologies and our simpler organization to innovate and to better partner with our customers to generate superior growth. www.solvay.com/en/investors/solvay-event-calendar/capital-markets-day
Brazil petroleum and natural gas market outlook to 2016 executive summaryAMMindpower
The report titled “Brazil Petroleum and Natural Gas Market Outlook to 2016 - Opportunities in Pre-Salt Region” provides a comprehensive analysis of market size of petroleum and natural gas industry on the basis of petroleum industry and natural gas industry.
IMO 2020: Are you Ready?_TRANSPOREON Group_20190516Vivien Cheong
The Path Forward: Managing the Fuel Component of trans-Pacific 2019-2020 Contracting Cycle
Request a detailed explanation of how your carrier’s trade factors are calculated
Be able to validate the assumptions including ship size, speed and industrial utilization against industry benchmarks
Understand the timing for your carrier’s implementation of the new fuel formula. Will it go into effect in January 2020 or sooner?
Understand the impact for each carriers’ all-in-rate (ocean plus bunker) based on future changes in the fuel prices, both up and down.
Ensure contracts address failure to come to agreement on how future fuel surcharges will be dealt with as well as protection in place for space commitments and price from time of implementation until the end of contract.
Be prepared to offer your own fuel formula to carriers where there is a lack of clarify
Ensure your own formula is fair for both sides
Engage industry experts where needed to provide analytical support for validation and negotiations
Reward carriers that offer clarity and transparency with commitments for cargo
Impact IMO sulphur regulations on Rotterdam, Platts european bunker fuel conf...Ronald Backers
What would be certain and uncertain in the coming years concerning the decision of the IMO to start the new sulphur cap for bunker fuels in 2020? It's about production, storage and demand of fuel oil, blend components, LNG etcetera
New base energy news issue 889 dated 20 july 2016Khaled Al Awadi
NewBase Special 20 July 2016
Greetings,
Attached FYI (NewBase Special 20 July 2016 ) , from Hawk Energy Services Dubai . Daily energy news covering the MENA area and related worldwide energy news. In today’s issue you will find news about:-
• Saudi Arabia: S78 Red Sea seismic surveyNEW by Sonardyne acoustics
• GCC: Annual façades spending to hit $12bn by 2024(Saudi 41.8%)
• UK:North Sea Field Shutdowns to Climb as Brexit Deepens Oil Gloom
• Nigeria and Gabon: Panoro Energy operations updates
• Crude oil futures rise after US stockpiles fall
• Oil prices won't suffer a 2015-style price collapse, says Citi's Morse
• SolarCity gigafactory brightens New York's manufacturing revival
we would appreciate your actions to send to all interested parties that you may wish. Also note that if you or your organization wish to include your own article or advert in our circulations, please send it to :- khdmohd@hotmail.com or khdmohd@hawkenergy.net
Best Regards.
Khaled Al Awadi
Energy Consultant & NewBase Chairman - Senior Chief Editor
MS & BS Mechanical Engineering (HON), USA
Emarat member since 1990
ASME meme since 1995
Hawk Energy since 2010
Saudi Arabia Masterbatch Market Forecast and Opportunities, 2019TechSci Research
High investments in petrochemical sector, easy availability of raw material and significant growth across major end user industries to buoy masterbatch demand in Saudi Arabia.
Global Cocoa Butter Equivalent (CBE) Market (Volume, Value) stella thomson
A comprehensive research report created through extensive primary research (inputs from industry experts, companies, stakeholders) and secondary research, the report aims to present the analysis of Global Cocoa Butter Equivalent Market. Request free Sample of this Report @: http://azothanalytics.com/report/chemicals/global-cocoa-butter-equivalent-cbe-market-volume-value-analysis-by-product-type-shea-butter-palm-oil-fraction-kokum-butter-illipe-butter-end-user-confectionary-food-and-beverage-by-region-by-country-2019-edition-opportunities-and-forecast-2014-2024-r33203
Cocoa Butter Equivalent Analysis
Visit us: http://azothanalytics.com/research/chemicals-c6
Global Benzotrifluoride Market Forecast (2014-2024) stella thomson
A comprehensive research report created through extensive primary research (inputs from industry experts, companies, stakeholders) and secondary research, the report aims to present the analysis of Global Benzotrifluoride Market.Visit us: http://azothanalytics.com/report/chemicals/global-benzotrifluoride-market-analysis-by-derivative-aminobenzotrifluoride-chlorobenzotrifluoride-bromobenzotrifluoride-hydroxybenzotrifluoride-by-sub-derivatives-by-application-by-region-by-country-2019-edition-opportunities-and-forecast-2014-2024-r33207
A comprehensive research report created through extensive primary research (inputs from industry experts, companies, stakeholders) and secondary research, the report aims to present the analysis of Global Specialty Polymers Market. Request free Sample of this Report @: http://azothanalytics.com/report/chemicals/global-specialty-polymer-market-analysis-by-type-thermoplastics-biodegradable-conducting-electroluminescent-liquid-crystal-polymer-by-application-by-region-by-country-2019-edition-opportunities-and-forecast-2014-2024-r33202
Global Water Purifier Market (2018 Edition): Forecast to 2022 AzothAnalytics
The demand for water purifiers across the globe has been steadily rising due to the growing need to use water that is free from contamination for a wide range of applications including drinking, cooking, industrial processing, sanitation & sterilization etc. The rising population especially in developing countries, the discharge of industrial waste directly into surface water, contamination of ground water with chemicals, aging of drainage pipes and poor water management and conservation efforts have resulted in a sharp decline in the quality of water that is supplied through public networks. The contamination of water with dissolved solids, viruses and bacteria not only limits the usefulness of the water for use in irrigation, commercial activities and industrial operations but the consumption of such water results in the spread of water borne diseases including diarrhea, cholera, dysentery etc especially in villages where people are dependent on wells and public taps for water supply as well as in industrial centers where untreated sewage and factory waste are often dumped into nearby water bodies. Consumers across the globe are becoming increasingly sensitized to the issue of water contamination and have begun to increasingly rely upon water purifiers to remove harmful impurities from water.
Global Oilfield Specialty Chemical Market: Forecast to 2022 AzothAnalytics
Specialty oilfield market is likely to witness substantial growth over the forecasted period owing to increasing application in cementing, drilling, production and Well Stimulation. Increasing crude oil production coupled with growing demand from enhanced oil recovery application is anticipated to augment specialty oilfield chemicals market growth. In addition, increasing deep drilling and ultra-deep drilling activities for oil and gas have been driving the market over the past few years and trend is expected to continue over the forecast period.
Gourmet Salts Market size is projected to reach USD 13.85 Billion by 2027 from an estimated USD 7.80 Billion in 2021, growing at a CAGR of 7.87% globally.
According to this latest study, Gourmet Salts Market size is projected to reach USD 13.85 Billion by 2027 from an estimated USD 7.80 Billion in 2021, growing at a CAGR of 7.87% globally.
Global Sustainable Aviation Fuel Market Research Report: Forecast (2021-2026)...MarkNtel Advisors
According to the MarkNtel Advisors' research report, "Global Sustainable Aviation Fuel Market Analysis, 2021," the market is expected to grow at a CAGR of around 35% during 2021-26.
Full Report -https://www.marknteladvisors.com/research-library/global-sustainable-aviation-fuel-market.html
The Organic Coffee Market size was valued at USD 6.5 Billion in 2019, and is projected to reach USD 11.5 Billion by 2027, registering a CAGR of 7.2% during the forecast period.
Sodium Cumenesulfonate Market: Comprehensive Study by Key Players, Growth O...Stringent Datalytics
The global sodium cumenesulfonate market has witnessed significant growth in recent years, driven by the increasing demand for the compound across various industries
The Organic Coffee Market size was valued at USD 7.47 Billion in 2021 and is projected to reach USD 12.15 Billion by 2028, registering a CAGR of 7.2% during the forecast period.
Global Industrial Actuators Market Researchstella thomson
The Global Industrial Actuator market has been assessed By Region (Americas, Europe, Asia Pacific, Middle East Africa) and By Country (United States, Canada, Mexico, Brazil, Rest of Americas, Germany, France, Italy, United Kingdom, Rest of Europe, China, Japan, India, Rest of APAC, Middle east, Africa) for the historical period of 2014-2018 and the forecast period of 2019-2024.
Visit us: http://azothanalytics.com/report/construction-manufacturing/global-industrial-actuators-market-analysis-by-system-electrical-mechanical-hydraulic-pneumatic-by-motion-type-linear-rotary-end-user-oil-and-gas-chemical-power-water-treatment-by-region-by-country-2019-edition-opportunities-and-forecast-2014-2024-r33217
Global Beverage Dispenser Equipment Market Researchstella thomson
The Global Beverage Dispenser Equipment market has been analysed By Region (Europe, Americas, Asia Pacific, Middle East, Africa) and By Country (United Kingdom, Germany, France, Spain, Italy, China, United States, Canada, Mexico, Brazil, India, Australia, Japan, UAE, Qatar, Saudi Arabia, South, Africa, Morocco, Nigeria) for the historical period of 2014-2018 and the forecast period of 2019-2024. Visit us: http://azothanalytics.com/report/food-beverage/global-beverage-dispenser-equipment-market-world-market-review-by-dispenser-type-by-beverage-end-use-by-technology-2019-edition-opportunities-and-forecast-2013-2023-r33211
A comprehensive research report created through extensive primary research (inputs from industry experts, companies, stakeholders) and secondary research, the report aims to present the analysis of Global Bed and Bath Linen MarketRequest free Sample of this Report @ http://azothanalytics.com/report/consumer-retail/global-bed-and-bath-linen-market-analysis-by-product-type-bedding-sets-duvet-covers-bedspreads-quilts-pillow-cases-and-sheets-blankets-towels-by-end-user-residential-commercial-by-region-by-country-2019-edition-opportunities-and-forecast-2014-2024-r33209
Visit us: http://azothanalytics.com/research/consumer-retail-c4
Global Transmission and Distribution Equipment Analysisstella thomson
The Global Transmission and Distribution Equipment market has been assessed for the historical period of 2014-2018 and the forecast period of 2019-2024). Request free Sample of this Report @ http://azothanalytics.com/report/energy-utilities/global-transmission-and-distribution-equipment-market-analysis-by-equipment-type-switchgear-transformer-meters-inductors-and-capacitors-by-switchgear-type-by-voltage-type-by-region-by-country-2019-edition-opportunities-and-forecast-2014-2024-r33214
Visit us: http://azothanalytics.com/research/energy-utilities-c2
A comprehensive research report created through extensive primary research (inputs from industry experts, companies, stakeholders) and secondary research, the report aims to present the analysis of Global Automotive Sensors Market.
Request free Sample of this Report @
http://azothanalytics.com/report/automotive-transportation/global-automotive-sensors-market-analysis-by-vehicle-type-passenger-car-lcv-hcv-by-application-powertrain-body-and-convenience-chassis-and-safety-body-electronics-by-region-by-country-2019-edition-opportunities-and-forecast-2014-2024-r33216
Visit us: http://azothanalytics.com/research/automotive-transportation-c3
Global Oil and Gas Pipeline Leak Detection System Market Researchstella thomson
A comprehensive research report created through extensive primary research (inputs from industry experts, companies, stakeholders) and secondary research, the report aims to present the analysis of Global Oil and Gas Pipeline Leak Detection System Market. The Global Oil and Gas Pipeline Leak Detection System market has been analysed By Equipment (Thermal Imaging, Flow Meters, Pressure Sensors, Fibre Optics, Acoustic Sensors, Software Systems) and By Application(Offshore, Onshore). Request free Sample of this Report @ http://azothanalytics.com/report/energy-utilities/global-oil-and-gas-pipeline-leak-detection-system-market-analysis-by-equipment-thermal-imaging-flow-meter-pressure-sensor-fibre-optics-acoustic-sensor-software-systems-by-application-by-region-by-country-2019-edition-opportunities-and-forecast-2014-2024-r33213
Visit us:http://azothanalytics.com/research/energy-utilities-c2
Global DronesMarket Forecast (2014-2024) DronesMarketIndustrystella thomson
A comprehensive research report created through extensive primary research (inputs from industry experts, companies, stakeholders) and secondary research, the report aims to present the analysis of drone market. Request free Sample of this Report @: http://azothanalytics.com/report/it-telecom/global-drones-market-analysis-by-type-rotary-wing-fixed-wing-hybrid-by-application-surveying-agriculture-mining-construction-entertainment-end-user-military-commercial-consumer-by-region-by-country-2019-edition-opportunities-and-forecast-2014-2024-r32198
Artificial Intelligence in Healthcare Market Forecast to 2024stella thomson
The report analyzes the artificial intelligence in healthcare market, By Component (Hardware, Software and Services), By Technology (Natural Language Processing, Machine Learning and Others), By End User (Healthcare Providers, Pharmaceutical Organizations and Others). Request free Sample of this Report @: http://azothanalytics.com/report/healthcare-pharma/artificial-intelligence-in-healthcare-market-world-market-analysis-by-component-hardware-software-services-technology-natural-language-processing-machine-learning-end-user-by-region-by-country-2019-edition-forecast-to-2024-r33199
Visit us: http://azothanalytics.com/research/healthcare-pharma-c1
Global Engineered Quartz (E-Quartz) Surface Market (Value, Volume) stella thomson
The report analyzes the Engineered Quartz Surface Market By Type Of Sector (Residential and Commercial), By Application (Countertop, Vanity top, Wall Panel, Floor Tile, Other Surfaces), By Sizes (120*56.5 inches, 130*65 inches), By Thickness (0.5 inch, 0.75 inch, 1.25 inch), By Sales Channel (Direct Sales, Distributors).Request free Sample of this Report @: http://azothanalytics.com/report/construction-manufacturing/global-engineered-quartz-e-quartz-surface-market-value-volume-analysis-by-sector-residential-commercial-application-countertop-vanity-top-wall-panel-floor-tile-by-size-by-thickness-by-sales-channel-2019-edition-opportunities-and-forecast-2014-2024-r33198
Visit us: http://azothanalytics.com/research/construction-manufacturing-c11
A comprehensive research report created through extensive primary research (inputs from industry experts, companies, stakeholders) and secondary research, the report aims to present the analysis of COPD Drugs Market. The report analyses the COPD Drugs Market By Drug Type (Combination Therapy Drugs, Anticholinergics, Beta-Agonist, Inhaled Corticosteroids, andOthers). The report analyses the COPD Drugs Market, By Region (North America, Europe, Asia Pacific, Rest of the World) and By Country (U.S., Canada, Germany, U.K, France, Italy, China, Japan, India) for the historical period of 2013-2017 and the forecast period of 2018-2023. This report also includes pipeline analysis for few COPD drugs. Request free Sample of this Report @ http://azothanalytics.com/report/healthcare-pharma/global-copd-drugs-market-analysis-by-drug-type-combination-therapy-anticholinergics-beta-agonist-inhaled-corticosteroids-others-pipeline-drugs-by-region-by-country-2019-edition-forecast-to-2023-r29194 COPD Drugs Market Analysis
Visit us: http://azothanalytics.com/research/healthcare-pharma-c1
Large Format Ceramic Panel Market (2019 Edition)stella thomson
A comprehensive research report created through extensive primary research (inputs from industry experts, companies, stakeholders) and secondary research, the report aims to present the analysis of Global Large Format Ceramic Panel Market. The report on large format ceramic panel market has been analysed by both volume and value. The market has been analysed By Application (Flooring, Interior Wall, Exterior Cladding and Countertops), By Thickness (3mm &below,5 to 9mm, 9.1 to12mm and 12mm & above) for the Region (North America, Europe, Asia Pacific, G.C.C and ROW) and Country (United States, Canada, Mexico, Germany, Italy, United Kingdom, Belgium, Holland, Spain, Russia, China, India, Indonesia, Saudi Arabia, UAE, Qatar). The global large format ceramic panel market has been assessed for the historical period of 2014-2018 and the forecast period of 2019-2024. Request free Sample of this Report @ http://azothanalytics.com/report/construction-manufacturing/large-format-ceramic-panel-market-2019-edition-world-market-review-and-forecast-to-2024-by-application-flooring-interior-wall-exterior-wall-cladding-countertop-by-thickness-3mm-and-below-5-9-mm-91-12-mm-20-mm-and-above-by-region-by-country-2014-2024-r30196
Visit us: http://azothanalytics.com/research/construction-manufacturing-c11
Global aerospace inconel blisk market reportstella thomson
A comprehensive research report created through extensive primary research (inputs from industry experts, companies, stakeholders) and secondary research, the report aims to present the analysis of Global Aerospace Inconel Blisk Market. The report analyses the Global Aerospace Inconel Blisk Market By Application (Commercial, Military), By Region (North America, Europe, APAC) and By Country (US, Canada, UK, France, Germany, Russia, Singapore, China). The report assesses the Global Aerospace Inconel Blisk Market for the historical period of 2013-2017 and the forecast period of 2018-2023. Request free Sample of this Report @
http://azothanalytics.com/report/construction-manufacturing/global-aerospace-inconel-blisk-market-analysis-by-application-commercial-military-by-region-by-country-2019-edition-opportunities-and-forecast-2013-2023-r29198
Global Industrial Sensor Market Forecast (2013-2023) stella thomson
A comprehensive research report created through extensive primary research (inputs from industry experts, companies, stakeholders) and secondary research, the report aims to present the analysis of Global Industrial Sensors Market. Request free Sample of this Report @
http://azothanalytics.com/report/it-telecom/global-industrial-sensor-market-analysis-by-sensor-type-level-image-gas-pressure-position-force-flow-temperature-humidity-by-positional-type-contact-non-contact-by-end-user-by-region-by-country-2019-edition-opportunities-and-forecast-2013-2023-r30194
Global Electrostatic Precipitator Market: Analysis By System Type (Dry Electrostatic Precipitator, Wet Electrostatic Precipitator) visit us: https://bit.ly/2Svq5q2
ATM market is driven by the pattern in the currency demand in the Banking Industry. The main factor driving the ATM market is the competition among the banks to provide convenient banking to its customers.
ATM market is a growing market with the increasing demand of machines in the financial sector. Globally, ATM market has seen moderate pace of growth over the last five years on account of increasing number of people being incorporated in the banking system in different regions. During 2016-21, Global ATM Market is anticipated to grow at moderate rate on account of more banking population and technological advancements in the equipment. Visit us: http://azothanalytics.com/report/services/global-atm-market-insights-and-analysis-growth-penetration-and-demand-forecast-to-2021-r41
Global Vacation Ownership (Timeshare) Analysisstella thomson
A comprehensive research report created through extensive primary research (inputs from industry experts, companies, stakeholders) and secondary research, the report aims to present the analysis of “Global Vacation Ownership (Timeshare) Market. The report analyses thel Vacation Ownership (Timeshare) Market By Product Type (Point based ownership, Week-based ownership), By End Users (Private and Group). The Global Vacation Ownership (Timeshare) Market has been analysed By Region (North America, Central & South America, Caribbean, EMEA, Asia-Pacific) and By Country (U.S., Canada, Mexico, Aruba, Jamaica, United Kingdom, Germany, Dubai, China, India, Australia) for the historical period of 2013-2017 and the forecast period of 2018-2023. Request free Sample of this Report @ http://azothanalytics.com/report/services/global-vacation-ownership-timeshare-market-analysis-by-type-travel-clubs-fractional-by-end-users-private-group-by-region-by-country-2019-edition-opportunities-and-forecast-2013-2023-r28199
A comprehensive research report created through extensive primary research (inputs from industry experts, companies, stakeholders) and secondary research, the report aims to present the analysis of Antifungal Drugs Market. The report analyses the Antifungal Drugs Market By Drug Type (Azoles, Echinocandins, Polyenes, Others), By Therapeutic Indications (Candidiasis, Aspergillosis, Dermatophytosis, Others). The report analyses the Antifungal Drugs Market, By Region (North America, Europe, Asia Pacific, Rest of the World) and By Country (U.S., Canada, Germany, U.K, France, China, Japan, India) for the historical period of 2013-2017 and the forecast period of 2018-2023.Visit us: http://azothanalytics.com/report/healthcare-pharma/global-antifungal-drugs-market-analysis-by-drug-class-azoles-echinocandins-polyenes-others-by-therapeutic-indications-candidiasis-aspergillosis-dermatophytosis-others-by-region-by-country-2019-edition-opportunities-and-forecast-2013-2023-r28194
A comprehensive research report created through extensive primary research (inputs from industry experts, companies, stakeholders) Visit us: http://azothanalytics.com/report/healthcare-pharma/global-nuclear-medicine-market-analysis-by-product-type-diagnostic-therapeutic-by-diagnostic-nuclear-medicine-type-by-therapeutic-nuclear-medicine-type-by-indication-by-region-by-country-2019-edition-opportunities-and-forecast-2013-2023-r28197
Global Endoscopy Devices Market Forecast (2013-2023)stella thomson
A comprehensive research report created through extensive primary research (inputs from industry experts. Visit us: http://azothanalytics.com/report/healthcare-pharma/global-endoscopy-devices-market-analysis-by-type-rigid-flexible-capsule-application-arthroscopy-bronchoscopy-colonoscopy-laparoscopy-gi-endoscopy-others-by-end-user-hospital-clinic-by-region-by-country-2019-edition-opportunities-and-forecast-2013-2023-r28201
A comprehensive research report created through extensive primary research (inputs from industry experts, companies, stakeholders) Visit us: http://azothanalytics.com/report/chemicals/global-fluoropolymer-market-analysis-by-type-ptfe-pvdf-fep-etfe-others-by-application-automotive-electrical-electronics-industrial-processing-construction-medical-others-by-region-by-country-2019-edition-opportunities-and-forecast-2013-2023-r28196
The world of search engine optimization (SEO) is buzzing with discussions after Google confirmed that around 2,500 leaked internal documents related to its Search feature are indeed authentic. The revelation has sparked significant concerns within the SEO community. The leaked documents were initially reported by SEO experts Rand Fishkin and Mike King, igniting widespread analysis and discourse. For More Info:- https://news.arihantwebtech.com/search-disrupted-googles-leaked-documents-rock-the-seo-world/
3.0 Project 2_ Developing My Brand Identity Kit.pptxtanyjahb
A personal brand exploration presentation summarizes an individual's unique qualities and goals, covering strengths, values, passions, and target audience. It helps individuals understand what makes them stand out, their desired image, and how they aim to achieve it.
"𝑩𝑬𝑮𝑼𝑵 𝑾𝑰𝑻𝑯 𝑻𝑱 𝑰𝑺 𝑯𝑨𝑳𝑭 𝑫𝑶𝑵𝑬"
𝐓𝐉 𝐂𝐨𝐦𝐬 (𝐓𝐉 𝐂𝐨𝐦𝐦𝐮𝐧𝐢𝐜𝐚𝐭𝐢𝐨𝐧𝐬) is a professional event agency that includes experts in the event-organizing market in Vietnam, Korea, and ASEAN countries. We provide unlimited types of events from Music concerts, Fan meetings, and Culture festivals to Corporate events, Internal company events, Golf tournaments, MICE events, and Exhibitions.
𝐓𝐉 𝐂𝐨𝐦𝐬 provides unlimited package services including such as Event organizing, Event planning, Event production, Manpower, PR marketing, Design 2D/3D, VIP protocols, Interpreter agency, etc.
Sports events - Golf competitions/billiards competitions/company sports events: dynamic and challenging
⭐ 𝐅𝐞𝐚𝐭𝐮𝐫𝐞𝐝 𝐩𝐫𝐨𝐣𝐞𝐜𝐭𝐬:
➢ 2024 BAEKHYUN [Lonsdaleite] IN HO CHI MINH
➢ SUPER JUNIOR-L.S.S. THE SHOW : Th3ee Guys in HO CHI MINH
➢FreenBecky 1st Fan Meeting in Vietnam
➢CHILDREN ART EXHIBITION 2024: BEYOND BARRIERS
➢ WOW K-Music Festival 2023
➢ Winner [CROSS] Tour in HCM
➢ Super Show 9 in HCM with Super Junior
➢ HCMC - Gyeongsangbuk-do Culture and Tourism Festival
➢ Korean Vietnam Partnership - Fair with LG
➢ Korean President visits Samsung Electronics R&D Center
➢ Vietnam Food Expo with Lotte Wellfood
"𝐄𝐯𝐞𝐫𝐲 𝐞𝐯𝐞𝐧𝐭 𝐢𝐬 𝐚 𝐬𝐭𝐨𝐫𝐲, 𝐚 𝐬𝐩𝐞𝐜𝐢𝐚𝐥 𝐣𝐨𝐮𝐫𝐧𝐞𝐲. 𝐖𝐞 𝐚𝐥𝐰𝐚𝐲𝐬 𝐛𝐞𝐥𝐢𝐞𝐯𝐞 𝐭𝐡𝐚𝐭 𝐬𝐡𝐨𝐫𝐭𝐥𝐲 𝐲𝐨𝐮 𝐰𝐢𝐥𝐥 𝐛𝐞 𝐚 𝐩𝐚𝐫𝐭 𝐨𝐟 𝐨𝐮𝐫 𝐬𝐭𝐨𝐫𝐢𝐞𝐬."
Memorandum Of Association Constitution of Company.pptseri bangash
www.seribangash.com
A Memorandum of Association (MOA) is a legal document that outlines the fundamental principles and objectives upon which a company operates. It serves as the company's charter or constitution and defines the scope of its activities. Here's a detailed note on the MOA:
Contents of Memorandum of Association:
Name Clause: This clause states the name of the company, which should end with words like "Limited" or "Ltd." for a public limited company and "Private Limited" or "Pvt. Ltd." for a private limited company.
https://seribangash.com/article-of-association-is-legal-doc-of-company/
Registered Office Clause: It specifies the location where the company's registered office is situated. This office is where all official communications and notices are sent.
Objective Clause: This clause delineates the main objectives for which the company is formed. It's important to define these objectives clearly, as the company cannot undertake activities beyond those mentioned in this clause.
www.seribangash.com
Liability Clause: It outlines the extent of liability of the company's members. In the case of companies limited by shares, the liability of members is limited to the amount unpaid on their shares. For companies limited by guarantee, members' liability is limited to the amount they undertake to contribute if the company is wound up.
https://seribangash.com/promotors-is-person-conceived-formation-company/
Capital Clause: This clause specifies the authorized capital of the company, i.e., the maximum amount of share capital the company is authorized to issue. It also mentions the division of this capital into shares and their respective nominal value.
Association Clause: It simply states that the subscribers wish to form a company and agree to become members of it, in accordance with the terms of the MOA.
Importance of Memorandum of Association:
Legal Requirement: The MOA is a legal requirement for the formation of a company. It must be filed with the Registrar of Companies during the incorporation process.
Constitutional Document: It serves as the company's constitutional document, defining its scope, powers, and limitations.
Protection of Members: It protects the interests of the company's members by clearly defining the objectives and limiting their liability.
External Communication: It provides clarity to external parties, such as investors, creditors, and regulatory authorities, regarding the company's objectives and powers.
https://seribangash.com/difference-public-and-private-company-law/
Binding Authority: The company and its members are bound by the provisions of the MOA. Any action taken beyond its scope may be considered ultra vires (beyond the powers) of the company and therefore void.
Amendment of MOA:
While the MOA lays down the company's fundamental principles, it is not entirely immutable. It can be amended, but only under specific circumstances and in compliance with legal procedures. Amendments typically require shareholder
Improving profitability for small businessBen Wann
In this comprehensive presentation, we will explore strategies and practical tips for enhancing profitability in small businesses. Tailored to meet the unique challenges faced by small enterprises, this session covers various aspects that directly impact the bottom line. Attendees will learn how to optimize operational efficiency, manage expenses, and increase revenue through innovative marketing and customer engagement techniques.
Personal Brand Statement:
As an Army veteran dedicated to lifelong learning, I bring a disciplined, strategic mindset to my pursuits. I am constantly expanding my knowledge to innovate and lead effectively. My journey is driven by a commitment to excellence, and to make a meaningful impact in the world.
Cracking the Workplace Discipline Code Main.pptxWorkforce Group
Cultivating and maintaining discipline within teams is a critical differentiator for successful organisations.
Forward-thinking leaders and business managers understand the impact that discipline has on organisational success. A disciplined workforce operates with clarity, focus, and a shared understanding of expectations, ultimately driving better results, optimising productivity, and facilitating seamless collaboration.
Although discipline is not a one-size-fits-all approach, it can help create a work environment that encourages personal growth and accountability rather than solely relying on punitive measures.
In this deck, you will learn the significance of workplace discipline for organisational success. You’ll also learn
• Four (4) workplace discipline methods you should consider
• The best and most practical approach to implementing workplace discipline.
• Three (3) key tips to maintain a disciplined workplace.
Enterprise Excellence is Inclusive Excellence.pdfKaiNexus
Enterprise excellence and inclusive excellence are closely linked, and real-world challenges have shown that both are essential to the success of any organization. To achieve enterprise excellence, organizations must focus on improving their operations and processes while creating an inclusive environment that engages everyone. In this interactive session, the facilitator will highlight commonly established business practices and how they limit our ability to engage everyone every day. More importantly, though, participants will likely gain increased awareness of what we can do differently to maximize enterprise excellence through deliberate inclusion.
What is Enterprise Excellence?
Enterprise Excellence is a holistic approach that's aimed at achieving world-class performance across all aspects of the organization.
What might I learn?
A way to engage all in creating Inclusive Excellence. Lessons from the US military and their parallels to the story of Harry Potter. How belt systems and CI teams can destroy inclusive practices. How leadership language invites people to the party. There are three things leaders can do to engage everyone every day: maximizing psychological safety to create environments where folks learn, contribute, and challenge the status quo.
Who might benefit? Anyone and everyone leading folks from the shop floor to top floor.
Dr. William Harvey is a seasoned Operations Leader with extensive experience in chemical processing, manufacturing, and operations management. At Michelman, he currently oversees multiple sites, leading teams in strategic planning and coaching/practicing continuous improvement. William is set to start his eighth year of teaching at the University of Cincinnati where he teaches marketing, finance, and management. William holds various certifications in change management, quality, leadership, operational excellence, team building, and DiSC, among others.
Explore our most comprehensive guide on lookback analysis at SafePaaS, covering access governance and how it can transform modern ERP audits. Browse now!
As a business owner in Delaware, staying on top of your tax obligations is paramount, especially with the annual deadline for Delaware Franchise Tax looming on March 1. One such obligation is the annual Delaware Franchise Tax, which serves as a crucial requirement for maintaining your company’s legal standing within the state. While the prospect of handling tax matters may seem daunting, rest assured that the process can be straightforward with the right guidance. In this comprehensive guide, we’ll walk you through the steps of filing your Delaware Franchise Tax and provide insights to help you navigate the process effectively.
Discover the innovative and creative projects that highlight my journey throu...dylandmeas
Discover the innovative and creative projects that highlight my journey through Full Sail University. Below, you’ll find a collection of my work showcasing my skills and expertise in digital marketing, event planning, and media production.
Unveiling the Secrets How Does Generative AI Work.pdfSam H
At its core, generative artificial intelligence relies on the concept of generative models, which serve as engines that churn out entirely new data resembling their training data. It is like a sculptor who has studied so many forms found in nature and then uses this knowledge to create sculptures from his imagination that have never been seen before anywhere else. If taken to cyberspace, gans work almost the same way.
Unveiling the Secrets How Does Generative AI Work.pdf
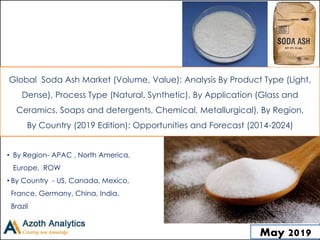
Global Soda Ash Market Forecast (Volume, Value)
1. Global Soda Ash Market (Volume, Value): Analysis By Product Type (Light,
Dense), Process Type (Natural, Synthetic), By Application (Glass and
Ceramics, Soaps and detergents, Chemical, Metallurgical), By Region,
By Country (2019 Edition): Opportunities and Forecast (2014-2024)
• By Region- APAC , North America,
Europe, ROW
• By Country - US, Canada, Mexico,
France, Germany, China, India,
Brazil
May 20191
3. 2014 2015 2016 2017 2018 2019 2020 2021 2022 2023 2024
Country
Market (By Value )
By Application, By
Volume
Glass
Chemical
Soaps and
Detergents
Metallurgy
Others
Company Analysis
Tata Chemicals, Solvay, Ciner, Genesis Alkali, NIRMA Limited, Shandong Haihua, Ciech SA, Tangshan Sanyou Chaemicals,
Solvay
Regional Analysis North America, Europe, APAC and ROW
Country Analysis U.S, Canada, Germany, U.K, France, China, India, Japan and Brazil
Scope of the Report – Soda Ash Market
3
4. Table of Content
S.No Particulars Page
No.
1. Research Methodology 23
2. Executive Summary 24
3. Strategic Recommendation 25
3.1 Focus on Different Application of Soda Ash 26
3.2 Asia Pacific Region to witness highest growth during forecast period. 27
4. Product Overview 28
5. Global Soda Ash Market: Growth and Forecast 33
5.1 By Value (2014-2018) 34
5.2 By Value (2019-2024) 35
5.3 By Volume (2014-2018) 44
5.4 By Volume (2019-2024) 45
6. Global Soda Ash Market-By Product Type, By Value 46
6.1 Global Soda Ash Market- By Value: Breakdown(%) 47
6.1.1 Global Soda Ash Market Size and Share, By Product Type , 2018 47
6.1.2 Global Soda Ash Market Size and Share, By Product Type , 2024 48
4
5. Table of Content
S. No Particulars Page
No.
6.3 Global Soda Ash Market- By Light 50
6.3.1 By Value (2014-2024) 50
6.4 Global Soda Ash Market- By Dense 51
6.4.1 By Value (2014-2024) 51
7. Global Soda Ash Market-By Process Type, By Value 52
7.1 Global Soda Ash Market- By Value: Breakdown(%) 53
7.1.1 Global Soda Ash Market Size and Share, By Process Type , 2018 53
7.1.2 Global Soda Ash Market Size and Share, By Process Type , 2024 54
7.3 Global Soda Ash Market- By Natural 55
7.3.1 By Value (2014-2024) 55
7.4 Global Soda Ash Market- By Synthetic 56
7.4.1 By Value (2014-2024) 56
8. Global Soda Ash Market-By Applications By Value 57
8.1 Global Soda Ash Market- By Value: Breakdown(%) 58
8.1.1 Global Soda Ash Market Size and Share, By Applications, 2018 58
5
6. Table of Content
S. No Particulars Page
No.
8.1.2 Global Soda Ash Market Size and Share, By Applications , 2024 59
8.2 Global Soda Ash Market, By Glass 60
8.2.1 By Value (2014-2024) 60
8.3 Global Soda Ash Market, By Soaps and Detergents 63
8.2.1 By Value (2014-2024) 63
8.4 Global Soda Ash Market, By Chemical 64
8.4.1 By Value (2014-2024) 64
8.5 Global Soda Ash Market, By Metallurgy 66
8.5.1 By Value (2014-2024) 66
8.6 Global Soda Ash Market, By Other Applications 67
8.6.1 By Value (2014-2024) 67
9. Global Soda Ash Market: Regional Analysis 68
9.1 Global Soda Ash Market, By Region: Breakdown (%) 69
9.1.1 Global Soda Ash Market Size, By Region, By Value, 2018 (%) 69
9.1.2 Global Soda Ash Market Size, By Region, By Value, 2024 (%) 70
6
7. Table of Content
S. No Particulars Page
No.
9.1.3 Global Soda Ash Market Size, By Region, By Volume, 2018(%) 69
9.1.4 Global Soda Ash Market Size, By Region, By Volume, 2024 (%) 70
9.2 North America Soda Ash Market: An Analysis 72
9.2.1 By Value (2014-2018) 73
9.2.2 By Value (2019-2024) 74
9.2.3 By Volume (2014-2018) 77
9.2.4 By Volume (2019-2024) 78
9.3 North America Soda Ash Market: Segment Analysis 79
9.3.1 North America Soda Ash Market, By Product Type, By Value (2014-2024) 80
9.3.2 North America Soda Ash Market, By Process Type, By Value (2014-2024) 81
9.3.3 North America Soda Ash Market, By Application, By Value (2014-2024) 82
9.4 North America Soda Ash Market: Country Analysis (U.S., Canada, Mexico) 84
9.4.1 U.S. Soda Ash Market, By Value (2014-2024) 88
9.4.2 U.S. Soda Ash Market, By Volume (2014-2024) 90
7
8. Table of Content
S. No Particulars Page
No.
9.4.3 U.S. Soda Ash Market, By Application, By Value (2014-2024) 91
9.4.4 Canada Soda Ash Market, By Value (2014-2024) 94
9.4.5 Canada Soda Ash Market, By Volume (2014-2024) 95
9.4.6 Canada Soda Ash Market, By Application Type, By Value (2014-2024) 96
9.5 Europe Soda Ash Market: An Analysis 98
9.5.1 By Value (2014-2018) 99
9.5.2 By Value (2019-2024) 101
9.5.3 By Volume (2014-2018) 105
9.5.4 By Volume (2019-2024) 106
9.6 Europe Soda Ash Market: Segment Analysis 108
9.6.1 Europe Soda Ash Market, By Product Type, By Value (2014-2024) 109
9.6.2 Europe Soda Ash Market, By Process Type, By Value (2014-2024) 110
9.6.3 Europe Soda Ash Market, By Application, By Value (2014-2024) 111
9.7 Europe Soda Ash Market: Country Analysis (Germany, France, Rest of Europe) 114
9.7.1 Germany Soda Ash Market, By Value (2014-2024) 115
8
9. Table of Content
S. No Particulars Page
No.
9.7.2 Germany Soda Ash Market, By Volume (2014-2024) 118
9.7.3 Germany Soda Ash Market, By Application, By Value (2014-2024) 120
9.7.4 France Soda Ash Market, By Value (2014-2024) 124
9.7.5 France Soda Ash Market, By Volume (2014-2024) 125
9.7.6 France Soda Ash Market, By Application, By Value (2014-2024) 127
9.7.9 Rest of Europe Cocoa Butter Equivalent Market, By Value (2014-2024) 130
9.7.10 Rest of Europe Cocoa Butter Equivalent Market, By Volume (2014-2024) 131
9.7.11 Rest of Europe Soda Ash Market, By Application, By Value (2014-2024) 132
9.8 Asia Pacific Soda Ash Market: An Analysis 133
9.8.1 By Value (2014-2018) 134
9.8.2 By Value (2019-2024) 135
9.8.3 By Volume (2014-2018) 137
9.8.4 By Volume (2019-2024) 138
9.9 Asia Pacific Soda Ash Market: Segment Analysis 139
9.9.1 Asia Pacific Soda Ash Market, By Product Type, By Value (2014-2024) 140
9
10. Table of Content
S. No Particulars Page
No.
9.9.2 Asia Pacific Soda Ash Market, By Process Type, By Volume (2014-2024) 141
9.9.3 Asia Pacific Soda Ash Market, By Application, By Value (2014-2024) 142
9.10 Asia Pacific Soda Ash Equivalent Market: Country Analysis (China, India, Rest of Asia Pacific) 144
9.10.1 China Soda Ash t Market, By Value (2014-2024) 148
9.10.2 China Soda Ash Market, By Volume (2014-2024) 150
9.10.3 China Soda Ash Market, By Application, By Value (2014-2024) 152
9.10.4 India Soda Ash Market, By Value (2014-2024) 157
9.10.5 India Soda Ash Market, By Volume (2014-2024) 160
9.10.6 India Soda Ash Market, By Application, By Value (2014-2024) 161
9.10.7 Rest of Asia Pacific Soda Ash Market, By Value (2014-2024) 166
9.10.8 Rest of Asia Pacific Soda Ash Market, By Volume (2014-2024) 167
9.10.9 Rest of Asia Pacific Soda Ash Market, By Application, By Value (2014-2024) 168
9.11 Rest of World Soda Ash Market: An Analysis 169
9.11.1 By Value (2014-2018) 170
9.11.2 By Value (2019-2024) 171
10
11. Table of Content
S. No Particulars Page
No.
9.11.3 By Volume (2014-2018) 172
9.11.4 By Volume (2019-2024) 173
9.12 Rest of World Soda Ash Market: Segment Analysis 174
9.12.1 Rest of World Soda Ash Market: By Product Type, By Value (2014-2024) 174
9.12.2 Rest of World Soda Ash Market, By Process Type, By Value (2014-2024) 175
9.12.3 Rest of World Soda Ash Market, By Application, By Value (2014-2024) 176
9.13 Rest of World Soda Ash Market: Country Analysis (Brazil. Mexico, Rest of Europe) 181
9.13.1 Brazil Soda Ash Market, By Value (2014-2024) 182
9.13.2 Brazil Soda Ash Market, By Volume (2014-2024) 183
9.13.3 Brazil Soda Ash Market, By Application, By Value (2014-2024) 184
9.13.4 MexicoSoda Ash Market, By Value (2014-2024) 188
9.13.5 Mexico Soda Ash Market, By Volume (2014-2024) 189
9.13.6 Mexico Soda Ash Market, By Application, By Value (2014-2024) 190
9.13.4 Others Soda Ash Market, By Value (2014-2024) 193
9.13.5 Others Soda Ash Market, By Volume (2014-2024) 194
11
12. Table of Content
S. No Particulars Page
No.
10 Market Dynamics 196
10.1 Drivers 197
10.2 Challenges 201
11. Market Trends 204
12. Supply Chain Analysis 205
13. Porter’s Five Forces Analysis 207
14. SWOT Analysis 209
15. Company Profiling 211
15.1 Solvay 212
15.2 Tata Chemicals 214
15.3 Ciner 216
15.4 Genisis Alkali 218
15.5 Nirma Limited 219
15.6 Shandong Haihua 220
15.7 Ciech SA 221
15.8 Tangshan Sanyou Chemical Industries 223
16. About Us 224
12
13. List of Figures
Figure No. Figure Title Page No.
Figure 1: Flow Chart of Production of Soda Ash 30
Figure 2: General Properties of Soda Ash 32
Figure 3: Global Soda Ash Market, By Value, 2014-2018 (USD Million) 34
Figure 4: Global Soda Ash Market, By Value, Forecast, 2019-2024 (USD Million) 35
Figure 5: World Production of Soda Ash (2014-2018, Thousand Tonnes) 36
Figure 6: Production of Soda Ash , By Region, 2018 36
Figure 7: Demand and Imports in Key Market (Million Tone) 37
Figure 8: Global Soda Ash Top 10 Producers by Annual Capacity (2017, %) 38
Figure 9: Global Soda Ash Top 10 Producers by Annual Capacity (2018, %) 38
Figure 10: Production of Natural Soda Ash ( 2014-2018, Thousand Tonnes) 39
Figure 11: Production of Synthetic Soda Ash ( 2014- 2018, Thousand Tonnes) 39
Figure 12: Global GDP, 2011-2017 (USD Trillion) 42
Figure 13: World Middle Class Population (2009&2020&2030, In Billion) 42
Figure 14: Global Soda Ash Market, By Volume, 2014-2018(Million Tone) 44
Figure 15: Global Soda Ash Market, By Volume, Forecast, 2019-2024 (Million Tone) 45
Figure 16: Global Soda Ash Market Size and Share, By Product Type, 2018(%) 47
Figure 17: Global Soda Ash Market Size and Share, By Product Type, 2024(%) 48
Figure 18: Global Light Soda Ash Market, By Value, 2014-2018 (USD Million) 50
Figure 19: Global Light Soda Ash Market, By Value, 2019-2024 (USD Million) 50
Figure 20: Global Dense Soda Ash Market, By Value, 2014-2018 (USD Million) 51
13
14. List of Figures
Figure No. Figure Title Page No.
Figure 21: Global Dense Soda Ash Market, By Value, 2019-2024 (USD Million) 51
Figure 22: Global Soda Ash Market Size and Share, By Process Type, 2018 % 53
Figure 23: Global Soda Ash Market Size and Share, By Product Type, 2024 % 54
Figure 24: Global Soda Ash Market, By Natural Process, By Value, 2014-2018 (USD Million) 55
Figure 25: Global Soda Ash Market, By Natural Process, By Value, 2019-2024 (USD Million) 55
Figure 26: Global Soda Ash Market, By Synthetic Process, By Value, 2014-2018 (USD Million) 56
Figure 27: Global Soda Ash Market, By Synthetic Process, By Value, 2019-2024 (USD Million) 56
Figure 28: Global Soda Ash Market Size and Share, By Applications, 2018 (%) 58
Figure 29: Global Soda Ash Market Size and Share, By Applications , 2024(%) 59
Figure 30: Global Soda Ash Market, By Glass,By Value, 2014-2018 (USD Million) 60
Figure 31: Global Soda Ash Market, By Glass,By Value, Forecast,2019-2024 ( USD Million) 60
Figure 32: Projected Value of fabricated Flat Glass Demand from 2003 to 2023 ( USD Million) 61
Figure 33: Production statistics of cars & commercial vehicles in 2018 61
Figure 34: Market Share of Global Glass Export, By Highest Dollar Value, By Country, 2017(%) 62
Figure 35: Countries Exported Highest Dollar Value Worth Glass and Glassware in 2017 62
Figure 36: Global Soda Ash Market, By Soaps and Detergents ,By Value, 2014-2018 (USD Million) 63
Figure 37: Global Soda Ash Market, By Soaps and Detergents ,,By Value, Forecast,2019-2024 ( USD Million) 63
Figure 38: Global Soda Ash Market, By Chemical , By Value, 2014-2018 (USD Million) 64
Figure 39: Global Soda Ash Market, By Chemical, By Value, Forecast,2019-2024 ( USD Million) 64
Figure 40: Projection of Annual Capital expenditure from the Global Chemical Industry from 2019-2023 ( USD Billion) 65
14
15. List of Figures
Figure No. Figure Title Page No.
Figure 41: Total Revenue of Global Chemical Industry (2012-2017, USD billion) 65
Figure 42: Global Soda Ash Market, By Metallurgy, By Value, 2014-2018 (USD Million) 66
Figure 43: Global Soda Ash Market, By Metallurgy, By Value, Forecast,2019-2024 ( USD Million) 66
Figure 44: Global Soda Ash Market, By Other Application,By Value, 2014-2018 (USD Million) 67
Figure 45: Global Soda Ash Market, By Other Application,By Value, Forecast,2019-2024 ( USD Million) 67
Figure 46: Global Soda Ash Market Size, By Region, 2018 (%), By Value 69
Figure 47: Global Soda Ash Market Size, By Region, 2018 (%), By Volume 69
Figure 48: Global Soda Ash Market Size, By Region, 2024F (%), By Value 70
Figure 49: Global Soda Ash Market Size, By Region, 2024F (%), By Volume 70
Figure 50: Capacity and Demand Balance for Soda Ash,2016 71
Figure 51: North America Soda Ash Market Size, By Value, 2014-2018 (USD Million) 73
Figure 52: North America Soda Ash Market Size, By Value, Forecast, 2019-2024 (USD Million ) 74
Figure 53: North America Soda Ash Market Size, By Volume, 2014-2018(Million Tone) 77
Figure 54: North America Soda Ash Market Size, By Volume, Forecast, 2019-2024(Million Tone) 78
Figure 55: North America Soda Ash Market: By Product Type, By Value, 2014-2024(USD Million) 80
Figure 56: Rest of world Soda Ash Market: By Process Type, By Value, 2014-2024(USD Million) 81
Figure 57: North America Soda Ash Market: By Application, By Value, 2014-2024(USD Million) 82
Figure 58: Flat Glass Plants and Lines in North America 83
Figure 59: North America Soda Ash Market, By Value Country Share, 2018 (% of Total) 85
Figure 60: North America Soda Ash, By Value, Country Share, 2024F (% of Total) 85
15
16. List of Figures
Figure No. Figure Title Page No.
Figure 61: North America Soda Ash Market, By Volume, Country Share, 2018 (% of Total) 86
Figure 62: North America Soda Ash, By Volume, Country Share, 2024F (% of Total) 86
Figure 63: United States Soda Ash Market Size, By Value, 2014-2018 (USD Million) 88
Figure 64: United States Soda Ash Market Size, By Value, 2019E-2024F (USD Million) 88
Figure 65: Soda Ash Import Sources to United States From 2014 to 2017 (%) 89
Figure 66: Total amount of Soda Ash Exports to United States (Thousand Tonnes,2014-2018) 89
Figure 67: Total Production of Soda Ash in United States (Thousand Tonnes,2014-2018) 89
Figure 68: United States Soda Ash Market Size, By Volume, 2014-2018 (Million Ton) 90
Figure 69: United States Soda Ash Market Size, By Value, 2019E-2024F (Million Ton) 90
Figure 70: United States Soda Ash Market: By Application, By Value, 2014-2024(USD Million) 91
Figure 71: Per Capita Average Expenditure on Soaps and Detergents in United States (2012-2017, USD) 92
Figure 72: Glass and Glass Product Manufacturing Gross Output in United States in (2011-2016, USD Million) 92
Figure 73: Canada Soda Ash Market Size, By Value, 2014-2018 (USD Million) 94
Figure 74: Canada Soda Ash Market Size By Value, 2019E-2024F (USD Million) 94
Figure 75: United States Soda Ash Market Size, By Volume, 2014-2018 (Million Tone) 95
Figure 76: United States Soda Ash Market Size, By Value, 2019E-2024F (Million Tone) 95
Figure 77: Canada Soda Ash Market: By Application, By Value, 2014-2024(USD Million) 96
Figure 78: Canada Automotive Production Data (USD Millions) 97
Figure 79: Europe Soda Ash Market Size, By Value, 2014-2018 (USD Million) 99
Figure 80: Europe Export of Soap ( USD Million, 2012-2016) 100
16
17. List of Figures
Figure No. Figure Title Page No.
Figure 81: Leading Suppliers of Soap, By European Countries (%, 2016) 100
Figure 82: Europe Soda Ash Market Size, By Value, Forecast, 2019-2024(USD Million ) 101
Figure 83: Capacity Addition in Turkey (2010-20222, Million Tone) 103
Figure 84: Europe Soda Ash Market Size, By Volume, 2014-2018(Million Tone) 105
Figure 85: Europe Soda Ash Market Size, By Volume, Forecast, 2019-2024(Million Tone) 106
Figure 86: Europe 28 Glass Production ( Mio Tonnes, 2013-2017) 107
Figure 87: EU 28 Production Share Breakdown, By Glass Type,2017 % 107
Figure 88: Europe Soda Ash Market: By Product Type, By Value, 2014-2024(USD Million) 109
Figure 89: Europe Soda Ash Market: By Process Type, By Value, 2014-2024(USD Million) 110
Figure 90: Europe Soda Ash Market: By Application Type, By Value, 2014-2024 (USD Million) 111
Figure 91: New passenger car registrations in the EU 112
Figure 92: European Construction Industry Index 113
Figure 93: Europe Soda Ash Market, Country Share, , By Value, 2018 (% of Total) 115
Figure 94: Europe Soda Ash Market, Country Share, , By Value, 2024 (% of Total) 115
Figure 95: Europe Soda Ash Market, Country Share, By Volume, 2018 (% of Total) 116
Figure 96: Europe Soda Ash Market, Country Share, , By Volume, 2024 (% of Total) 116
Figure 97: Germany Soda Ash Market Size, By Value, 2014-2018 (USD Million) 118
Figure 98: Germany Soda Ash Market Size, By Value, 2019E-2024F (USD Million) 118
Figure 99: Germany Soda Ash Market Size, By Volume, 2014-2018 (Million Tone) 119
Figure 100: Germany Soda Ash Market Size, By Volume, 2019E-2024F (Million Tone) 119
17
18. List of Figures
Figure No. Figure Title Page No.
Figure 101: Germany Soda Ash Market: By Application, By Value, 2014-2024(USD Million) 120
Figure 102: Production of Passenger Cars by country in EU, 2017 ( in million units) 121
Figure 103: Revenue From Laundry detergents and Cleaning products in Germany (2013-2017, USD Million) 122
Figure 104: Germany Chemical Industry Market Segmentation by Revenues in Euro Billions,2017 122
Figure 105: France Soda Ash Market Size, By Value, 2014-2018(USD Million) 124
Figure 106: France Soda Ash Market Size, By Value, 2019E-2024F (USD Million) 124
Figure 107: France Soda Ash Market Size, By Volume, 2014-2018(Million Tone) 125
Figure 108: France Soda Ash Market Size, By Volume, 2019E-2024F (Million Tone) 125
Figure 109: France Gross Domestic Product (2013-2017, USD Trillion) 126
Figure 110: France Degree of Urbanization (2013-2017) % 126
Figure 111: France Soda Ash Market: By Application , By Value, 2014-2024(USD Million) 127
Figure 112: Rest of Europe Soda Ash Market Size, By Value, 2014-2018(USD Million) 130
Figure 113: Rest of Europe Soda Ash Market Size, By Value, 2019E-2024F (USD Million) 130
Figure 114: Rest of Europe Soda Ash Market Size, By Volume, 2014-2018(Million Tone) 131
Figure 115: Rest of Europe Soda Ash Market Size, By Volume, 2019E-2024F ( Million Tone) 131
Figure 116: Rest of Europe Soda Ash Market: By Application, By Value, 2014-2024(USD Million) 132
Figure 117: Asia Pacific Soda Ash Market Size, By Value, 2014-2018 (USD Million) 134
Figure 118: Asia Pacific Soda Ash Market Size, By Value, Forecast, 2019-2024(USD Million ) 135
Figure 119: Asia Pacific Soda Ash Market Size, By Volume, 2014-2018(Million Tone) 137
Figure 120: Asia Pacific Soda Ash Market Size, By Volume, Forecast, 2019-2024(Million Tone) 138
18
19. List of Figures
Figure No. Figure Title Page No.
Figure 121: Asia Pacific Soda Ash Market: By Product Type, By Value, 2014-2024(USD Million) 140
Figure 122: Asia Pacific Soda Ash Market: By Process Type, By Value, 2014-2024(USD Million) 141
Figure 123: Asia Pacific Soda Ash Market: By Application, By Value, 2014-2024(USD Million) 142
Figure 124: APAC Automotive Manufacturing Output Geographic Breakdown 143
Figure 125: Number of Registrations or Sales of New Vehicles in APAC Region 2016 & 2017, By country (in Million units) 143
Figure 126: Asia Pacific Soda Ash Market, Country Share, By Value, 2018 (% of Total) 145
Figure 127: Asia Pacific Soda Ash Market, Country Share, By Value,2024 (% of Total) 145
Figure 128: Asia Pacific Soda Ash Market, Country Share, By Volume, 2018 (% of Total) 146
Figure 129: Asia Pacific Soda Ash Market, Country Share, , By Volume, 2024 (% of Total) 146
Figure 130: China Soda Ash Market Size, By Value, 2014-2018(USD Million) 148
Figure 131: China Soda Ash Market Size, By Value, 2019E-2024F (USD Million) 148
Figure 132: China Soda Ash Production (Million Ton, 1994-2016) 149
Figure 133: China Soda Ash Market Size, By Volume, 2014-2018(Million Tone) 150
Figure 134: China Soda Ash Market Size, By Volume, 2019E-2024F ( Million Tone) 150
Figure 135: China, GDP Growth Per Year, 2015-2019 (In %) 151
Figure 136: China, Share of Urban Population, 2012-2017 (In %) 151
Figure 137: China, Total Population, 2013-2021F (In Billion) 151
Figure 138: China Soda Ash Market: By Application, By Value, 2014-2024(USD Million) 152
Figure 139: Value added in the Chinese construction industry from 2008 to 2018 (in billion yuan) 153
Figure 140: Growth of Market Demand For Soap and Cleaning Agents in China 2014-2018 154
19
20. List of Figures
Figure No. Figure Title Page No.
Figure 141: Global Chemical Market in 2020 (USD Billion) 155
Figure 142: China consumption of Chemical Fertilizers (10000 tons) 155
Figure 143: India Soda Ash Market Size, By Value, 2014-2018(USD Million) 157
Figure 144: India Soda Ash Market Size, By Value, 2019E-2024F (USD Million) 157
Figure 145: India Soda Ash Production Market Share,2017(%) 158
Figure 146: India GDP Growth (2013-2017, USD Trillion) 159
Figure 147: India Soda Ash Market Size, By Volume, 2014-2018(Million Tone) 160
Figure 148: India Soda Ash Market Size, By Volume, 2019E-2024F ( Million Tone) 160
Figure 149: India Soda Ash Market: By Application, By Value, 2014-2024(USD Million) 161
Figure 150: India Glass Industry Revenue 2013 &2017( USD billion) 162
Figure 151: India Vehicle sales (2013-2017) 162
Figure 152: Share of Country wise Glass Export From India in FY 18 % 163
Figure 153: India’s Total Glass Exports (USD Million) 163
Figure 154: New Glass Manufacturing Project Announced in India ( USD Million) 163
Figure 155: India Soap and Detergent Industry Revenue ,2013 &2017 ( USD billion) 164
Figure 156: Production Volume of detergents Across India From FY 2015-18 ( Thousand Metric Tons) 164
Figure 157: Rest of Asia Pacific Soda Ash Market Size, By Value, 2014-2018(USD Million) 166
Figure 158: Rest of Asia Pacific Soda Ash Market Size, By Value, 2019E-2024F (USD Million) 166
Figure 159: Rest of Asia Pacific Soda Ash Market Size, By Volume, 2014-2018(Million Tone 167
Figure 160: Rest of Asia Pacific Soda Ash Market Size, By Volume, 2019E-2024F ( Million Tone) 167
20
21. List of Figures
Figure No. Figure Title Page No.
Figure 161: Rest of Asia Pacific Soda Ash Market: By Application, By Value, 2014-2024(USD Million) 168
Figure 162: Rest of World Soda Soda Ash Market Size, By Value, 2014-2018 (USD Million) 170
Figure 163: Rest of World Soda Ash Market Size, By Value, Forecast, 2019-2024(USD Million ) 171
Figure 164: Rest of World Soda Ash Market Size, By Volume, 2014-2018(Million Tone) 172
Figure 165: Rest of World Soda Ash Market Size, By Volume, Forecast, 2019-2024 (Million Tone) 173
Figure 166: Rest of World Soda Ash Market: By Product Type, By Value, 2014-2024(USD Million) 174
Figure 167: Rest of world Soda Ash Market: By Process Type, By Value, 2014-2024(USD Million) 175
Figure 168: Rest of World Soda Ash Market: By Application, By Value, 2014-2024(USD Million) 176
Figure 169: Value of Construction Output in the Middle East in 2017, By Country ( USD Billion) 177
Figure 170: Rest of World Soda Ash Market, Country Share, By Value, 2018 (% of Total) 179
Figure 171: Rest of World Soda Ash Market, Country Share, , By Value,2024 (% of Total) 179
Figure 172: Rest of World Soda Ash Market, Country Share, By Volume, 2018 (% of Total) 180
Figure 173: Rest of World Soda Ash Market, Country Share, , By Volume,2024 (% of Total) 180
Figure 174: Brazil Soda Ash Market Size, By Value, 2014-2018(USD Million) 182
Figure 175: Brazil Soda Ash Market Size, By Value, 2019E-2024F (USD Million) 182
Figure 176: Brazil Soda Ash Market Size, By Volume, 2014-2018(Million Tone) 183
Figure 177: Brazil Soda Ash Market Size, By Volume, 2019E-2024F ( Million Tone) 183
Figure 178: Brazil Soda Ash Market: By Application, By Value, 2014-2024(USD Million) 184
Figure 179: Number of companies registered in the construction sector in Brazil from 2010 to 2016 (in 1,000s) 185
Figure 180: Leading companies in the chemical and petrochemical industry in Brazil in 2017, based on net revenue (in
billion Brazilian reals)
186
21
22. List of Figures
Figure No. Figure Title Page No.
Figure 181: Mexico Soda Ash Market Size, By Value, 2014-2018(USD Million) 188
Figure 182: Mexico Soda Ash Market Size, By Value, 2019E-2024F (USD Million) 188
Figure 183: Mexico Soda Ash Market Size, By Volume, 2014-2018(Million Tone) 189
Figure 184: Mexico Soda Ash Market Size, By Volume, 2019E-2024F ( Million Tone) 189
Figure 185: Mexico Soda Ash Market: By Application, By Value, 2014-2024(USD Million) 190
Figure 186: Others Soda Ash Market Size, By Value, 2014-2018(USD Million) 193
Figure 187: Others Soda Ash Market Size, By Value, 2019E-2024F (USD Million) 193
Figure 188: Others Soda Ash Market Size, By Volume, 2014-2018 (Million Tone) 194
Figure 189: Others Soda Ash Market Size, By Volume, 2019E-2024F (Million Tone) 194
Figure 190: Others Soda Ash Market: By Application, By Value, 2014-2024(USD Million) 195
Figure 191: Solvay Sales, 2015-2018 (USD Billion) 213
Figure 192: Solvay Sales, By Business Group, 2018 (%) 213
Figure 193: Solvay Sales, By Region, 2018(%) 213
Figure 194: Tata Chemicals Sales, 2016-2018 (USD Billion) 215
Figure 195: Tata Chemicals Sales, By Business Group, 2018 (%) 215
Figure 196: Tata Chemicals Sales, By Region, 2018(%) 215
Figure 197: Ciner Sales, 2016-2018 (USD Million) 217
Figure 198: Ciner Sales, By Region, 2018(%) 217
Figure 199: Ciech Sales, 2016-2018 (USD Million) 222
Figure 200: Ciech Sales, By Region, 2018(%) 222
Figure 201: Ciech Sales, By Segment, 2018(%) 222
22
23. Research Methodology
For our study on Soda Ash, we have conducted comprehensive secondary research followed by an
extensive primary research. In the process of secondary research, we have scrutinized industry
documents, accessed from open sources, premium paid databases (Bloomberg, Thomson Reuters,
Factiva) and our internal knowledge base. In the process of primary research, we have interviewed
various industry experts across the value chain of the Soda Ash industry.
Market size of the actual period (2014-2018) has been evaluated on the basis of growth trends of
the industry in the last five years, and confirming the findings through primary research. Annual
reports of the companies are scanned to further validate the market size and to estimate the size
of various other end-user sectors. Market sizing and growth in the forecast period (2019-2024) is
estimated through product mapping, application in end-user industries, growth of allied sectors
and historical growth pattern of the industry. All the relevant data points/ statistics in the forecast
period are validated through relevant and reliable primary sources.
Report Focus: Global Soda Ash Market
- By Product Type - Light, Dense
By Process Type – Natural and Synthetic
By Application- Glass and Ceramics, Soaps and detergents, Chemical, Metallurgical, Others
By Region- APAC , North America, Europe and ROW
By Country - US, Canada, Mexico, France, Germany, China, India, Brazil
- Company Coverage (Tata Chemicals, Solvay, Ciner, Genesis Alkali, NIRMA Limited, Shandong
Haihua, Ciech SA, Tangshan Sanyou Chaemicals, Solvay )
23
24. North America Heart Valve Devices Market, By Value
Figure 3: Global Soda Ash Market, By Value, 2014-2018 (USD Million)
Source: Azoth Analytics Estimates
CAGR 2014-2018
xx%
2014 2015 2016 2017 2018
Xx
Xx
Xx
Xx
Xx
Xx
Xx
Increasing consumption of soda ash by industries like Glass, Chemical been backing the soda ash market
Global Soda Ash Market, By Value
24
25. Figure 4: Global Soda Ash Market, By Value, Forecast, 2019-2024 (USD Million)
Source: Azoth Analytics Estimates
2019 2020 2021 2022 2023 2024
CAGR 2019-2024
xx%
Xx
Xx
Xx
Xx
Xx
Xx
Xx
Rapid economic development in countries such as India and China is expected to drive soda ash market
Global Soda Ash Market, By Value
25
26. North America Heart Valve Devices Market, By Value
Figure 14: Global Soda Ash Market, By Volume, 2014-2018(Million Tone)
Source: Azoth Analytics Estimates
Wide application of soda ash backed market growth in the past few years.
Global Soda Ash Market, By Volume
CAGR 2014-2018
xx%
2014 2015 2016 2017 2018
Xx
Xx
Xx
Xx
Xx
Xx
Xx
26
27. Figure 15: Global Soda Ash Market, By Volume, Forecast, 2019-2024 (Million Tone)
Source: Azoth Analytics Estimates
Rising demand of Soda ash in water treatment and paper making industry would impel the growth of
market in the foreseeable future.
Global Soda Ash Market, By Volume
2019 2020 2021 2022 2023 2024
CAGR 2019-2024
xx%
Xx
Xx
Xx
Xx
Xx
Xx
Xx
27
28. Global Heart Valve Replacement Devices Market, By Value
Figure 18: Global Light Soda Ash Market, By Value,
2014-2018 (USD Million)
Source: Azoth Analytics Estimates
CAGR 2014-2018
xx%
CAGR 2019-2024
xx%
Figure 19: Global Light Soda Ash Market, By Value,
2019-2024 (USD Million)
Global Light Soda Ash Market, By Value
2014 2015 2016 2017 2018 2019 2020 2021 2022 2023 2024
Xx
Xx
Xx
Xx
Xx
Xx
28
29. Global Heart Valve Replacement Devices Market, By Value
Figure 20: Global Dense Soda Ash Market, By Value,
2014-2018 (USD Million)
Source: Azoth Analytics Estimates
Figure 21: Global Dense Soda Ash Market, By Value,
2019-2024 (USD Million)
Global Dense Soda Ash Market, By Value
CAGR 2014-2018
xx%
CAGR 2019-2024
xx%
2014 2015 2016 2017 2018 2019 2020 2021 2022 2023 2024
Xx
Xx
Xx
Xx
Xx
Xx
29
30. Global Heart Valve Replacement Devices Market, By Value
Figure 24: Global Soda Ash Market, By Natural Process,
By Value, 2014-2018 (USD Million)
Source: Azoth Analytics Estimates
Figure 25: Global Soda Ash Market, By Natural Process,
By Value, 2019-2024 (USD Million)
Global Soda Ash Market, By Natural Process, By Value
CAGR 2014-2018
xx%
CAGR 2019-2024
xx%
2014 2015 2016 2017 2018 2019 2020 2021 2022 2023 2024
Xx
Xx
Xx
Xx
Xx
Xx
30
31. Global Heart Valve Replacement Devices Market, By Value
Figure 26: Global Soda Ash Market, By Synthetic
Process, By Value, 2014-2018 (USD Million)
Source: Azoth Analytics Estimates
Figure 27: Global Soda Ash Market, By Synthetic
Process, By Value, 2019-2024 (USD Million)
Global Soda Ash Market, By Synthetic Process, By Value
CAGR 2014-2018
xx%
CAGR 2019-2024
xx%
2014 2015 2016 2017 2018 2019 2020 2021 2022 2023 2024
Xx
Xx
Xx
Xx
Xx
Xx
31
32. Global Heart Valve Replacement Devices Market, By Value
Figure 30: Global Soda Ash Market, By Glass,By Value,
2014-2018 (USD Million)
Source: Azoth Analytics Estimates
Figure 31: Global Soda Ash Market, By Glass,By Value,
Forecast,2019-2024 ( USD Million)
Global Soda Ash Market, By Glass, By Value
CAGR 2014-2018
xx%
CAGR 2019-2024
xx%
2014 2015 2016 2017 2018 2019 2020 2021 2022 2023 2024
Xx
Xx
Xx
Xx
Xx
Xx
32
33. Global Heart Valve Replacement Devices Market, By Value
Figure 36: Global Soda Ash Market, By Soaps and
Detergents ,By Value, 2014-2018 (USD Million)
Source: Azoth Analytics Estimates
Figure 37: Global Soda Ash Market, By Soaps and
Detergents ,,By Value, Forecast,2019-2024 ( USD Million)
Global Soda Ash Market, By Soaps and Detergents, By Value
CAGR 2014-2018
xx%
CAGR 2019-2024
xx%
2014 2015 2016 2017 2018 2019 2020 2021 2022 2023 2024
Xx
Xx
Xx
Xx
Xx
Xx
33
34. Global Heart Valve Replacement Devices Market, By Value
Figure 38: Global Soda Ash Market, By Chemical , By
Value, 2014-2018 (USD Million)
Source: Azoth Analytics Estimates
Figure 39: Global Soda Ash Market, By Chemical, By
Value, Forecast,2019-2024 ( USD Million)
Global Soda Ash Market, By Chemical, By Value
CAGR 2014-2018
xx%
CAGR 2019-2024
xx%
2014 2015 2016 2017 2018 2019 2020 2021 2022 2023 2024
Xx
Xx
Xx
Xx
Xx
Xx
34
35. 2014 2015 2016 2017 2018 2019 2020 2021 2022 2023 2024
Global Heart Valve Replacement Devices Market, By Value
Figure 42: Global Soda Ash Market, By Metallurgy, By
Value, 2014-2018 (USD Million)
Source: Azoth Analytics Estimates
Figure 43: Global Soda Ash Market, By Metallurgy, By
Value, Forecast,2019-2024 ( USD Million)
Global Soda Ash Market, By Metallurgy , By Value
CAGR 2014-2018
xx%
CAGR 2019-2024
xx%
Xx
Xx
Xx
Xx
Xx
Xx
35
36. Global Heart Valve Replacement Devices Market, By Value
Figure 44: Global Soda Ash Market, By Other
Application,By Value, 2014-2018 (USD Million)
Source: Azoth Analytics Estimates
Figure 45: Global Soda Ash Market, By Other
Application,By Value, Forecast,2019-2024 ( USD Million)
Global Soda Ash Market, By Other Application, By Value
CAGR 2014-2018
xx%
CAGR 2019-2024
xx%
2014 2015 2016 2017 2018 2019 2020 2021 2022 2023 2024
Xx
Xx
Xx
Xx
Xx
Xx
36
37. North America Soda Ash Market, By Value
Source: Azoth Analytics Estimates
Figure 51: North America Soda Ash Market Size, By Value, 2014-2018 (USD Million)
Increasing demand from industries like glass, chemical has been backing the soda ash market in the region.
CAGR 2014-2018
xx%
2014 2015 2016 2017 2018
Xx
Xx
Xx
Xx
Xx
Xx
Xx
37
38. Source: Azoth Analytics Estimates
Figure 52: North America Soda Ash Market Size, By Value, Forecast, 2019-2024 (USD Million )
Increasing production activities will support the growth of the market during forecast period.
North America Soda Ash Market, By Value
2019 2020 2021 2022 2023 2024
CAGR 2019-2024
xx%
Xx
Xx
Xx
Xx
Xx
Xx
Xx
38
39. North America Soda Ash Market, By Volume
Source: Azoth Analytics Estimates
Figure 53: North America Soda Ash Market Size, By Volume, 2014-2018(Million Tone)
Increasing demand of soda ash for construction material has been propelling the demand of Soda Ash.
CAGR 2014-2018
xx%
2014 2015 2016 2017 2018
Xx
Xx
Xx
Xx
Xx
Xx
Xx
39
40. Source: Azoth Analytics Estimates
Figure 54: North America Soda Ash Market Size, By Volume, Forecast, 2019-2024(Million Tone)
Increasing demand from glass as well as metallurgy sector is foreseen to support the market.
North America Soda Ash Market, By Volume
2019 2020 2021 2022 2023 2024
CAGR 2019-2024
xx%
Xx
Xx
Xx
Xx
Xx
Xx
Xx
40
41. Source: Azoth Analytics Estimates
Figure 55: North America Soda Ash Market: By Product Type, By Value, 2014-2024(USD Million)
CAGR 2014-2018
Dense: xx%
Light: xx%
North America Soda Ash Market, By Product Type, By Value
Xx
Xx
Xx
Xx
Xx
CAGR 2019-2024
Dense: xx%
Light: xx%
2014 2015 2016 2017 2018 2019 2020 2021 2022 2023 2024
Dense 614.83 520.15 657.31 654.69 676.89 692.63 708.58 724.75 741.14 757.75 772.79
Light 516.00 620.67 540.74 533.23 545.82 554.68 563.56 572.46 581.38 590.32 601.06
41
42. Source: Azoth Analytics Estimates
Figure 56: Rest of world Soda Ash Market: By Process Type, By Value, 2014-2024(USD Million)
CAGR 2014-2018
Natural: xx%
Synthetic: xx%
Rest of World Soda Ash Market, By Process Type, By Value
Xx
Xx
Xx
Xx
CAGR 2019-2024
Natural: xx%
Synthetic : xx%
2014 2015 2016 2017 2018 2019 2020 2021 2022 2023 2024
Natural 742.17 748.60 756.12 736.60 765.79 773.62 781.30 788.83 796.20 803.40 810.44
Synthetic 388.67 392.22 441.93 451.32 456.93 473.68 490.83 508.37 526.32 544.66 563.42
42
43. Source: Azoth Analytics Estimates
Figure 57: North America Soda Ash Market: By Application, By Value, 2014-2024(USD Million)
CAGR 2014-2018
Glass and Ceramics: xx%
Soaps and Detergents: xx%
Chemicals : xx%
Metallurgy : xx%
Others: xx%
North America Soda Ash Market, By Application, By Value
CAGR 2019-2024
Glass and Ceramics: xx%
Soaps and Detergents: xx%
Chemicals : xx%
Metallurgy : xx%
Others: %
2014 2015 2016 2017 2018 2019 2020 2021 2022 2023 2024
Glass and Ceramics 511.81 520.44 551.74 551.04 572.09 585.71 599.52 613.53 627.75 642.16 656.78
Soaps and Detergents 75.79 73.82 74.86 71.43 70.75 70.15 69.49 68.76 67.97 67.10 66.17
Chemicals 328.87 327.12 339.17 331.27 336.28 338.58 340.78 342.87 344.84 346.70 348.44
Metallurgy 61.31 62.53 66.48 66.59 69.33 70.99 72.68 74.39 76.12 77.88 79.67
Others 111.18 114.54 122.97 124.34 130.64 137.13 143.80 150.65 157.68 164.90 172.30
43
44. 2014 2015 2016 2017 2018 2019 2020 2021 2022 2023 2024
Figure 63: United States Soda Ash Market Size, By
Value, 2014-2018 (USD Million)
• .
Source: Azoth Analytics Estimates
United States Soda Ash Market Overview
Figure 64: United States Soda Ash Market Size, By
Value, 2019E-2024F (USD Million)
CAGR 2014-2018
xx%
CAGR 2019-2024
xx%
Xx
Xx
Xx
Xx
Xx
Xx
44
45. Figure 69: United States Soda Ash Market Size, By
Value, 2019E-2024F (Million Ton)
• .
Source: Azoth Analytics Estimates
United States Soda Ash Market Overview
Figure 68: United States Soda Ash Market Size, By
Volume, 2014-2018 (Million Ton)
CAGR 2014-2018
xx%
CAGR 2019-2024
xx%
2014 2015 2016 2017 2018 2019 2020 2021 2022 2023 2024
Xx
Xx
Xx
Xx
Xx
Xx
45
46. Source: Azoth Analytics Estimates
Figure 70: United States Soda Ash Market: By Application, By Value, 2014-2024(USD Million)
United States Soda Ash Market, By Application, By Value
CAGR 2014-2018
Glass and Ceramics: xx%
Soaps and Detergents: xx%
Chemicals : xx%
Metallurgy : xx%
Others: xx%
CAGR 2019-2024
Glass and Ceramics: xx%
Soaps and Detergents: xx%
Chemicals : xx%
Metallurgy : xx%
Others: %
2014 2015 2016 2017 2018 2019 2020 2021 2022 2023 2024
Glass and Ceramics 511.81 520.44 551.74 551.04 572.09 585.71 599.52 613.53 627.75 642.16 656.78
Soaps and Detergents 75.79 73.82 74.86 71.43 70.75 70.15 69.49 68.76 67.97 67.10 66.17
Chemicals 328.87 327.12 339.17 331.27 336.28 338.58 340.78 342.87 344.84 346.70 348.44
Metallurgy 61.31 62.53 66.48 66.59 69.33 70.99 72.68 74.39 76.12 77.88 79.67
Others 111.18 114.54 122.97 124.34 130.64 137.13 143.80 150.65 157.68 164.90 172.30
46
47. About Azoth Analytics Pvt Ltd.
Azoth Analytics (ISO 9001:2015) is a business research and analytics company that creates in-depth research reports and provides customized research
solutions and consulting services. An ISO 9001:2015 certified company, Azoth Analytics adheres to international quality management standard and has strong
commitment to a culture of continuous improvement. The business research and market analysis of Azoth Analytics helps organizations across different
industry verticals solve their business problems. Strategic market sizing and data dredging techniques include secondary research, and primary research
(interviews with management personnel and industry experts). Azoth Analytics provide syndicated and customized market research reports on different
verticals including pharmaceutical and healthcare, oil and gas and power, chemicals, automotive, technology, FMCG, food & beverages and media sectors.
47