Global Consumer Confidence Feb 19
•
1 like•969 views

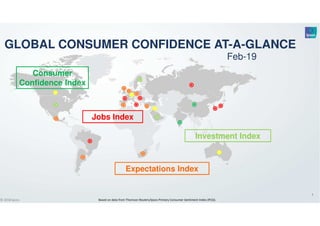
Increasing optimism in Mexico and Brazil contributes to Global Index stability

Recommended
Recommended
More Related Content
Similar to Global Consumer Confidence Feb 19
Similar to Global Consumer Confidence Feb 19 (20)
More from Ipsos Public Affairs
More from Ipsos Public Affairs (20)
Recently uploaded
Recently uploaded (20)
Global Consumer Confidence Feb 19
- 1. 1 Based on data from Thomson Reuters/Ipsos Primary Consumer Sentiment Index (PCSI).© 2018 Ipsos 1111111 Consumer Confidence Index Feb-19 GLOBAL CONSUMER CONFIDENCE AT-A-GLANCE Jobs Index Expectations Index Investment Index
- 2. Based on data from Thomson Reuters/Ipsos Primary Consumer Sentiment Index (PCSI). 2 © 2018 Ipsos US Largest drops China Belgium Russia CONSUMER CONFIDENCE GLOBAL SNAPSHOT Ipsos Consumer Confidence Index Feb-19 Canada Mexico Argentina 53.8/ -2.4 60.7/ -2.0 38.6/ +3.2 58.1 /+8.1 Brazil 53.1/ +7.1 48.9/-1.4 Great Britain France 39.8/-1.0 Spain 44.6/+2.4 Italy 43.4/-1.7 South Africa 43.2/ +4.1 Germany 57.0/ -1.1 Poland 51.8/-1.2 Sweden 58.1/ -1.6 Hungary 42.9/-0.7 Israel 53.5/-1.3 Turkey 32.9/-1.3 Saudi Arabia 63.7/+2.2 Russia 38.5/-2.7 China 67.7/-7.8 India 63.4/ +1.6 South Korea 40.4/-2.3 Y Japan 42.5/-1.0 Australia 52.5/-0.9 45.1/-3.0 Belgium High Low Country Index/3-month change Change ≥ +1.5 Change ≤ -1.5 Largest gains Mexico Brazil South Africa Global Average: 49.7 (3-month change: -0.2) Highest (over 60) in: China, Saudi Arabia, India, US Lowest (below 40) in: Turkey, Russia, Argentina, France Down in 8 countries: China, Belgium, Russia, Canada, South Korea, US, Italy, Sweden Up in 7 countries: Mexico, Brazil, South Africa, Argentina, Spain, Saudi Arabia, India
- 3. Based on data from Thomson Reuters/Ipsos Primary Consumer Sentiment Index (PCSI). 3 © 2018 Ipsos US Largest drops Turkey Sweden Belgium CONSUMER CONFIDENCE GLOBAL SNAPSHOT Ipsos Jobs Index Feb-19 Canada Mexico Argentina 67.2/ -3.6 72.3/ -2.6 43.6/ +2.1 58.7 /+8.2 Brazil 44.2/ +6.8 65.4/-0.6 Great Britain France 57.4/-0.2 Spain 49.7/+1.7 Italy 55.4/-1.0 South Africa 44.6/ +1.1 Germany 72.4/ -0.6 Poland 65.3/-0.5 Sweden 68.9/ -4.6 Hungary 57.0/-0.2 Israel 63.9/-2.2 Turkey 37.8/-4.6 Saudi Arabia 53.2/+0.4 Russia 45.9/-3.4 China 69.5/+0.1 India 62.0/ +2.0 South Korea 55.0/-2.1 Japan 65.9/-0.4 Australia 63.8/-0.7 58.7/-4.5 Belgium High Low Country Index/3-month change Change ≥ +1.5 Change ≤ -1.5 Largest gains Mexico Brazil Argentina Global Average: 58.2 (3-month change: -0.4) Highest (over 65) in: Germany, US, China, Sweden, Canada, Japan, Great Britain, Poland Lowest (below 45) in: Turkey, Argentina, Brazil, South Africa Down in 8 countries: Turkey, Sweden, Belgium, Canada, Russia, US, Israel, South Korea Up in 5 countries: Mexico, Brazil, Argentina, India, Spain
- 4. Based on data from Thomson Reuters/Ipsos Primary Consumer Sentiment Index (PCSI). 4 © 2018 Ipsos US Largest drops China Belgium Russia CONSUMER CONFIDENCE GLOBAL SNAPSHOT Ipsos Expectations Index Feb-19 Canada Mexico Argentina 59.7/ -2.9 66.3/ -1.0 53.2/ +1.0 71.0 /+7.0 Brazil 70.0/ +3.2 50.3/-2.4 Great Britain France 47.7/-0.2 Spain 54.6/+2.6 Italy 53.9/-2.5 South Africa 53.8/ +5.1 Germany 60.8/ -1.0 Poland 61.3/+0.5 Sweden 61.2/ -2.0 Hungary 54.0/+0.1 Israel 62.4/-0.2 Turkey 40.7/-1.9 Saudi Arabia 67.1/+0.4 Russia 47.2/-3.2 China 70.9/-4.2 India 70.7/ +1.8 South Korea 48.8/-2.2 Japan 50.9/-1.7 Australia 59.5/-0.3 50.5/-3.6 Belgium High Low Country Index/3-month change Change ≥ +1.5 Change ≤ -1.5 Largest gains Mexico South Africa Brazil Global Average: 57.8 (3-month change: -0.3) Highest (over 70) in: Mexico, China, India, Brazil Lowest (below 50) in: Turkey, Russia, France, South Korea Up in 5 countries: Mexico, South Africa, Brazil, Spain, India Down in 10 countries: China, Belgium, Russia, Canada, Italy, Great Britain, South Korea, Sweden, Turkey, Japan
- 5. Based on data from Thomson Reuters/Ipsos Primary Consumer Sentiment Index (PCSI). 5 © 2018 Ipsos US Largest drops China Russia South Korea CONSUMER CONFIDENCE GLOBAL SNAPSHOT Ipsos Investment Index Feb-19 Canada Mexico Argentina 46.0/ -0.9 53.1/ -1.9 32.5/ +4.9 55.8 /+8.6 Brazil 55.4/ +9.0 41.0/-1.4 Great Britain France 27.4/-1.5 Spain 40.3/+2.6 Italy 34.0/-1.8 South Africa 44.0/ +5.7 Germany 46.9/ -1.2 Poland 41.6/-1.7 Sweden 52.1/ -0.1 Hungary 32.4/-1.4 Israel 43.9/-1.6 Y Turkey 27.1/+1.2 Saudi Arabia 66.6/+3.9 Russia 32.3/-2.5 China 65.9/-12.9 India 63.1/ +1.0 South Korea 30.4/-2.1 Japan 26.3/-0.6 Australia 44.4/-1.3 36.5/-1.5 Belgium High Low Country Index/3-month change Change ≥ +1.5 Change ≤ -1.5 Largest gains Brazil Mexico South Africa Global Average: 43.3 (3-month change: -0.1) Highest (over 55) in: Saudi Arabia, China, India, Mexico, Brazil Lowest (below 35) in: Japan, Turkey, France, South Korea, Russia, Hungary, Argentina, Italy Up in 6 countries: Brazil, Mexico, South Africa, Argentina, Saudi Arabia, Spain Down in 9 countries: China, Russia, South Korea, US, Italy, Poland, Israel, France, Belgium
- 6. Based on data from Thomson Reuters/Ipsos Primary Consumer Sentiment Index (PCSI). 6 © 2018 Ipsos GLOBAL CONSUMER CONFIDENCE AT-A-GLANCE Trends – Ipsos Consumer Confidence and Jobs Index Ipsos Consumer Confidence New 3 months 6 months 12 months 3 years 5 years 7 years Index Feb-19 Nov-18 Sep-18 Feb-18 Feb-16 Feb-14 Feb-12 Argentina 38.6 35.4 36.9 47.7 51.4 39.3 49.2 Australia 52.5 53.4 53.2 53.6 50.2 47.3 48.8 Belgium 45.1 48.1 49.0 49.3 43.9 41.2 35.7 Brazil 53.1 46.0 42.5 43.5 36.1 54.9 62.7 Canada 53.8 56.2 55.4 55.3 47.9 53.6 52.9 China 67.7 75.5 74.4 69.6 61.8 61.0 55.2 France 39.8 40.8 43.4 45.6 39.1 34.7 34.3 Germany 57.0 58.1 57.8 57.2 55.8 53.7 50.9 Hungary 42.9 43.6 44.2 42.1 35.8 32.0 19.1 India 63.4 61.8 64.7 65.2 65.5 58.2 64.6 Italy 43.4 45.1 45.4 38.2 35.3 27.3 28.4 Japan 42.5 43.5 44.7 45.0 41.8 42.3 36.8 Mexico 58.1 50.0 50.5 48.1 43.4 37.9 43.9 Poland 51.8 53.0 53.0 52.0 40.3 34.1 30.7 Russia 38.5 41.2 41.2 39.2 37.4 41.8 41.2 South Korea 40.4 42.7 42.8 46.1 36.7 41.2 38.1 Spain 44.6 42.2 43.8 43.2 40.5 28.8 25.8 Sweden 58.1 59.7 61.5 63.3 60.9 59.8 58.3 Saudi Arabia 63.7 61.5 58.9 53.3 59.9 59.7 63.3 South Africa 43.2 39.1 41.5 44.2 37.7 42.7 44.6 Great Britain 48.9 50.3 51.2 49.5 52.5 47.8 37.9 US 60.7 62.7 62.6 62.1 54.9 51.0 46.0 Turkey 32.9 34.2 39.6 40.5 42.2 41.7 46.5 Israel 53.5 54.8 54.2 54.5 48.5 TOTAL 49.7 49.9 50.5 50.3 46.7 45.6 44.7 Ipsos Jobs New 3 months 6 months 12 months 3 years 5 years 7 years Index Feb-19 Nov-18 Sep-18 Feb-18 Feb-16 Feb-14 Feb-12 Argentina 43.6 41.5 42.7 50.8 54.9 42.3 54.4 Australia 63.8 64.5 64.8 64.1 59.3 54.9 59.1 Belgium 58.7 63.2 62.9 58.2 58.0 51.9 49.3 Brazil 44.2 37.4 35.0 34.1 28.4 50.7 57.6 Canada 67.2 70.8 69.4 65.3 58.8 64.1 63.0 China 69.5 69.4 73.2 70.1 63.5 67.7 60.2 France 57.4 57.6 59.3 57.4 50.8 47.7 47.7 Germany 72.4 73.0 73.6 69.5 71.6 66.7 65.8 Hungary 57.0 57.2 56.7 54.1 45.1 37.3 26.0 India 62.0 60.0 60.7 60.7 62.9 59.9 63.5 Italy 55.4 56.4 56.1 48.9 43.4 32.9 36.6 Japan 65.9 66.3 67.2 66.2 63.4 63.8 58.2 Mexico 58.7 50.5 49.9 49.2 44.2 34.2 39.3 Poland 65.3 65.8 66.1 63.6 51.6 40.4 37.0 Russia 45.9 49.3 48.3 44.9 41.8 48.2 45.5 South Korea 55.0 57.1 56.5 57.7 52.0 54.3 52.0 Spain 49.7 48.0 49.9 47.2 42.3 27.3 25.2 Sweden 68.9 73.5 75.2 72.1 75.7 70.4 70.4 Saudi Arabia 53.2 52.8 54.1 49.2 63.1 61.9 58.8 South Africa 44.6 43.5 46.2 46.7 44.1 47.6 48.5 Great Britain 65.4 66.0 67.9 64.5 65.4 58.6 48.3 US 72.3 74.9 74.5 71.5 64.9 62.6 51.4 Turkey 37.8 42.4 46.1 45.2 46.6 48.5 49.8 Israel 63.9 66.1 66.3 65.7 59.4 TOTAL 58.2 58.6 59.3 57.4 54.6 52.4 51.1
- 7. Based on data from Thomson Reuters/Ipsos Primary Consumer Sentiment Index (PCSI). 7 © 2018 Ipsos GLOBAL CONSUMER CONFIDENCE AT-A-GLANCE Trends – Ipsos Expectations Index and Investment Index Ipsos Expectations New 3 months 6 months 12 months 3 years 5 years 7 years Index Feb-19 Nov-18 Sep-18 Feb-18 Feb-16 Feb-14 Feb-12 Argentina 53.2 52.2 51.6 60.4 69.5 57.7 65.5 Australia 59.5 59.8 59.8 60.1 56.1 55.3 57.4 Belgium 50.5 54.1 54.9 54.3 52.4 51.3 44.9 Brazil 70.0 66.8 62.1 64.0 60.6 71.9 78.7 Canada 59.7 62.6 60.5 61.8 57.4 61.1 62.0 China 70.9 75.1 73.9 72.9 65.1 67.3 62.0 France 47.7 47.9 49.6 52.5 48.6 44.6 44.2 Germany 60.8 61.8 62.6 63.8 60.8 62.8 60.2 Hungary 54.0 53.9 54.4 53.8 48.8 49.7 32.8 India 70.7 68.9 70.7 71.8 72.7 68.9 70.4 Italy 53.9 56.4 57.0 51.1 49.9 45.0 47.7 Japan 50.9 52.6 53.5 54.3 50.9 53.0 46.7 Mexico 71.0 64.0 66.5 57.9 52.6 53.6 60.3 Poland 61.3 60.8 60.7 60.8 50.5 48.2 46.1 Russia 47.2 50.4 49.5 52.5 49.8 52.0 51.9 South Korea 48.8 51.0 51.1 57.5 44.7 51.8 50.2 Spain 54.6 52.0 52.9 53.0 53.3 45.9 43.9 Sweden 61.2 63.2 64.2 64.4 61.2 63.3 63.8 Saudi Arabia 67.1 66.7 63.9 60.2 67.4 68.0 67.9 South Africa 53.8 48.7 51.2 57.6 44.9 50.4 54.3 Great Britain 50.3 52.7 54.2 54.4 58.7 58.0 48.9 US 66.3 67.3 66.7 68.3 62.0 60.3 59.4 Turkey 40.7 42.6 46.9 47.9 49.8 49.9 57.0 Israel 62.4 62.6 61.8 62.5 58.6 TOTAL 57.8 58.1 58.3 59.1 56.1 56.5 55.8 Ipsos Investment New 3 months 6 months 12 months 3 years 5 years 7 years Index Feb-19 Nov-18 Sep-18 Feb-18 Feb-16 Feb-14 Feb-12 Argentina 32.5 27.6 30.2 43.7 45.0 33.6 41.7 Australia 44.4 45.7 45.2 46.3 44.3 41.4 40.0 Belgium 36.5 38.0 39.6 43.3 33.9 32.3 26.4 Brazil 55.4 46.4 43.0 44.9 34.5 54.2 62.2 Canada 46.0 46.9 47.0 48.7 40.6 47.0 45.2 China 65.9 78.8 75.2 67.8 61.1 55.9 49.5 France 27.4 28.9 32.6 36.9 30.1 25.1 24.4 Germany 46.9 48.1 46.4 46.9 45.7 43.3 39.6 Hungary 32.4 33.8 35.5 33.6 28.3 24.4 11.9 India 63.1 62.1 66.5 66.7 65.9 55.5 65.4 Italy 34.0 35.8 36.2 28.8 27.1 19.6 17.4 Japan 26.3 26.9 28.7 29.4 26.4 25.8 22.6 Mexico 55.8 47.2 47.8 47.8 43.7 37.8 43.5 Poland 41.6 43.3 43.4 42.6 30.7 26.3 21.5 Russia 32.3 34.8 35.5 31.6 30.8 36.8 36.5 South Korea 30.4 32.5 32.9 35.4 27.1 30.9 26.9 Spain 40.3 37.7 39.1 39.6 37.3 25.9 22.2 Sweden 52.1 52.2 54.6 59.6 54.4 55.1 52.3 Saudi Arabia 66.6 62.7 58.2 50.8 54.2 54.2 62.9 South Africa 44.0 38.3 40.8 42.4 37.1 42.7 42.0 Great Britain 41.0 42.4 42.6 40.9 44.5 39.1 29.8 US 53.1 55.0 55.4 55.8 48.7 43.6 41.1 Turkey 27.1 25.9 33.3 35.4 37.0 35.2 40.1 Israel 43.9 45.5 44.7 45.4 37.8 TOTAL 43.3 43.2 43.9 44.3 40.3 39.6 38.6
- 8. 8 Based on data from Thomson Reuters/Ipsos Primary Consumer Sentiment Index (PCSI).© 2018 Ipsos These findings are based on data from Thomson Reuters/Ipsos’ Primary Consumer Sentiment Index (PCSI) collected in a monthly survey of consumers from 24 countries via Ipsos’ Global @dvisor online survey platform. For this survey, Ipsos interviews a total of 17,500+ adults aged 18-64 in the United States of America, Canada, and Israel, and age 16-64 in all 21 other countries each month. The monthly sample consists of 1,000+ individuals in each of Australia, Brazil, Canada, China, France, Germany, Italy, Japan, Spain, Great Britain and the USA, and 500+ individuals in each of Argentina, Belgium, Hungary, India, Israel, Mexico, Poland, Russia, Saudi Arabia, South Africa, South Korea, Sweden and Turkey. Data collected each month are weighted so that each country’s sample composition best reflects the demographic profile of the adult population according to the country’s most recent census data. Data collected each month are also weighted to give each country an equal weight in the total “global” sample. Online surveys can be taken as representative of the general working age population in Argentina, Australia, Belgium, Canada, France, Germany, Great Britain, Hungary, Italy, Japan, Poland, South Korea, Spain, Sweden, and the United States. Online samples in Brazil, China, India, Israel, Mexico, Russia, Saudi Arabia, South Africa and Turkey are more urban, more educated and/or more affluent than the general population and the results should be viewed as reflecting the views of a more “connected” population. Sample surveys and polls may be subject to other sources of error, including, but not limited to coverage error, and measurement error. The precision of the Thomson Reuters/Ipsos online polls is measured using a Bayesian Credibility Interval. Here, the poll has a credibility interval of +/- 2.0 points for countries where the 3-month sample is 3,000+ and +/- 2.9points for countries where the 3-month sample is 1,500+. For more information on the Ipsos use of credibility intervals, please go to www.ipsos-na.com/news-polls/pressrelease.aspx?id=5836. The results reported each month in the Thomson Reuters/Ipsos’ Primary Consumer Sentiment Index (go to https://financial.thomsonreuters.com/en/products/data-analytics/market- data/indices/ipsos-surveys.html) are based only on that month’s data (hence, the base for each country is 500+ or 1,000+) and comparisons are made against results from other months which are also each based on one month’s data. In contrast, the results reported any given month in Ipsos’s Global Consumer Confidence at-a-Glance are based on data collected not only that month, but also during to the two previous months and consist of past 3-month “rolling averages”. This technique allows for tripling the sample size for each metric. Hence, the base for any country ranges from 1,500+ to 3,000+. This increases the reliability of the findings and the statistical significance of reported variations over time, However, to heighten the freshness of the findings reported any given month, the data from the same month is given a weight of 45%, the data from the previous month a lesser weight of 35%, and the data from the earliest of the three months an even lesser weight of 20%. The Thomson Reuters/Ipsos Primary Consumer Sentiment Index (PCSI), ongoing since 2010, is a monthly survey of consumer attitudes on the current and future state of local economies, personal finance situations, savings and confidence to make large investments. The PCSI metrics reported each month for each of the 24 countries surveyed consist of a “Primary Index” based on all 11 questions below and of several “sub-indices” each based on a subset of these 11 questions. Those sub-indices include an Expectations Index; Investment Index; and, Jobs Index. GLOBAL CONSUMER CONFIDENCE AT-A-GLANCE Methodology (1 of 2)
- 9. 9 Based on data from Thomson Reuters/Ipsos Primary Consumer Sentiment Index (PCSI).© 2018 Ipsos The questions used for the PCSI and for Ipsos’s Global Consumer Confidence at-a-Glance are the following: 1. Now, thinking about our economic situation, how would you describe the current economic situation in [Country]? Is it… very good, somewhat good, somewhat bad or very bad* 2. Rate the current state of the economy in your local area using a scale from 1 to 7, where 7 means a very strong economy today and 1 means a very weak economy.* 3. Looking ahead six months from now, do you expect the economy in your local area to be much stronger, somewhat stronger, about the same, somewhat weaker, or much weaker than it is now?* 4. Rate your current financial situation, using a scale from 1 to 7, where 7 means your personal financial situation is very strong today and 1 means it is very weak 5. Looking ahead six months from now, do you expect your personal financial situation to be much stronger, somewhat stronger, about the same, somewhat weaker, or much weaker than it is now? 6. Compared to 6 months ago, are you NOW more or less comfortable making a major purchase, like a home or car? 7. Compared to 6 months ago, are you NOW more or less comfortable making other household purchases? 8. Compared to 6 months ago, are you NOW more or less confident about job security for yourself, your family and other people you know personally? 9. Compared to 6 months ago, are you NOW more or less confident of your ability to invest in the future, including your ability to save money for your retirement or your children’s education? 10. Thinking of the last 6 months, have you, someone in your family or someone else you know personally lost their job as a result of economic conditions? 11. Now look ahead at the next six months. How likely is it that you, someone in your family or someone else you know personally will lose their job in the next six months as a result of economic conditions? The PCSI Index is benchmarked to a baseline of 100 assigned at its introduction in January 2010. Index number is calculated by utilizing data from the survey results. Responses are divided into aggregated Top Box (Reward) numbers and Bottom Box (Penalty) numbers. Using Shapely Value Analysis, values were generated for the penalty and reward for each question. The magnitude of each question is the difference between the reward and penalty. An Importance factor, which the ultimate weight of the particular question in the index, is the magnitude of each question divided by the total magnitude of all questions. A Top Box Weight for each question is calculated by dividing the Reward by the magnitude of each question. Similarly, the Bottom Weight for each question is calculated by dividing the Penalty for each question by magnitude of the same. The Index Value for each question is calculated by using the formula: Importance x (Top Box Wt * Top Box %) - (Bottom Box Wt * Bottom box %). The most recent Global @dvisor fieldwork periods were: • February 2019 wave: January 25 – February 8 • Jan 2019 wave: December 21 – January 9 • Dec 2018 wave: November 23 – December 7 • Nov 2018 wave: October 26 – November 9 • Oct 2018 wave: September 21 - October 5 • Sep 2018 wave: August 24 - September 7 * Trended percentage results to each of these three questions are reported monthly in Ipsos’s Economic Pulse of World (go to https://www.ipsos.com/en/economic-pulse-world?language_content_entity=en ). GLOBAL CONSUMER CONFIDENCE AT-A-GLANCE Methodology (2 of 2)
- 10. 10 Based on data from Thomson Reuters/Ipsos Primary Consumer Sentiment Index (PCSI).© 2018 Ipsos About Ipsos Public Affairs Ipsos Public Affairs is a non-partisan, objective, survey-based research practice made up of seasoned professionals. We conduct strategic research initiatives for a diverse number of American and international organizations, based not only on public opinion research, but elite stakeholder, corporate, and media opinion research. Ipsos has media partnerships with the most prestigious news organizations around the world. In Canada, the U.S., UK, and internationally, Ipsos Public Affairs is the media polling supplier to Reuters News, the world's leading source of intelligent information for businesses and professionals. Ipsos Public Affairs is a member of the Ipsos Group, a leading global survey-based market research company. We provide boutique-style customer service and work closely with our clients, while also undertaking global research. About Ipsos Ipsos is an independent market research company controlled and managed by research professionals. Founded in France in 1975, Ipsos has grown into a worldwide research group with a strong presence in all key markets. Ipsos ranks fourth in the global research industry. With offices in 89 countries, Ipsos delivers insightful expertise across five research specializations: brand, advertising and media; customer loyalty; marketing; public affairs research; and survey management. Ipsos researchers assess market potential and interpret market trends. They develop and build brands. They help clients build long-term relationships with their customers. They test advertising and study audience responses to various media and they measure public opinion around the globe. Ipsos has been listed on the Paris Stock Exchange since 1999 and generated global revenues of €1,782.7 million in 2016. GLOBAL CONSUMER CONFIDENCE AT-A-GLANCE
- 11. 11 Based on data from Thomson Reuters/Ipsos Primary Consumer Sentiment Index (PCSI).© 2018 Ipsos Cliff Young is President of Ipsos Public Affairs in the United States and also leads Ipsos' global election and polling risk practice. He is a polling expert with specialties in social and public opinion trends, crisis management, corporate and institution reputation and elections. Cliff is a contributor to POTUS Radio and has served as an expert commentator on Fox News and NPR, among others. Cliff is also an adjunct professor at Johns Hopkins SAIS and an instructor at both Columbia University SIPA and University of São Paulo where he teaches courses on public opinion and election forecasting. (MORE BIO INFO: http://spotlight.ipsosna.com/index.php/author/clifford-young/) Clifford Young President, Ipsos US Public Affairs Clifford.Young@ipsos.com +1 312.375.3328