More Related Content Similar to Q12014 ocde-employment Similar to Q12014 ocde-employment (20) More from ArenaPublica (20) 1. Paris, 16 July 2014
OECD QuarterlyEmployment Situation
News Release: 1st
Quarter 2014
1
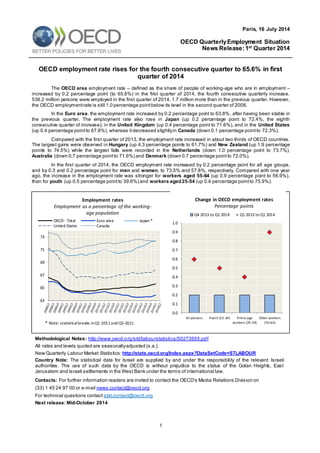
OECD employment rate rises for the fourth consecutive quarter to 65.6% in first
quarter of 2014
The OECD area employment rate – defined as the share of people of working-age who are in employment –
increased by 0.2 percentage point (to 65.6%) in the first quarter of 2014, the fourth consecutive quarterly increase.
536.2 million persons were employed in the first quarter of 2014, 1.7 million more than in the previous quarter. However,
the OECD employmentrate is still 1.0 percentage pointbelow its level in the second quarter of 2008.
In the Euro area, the employment rate increased by 0.2 percentage point to 63.8%, after having been stable in
the previous quarter. The employment rate also rose in Japan (up 0.2 percentage point to 72.4%, the eighth
consecutive quarter of increase), in the United Kingdom (up 0.4 percentage point to 71.6%), and in the United States
(up 0.4 percentage pointto 67.8%), whereas itdecreased slightlyin Canada (down 0.1 percentage pointto 72.3%).
Compared with the first quarter of 2013, the employment rate increased in about two thirds of OECD countries.
The largest gains were observed in Hungary (up 4.3 percentage points to 61.7%) and New Zealand (up 1.9 percentage
points to 74.5%) while the largest falls were recorded in the Netherlands (down 1.0 percentage point to 73.7%),
Australia (down 0.7 percentage pointto 71.6%) and Denmark (down 0.7 percentage pointto 72.0%).
In the first quarter of 2014, the OECD employment rate increased by 0.2 percentage point for all age groups,
and by 0.3 and 0.2 percentage point for men and women, to 73.5% and 57.8%, respectively. Compared with one year
ago, the increase in the employment rate was stronger for workers aged 55-64 (up 0.9 percentage point to 56.9%),
than for youth (up 0.5 percentage pointto 39.6%) and workers aged25-54 (up 0.4 percentage pointto 75.9%).
Methodological Notes: http://www.oecd.org/std/labourstatistics/50273955.pdf
All rates and levels quoted are seasonallyadjusted (s.a.).
New Quarterly Labour Market Statistics:http://stats.oecd.org/Index.aspx?DataSetCode=STLABOUR
Country Note: The statistical data for Israel are supplied by and under the responsibility of the relevant Israeli
authorities. The use of such data by the OECD is without prejudice to the status of the Golan Heights, East
Jerusalem and Israeli settlements in the West Bank under the terms of international law.
Contacts: For further information readers are invited to contact the OECD's Media Relations Division on
(33) 1 45 24 97 00 or e-mail news.contact@oecd.org
For technical questions contact stat.contact@oecd.org
Next release: Mid-October 2014
63
65
67
69
71
73
Employment rates
Employment as a percentage of the working-
age population
OECD - Total Euro area Japan *
United States Canada
* Note: statisticalbreaks inQ1-2011and Q3-2011
0.0
0.1
0.2
0.3
0.4
0.5
0.6
0.7
0.8
0.9
1.0
All persons Youth (15-24) Prime-age
workers (25-54)
Older workers
(55-64)
Change in OECD employment rates
Percentage points
Q4 2013 to Q1 2014 Q1 2013 to Q1 2014
2. Paris, 16 July 2014
OECD QuarterlyEmployment Situation
News Release: 1st
Quarter 2014
2
Table 1: OECD employment rates and levels (15-64)
Employment as a percentage of corresponding working age population and levels, seasonally adjusted
Employment rates Levels
2010 2011 2012 2013 2008 2012 2013 2014 Thousands
Q2 Q4 Q1 Q2 Q3 Q4 Q1 Q1 - 2014
OECD - Total 64.5 64.8 65.0 65.2 66.6 65.1 65.0 65.1 65.2 65.4 65.6 536,229
Major Seven 67.3 67.5 67.7 68.1 69.6 67.9 67.9 68.0 68.1 68.2 68.5 327,817
European Union 64.0 64.2 64.1 64.1 65.8 64.1 63.9 64.0 64.2 64.3 64.6 213,304
Euro area 64.1 64.3 63.8 63.6 65.9 63.6 63.5 63.5 63.6 63.6 63.8 138,309
Australia 72.4 72.7 72.4 72.0 73.3 72.3 72.3 72.2 71.9 71.7 71.6 11,107
Austria 71.7 72.1 72.5 72.3 72.3 72.4 72.1 72.4 72.4 72.4 72.5 4,115
Belgium 62.0 61.9 61.8 61.8 62.2 61.8 61.6 61.9 62.2 61.5 61.8 4,488
Canada 71.5 72.0 72.2 72.5 73.7 72.5 72.6 72.6 72.4 72.4 72.3 17,130
Chile 59.3 61.3 61.8 62.3 57.2 61.8 62.2 62.3 62.3 62.4 62.2 7,356
Czech Republic 65.0 65.7 66.6 67.7 66.6 66.9 67.2 67.7 67.9 68.1 68.4 4,862
Denmark 73.4 73.2 72.6 72.6 78.1 72.6 72.7 72.7 72.4 72.4 72.0 2,602
Estonia 61.3 65.3 67.2 68.5 70.0 67.1 67.9 69.3 68.5 68.1 67.8 589
Finland 68.2 69.0 69.4 68.9 71.2 69.2 68.9 69.1 68.8 68.6 68.7 2,393
France1
63.9 63.9 63.9 64.1 64.8 64.0 63.9 64.0 64.2 64.3 64.4 25,566
Germany 71.1 72.5 72.8 73.3 69.8 73.1 73.1 73.3 73.4 73.5 73.4 39,741
Greece 59.6 55.6 51.3 49.3 62.0 50.4 49.6 49.3 49.2 49.1 49.0 3,450
Hungary 55.4 55.8 57.2 58.5 56.5 57.5 57.4 58.3 58.7 59.4 61.7 4,111
Iceland 78.2 78.5 79.7 81.1 84.4 80.1 80.0 80.9 81.7 81.7 80.8 166
Ireland 59.7 58.9 58.9 60.5 68.3 59.2 59.7 60.1 60.7 61.2 61.3 1,848
Israel 60.2 60.9 66.5 67.1 59.9 66.7 66.9 66.8 67.3 67.3 67.9 3,379
Italy 56.9 57.0 56.8 55.6 58.8 56.4 55.9 55.6 55.5 55.5 55.5 21,888
Japan 70.6 71.1 70.6 71.7 70.9 70.8 71.3 71.5 71.8 72.2 72.4 56,753
Korea 63.3 63.8 64.2 64.4 63.9 64.2 64.0 64.3 64.6 64.9 65.4 23,553
Luxembourg 65.2 64.6 65.9 65.7 64.3 66.2 65.5 65.7 65.7 66.0 66.4 241
Mexico 59.7 60.0 60.9 60.8 61.2 60.5 60.5 60.9 60.7 61.3 60.9 47,126
Netherlands 74.7 74.9 75.1 74.3 77.1 74.9 74.7 74.4 74.1 74.0 73.7 8,100
New Zealand 72.3 72.6 72.2 73.1 75.0 71.2 72.6 72.7 73.3 73.8 74.5 2,192
Norway 75.3 75.3 75.8 75.4 78.1 75.5 75.5 75.4 75.4 75.3 75.1 2,522
Poland 59.0 59.3 59.7 60.0 59.0 59.7 59.6 59.8 60.2 60.5 61.1 15,521
Portugal 65.6 64.2 61.8 61.1 68.5 60.5 60.3 60.7 61.2 62.0 62.0 4,236
Slovak Republic 58.8 59.3 59.7 59.9 61.9 59.3 59.9 59.8 59.9 59.9 60.3 2,325
Slovenia 66.2 64.4 64.1 63.3 68.2 64.2 63.2 63.0 63.7 63.2 63.3 889
Spain 58.9 58.0 55.8 54.8 65.1 55.0 54.8 54.7 54.7 55.0 55.3 16,978
Sweden 72.2 73.6 73.8 74.4 74.4 73.8 74.2 74.3 74.5 74.7 74.5 4,572
Switzerland 78.6 79.4 79.4 79.6 79.5 79.6 79.4 79.4 79.3 80.2 79.0 4,308
Turkey 46.3 48.4 48.9 49.5 45.1 49.7 49.9 49.7 49.2 49.3 50.0 25,381
United Kingdom 69.5 69.5 70.1 70.8 71.8 70.6 70.4 70.6 70.9 71.2 71.6 29,265
United States 66.7 66.6 67.1 67.4 71.2 67.4 67.2 67.3 67.4 67.4 67.8 137,472
1 Statistical break in Q4-2012 for France, following the introduction of a revised labour force survey questionnaire (from 1 January
2013 onwards). European Union and Euro area aggregates are also affected, and, to a lesser extent OECD-Total and Major seven
aggregates.
3. Paris, 16 July 2014
OECD QuarterlyEmployment Situation
News Release: 1st
Quarter 2014
3
Table 2: OECD employment rates (15-64) by gender
Employment as a percentage of corresponding working age population, seasonally adjusted
Women Men
2013 2013 2014 2013 2013 2014
Q1 Q2 Q3 Q4 Q1 Q1 Q2 Q3 Q4 Q1
OECD - Total 57.4 57.2 57.3 57.5 57.6 57.8 73.1 73.0 73.1 73.0 73.2 73.5
Major Seven 62.3 62.0 62.2 62.4 62.5 62.7 73.9 73.8 73.9 73.9 74.0 74.3
European Union 58.8 58.5 58.7 58.9 59.1 59.3 69.4 69.3 69.3 69.4 69.6 69.9
Euro area 58.3 58.2 58.2 58.4 58.4 58.6 68.8 68.9 68.8 68.8 68.9 69.0
Australia 66.4 66.7 66.5 66.3 66.2 66.0 77.6 77.9 77.8 77.5 77.2 77.2
Austria 67.6 67.2 67.7 67.7 67.7 67.8 77.1 77.0 77.2 77.1 77.2 77.3
Belgium 57.2 56.8 56.8 58.2 57.0 57.3 66.4 66.3 66.8 66.3 66.1 66.3
Canada 69.6 69.6 69.6 69.6 69.5 69.3 75.4 75.5 75.5 75.3 75.3 75.4
Chile 51.0 50.8 51.0 50.9 51.2 51.6 73.8 73.7 73.7 73.8 73.7 72.8
Czech Republic 59.6 59.1 59.5 59.7 60.0 60.2 75.7 75.1 75.7 75.8 76.0 76.5
Denmark 70.1 69.9 70.2 70.4 69.8 69.0 75.0 75.5 75.2 74.4 74.9 74.9
Estonia 65.7 65.3 66.0 65.5 65.9 64.3 71.4 70.6 72.7 71.6 70.4 71.4
Finland 67.8 68.0 68.0 67.7 67.6 67.6 69.9 69.9 70.3 70.0 69.6 69.9
France1
60.4 60.1 60.2 60.5 60.8 61.2 67.9 67.8 67.9 68.0 67.9 67.8
Germany 68.8 68.5 68.6 69.1 69.1 68.9 77.7 77.6 77.8 77.7 77.8 77.9
Greece 40.1 40.5 40.0 39.9 39.9 40.5 58.4 58.6 58.4 58.3 58.3 57.7
Hungary 52.8 52.2 52.4 52.8 53.7 55.5 64.3 62.7 64.3 64.8 65.3 68.1
Iceland 79.0 77.7 78.7 79.8 79.5 77.6 83.2 82.2 83.1 83.5 83.8 83.8
Ireland 55.9 55.5 55.7 56.2 56.2 56.4 65.1 64.1 64.7 65.4 66.2 66.3
Israel 63.0 62.7 62.9 63.2 63.1 64.3 71.2 71.1 70.7 71.4 71.5 71.6
Italy 46.5 46.7 46.4 46.5 46.5 46.6 64.8 65.3 64.7 64.6 64.7 64.5
Japan 62.5 62.0 62.2 62.5 63.2 63.2 80.8 80.4 80.8 80.9 81.1 81.5
Korea 53.9 53.5 53.7 54.2 54.4 54.9 74.9 74.5 74.8 75.0 75.4 75.8
Luxembourg 59.1 59.3 59.9 58.3 58.9 61.3 72.2 71.5 71.3 72.8 72.8 71.5
Mexico 45.0 44.4 45.2 44.9 45.3 44.8 78.3 78.1 78.3 77.9 78.7 78.5
Netherlands 69.9 70.3 70.0 69.8 69.6 68.9 78.7 79.1 78.7 78.3 78.4 78.6
New Zealand 67.9 67.7 67.5 68.0 68.5 69.4 78.5 77.7 78.2 78.7 79.3 79.7
Norway 73.5 73.4 73.4 73.5 73.4 73.1 77.3 77.4 77.3 77.2 77.1 77.1
Poland 53.4 52.9 53.2 53.6 54.1 54.8 66.6 66.3 66.6 66.7 66.9 67.4
Portugal 58.2 57.5 57.6 58.5 59.2 59.2 64.0 63.1 63.8 64.0 64.9 64.9
Slovak Republic 53.3 53.2 53.2 53.4 53.7 54.1 66.4 66.7 66.5 66.3 66.1 66.5
Slovenia 59.2 59.2 59.0 59.5 59.2 59.7 67.1 67.0 66.8 67.6 66.9 66.7
Spain 50.3 50.4 50.2 50.2 50.5 50.8 59.2 59.2 59.1 59.2 59.5 59.7
Sweden 72.5 72.1 72.4 72.5 72.8 72.7 76.3 76.1 76.2 76.5 76.4 76.4
Switzerland 74.4 74.2 74.2 74.1 75.1 74.1 84.7 84.5 84.4 84.5 85.2 83.9
Turkey 29.7 29.9 29.7 29.5 29.5 29.6 69.5 70.0 69.7 69.0 69.2 70.4
United Kingdom 65.9 65.7 65.8 65.9 66.3 66.6 75.6 75.2 75.4 75.9 76.1 76.7
United States 62.3 62.1 62.3 62.5 62.4 62.9 72.6 72.6 72.5 72.5 72.6 72.9
1 Statistical break in Q4-2012 for France, following the introduction of a revised labour force survey questionnaire (from 1 January
2013 onwards). European Union and Euro area aggregates are also affected, and, to a lesser extent OECD-Total and Major seven
aggregates.
4. Paris, 16 July 2014
OECD QuarterlyEmployment Situation
News Release: 1st
Quarter 2014
4
Table 3: OECD employment rates by age
Employment as a percentage of corresponding working age population, seasonally adjusted
Youth (15-24) Prime-age w orkers (25-54) Older w orkers (55-64)
2013 2014 2013 2014 2013 2014
Q2 Q3 Q4 Q1 Q2 Q3 Q4 Q1 Q2 Q3 Q4 Q1
OECD - Total 39.3 39.3 39.4 39.6 75.6 75.6 75.7 75.9 56.2 56.5 56.7 56.9
Major Seven 42.2 42.4 42.6 42.6 78.1 78.1 78.2 78.5 59.3 59.7 59.8 60.2
European Union 32.3 32.3 32.3 32.4 76.7 76.8 76.9 77.3 49.8 50.4 50.9 51.4
Euro area 31.6 31.3 31.1 30.9 75.8 75.7 75.8 76.0 49.8 50.4 50.7 51.2
Australia 59.1 58.7 58.0 57.8 79.2 79.0 78.9 79.0 61.9 61.2 61.1 61.0
Austria 54.2 53.9 53.6 53.7 85.0 85.0 84.8 85.0 44.9 45.1 46.1 45.8
Belgium 23.8 24.5 22.9 22.1 79.3 79.2 78.8 79.6 41.7 42.8 41.7 41.1
Canada 55.3 55.0 54.8 54.9 81.5 81.5 81.5 81.4 60.7 60.4 60.2 60.4
Chile 30.4 30.2 30.3 30.4 75.3 75.2 75.1 74.8 63.9 63.6 65.0 64.8
Czech Republic 25.7 25.5 25.6 26.3 83.7 83.5 83.7 83.7 51.3 52.0 52.6 52.9
Denmark 53.6 53.2 53.2 52.2 82.5 81.9 81.6 81.1 61.6 62.4 61.9 61.8
Estonia 33.8 32.5 31.7 32.5 80.3 80.0 81.0 80.2 64.6 61.7 61.2 59.6
Finland 41.6 40.9 42.0 41.2 81.5 80.8 80.5 80.6 58.6 58.9 58.6 59.1
France1
28.5 28.5 28.9 28.9 80.6 80.8 80.8 80.8 45.5 45.7 45.9 46.4
Germany 47.0 46.7 46.6 46.1 83.4 83.3 83.2 83.3 63.1 63.9 64.4 65.1
Greece 11.7 12.0 12.2 12.1 61.6 61.3 61.3 61.6 35.9 35.8 35.0 35.1
Hungary 19.6 20.2 20.5 23.3 75.4 75.8 76.6 78.6 38.3 38.7 39.4 40.8
Iceland 67.9 70.3 71.8 70.7 84.7 85.3 84.7 83.7 80.8 81.3 81.3 82.0
Ireland 28.9 29.1 28.9 28.5 70.6 71.3 72.1 71.9 50.6 51.4 52.9 52.5
Israel 76.8 77.4 77.4 78.1 65.2 63.6 64.5 66.0
Italy 16.8 16.3 15.5 15.1 68.4 68.2 68.1 67.8 42.1 43.3 44.1 45.1
Japan 39.7 39.8 40.0 40.3 81.3 81.4 81.8 81.9 66.4 67.0 67.6 68.0
Korea 23.9 24.2 24.8 25.4 74.8 75.2 75.4 75.7 64.1 64.7 65.0 65.6
Luxembourg 22.7 19.5 24.5 26.2 82.0 83.8 82.6 83.1 43.0 39.1 39.1 40.2
Mexico 42.4 41.7 42.0 42.0 70.6 70.5 71.0 70.5 55.1 54.9 55.7 55.0
Netherlands 62.7 61.9 61.8 60.9 82.5 82.0 81.9 81.9 59.8 60.4 60.7 60.0
New Zealand 49.8 49.8 51.3 52.1 80.2 81.3 81.6 81.9 75.1 74.1 74.8 76.1
Norway 51.8 51.5 50.9 50.1 84.0 84.3 84.1 83.8 71.6 71.4 70.8 71.5
Poland 24.4 24.1 24.3 25.6 76.8 77.2 77.3 77.7 40.2 40.8 41.6 41.9
Portugal 21.7 23.1 23.0 21.9 74.0 74.7 75.7 76.3 46.8 46.9 47.5 47.5
Slovak Republic 20.7 20.5 19.8 20.9 75.9 75.8 76.1 76.8 44.0 44.1 43.9 43.0
Slovenia 26.5 26.9 25.6 25.6 81.5 82.3 81.9 81.9 33.7 33.7 33.8 33.7
Spain 16.9 16.6 16.7 16.6 65.6 65.7 66.2 66.5 43.0 43.6 43.7 43.5
Sweden 41.2 42.0 42.5 42.6 85.4 85.4 85.3 85.2 73.3 73.7 74.2 73.8
Switzerland 61.3 61.0 62.9 60.5 86.2 86.3 87.0 86.1 72.0 71.6 71.8 71.1
Turkey 32.8 32.5 31.1 34.3 59.1 58.8 59.1 59.2 31.6 31.3 31.3 31.0
United Kingdom 46.1 46.7 47.1 47.4 80.9 80.9 81.2 81.8 59.6 60.2 60.6 60.9
United States 46.2 46.5 46.9 46.9 75.9 76.0 75.9 76.5 60.9 61.0 60.6 60.9
1 Statistical break in Q4-2012 for France, following the introduction of a revised labour force survey questionnaire (from 1 January
2013 onwards). European Union and Euro area aggregates are also affected, and, to a lesser extent OECD-Total and Major seven
aggregates.