Download as PDF, PPTX


![Graph Structure
Vertices 1, 2, 3, 4, are connected based on the
contribution to same repositories.
Graph answers following queries:
❏ Find the clusters in the Graph using Connected
Components.
❏ Compute top contributor using Pagerank.
Data structure to hold vertices and Edges looks like this:
val vertexRDD: RDD[(Long, (String, List<String>))]
val edgeRDD: RDD[Edge[Long]]](https://image.slidesharecdn.com/di-week-3-160229213053/85/GitConnect-7-320.jpg)
![Schema
component_vertex
component_lookup
user_id user_ranks
user_rank
vertex_id component_id
component_id vertex_list list<text>
{"id":"3390141329","type":"PushEvent","actor":{"id":
5126316,"login":"wjfwzzc","gravatar_id":"","url":"https:
//api.github.com/users/wjfwzzc","avatar_url":"https:
//avatars.githubusercontent.com/u/5126316?"},"repo":
{"id":46919799,"name":"wjfwzzc/Kaggle_Script","url":"
https://api.github.com/repos/wjfwzzc/Kaggle_Script"},"
payload":{"push_id":883618927,"size":1,"distinct_size":
1,"ref":"refs/heads/master","head":"
88efd7dbaf6f5392e08fd25b910c395649cce9a3","
before":"
9e8c5025706526abcc61ef8da9062dc42481c36a","
commits":[{"sha":"
88efd7dbaf6f5392e08fd25b910c395649cce9a3","
author":{"email":"wjfwzzc@gmail.com","name":"
wjfwzzc"},"message":"upgrade README.md","distinct":
true,"url":"https://api.github.
com/repos/wjfwzzc/Kaggle_Script/commits/88efd7dba
f6f5392e08fd25b910c395649cce9a3"}]},"public":true,"
created_at":"2015-11-30T09:02:36Z"}
PushEvent](https://image.slidesharecdn.com/di-week-3-160229213053/85/GitConnect-8-320.jpg)
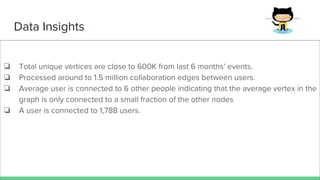


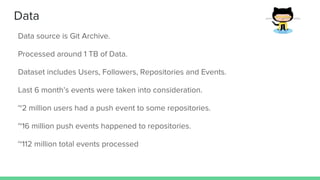
This document summarizes a project analyzing GitHub user connection data to identify influential users and communities. The project processed over 1TB of GitHub event data from the past 6 months involving over 2 million users and 16 million events to construct a user collaboration graph. Insights from the graph found on average each user collaborates with 6 others, with some users connected to over 1,700 others. Challenges included the unstructured data and optimizing Spark jobs to handle the large data volumes within memory constraints.