Download to read offline

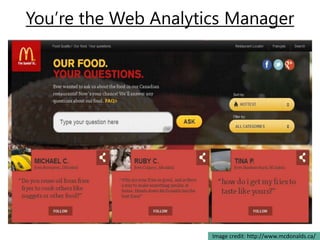

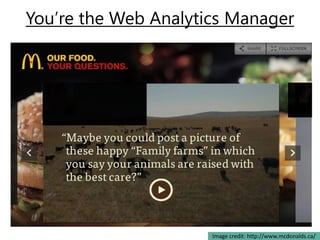
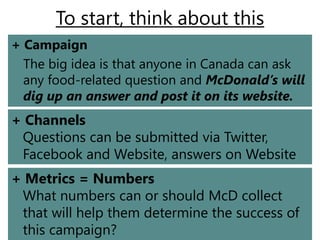
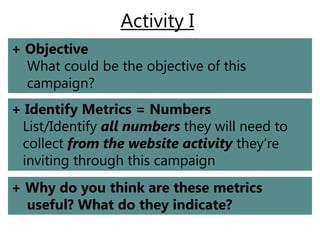
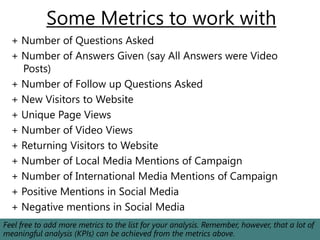
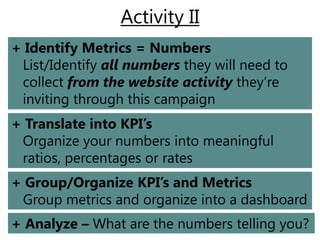
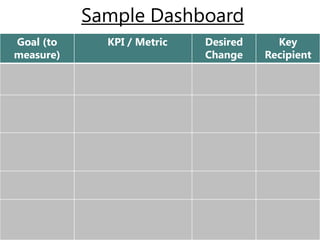
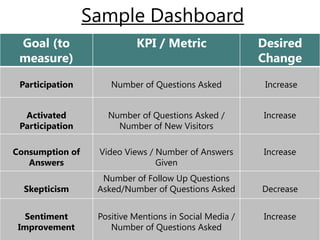


This document discusses a hypothetical campaign by McDonald's Canada to answer food-related questions submitted by the public. It provides guidance on developing a dashboard to measure the campaign's performance. Key points: 1) McDonald's is launching a campaign inviting the public to submit food questions, which it will answer on its website. Questions can be submitted on Twitter, Facebook, or the website. 2) Metrics like the number of questions, answers, video views, and social media mentions are identified to measure objectives like participation, consumption of answers, and sentiment. 3) The document guides developing a dashboard organizing these metrics into meaningful KPIs to analyze goals like participation, activated participation, consumption of answers, and reducing skepticism


