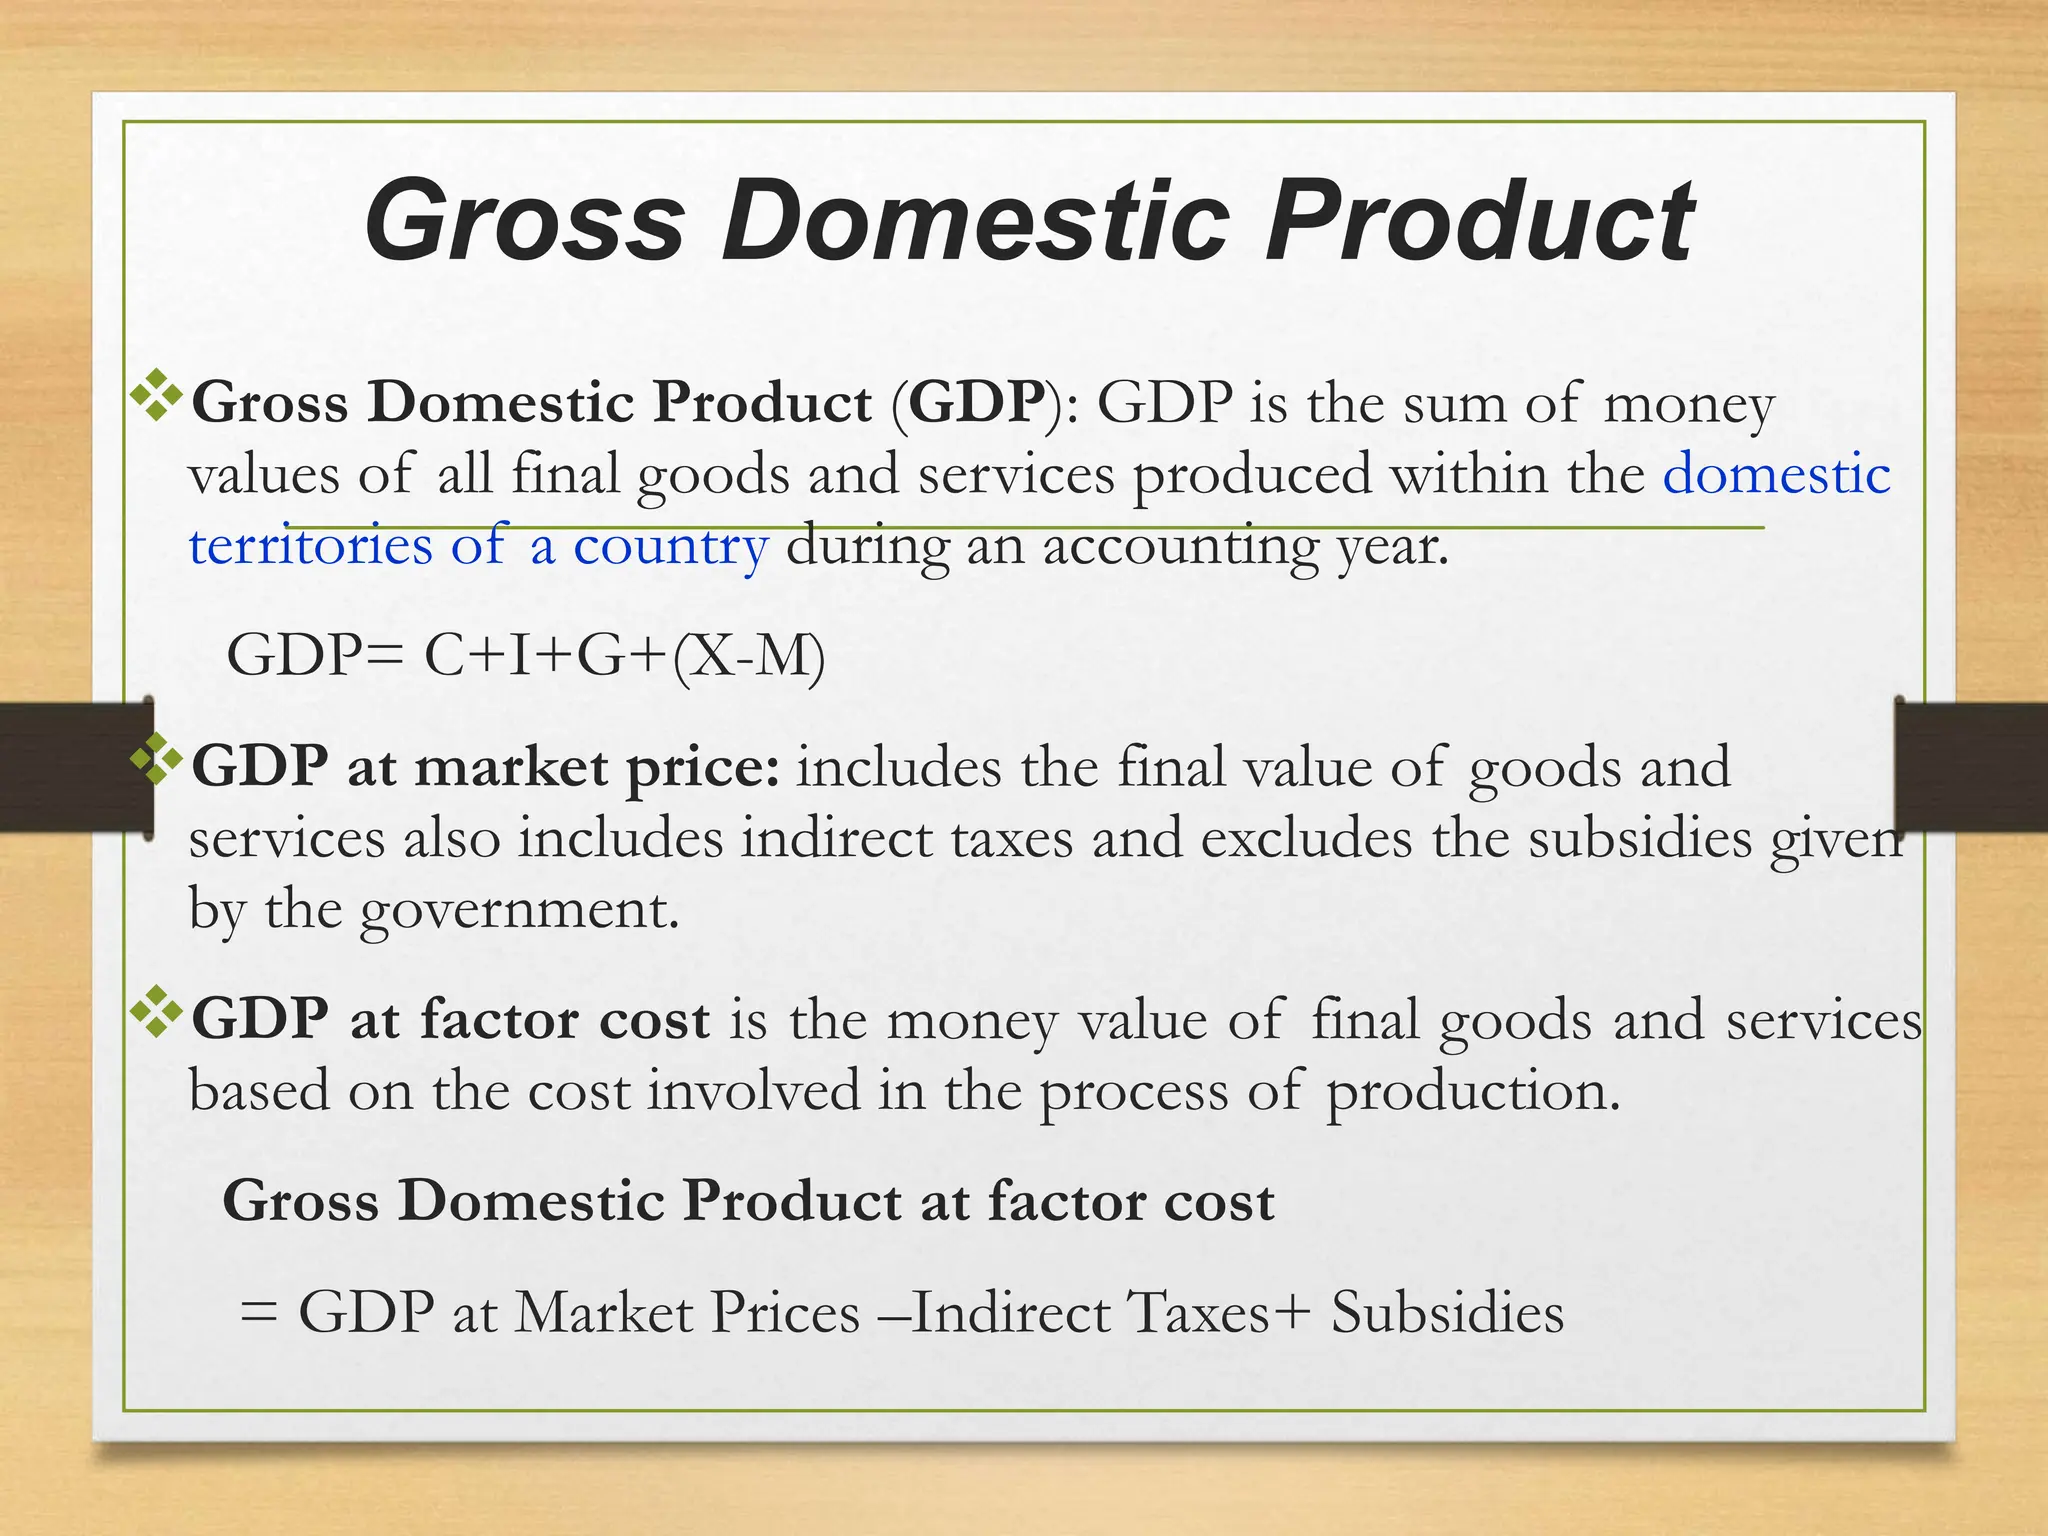
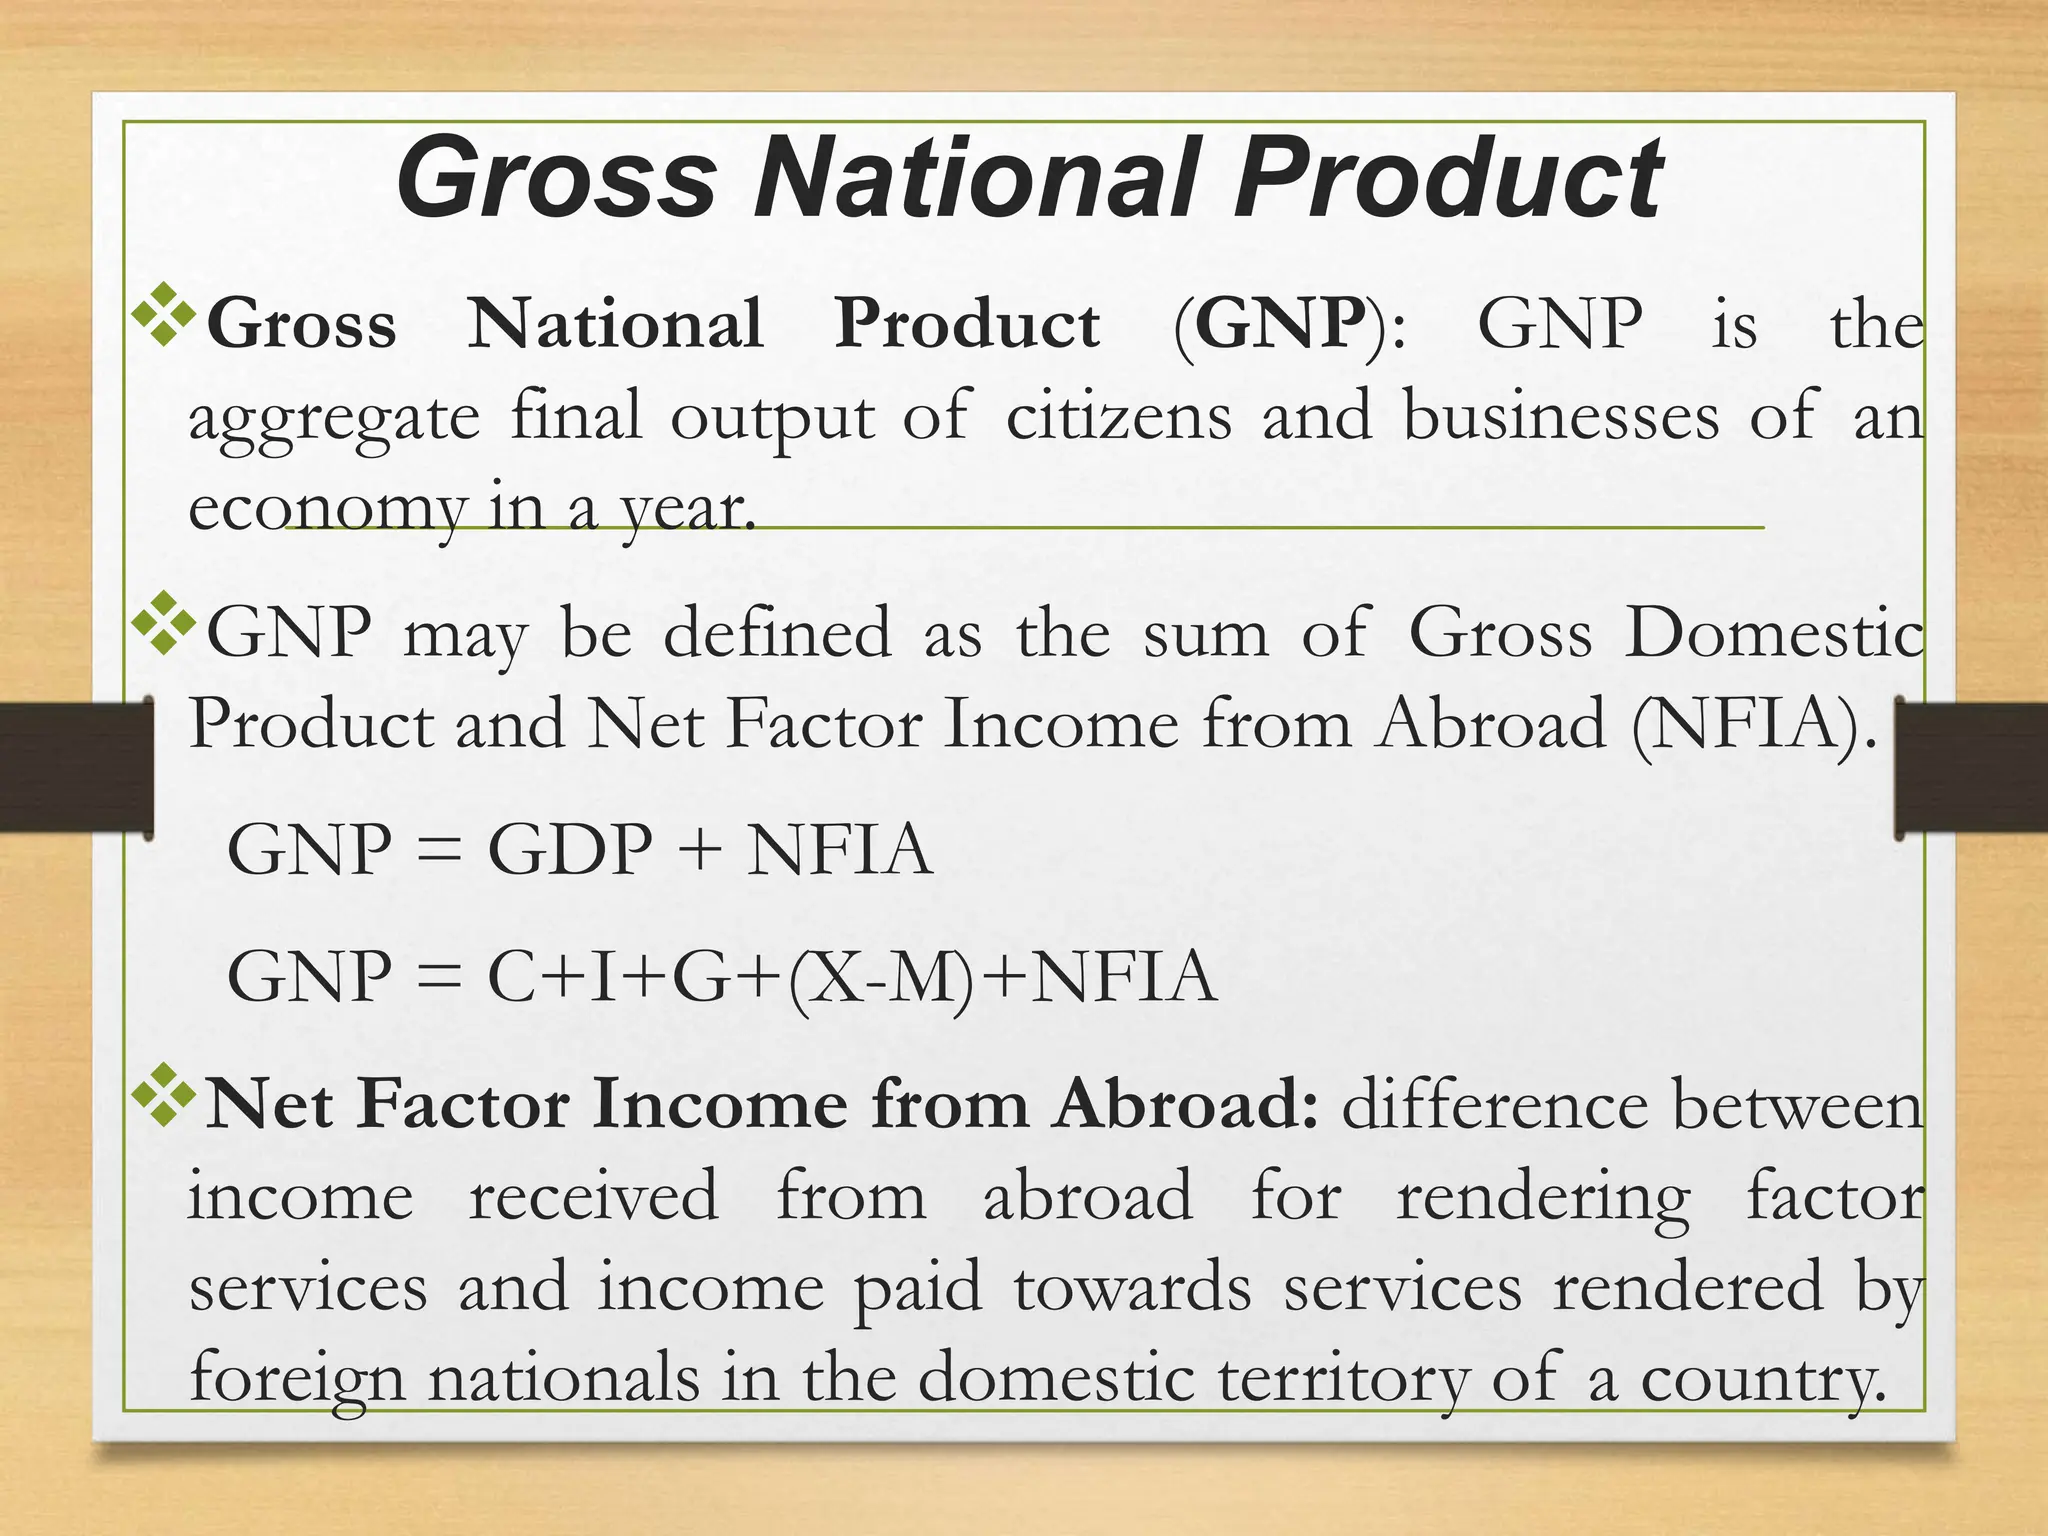
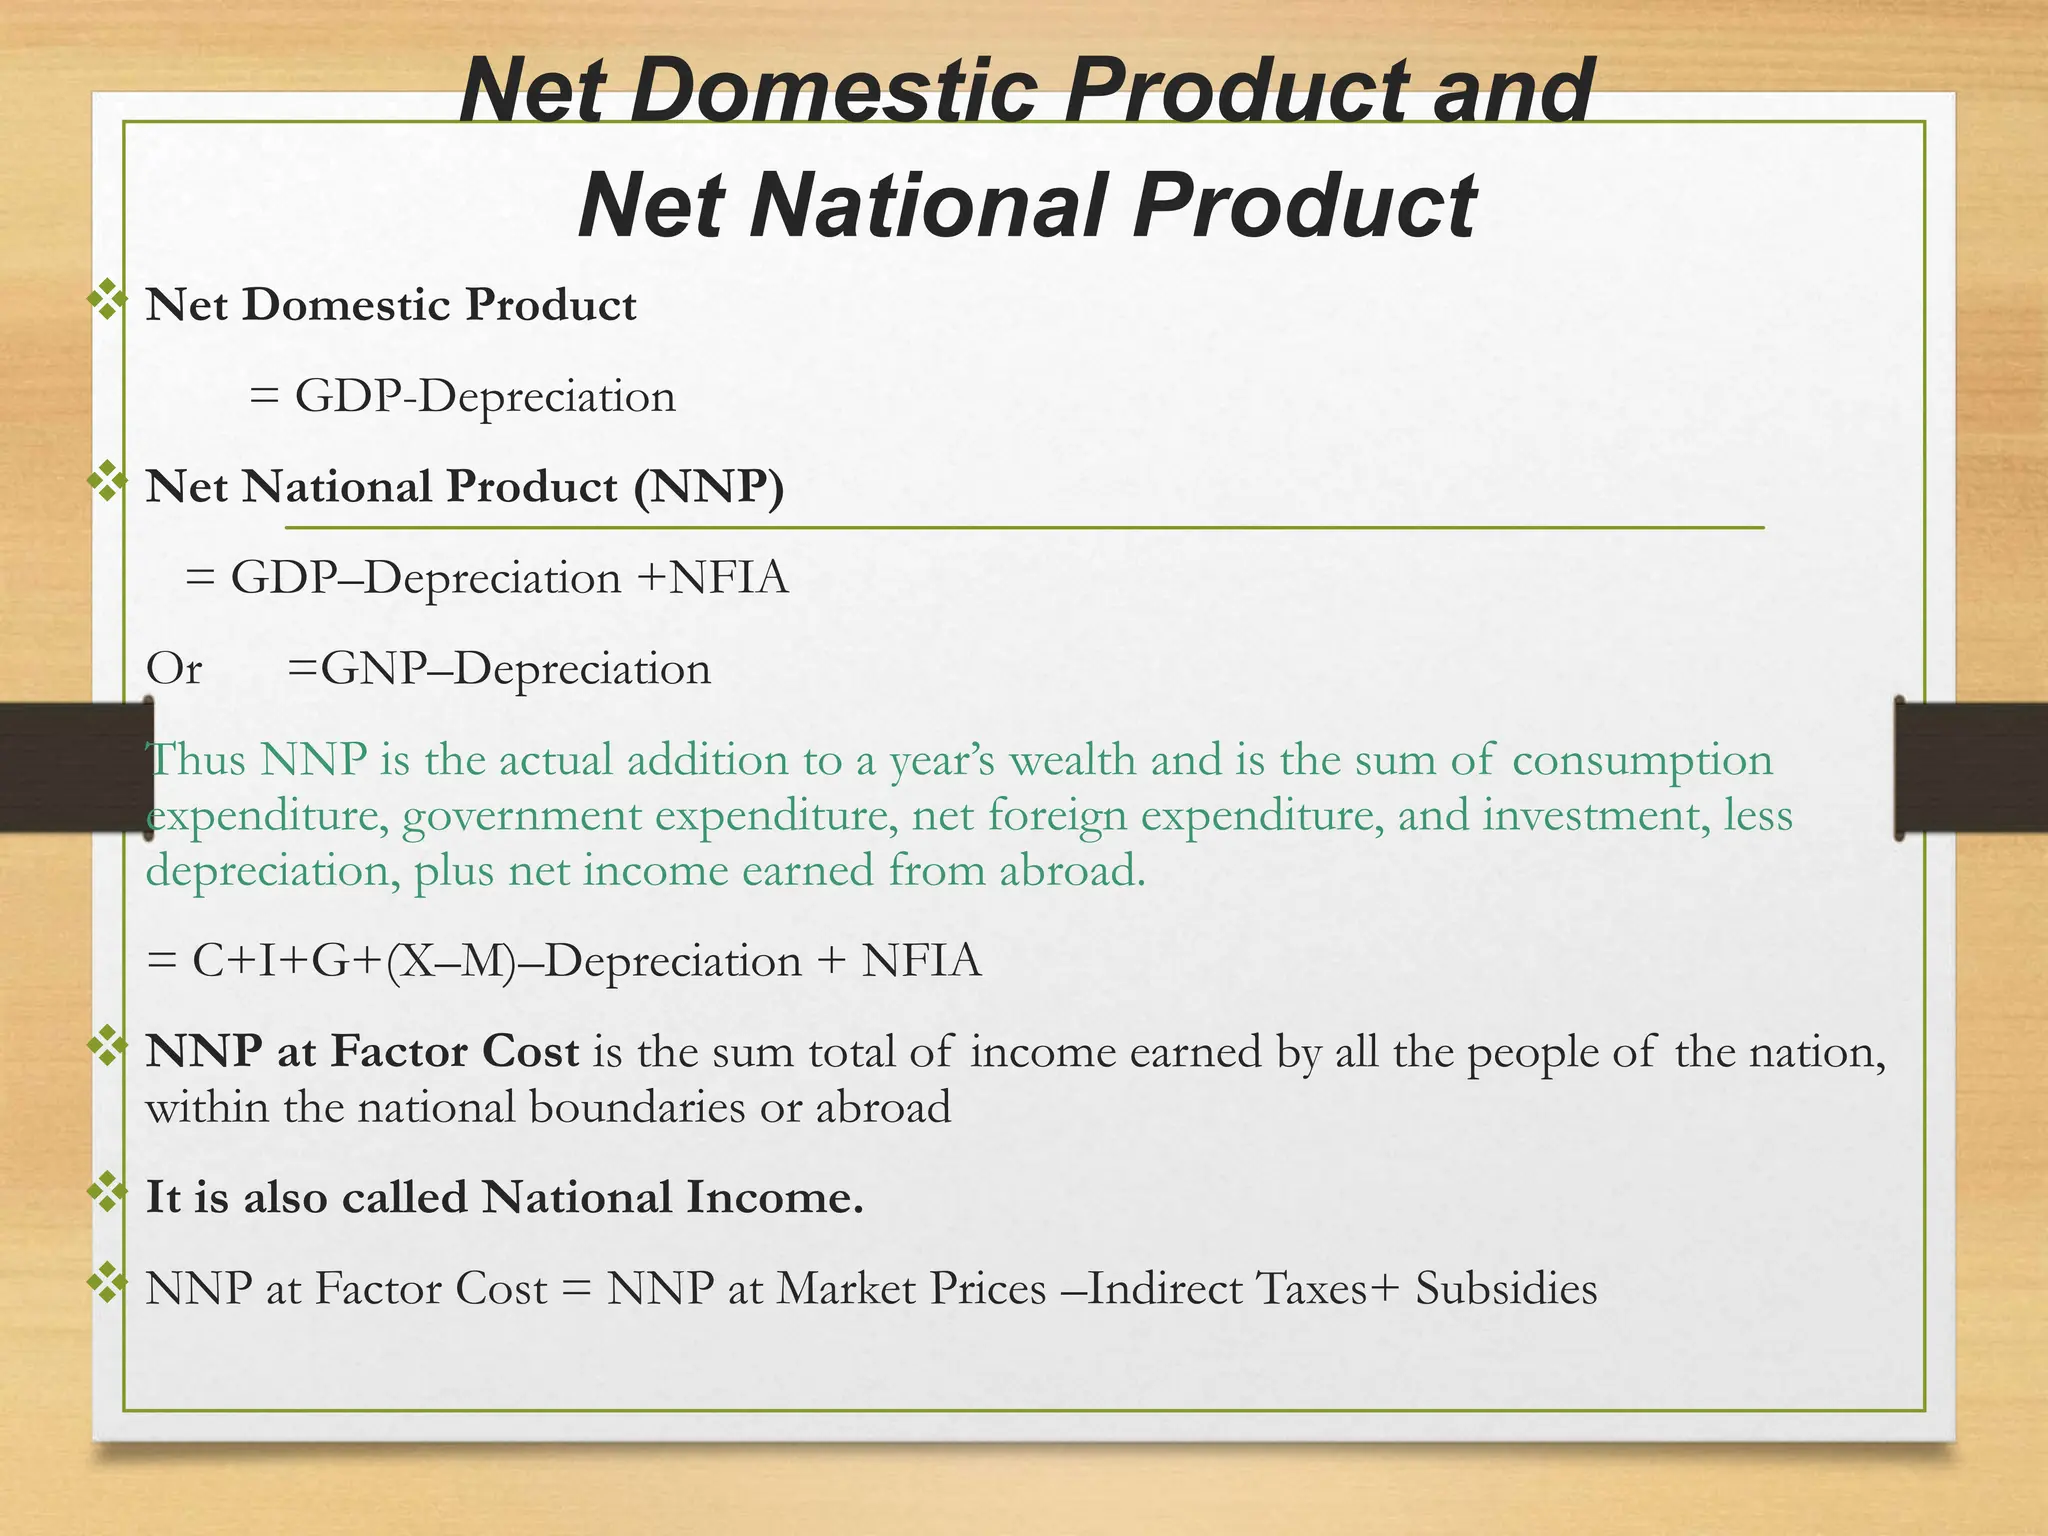
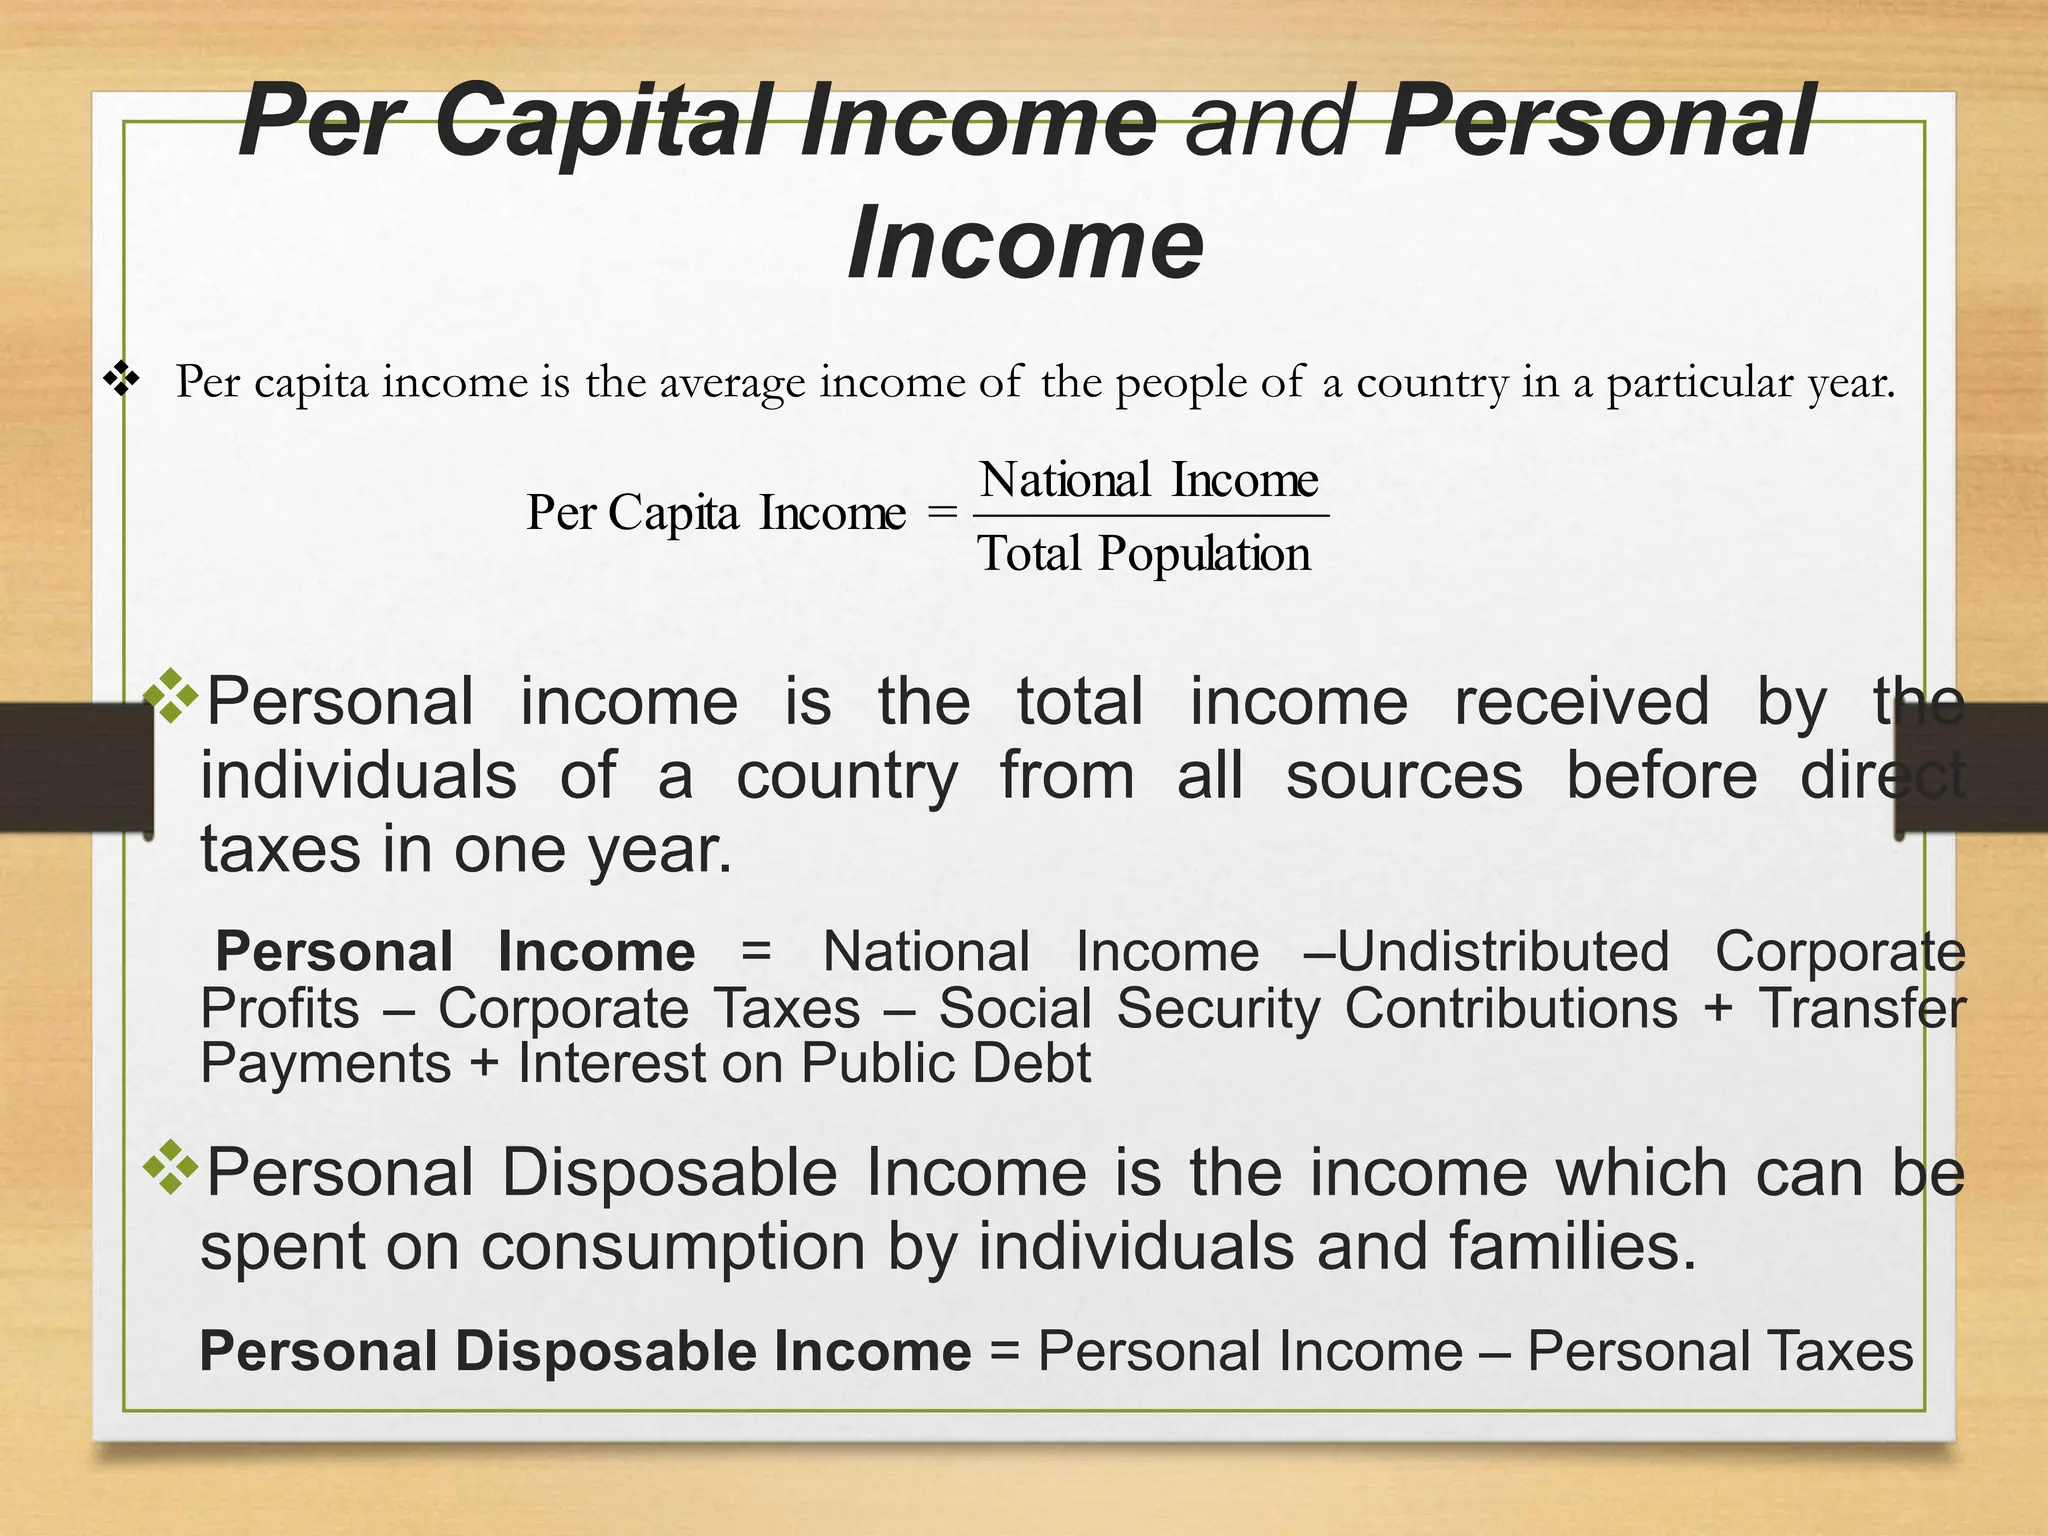
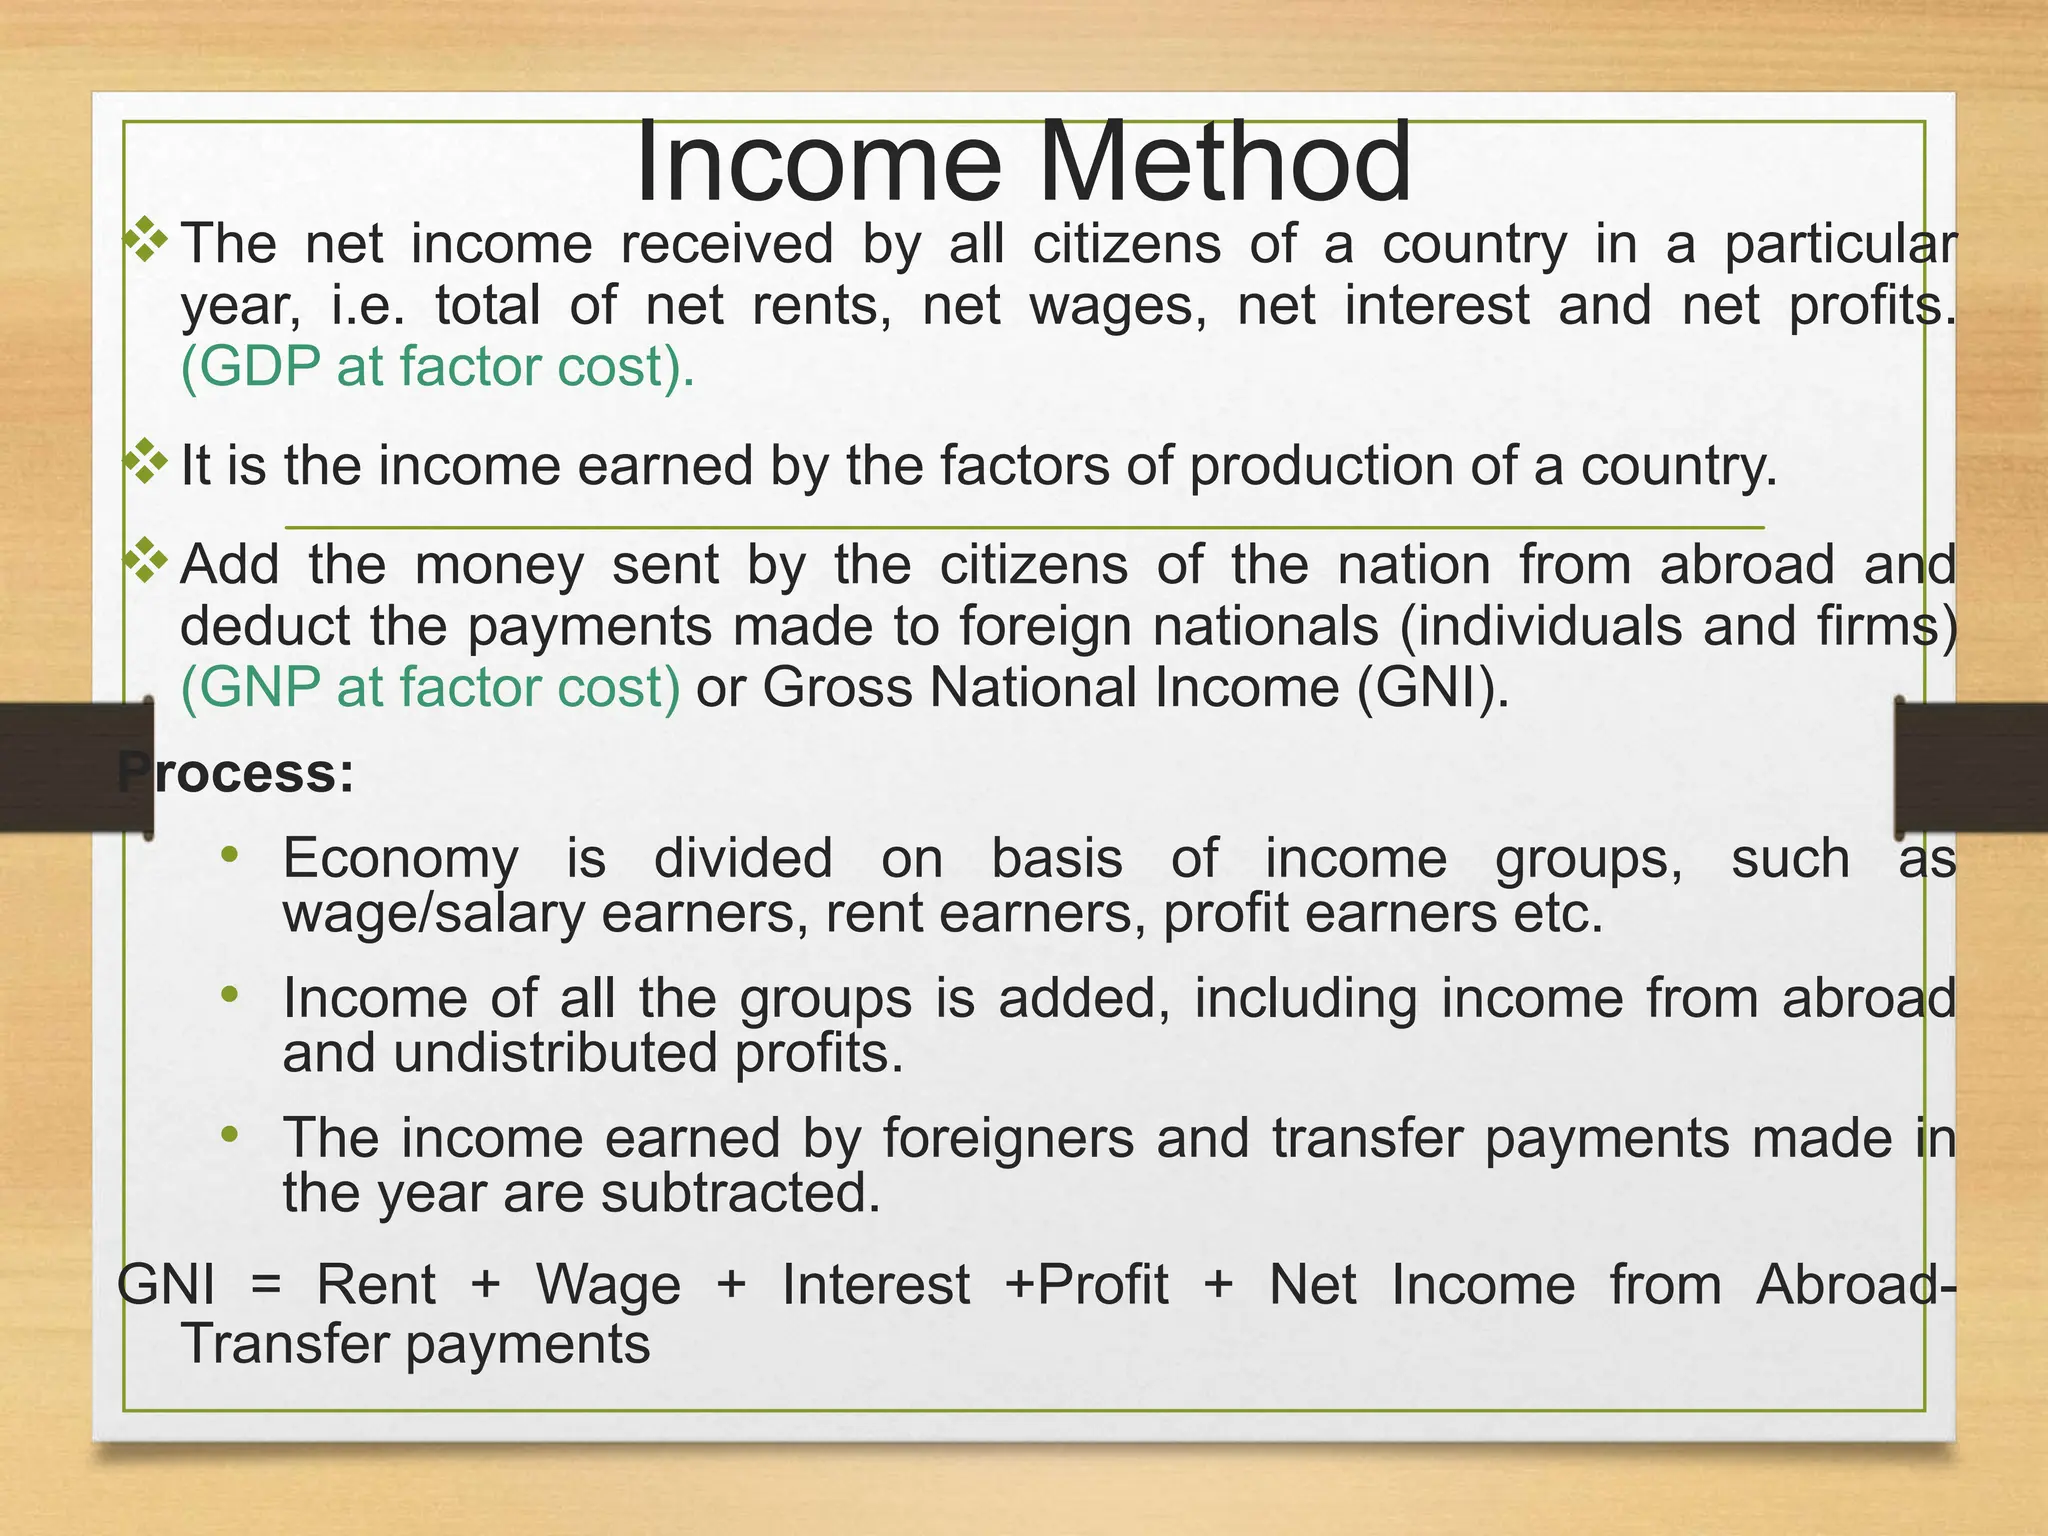
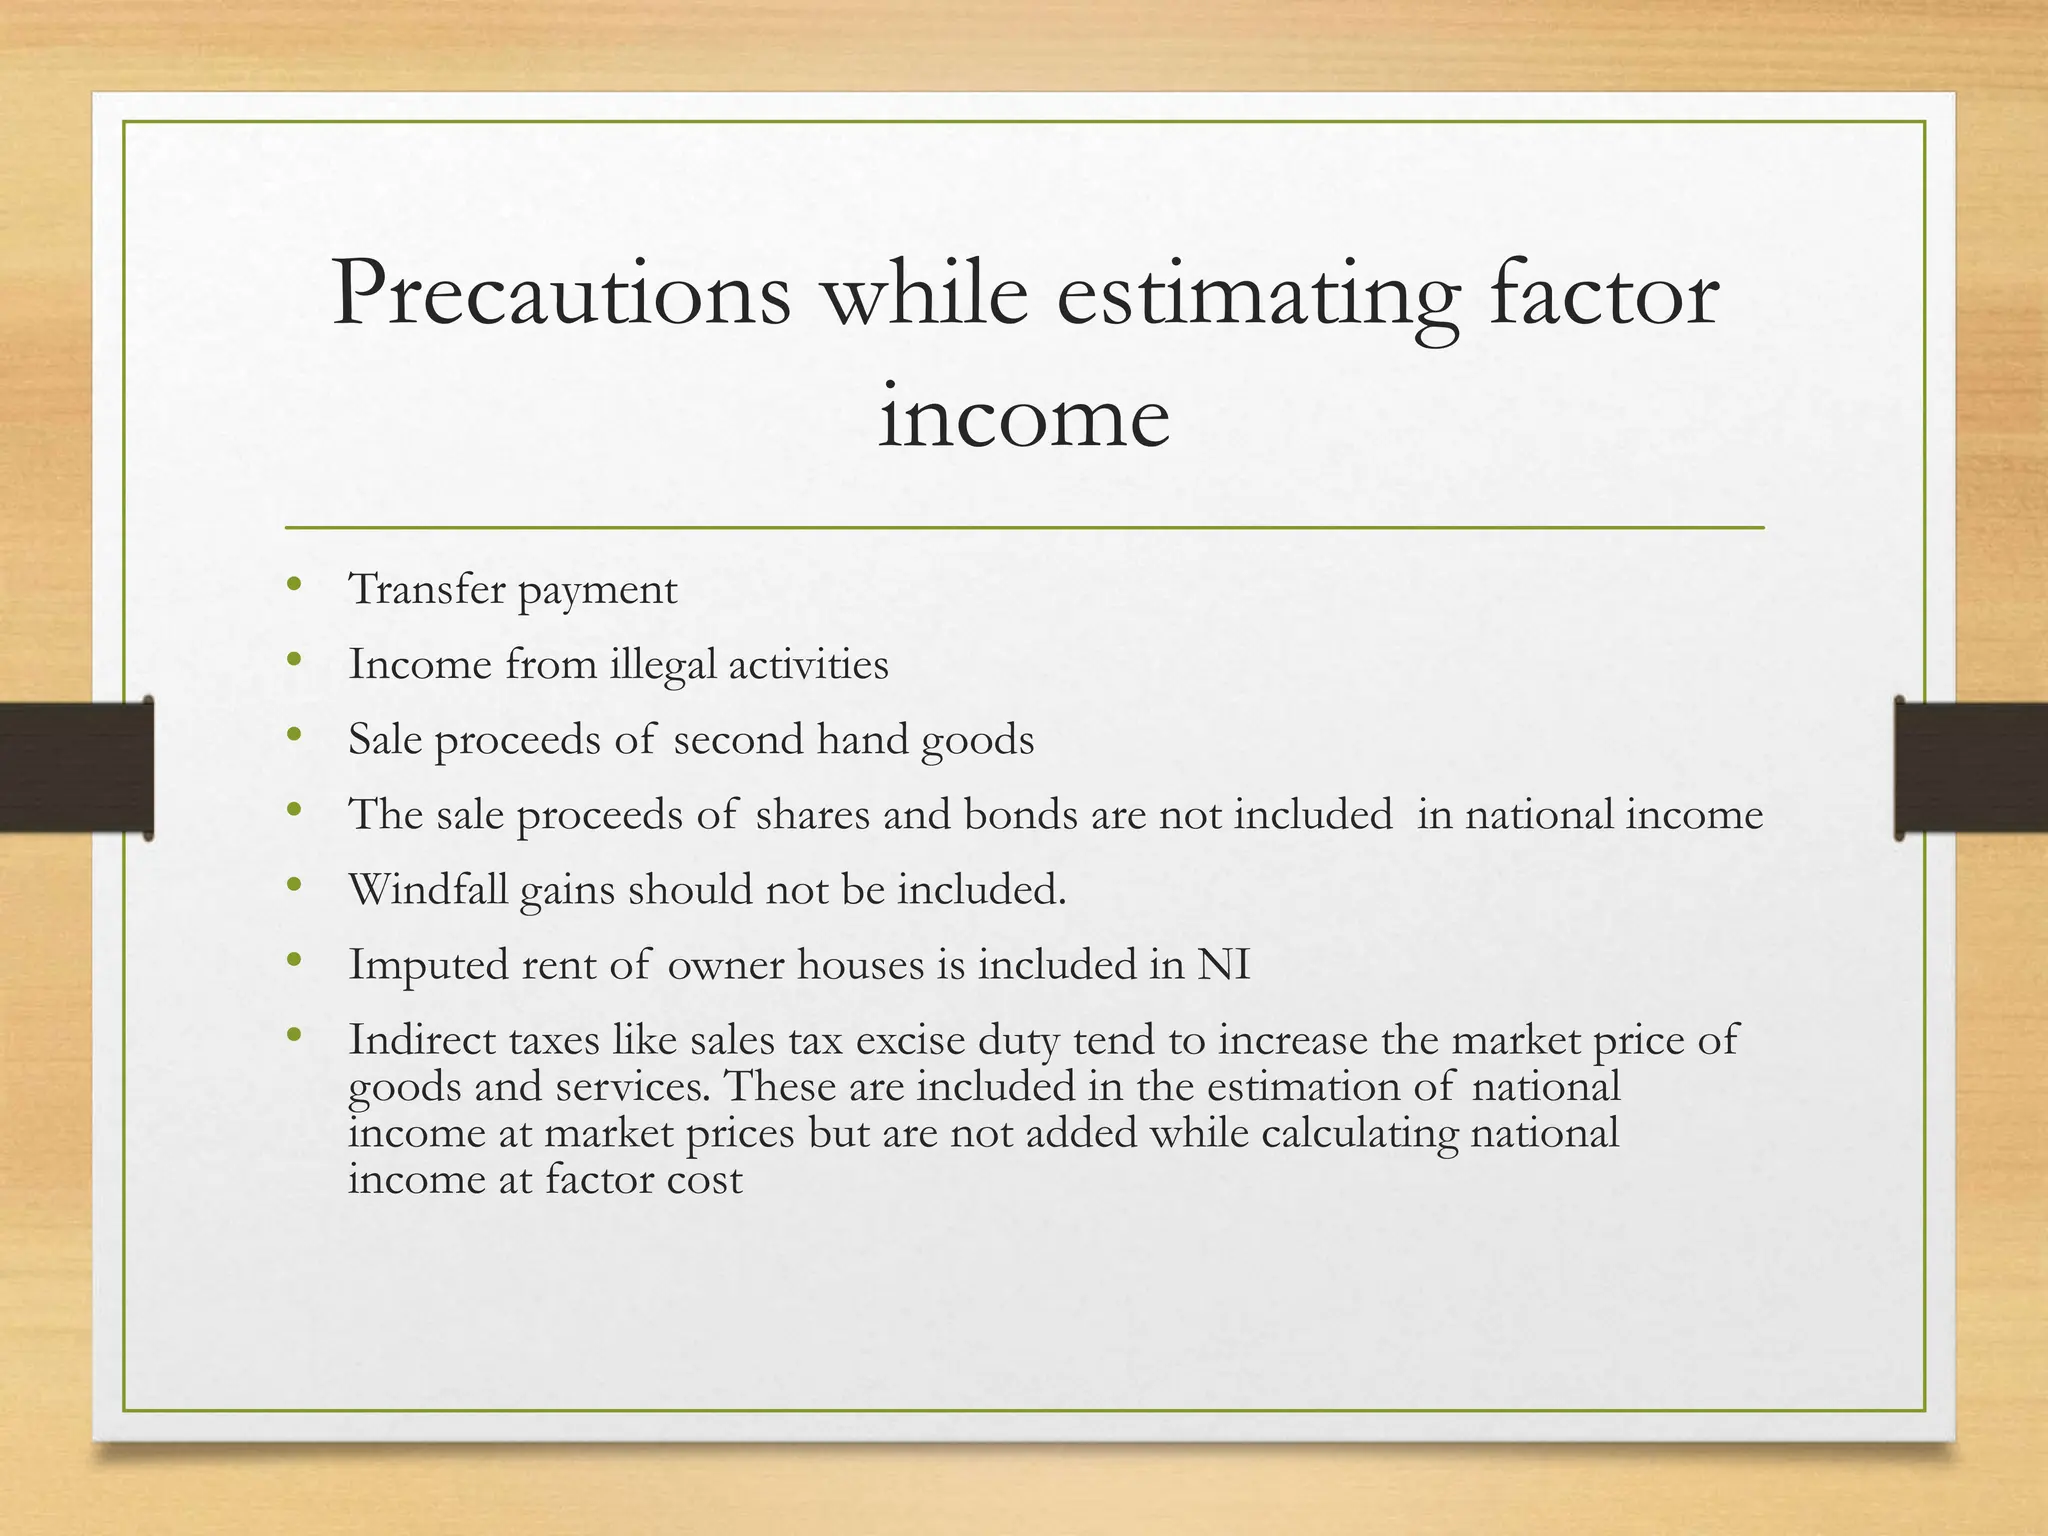
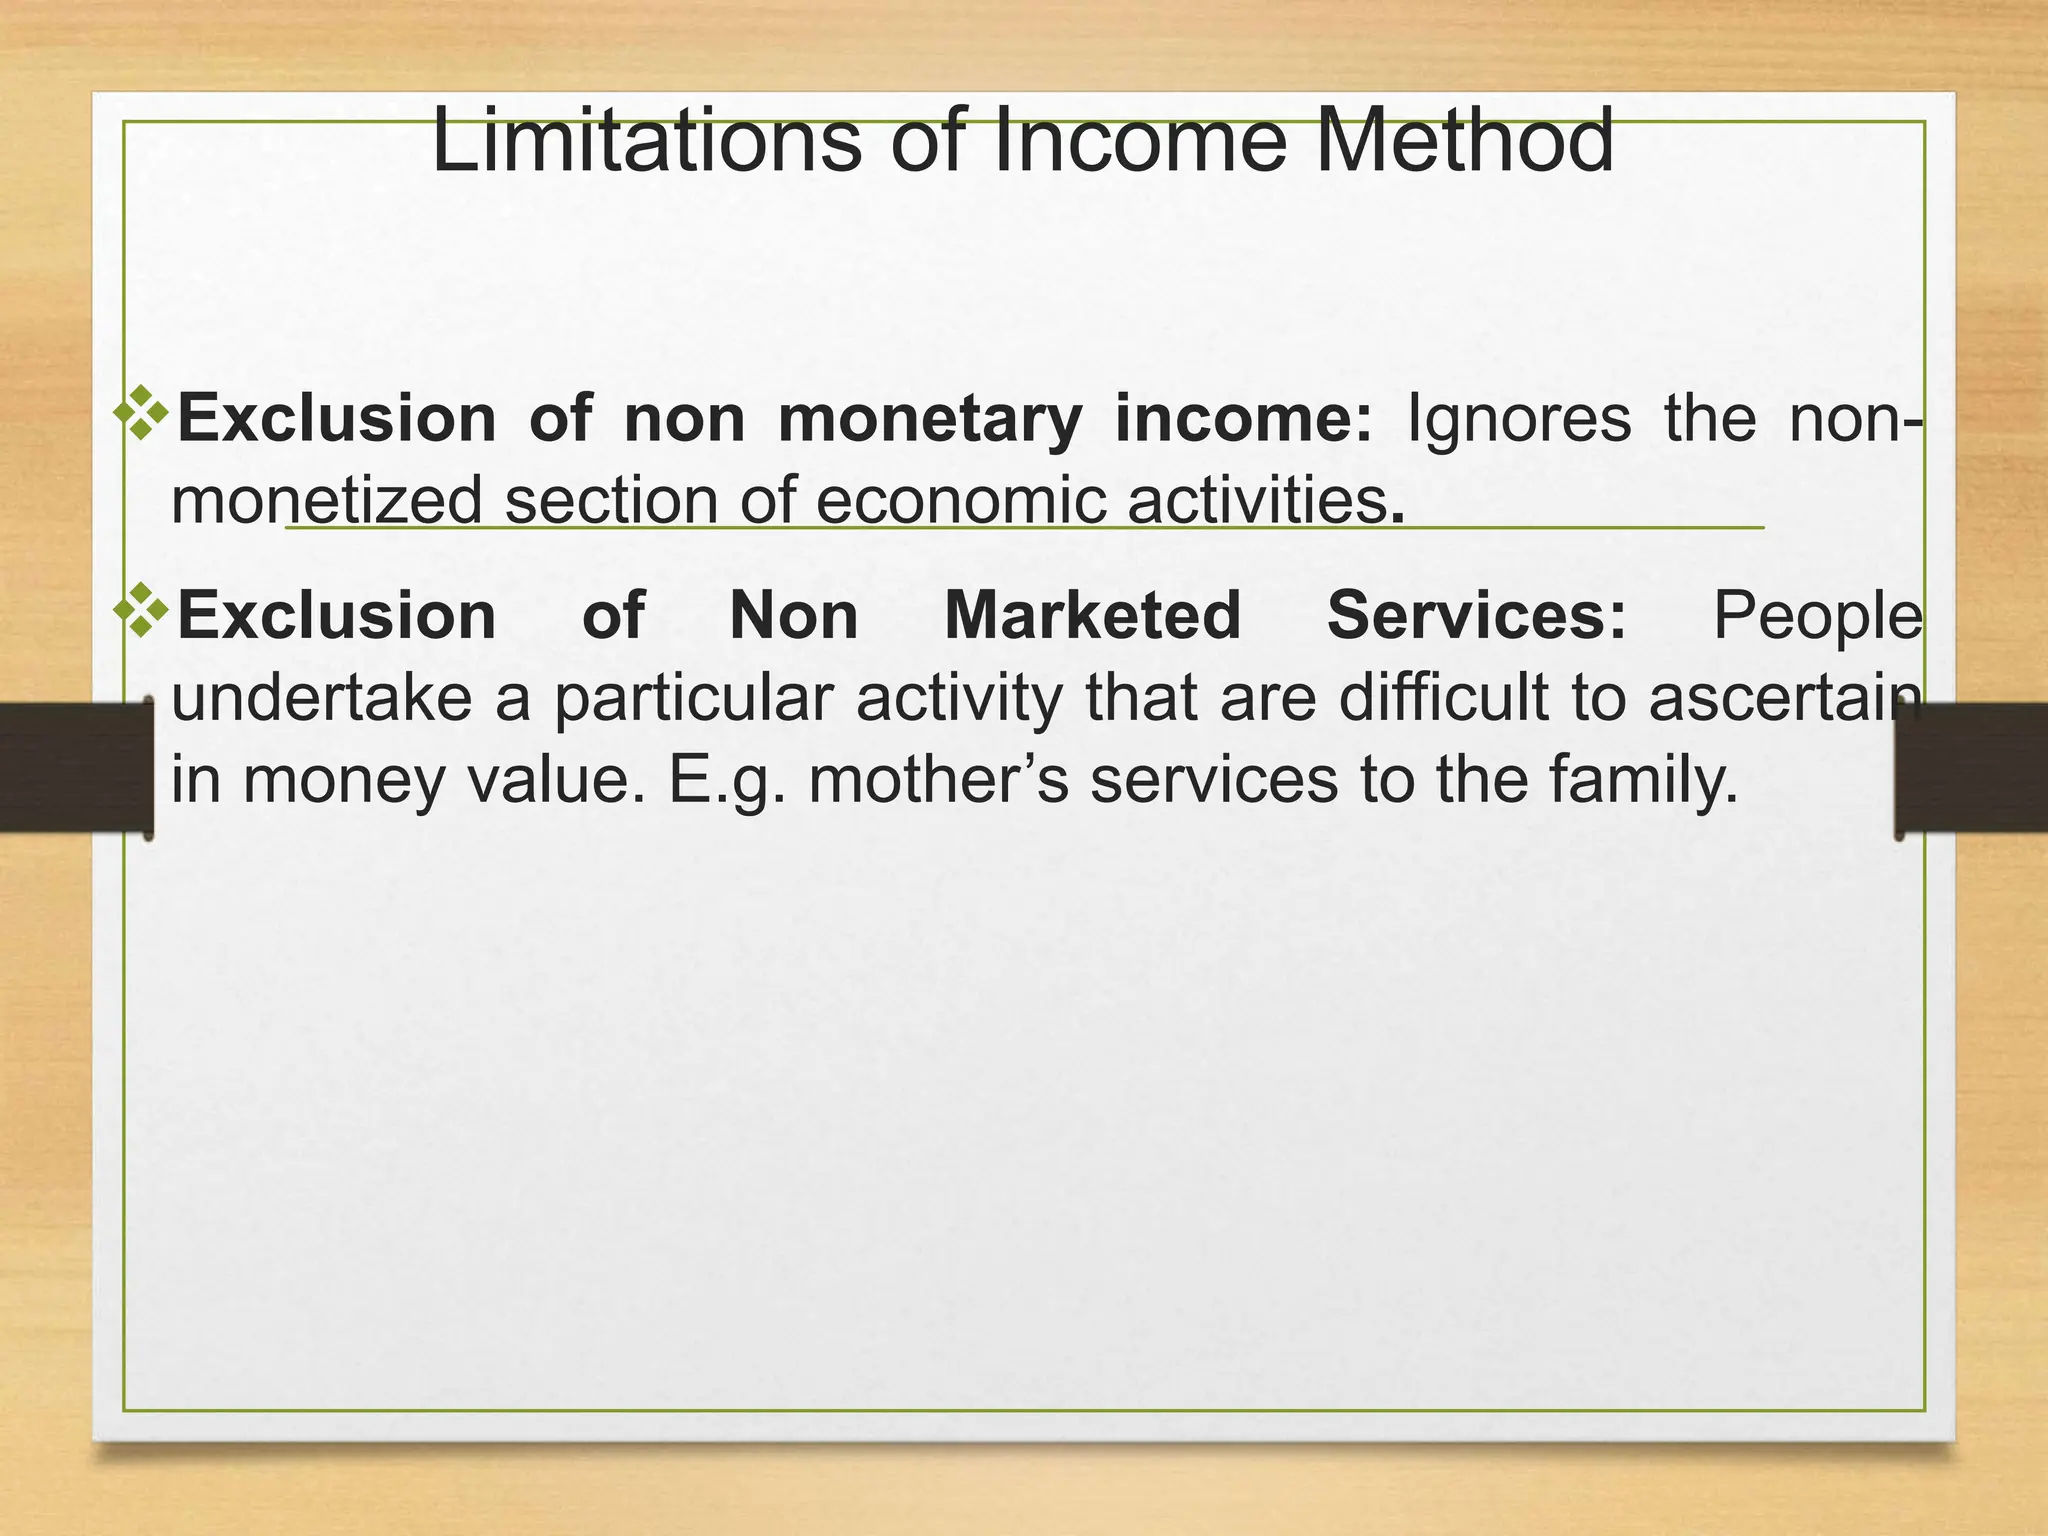
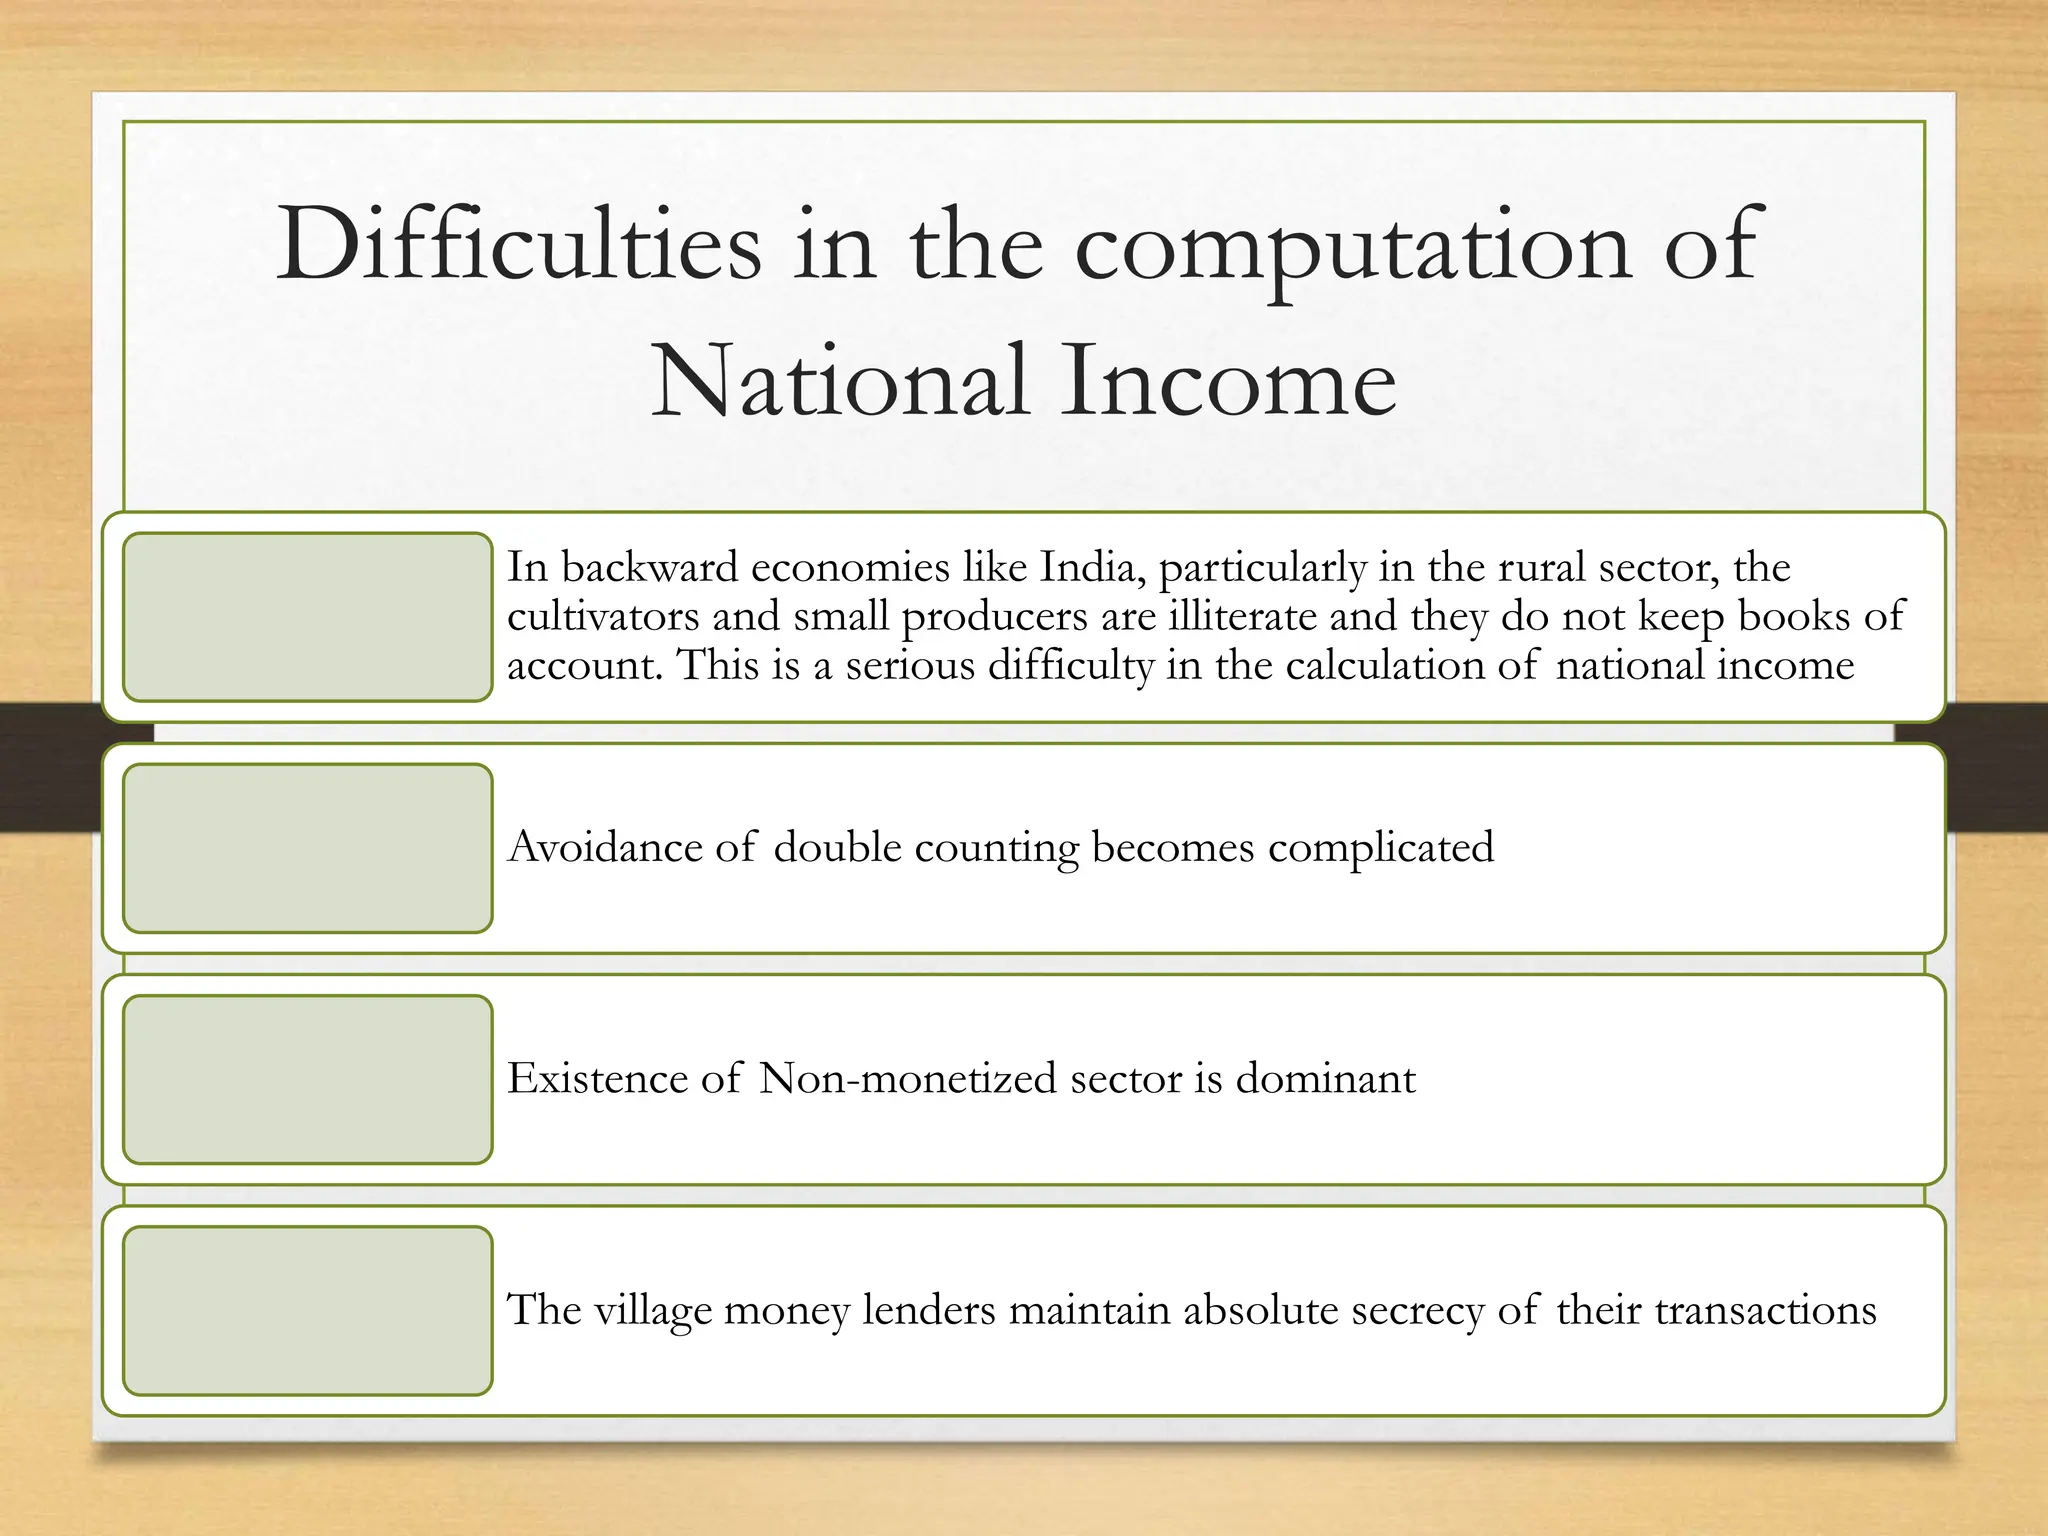
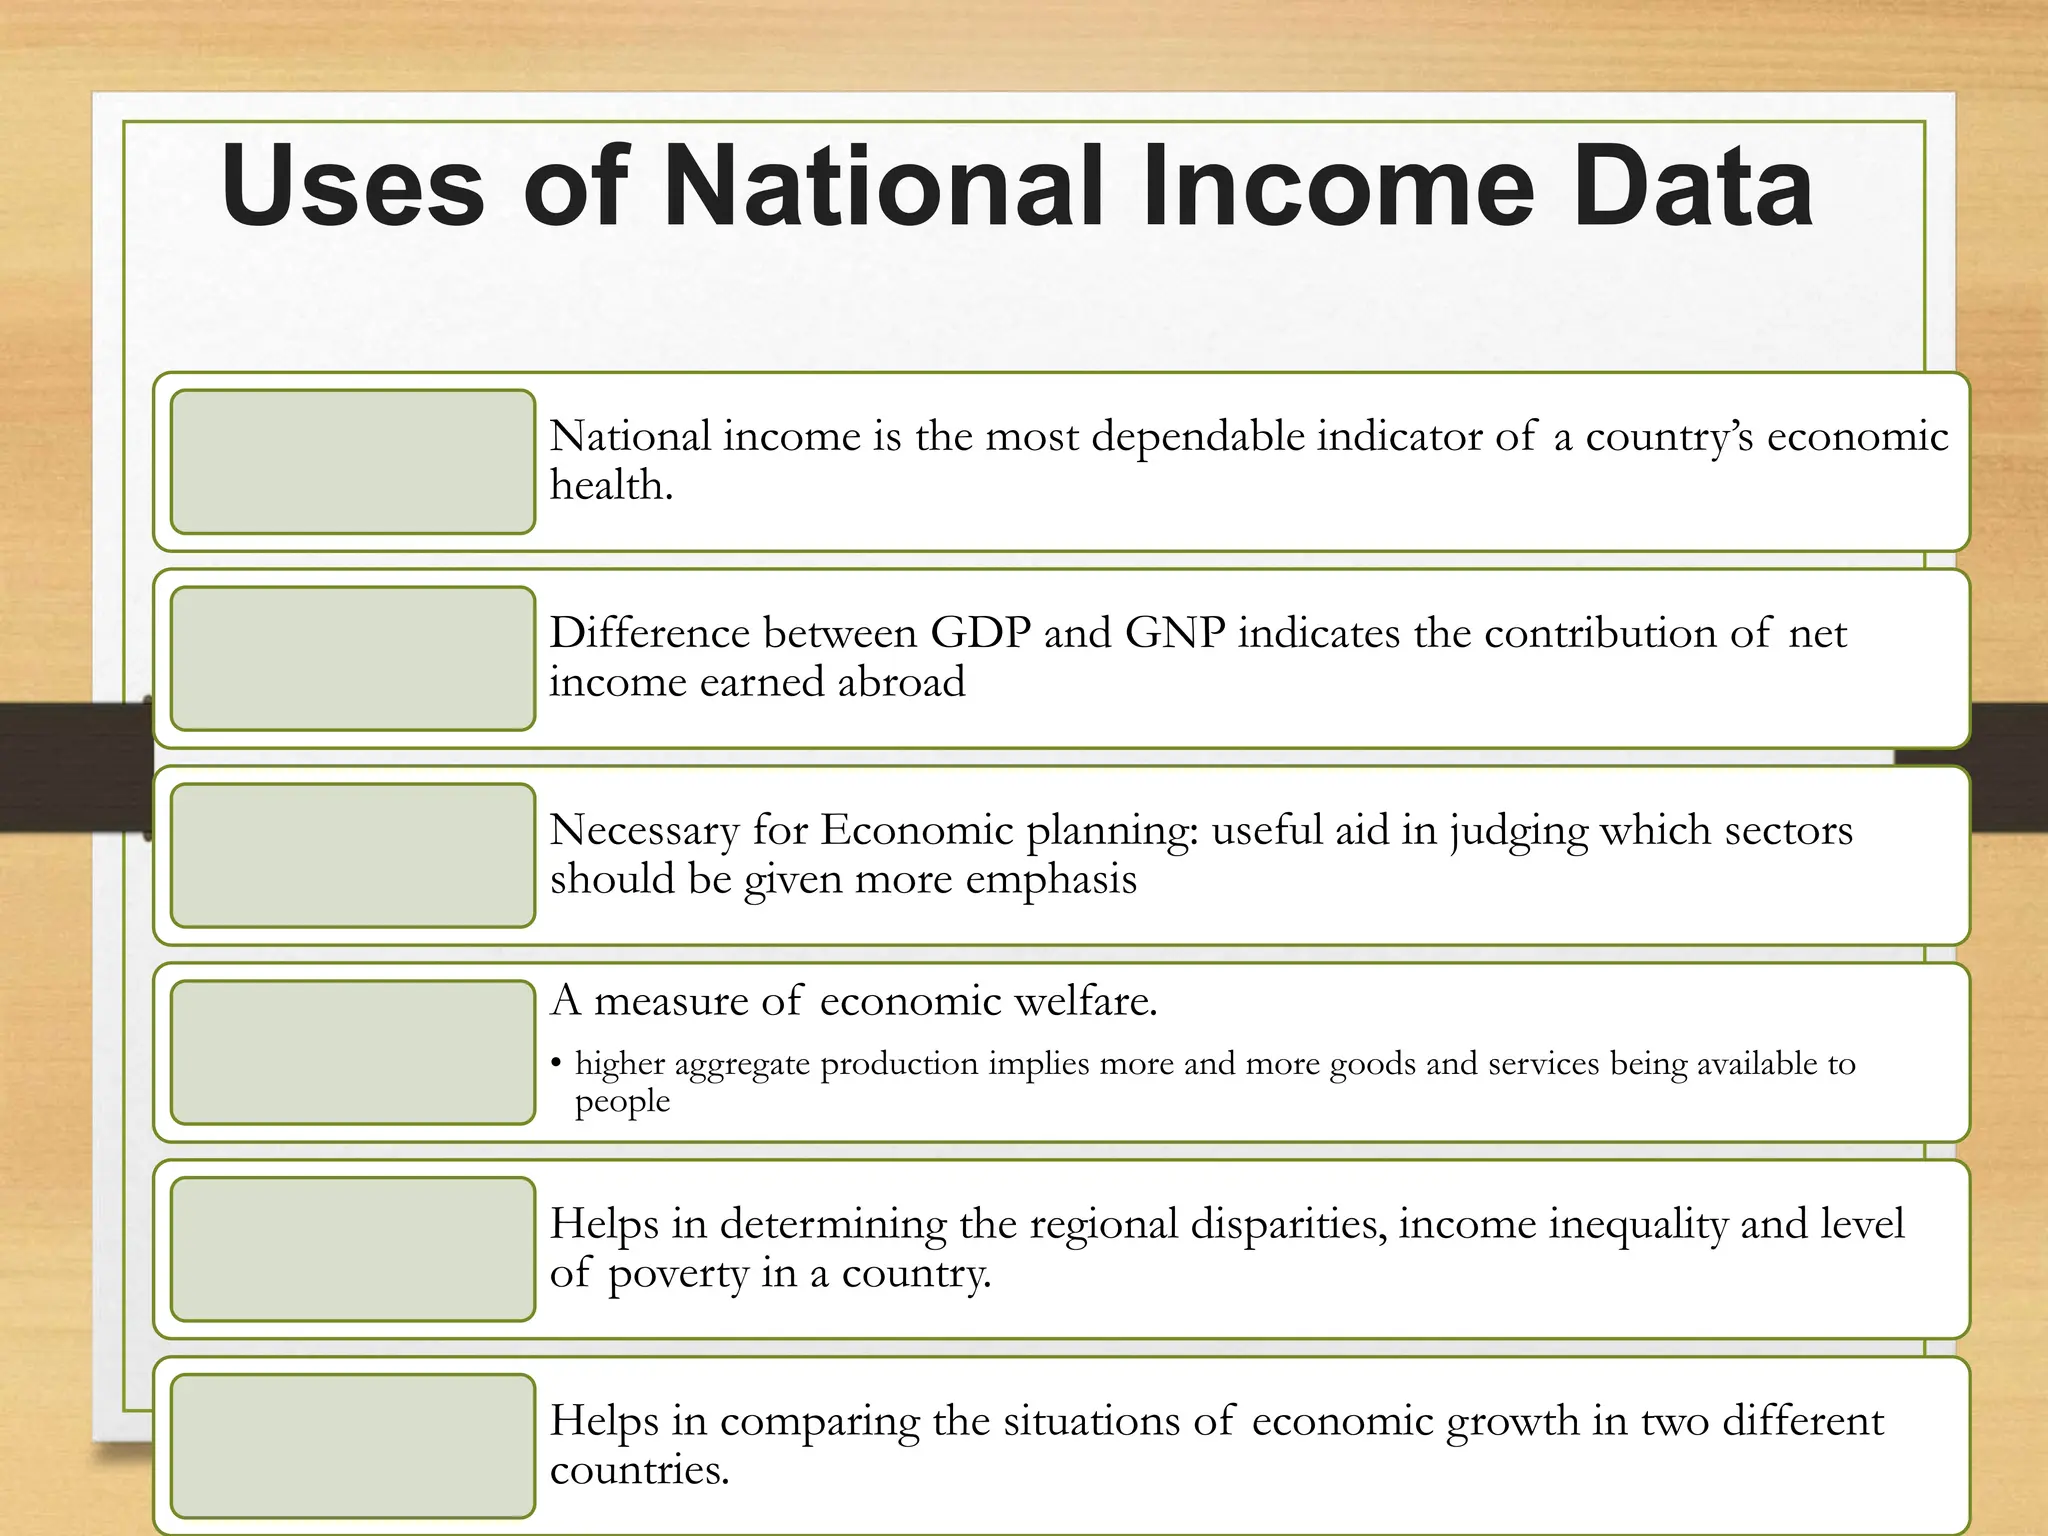
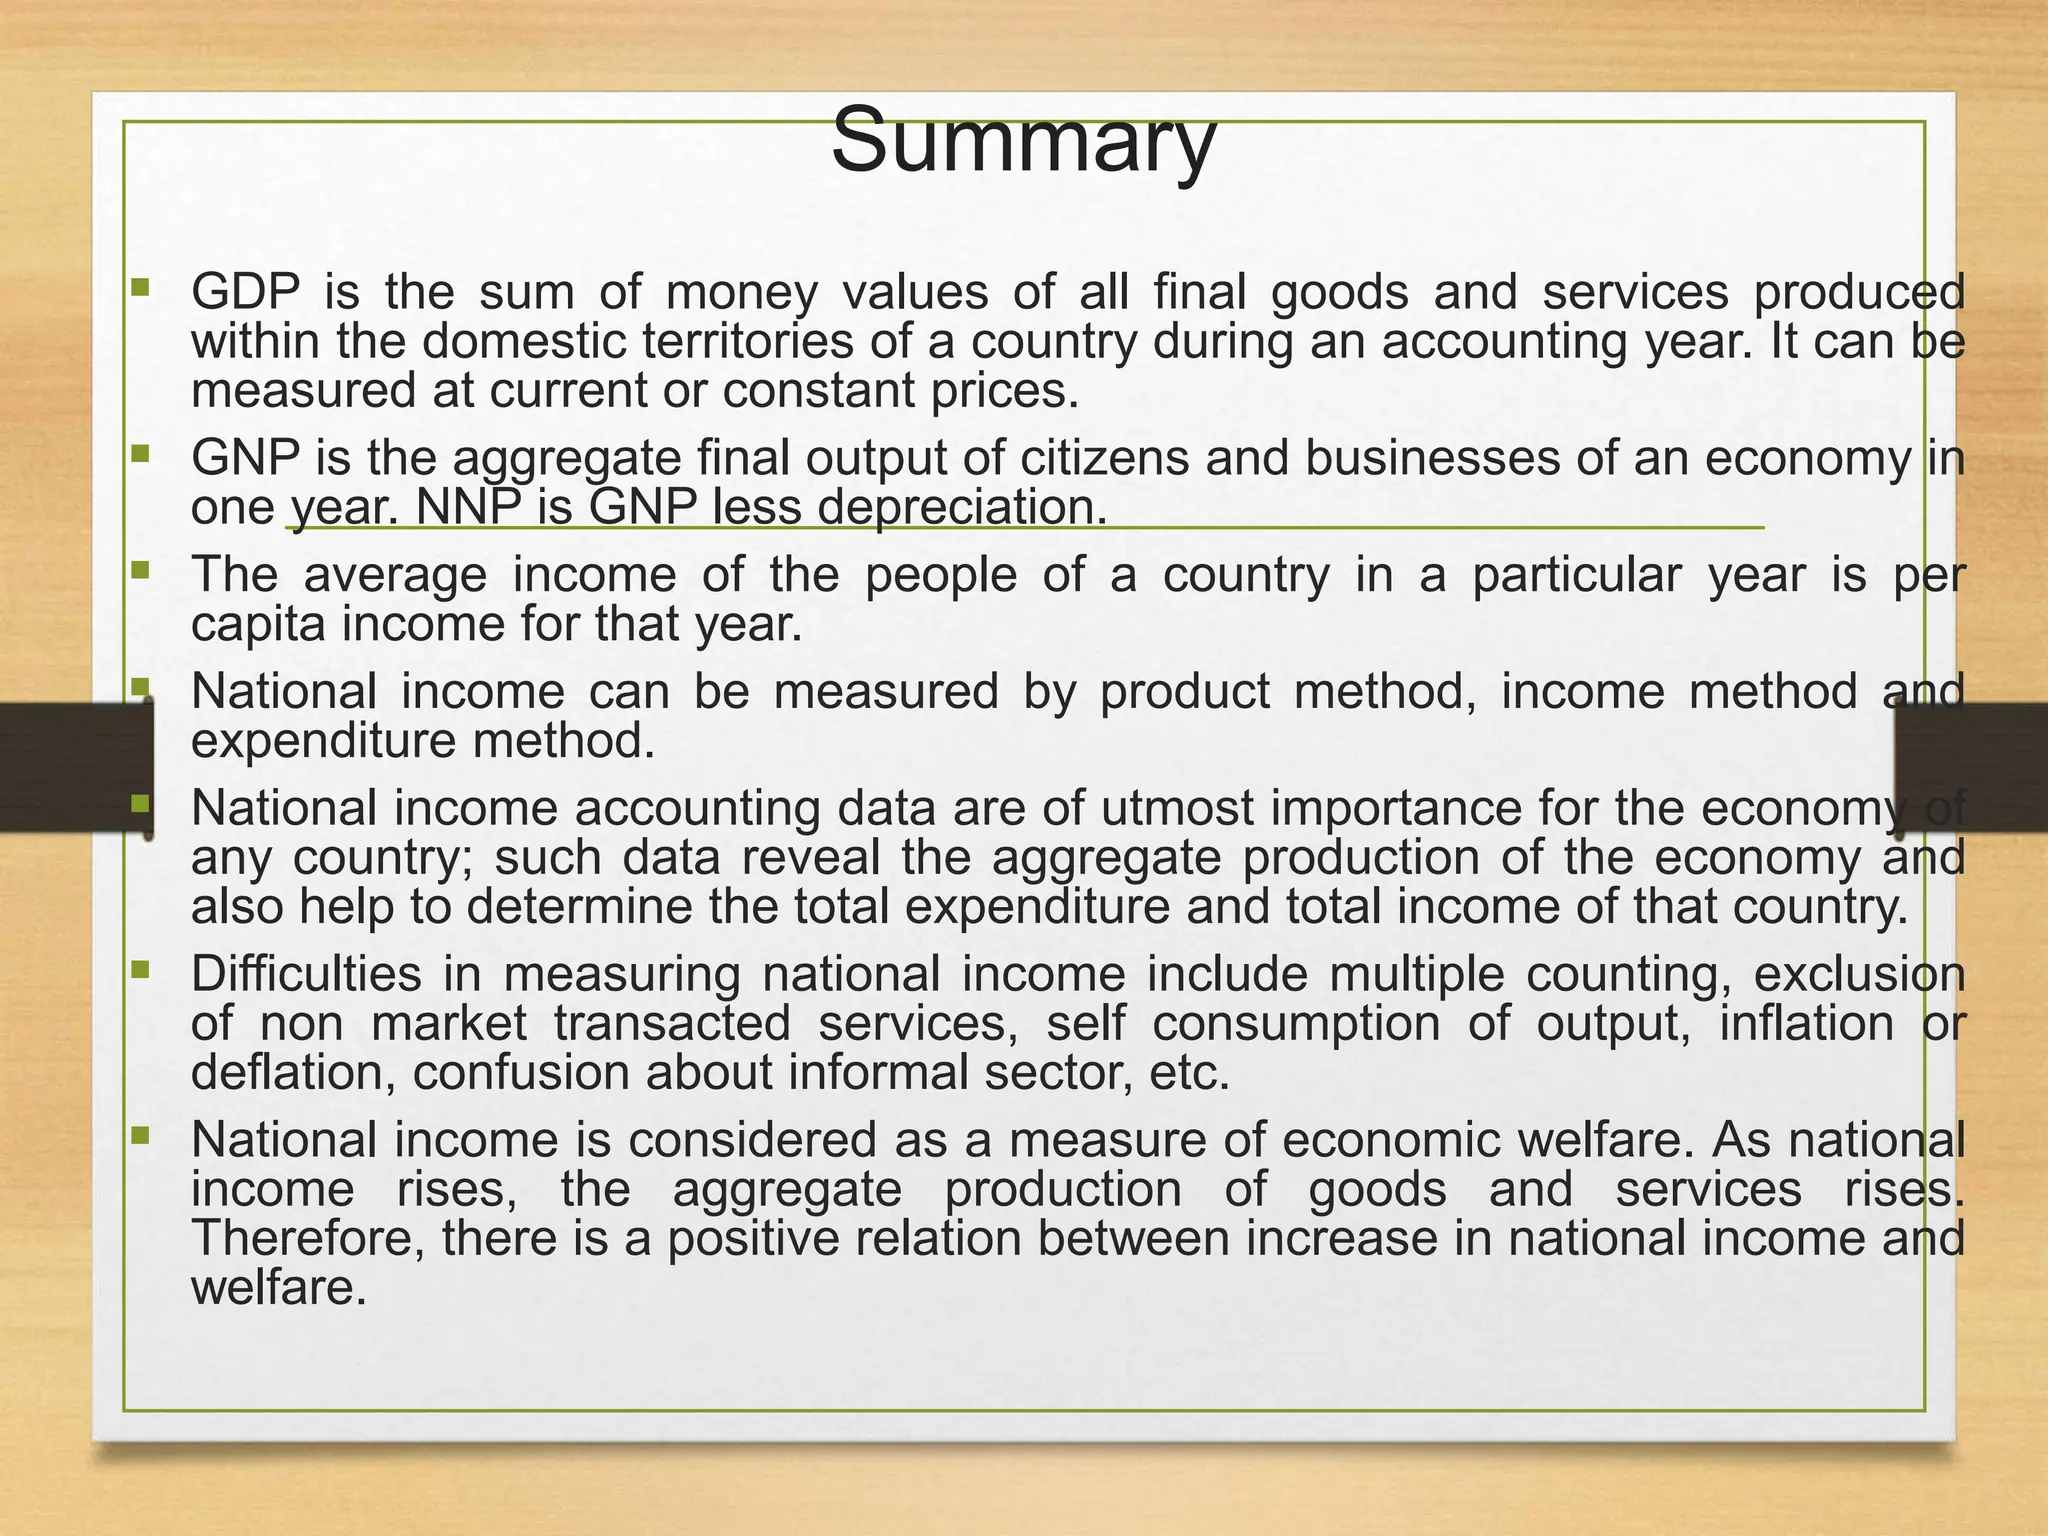
Introduction
In life, there are universal laws that govern everything we do. These laws are so perfect that if you were to align yourself with them, you could have so much prosperity that it would be coming out of your ears. This is because God created the universe in the image and likeness of him. It is failure to follow the universal laws that causes one to fail. The laws that were created consisted of the following: ·
Law of Gratitude: The Law of Gratitude states that you must show gratitude for what you have. By having gratitude, you speed your growth and success faster than you normally would. This is because if you appreciate the things you have, even if they are small things, you are open to receiving more.
Law of Attraction: The Law of Attraction states that if you focus your attention on something long enough you will get it. It all starts in the mind. You think of something and when you think of it, you manifest that in your life. This could be a mental picture of a check or actual cash, but you think about it with an image.
Law of Karma: the Law of Karma states that if you go out and do something bad, it will come back to you with something bad. If you do well for others, good things happen to you. The principle here is to know you can create good or bad through your actions. There will always be an effect no matter what.
Law of Love: the Law of Love states that love is more than emotion or feeling; it is energy. It has substance and can be felt. Love is also considered acceptance of oneself or others. This means that no matter what you do in life if you do not approach or leave the situation out of love, it won't work.
Law of Allowing: The Law of Allowing states that for us to get what we want, we must be receptive to it. We can't merely say to the Universe that we want something if we don't allow ourselves to receive it. This will defeat our purpose for wanting it in the first place.
Law of Vibration: the Law of Vibration states that if you wish on something and use your thoughts to visualize it, you are halfway there to get it. To complete the cycle you must use the Law of Vibration to feel part of what you want. Do this and you'll have anything you want in life.
For everything to function properly there has to be structure. Without structure, our world, or universe, would be in utter chaos. Successful people understand universal laws and apply them daily. They may not acknowledge that to you, but they do follow the laws. There is a higher power and this higher power controls the universe and what we get out of it. People who know this, but wish to direct their own lives, follow the reasons. Successful people don't sit around and say "I'll try," they say yes and act on it.
Chapter - 1
The Law of Attraction
The law of attraction is the most powerful force in the universe. If you work against it, it can only bring you pain and misery. Successful people know this but have kept it hidden from the lower class for centuries because th
3. Micro economics
Microeconomics is the study of how individual
households and firms make decisions and how they
interact with one another in markets.
5. Macroeconomics deals with the economy as a
whole. It studies the behaviour of economic
aggregates such as aggregate income,
consumption, investment, and the overall
level of prices.
6. Major Concerns of Macro
Economics
Aggregate Demand
Aggregate Supply
Saving
Inflation/Deflation
Economic growth
Unemployment
Trade Cycle
International Trade
Economic Planning (Fiscal policy/Monetary Policy)
7. Importance of Macro Economics
It explains the working of the economy as a
whole.
It examines the aggregate behaviour of Macro
Economics entities like firms, households
and the government.
It is very useful to the planner for preparing
economic plans for the country's development.
It is helpful in international comparison.
8. Its knowledge is indispensable for the policy-
makers for formulating macro-economic policies
such as monetary policy, fiscal policy, industrial
policy, exchange rate policy, income policy, etc.
It explains economic dynamism and intricate
interrelationship among macroeconomic
variable, such as price level, income, output and
employment.
9. Scope of Macro Economics
Macro economics studies the concept of
national income, its methods and measurement.
Macro economics studies the problems related
to employment and unemployment.
Macro economics studies functions of money
and theories relating to it. Banks and other
financial institutions are also a part of its study.
10. Study of problems relating to economic
growth or increase in per capita real income
forms part of macro economics
Macro economics also studies trade among
different countries. Theory of international
trade, tariff, protection etc. are subjects of
great significance to macro economics.
11. What is the Difference Between Micro
economics and Macro Economics?
Why to study macro economics?
What is the subject matter of Macro
economics?
Do you think study of Macro Economic
aggregates is useful for an individual firm?
Justify your answer with appropriate example.
13. Content
Introduction to National Income
Concepts of National Income
Real and Nominal GDP
Methods for Measuring National Income
Uses of National Income Data
Difficulties in Measurement of National Income
14. National income is defined as the money
value of all the final goods and services
produced in an economy during an
accounting period of time, generally one year.
Accounting Year= 1st April-31st March
15. Concepts of National Income
• Gross Domestic Product (GDP)
• Gross National Product (GNP)
• Net Domestic Product (NDP)
• Net National Product (NNP)
• Per Capita Income
• Disposable Income
16. Gross Domestic Product
Gross Domestic Product (GDP): GDP is the sum of money
values of all final goods and services produced within the domestic
territories of a country during an accounting year.
GDP= C+I+G+(X-M)
GDP at market price: includes the final value of goods and
services also includes indirect taxes and excludes the subsidies given
by the government.
GDP at factor cost is the money value of final goods and services
based on the cost involved in the process of production.
Gross Domestic Product at factor cost
= GDP at Market Prices –Indirect Taxes+ Subsidies
17. Gross National Product
Gross National Product (GNP): GNP is the
aggregate final output of citizens and businesses of an
economy in a year.
GNP may be defined as the sum of Gross Domestic
Product and Net Factor Income from Abroad (NFIA).
GNP = GDP + NFIA
GNP = C+I+G+(X-M)+NFIA
Net Factor Income from Abroad: difference between
income received from abroad for rendering factor
services and income paid towards services rendered by
foreign nationals in the domestic territory of a country.
18. Net Domestic Product and
Net National Product
Net Domestic Product
= GDP-Depreciation
Net National Product (NNP)
= GDP–Depreciation +NFIA
Or =GNP–Depreciation
Thus NNP is the actual addition to a year’s wealth and is the sum of consumption
expenditure, government expenditure, net foreign expenditure, and investment, less
depreciation, plus net income earned from abroad.
= C+I+G+(X–M)–Depreciation + NFIA
NNP at Factor Cost is the sum total of income earned by all the people of the nation,
within the national boundaries or abroad
It is also called National Income.
NNP at Factor Cost = NNP at Market Prices –Indirect Taxes+ Subsidies
20. Per Capital Income and Personal
Income
Personal income is the total income received by the
individuals of a country from all sources before direct
taxes in one year.
Personal Income = National Income –Undistributed Corporate
Profits – Corporate Taxes – Social Security Contributions + Transfer
Payments + Interest on Public Debt
Personal Disposable Income is the income which can be
spent on consumption by individuals and families.
Personal Disposable Income = Personal Income – Personal Taxes
Population
Total
Income
National
=
Income
Capita
Per
Per capita income is the average income of the people of a country in a particular year.
21. Real GDP and Nominal GDP
Nominal GDP = National income estimated at the prevailing prices is
called nominal GDP.
Real GDP=National income measured on the basis of some fixed
price, say price prevailing at a particular point of time, or by taking a
base year, is known as national income at constant prices, or Real
GDP
100
deflator
GDP
Real
GDP
Nominal
=
Deflator
GDP x
GDP deflator is the ratio of nominal GDP in a year to real GDP of that year
GDP deflator measures the change in prices between the base year and the current year.
23. ?
What is the Difference between GDP and
GNP?
Whether unemployment allowance from the
government is to be included in the national
income. Why or Why not?
Will the transfer payment be a part of
personal income or not?
24. GDP and Economic
Well-Being
GDP is the best single measure of the economic
well-being of a society.
GDP per person tells us the income and expenditure
of the average person in the economy.
25. GDP and Economic
Well-Being
Higher GDP per person indicates a higher standard
of living.
GDP is not a perfect measure of the happiness or
quality of life, however.
26. GDP and Economic
Well-Being
Some things that contribute to well-being are not included
in GDP.
The value of leisure.
The value of a clean environment.
The value of almost all activity that takes place outside
of markets, such as the value of the time parents
spend with their children and the value of volunteer
work.
27. Methods of measuring national
income
Product (or Output) Method
Income Method
Expenditure Method
28. Product (or Output) Method
Product method is also called Value Added Method or Industrial
Origin Method
The market value of all the goods and services produced in the
country by all the firms across all industries are added up
together.
29. Steps of Value Added or Product Method:
Step 1 : Identification and Classification of Producing Enterprises
a) Primary Sector: refers to that sector wherein goods are
produced by exploiting natural resources
30. b). Secondary Sector: This sector is also called
manufacturing sector. Enterprises of this sector
transform one type of good into another type.
c) Tertiary Sector: provides services and so is called
service sector. It includes trade, hotels, transport and
communication, financing, insurance. Service alone are
provided by this sector. Public administration and
defense and other services also form part of it.
31. Step 2: Estimation of Value Added
• Value added is the difference between value of output of an
enterprise and the value of its intermediate consumption (non-
factor inputs).
• Value added = Value of output- Value of non-factor input
• Value of Output= Sales + Change in stock (C.S –O.S)
32. Value added may be of the following kinds:
1. Gross Value added at Market Price: Gross value added is the
difference between value of output and intermediate goods.
Gross domestic value added is equal to gross domestic
product at market price.
2. Net Value Added at Market Price
3. Net Value Added at Factor Cost
34. Limitations of Product Method
Problem of Double Counting:
• unclear distinction between a final and an intermediate
product.
Not Applicable to Tertiary Sector:
• This method is useful only when output can be measured
in physical terms
Exclusion of Non Marketed Products
• E.g. outcome of hobby or self consumption
Self Consumption of Output
• Producer may consume a part of his production.
35. Product (or Output) Method
The market value of all the goods and services produced
in the country by all the firms across all industries are
added up together.
Process
• The economy is divided on basis of industries, such as
agriculture, fishing, mining and quarrying, large scale
manufacturing, small scale manufacturing, electricity, gas, etc.
• The physical units of output are interpreted in money terms
• The total values added up. (GDP at market price)
• The indirect taxes are subtracted and the subsidies are added.
(GDP at factor cost)
• Net value is calculated by subtracting depreciation from the total
value (NDP at factor cost).
36. Limitations of Product Method
Problem of Double Counting:
• unclear distinction between a final and an intermediate
product.
Not Applicable to Tertiary Sector:
• This method is useful only when output can be measured
in physical terms
Exclusion of Non Marketed Products
• E.g. outcome of hobby or self consumption
Self Consumption of Output
• Producer may consume a part of his production.
37. Income Method
The net income received by all citizens of a country in a particular
year, i.e. total of net rents, net wages, net interest and net profits.
(GDP at factor cost).
It is the income earned by the factors of production of a country.
Add the money sent by the citizens of the nation from abroad and
deduct the payments made to foreign nationals (individuals and firms)
(GNP at factor cost) or Gross National Income (GNI).
Process:
• Economy is divided on basis of income groups, such as
wage/salary earners, rent earners, profit earners etc.
• Income of all the groups is added, including income from abroad
and undistributed profits.
• The income earned by foreigners and transfer payments made in
the year are subtracted.
GNI = Rent + Wage + Interest +Profit + Net Income from Abroad-
Transfer payments
38. Step-I
• Identification and classification of producing
enterprises
Primary Sector
Secondary Sector
Tertiary sector
39. Step-II
• Classification of factor income
• Factor income: a factor income refers to income
earned by a person as a reward for rendering his
factor services.
• Factor income are only earned incomes. It does not
include that income which is not earned.
41. Classification of factor incomes
• Compensation of employees: wages and salaries,
payment in kind, employers contribution to social
security schemes, pension on retirement.
• Operating surplus: it is the income from the property
and entrepreurship. E.g. Rent, interest, profit etc
• Mixed income= it refers to the income of the self
employed persons using their labor land capital
• Net factor income
42. Precautions while estimating factor
income
• Transfer payment
• Income from illegal activities
• Sale proceeds of second hand goods
• The sale proceeds of shares and bonds are not included in national income
• Windfall gains should not be included.
• Imputed rent of owner houses is included in NI
• Indirect taxes like sales tax excise duty tend to increase the market price of
goods and services. These are included in the estimation of national
income at market prices but are not added while calculating national
income at factor cost
43. • Income tax is paid out of compensation of
employees. It should not be added separately in the
estimation of national income.
44. Limitations of Income Method
Exclusion of non monetary income: Ignores the non-
monetized section of economic activities.
Exclusion of Non Marketed Services: People
undertake a particular activity that are difficult to ascertain
in money value. E.g. mother’s services to the family.
45. Expenditure method
• One man’s income is another man’s expenditure
• Therefore national income can be arrived at by
adding the total expenditure of individual and
business firms during a year
• Expenditure or outlay on final products takes place
in three ways
46. Expenditure method
Expenditure or outlay on final products takes place in
three ways
Expenditure by consumers on goods and services(
Consumption Expenditure)
Expenditure by entrepreneurs on capital or investment
goods (Investment Expenditure)
Expenditure by government on consumption and capital
goods (Government Expenditure)
Net Exports
47. Expenditure method
The formula for this method is
Y = C + I + G +(X-M)
• Here Y stands for total expenditure
• C stands for consumption expenditure
• I stands for investment expenditure
• G stands for Government expenditure
• (X-M) Difference between exports and imports
49. Difficulties in the computation of
National Income
In backward economies like India, particularly in the rural sector, the
cultivators and small producers are illiterate and they do not keep books of
account. This is a serious difficulty in the calculation of national income
Avoidance of double counting becomes complicated
Existence of Non-monetized sector is dominant
The village money lenders maintain absolute secrecy of their transactions
50. Uses of National Income Data
National income is the most dependable indicator of a country’s economic
health.
Difference between GDP and GNP indicates the contribution of net
income earned abroad
Necessary for Economic planning: useful aid in judging which sectors
should be given more emphasis
A measure of economic welfare.
• higher aggregate production implies more and more goods and services being available to
people
Helps in determining the regional disparities, income inequality and level
of poverty in a country.
Helps in comparing the situations of economic growth in two different
countries.
51. Summary
GDP is the sum of money values of all final goods and services produced
within the domestic territories of a country during an accounting year. It can be
measured at current or constant prices.
GNP is the aggregate final output of citizens and businesses of an economy in
one year. NNP is GNP less depreciation.
The average income of the people of a country in a particular year is per
capita income for that year.
National income can be measured by product method, income method and
expenditure method.
National income accounting data are of utmost importance for the economy of
any country; such data reveal the aggregate production of the economy and
also help to determine the total expenditure and total income of that country.
Difficulties in measuring national income include multiple counting, exclusion
of non market transacted services, self consumption of output, inflation or
deflation, confusion about informal sector, etc.
National income is considered as a measure of economic welfare. As national
income rises, the aggregate production of goods and services rises.
Therefore, there is a positive relation between increase in national income and
welfare.
52. ?
Consider an economy that produces only three types
of goods: A, B and C. In the base year (a few year
ago), the production and price data were as follows:
Fruit Quantity Price
A 3,ooo $2
B 6,000 $ 3
C 8,000 $ 4
53. In the current year the production and price
data are given as follows
Fruit Quantity Price
A 4,000 $ 3
B 14,000 $ 2
C 32,000 $4
54. Find the nominal GDP and real GDP.
Find the GDP deflator for the current year and the
base year. By what percentage does the price level
change from base year to current year?
56. Circular Flow of Economic Activities and
Income
The simple model of the circular flow assumes two players
Firms
• Produce and supply the goods and services.
• Require various factors of production to produce these goods and services.
Households
• Include a set of individuals living in the same house
• Take joint decision about the consumption of goods and services.
• Provide services in terms of factor inputs to the firms
• Get paid for these services by firms which households spend on
consumption.
• Money flows from firms to households as factor payments and from
households to firms as expenditure on goods and services.
• It is a circular flow of money or income
57. Circular Flow of Income
(Two Sector Economy)
In the equilibrium Y=C+S=C+I=E=O
(Wages, Rent, Interest and Profits)
Factor Payments
(Y)
Consumption
expenditure
(C)
Firms
Households
Goods and
Services (O)
Factor Inputs
Financial
Market Investment
(I)
Savings
(S)
58. Circular Flow of Economic Activities and
Income
• Value of output produced (Y) = value of output sold (O)
• Value of output sold = Sum of consumption expenditure (C) and
investment expenditure (I).
Y=O=C+I=E……(1)
• Income is either consumed or saved (S).
Y=C+S………….(2)
C+I=Y=C+S………(3)
• Therefore: I = S…………(4)
• Savings are withdrawal of money from the circular flow
• Investment is injection of money into the circular flow
• For equilibrium savings should be equal to investments
• Hence Y=O=E
59. Circular Flow of Income
(Four Sector Economy)
The third sector is Government (G)
• Government Spending
• On provision of public utility goods and services.
• Provides salaries to the households
• Pays to firms for purchases of goods and services
• Government Revenue
• Households and firms pay various taxes and other payments and
provide factor inputs to the government.
• Government borrows from the financial market to fill revenue gap.
The fourth sector is the external sector
• Imports (M): Outflow of income occurs when the domestic firms buy
goods and services from foreign ones.
• Exports (X): Inflow of income takes place when foreign firms buy
goods and services from domestic ones
60. Circular Flow of Income
(Four Sector Economy)
Government
(G)
Remittances for
purchases
Foreign Nations
(X-M)
Salaries
Taxes
Taxes
Consumption
Expenditure
Financial Market
Investment
(I)
Savings
(S) Firms
Households
Factor Inputs
Goods
(O)
Factor
Payments
Imports
(M)
Imports
(M)
Exports
(X)
Exports
(X)
National Income=C+I+G+(X-M)
61. Circular Flow of Income
(Four Sector Economy)
• National income includes expenditures on consumption investment,
government and net of exports (X-M)
National Income=C+I+G+(X-M)
• Since national income can either be consumed, or saved, or paid as tax to
the government:
C+I+G+(X-M)=C+S+T
I+G+(X-M) =S+T
• Sum of private investment and expenditure on net exports is equal to the
sum of savings and tax revenue. Thus:
I+G+X =S+T+M
• Therefore, W=J
• At equilibrium, total injections are equal to total withdrawals.
62. Mention two important leakages in the circular flow
of national income.
Mention two important injections in the circular flow
of national income
Difference between the 2 and 3 sector model.
64. Classical Theory
• Full employment is a natural phenomena.
• In a case of unemployment , demand for labor is less
than their supply. Due to low demand, money wages
of the laborers will fall. Low wage rate, in its turn,
will raise the demand for laborers. As a consequence,
unemployment is removed and full employment is
restored.
66. Questions
• Meaning of Full employment
• Different types of unemployment(cyclical, seasonal,
voluntary and Involuntary)
67. The classical macro model (Assumptions)
•Laissez faire policy
•Equality between saving and investment
•Closed economy
•Flexibility of prices, wage and rate of interest.
•Rational man
•Perfect competition
•Constant technology
•Law of diminishing returns
68. The real economy.
The supply side of the real economy
• factors determining the economy’s total supply of goods and
services – i.e.
• how are labor, land and capital owners compensated
The demand side of the real economy
• factors determining the demand for goods and services, by
households, firms and the govt.
Equilibrium
• what ensures that total supply = total demand; how equilibrium in
the goods market is achieved
70. The supply side of the real sector
the economy’s total supply of goods and services/ total income
is determined by,
•the economy’s supply of inputs/factors of production
•available technology
factors of production:
K = capital,
tools, machines, and structures used in production
L = labor,
the physical and mental efforts of workers
N = land,
All non-renewable resources
available technology: the form of the production function
71. Determination of income and
employment
• According to classical economists income and
employment is determined by production function
and equilibrium of demand for and supply of labor.
72. The production function and its properties:
• represented as Y = F (K, L), N being fixed is ignored
• shows how much output (Y ) the economy can produce from K
units of capital and L units of labor.
• F reflects the economy’s level of technology – technological
progress affects F.
• In short period capital and technology remains constant and
employment can be increased by increasing labor only and the
result is diminishing returns to output.
73. Y
output
Diminishing marginal returns and the production function
L
labor
F K L
( , )
1
MPL
1
MPL
1
MPL
As more labor is
added, MPL
Slope of the production
function equals MPL
74. Reasons for the diminishing Returns
1. Technology is given.
2. The economy’s supplies of capital and labor are fixed at
,
( )
Y F K L
and
K K L L
Output is determined by the fixed factor supplies and the fixed
state of technology:
75. How factor prices are determined - labor
Factor markets are assumed to be competitive. Hence, factor prices
are determined by supply and demand of factor services.
Supply of each factor=Demand for factor inputs
76. Demand for labor
• Demand for labor is diminishing function of wage. It
means , with rise in wage rate demand for labor falls
and with fall in wage rate demand for labor rises.
• W= MRP=PxMPP
• W/p=MPP
77. Supply of labor
• Supply of labor therefore increases with rise in real
wage and falls with fall in wage rate.
78. MPL and the demand for labor – the demand curve is
the same as the MPL curve
Each firm hires labor
up to the point where MPL
= W/P
Units of
output
Units of labor, L
MPL, Labor
demand
Real
wage
Quantity of labor
demanded
79. Says law of market
Supply creates its own demand
• Barter system
• Monetary system
80. Flexibility of wages (Equilibrium in
factor market)
• Demand and supply of labor through wage rate
determines the equilibrium
81. Flexibility in Rate of interest and
Equilibrium in money market
• I=f(r)
• S=f(r)
• In money market
• S=I
• (I-investment, S-Saving)
• in this way there is equilibrium in the aggregate
demand and supply.
82. Flexibility of prices level or
equilibrium in money market
• Aggregate demand=Aggregate supply
MV=PT
M-money supply
V-velocity of money
P-price level
T-trade transactions
P=f(Money supply)
83. Questions
• Meaning of Laissez faire
• Demand for Labor and supply of labor
• Real Wages Vs Nominal wages
• Investment and saving function
84. Points to remember in Classical
Model
• Y=f(Employment)
• Demand for labor=(w/p)
• Supply of labor =(w/p)
• S=f(r)
• I= f(r)
• MV=PT
85. Criticism
• Says law not applicable in current scenario
• Employment can not increased by wage cut
• Possibility of underemplymentgn
• Absence of automatic adjustment
• Ignores the role of short run peroid
• Equality between saving and investment
• Rejection of laissez policy
• Supplied sided theory
87. The General Theory
1. If the consumer is an economic optimizer, he/she
must be unable to buy the goods they planned to
buy because of some kind of constraint—risk,
convention, social institutions, cash, or ...?
a) According to the classical model, the consumer has
insatiable wants.
b) The money value of the incomes received must be equal
to the value of the output produced.
c) So how can unsold goods pile up in warehouses, causing
firms to lay off workers?
88. Keynesian Thought on income,
output and employment
• According to Keynes- there is not always full
employment in a developed economy as a matter of
fact there can be unemployment in the economy.
• The main reason for the unemployment is the is
deficiency of aggregate demand.
• Unemployment can be removed by increasing the
aggregate demand in the economy.
89. • According to classical thought the problem of
unemployment can be solve by lowering the wage
rate,
• According to Keynes the problem of unemployment
can be solved by increasing the aggregate demand.
90. Assumptions or postulates of
Keynesian Model
• Closed economy
• Diminishing marginal productivity
• Labor is the only factor of production
• No time lag
• Saving and investment
• Two sector model of the goods market in the
economy (no government sector, no foreign trade).
91.
92. 2. Say’s Law cannot hold. (“Supply creates its own
demand.”)
a) If spending constraints are in effect, then there will be a
difference between (unlimited) demand and “effective
demand”.
b) Actual (effective) demand will usually be “deficient” to
purchase total output.
c) Effective Demand(AD=AS)
d) Aggregate Demand
e) Aggregate Supply
93. Therefore, consumption depends primarily upon income, not
interest rates.
• C C(r), but rather C = C(Y)
• “People don’t change their standard of living simply
because the interest rate changes a few points.”
• ‘The fundamental psychological law, upon which we
are entitled to depend with great confidence . . . is that
men are disposed, as a rule and on average, to increase
their consumption as their income increases, but not by
as much as the increase in their income’
94. • The Consumption Function: the key to Keynes
• Consumption depends on the level of DISPOSABLE INCOME (disposable personal income =
income - taxes = Y - T)
• Some consumption is autonomous (= “independent” of DPI): it may depend on other factors
such as wealth or stock values. (even at zero income, Bill Gates would consume something)
• The consumption function proposed by Keynes is:
• C = C0 + Cy ( Y - T)
• C0 = Autonomous consumption
• Cy = Marginal propensity to consume
• The marginal propensity to consume plays a central role in the Keynesian system. Keep your eye on the
MPC in the following slides.
96. The Keynesian system: Planned and actual investment
• Investment has three components:
• Plant and equipment -- drill presses, factory buildings, etc.
• Residential investment -- new housing construction
• Inventory investment -- Change in Business Inventories
• The first two are consciously planned (although plans can change, and typically do during a
recession);
• inventory investment can be unplanned -- if a store fails to sell what it had expected to, it
winds up with more inventory than it had expected.
• Stores with unplanned inventory investment will cut back on orders -- resulting in reduced
production at the factory, layoffs and recession.
97. • The same can be explained with the help of regression line.
• The Keynesian model: National income identity and equilibrium
• The National income identity is:
• Y = C + I + G + NX
• The Keynesian equilibrium equation is:
• Y = C0 + Cy ( Y - T) + Ip + G + NX
• Notice that C has been replaced by the consumption function, and
investment by planned investment.
100. Questions
• Meaning of full employment
• Underemployment
• Consumption Function
• Autonomous consumption
• Types of Investment
101. Learning Outcome
In this unit students have learnt about the
Classical Model (Say’s law, income and output
determination)
Keynsian model( Effective demand, Psychological law
of consumption, Investment, and output
determination)
103. Keynesian theory of income
• Simple economy model- two sector model
( household, firms sector)
• Closed economy model- three sector model
( household, firms and government sector)
• Open economy model- four sector model
( household, firms , government and foreign
sector)
104. Consumption function
• The amount of money people spend out of national
income on the purchase of the goods and services
for the direct satisfaction of their wants is called
aggregate consumption expenditure or consumption.
Example: Total income of economy- 5000 cr.
people spend -4000 cr. on goods and service
105. Consumption Function
• The most important function of consumption is
income .
• It means consumption is a function of (determined
by ) income.
Relationship between consumption and income-
C= f (Y)
Where, C= consumption
f= function
Y= income
106. • In economics, the consumption function is a single
mathematical function used to express consumer
spending. It was developed by John Maynard
Keynes and detailed most famously in his book The
General Theory of Employment, Interest, and
Money. The function is used to calculate the amount
of total consumption in an economy. It is made up
of autonomous consumption that is not influenced
by current income and induced consumption that is
influenced by the economy's income level. This
function can be written in a variety of ways, an
example being . This is probably the most simplistic
form of the consumption function.
107. • The simple consumption function is shown as :
• C= C0 + C1Y
where
• C = total consumption,
• c0 = autonomous consumption (c0 > 0),
• c1 is the marginal propensity to consume (i.e the
induced consumption) (0 < c1 < 1), and
• Y = disposable income (income after government
intervention – benefits, taxes and transfer payments
– or Y + (G – T)).
108. • Induced consumption is consumption
expenditure by households on goods and
services that varies with income. Such
consumption is considered induced by income
when expenditure on these consumables
varies as income changes. Induced
consumption contrasts with autonomous
consumption, which is expenditures that do
not vary with income.
• For example, expenditure on a consumable
that is considered a normal good would be
considered to be induced.
109. Definition of 'Autonomous Consumption
• The minimum level of consumption that would still exist
even if a consumer had absolutely no income. This
contrasts with discretionary consumption, which is used
for non-essential items. When combined with
discretionary income, a person's autonomous
consumption determines his or her real income, or real
wages
110. • Certain bills and expenses are deemed to be autonomous (or
independent), such as electricity, food and rent, because these
expenses cannot ever be entirely eliminated whether you have
money or not. Even in the worst-case financial scenario, you
would still need to eat and have a place to live. If a
consumer's income were to disappear for a time, he or she
would have to dip into savings or increase debt in order to
pay these expenses, which is also known as being in a
"dissaving mode
111. Average Propensity To Consume
• The average propensity to consume (APC) refers to the
percentage of income that is spent on goods and services
rather than on savings. One can determine the percentage of
income spent by dividing the average household
consumption (what is spent) by the average
household income (what is earned). The inverse of the
average propensity to consume is the average propensity to
save (APS)
112. AVERAGE PROPENSITY TO CONSUME
• Economic periods where consumers are spending can boost
the economy: more goods are purchased (high demand for
goods and services); keeping more people employed and
more businesses open. Periods where the tendency to save is
increased can have a negative effect on the economy as
people purchase fewer goods and services (low demand for
goods and services), resulting in fewer jobs and increased
business closures.
113. APC
• The average propensity to consume is the ratio of
consumption to income. It can be expressed as under.
• For example, if total income is Rs 500 crores and total
consumption is Rs 200 crores, then:
Y
C
APC
4
.
0
500
200
or
APC
114. MARGINAL PROPENSITY TO
CONSUME(MPC)
Definition of 'Marginal Propensity To Consume -
MPC'
• A component of Keynesian theory, MPC represents
the proportion of an aggregate raise in pay that is
spent on the consumption of goods and services, as
opposed to being saved.
115. MPC
• The ratio of change in consumption to change in
income is known as marginal propensity to consume.
Symbolically, change (Δ) in the income is denoted as
ΔY (read as delta Y) and change in consumption as Δ
C. Hence,
Y
C
MPC
116. Example
Suppose you receive a bonus with your paycheck, and it's $500
on top of your normal annual earnings. You suddenly have
$500 more in income than you did before. If you decide to
spend $400 of this marginal increase in income on a new
business suit, your marginal propensity to consume will be 0.8
($400 divided by $500).
117. Characteristics of MPC
• It is always positive
• MPC is greater than zero but less than
one.
• The value of MPC always greater than zero
because Option expenditure must increase
with the increase in income, less than one,
because the total increase in income is not
consumed a part of it is saved. Thus this
characteristic can be symbolically stated as
0<MPC<I where MPC is always positive but
less than one
118. • MPC of the poor class is higher
• Constant MPC in the long run
• Falling MPC in the short run
• MPC can be greater than one in case of
abnormal conditions.
119. Causes of the fall in MPC with the
increase in Income
• Fulfilment of basic and important
needs
• Constant habits in the short period
• Consumption expenditure and level of
income in the past
• Uncertainty of future
120. • Relation between APC and MPC
• APC and MPC are closely related to each other.
• (1) APC refers to the ratio of absolute consumption absolute
income at a particular point of time. On the other hand MP
represents the ratio of change in consumption to change in
income; MPC is the rate of change in APC.
• (2) As income rises both APC and MPC declines, but I lie
decline in MPC is more than the decline in APC, as income
falls both APC and MPC rises but APC rises at a slower, rate
than MPC.
• (3) MPC is useful in short-period where as APC is useful in
long period. In the short period there is no change in MPC
and MPC<APC. In the long period APC=MPC.
122. Question- The consumption function shows the
relationship between consumption and……
(1) Savings (2) Income (3) Demand (4) Supply
Question- which of the following represents the
consumption function?
(1) C=f (Y) (2) Y= f (C) (3) C=f (1/Y)
(4) C= f (C/Y)
123. TABLE OF PROPENSITY TO
CONSUME
INCOME CONSUMPTION SAVING (RS CR.)
0 10 -10
100 100 0
200 190 10
300 280 20
400 370 30
500 460 40
124. EXHIBIT 1 THE INDIVIDUAL’S MARGINAL PROPENSITY TO
CONSUME
125. FEATURES OF PROPENSITY TO CONSUME
• Psychological concept
• Unequal propensity to consume
• Income and employment depend on
propensity to consume
• Consumption in the short run
• Long run consumption function
127. Subjective factors
(i) individual factors
• Farsightedness-future is uncertain
• Economic independence
• Occupational motive
• Miserliness- niggardly by nature
• Status in the society
• Precautionary motive
128. (ii) Business factors
• Extension of business
• Liquidity preference
• Modernization-save more to install new machines
129. Objective factors
• Change in money income
• Change in real income
• Change in distribution of income
• Financial policy of the corporations
• Change in expectations
• Fiscal policy
• Change in the rate of interest
• Wages
• Liquid assets.
130. • Social security
• Attraction of new products
• Credit facilities
• Change in fashion
• Change in population
• Demonstration effect
131. PROPENSITY TO SAVE/SAVING
FUNCTION
• The relationship between the change in income and
the change in saving is the propensity to save.
• We can also express propensity to save in two
different ways. These are the following:
a) The average propensity to save (APS), and
b) The marginal propensity to save (MPS).
132. The Average Propensity to Save (APS)
• The average propensity to save is the ratio of total savings
to total income. Thus,
where, S = saving and Y = income.
The Marginal Propensity to Save (MPS) Marginal
propensity to save is the ratio of change in saving to
change in income.
Y
S
APS
134. RELATION BETWEEN SAVING
AND CONSUMPTION
• Y=C+ S
• WHERE Y =DISPOSABLE INCOME
C= CONSUMPTION
S= SAVINGS
AND C= C0+ C1Y
APC+APS=1
135. • Question- if the MPC is 0.7, what is the
marginal propensity to save in a two-sector
model?
• Question- if MPS=0.3,it means that a 100
rs rise in disposable income leads
to ………… rise in consumption.
• Question-…………represents the
pr0portion of each income level that a
household will spend on consumption.
136. CONSUMPTION FUNCTION:C= 1000 + 0.8Y)
DISPOS
ABLE
INCOM
E
AUTON
OMUS
CONSUM
PTION
INDUCE
D
TOTAL SAVING
S
APC APS
3000 1000
4000 1000
5000 1000
6000 1000
7000 1000
8000 1000
9000 1000
138. Investment
• Meaning
• Different types of investment
• Factors affecting investment
• Concept of multiplier
• Types of multiplier
• Uses of multiplier
• Limitations of multiplier
139. Investment
• Investment in general sense means using or spending
money on acquiring physical or financial assets and
skills that yield a return over time.
• Investment conceptually refers to addition made to
the physical stock of capital
140. Difference between capital and
Investment
• Capital is a stock concept
• It refers to capital accumulated over a period of time
• Investment is a flow concept
• It is measured per unit of time, generally one year.
141. Propensity to Invest
• An increase in income directly related to an increase
investment. The ratio in which income changes to
change in investment is called propensity to invest
PI = I / Y
Average Propensity to Consume
API = I / Y
Marginal Propensity to Consume= $I /$Y
142. Quiz
1. Net addition to existing capital stock is called?
2. Why investment is important?
3. Ratio of change in investment to change in income
is called?
4. Ratio of consumption to income is called?
143. Types of investment
• Induced investment
• Autonomous investment
• Gross and Net investment
• Financial and real investment
• Planned and unplanned investment
144. Autonomous Investment
• Investment which does not change with the changes
in income level.
• Even if the income is low, the autonomous,
Investment remains the same.
• Investment made on houses, roads, public buildings
and other parts of Infrastructure etc.
145. Induced Investment
• Investment which changes with the changes in the
income level.
• Induced Investment is positively related to the
income level.
146. Financial Investment
• Investment made in buying financial instruments
such as new shares, bonds, securities, etc.
• Money invested for buying of new shares and bonds
as well as debentures have a positive impact on
employment level, production and economic growth.
147. Real Investment
• Investment made in new plant and equipment,
construction of public utilities like schools, roads and
railways, etc.
• Real investment has a direct impact on employment
generation, economic growth, etc.
148. Planned Investment
• Investment made with a plan in several sectors of the
economy with specific objectives.
• Intended Investment because an investor while
making investment make a concrete plan of his
investment.
149. Unplanned Investment
• Investment done without any planning is called as an
Unplanned or Unintended Investment.
• In unplanned type of investment, investors make
investment randomly without making any concrete
plans.
150. Gross Investment
• The total amount of money spent for creation of
new capital assets like Plant and Machinery, Factory
Building, etc.
• It is the total expenditure made on new capital assets
in a period
151. Net Investment
• Net Investment is Gross Investment less (minus)
Capital Consumption (Depreciation) during a period
of time, usually a year.
• A part of the investment is meant for depreciation
of the capital asset or for replacing a worn-out
capital asset.
152. Quiz
• Investment made by government and departmental
undertakings is called ?
• Which investment does not depend upon changes in
national income ?
• Which investment varies with changes in the level of
national income ?
• Why is planned investment necessary?
153. Factors affecting investment
• Size of the market
• Expectations of costs and prices in the future
• Change in income
• Taxation
• Technology
• Existing stock of capital asset
• Change in ROI
• Population
154. • Expected increase in Aggregate Income
• Political Climate
• Foreign Trade
• Price level
156. MEC
• It refers to productivity of capital. It may be defined
as the highest rate of return over cost accruing from
an additional unit of capital asset.
• Also it refers to the yield expected from a
new unit of capital.
157. MEC
• MEC can be calculated by deducting from the total
income of the capital assets its cost.
• Suppose the price of a machine is 20000, the duration of
the machine is 10 years. during the 10 years it is expected
to yield an income of 40000. the total profits= 40000-
20000=20000 (over a period of 10 years)
• Average profits= 20000/10= 2000
• MEC= 2000/20000*100= 10%
158. MEC depends upon
1. Prospective yield from the capital asset
2. The supply price of the capital asset.
159. Prospective yield
• Prospective yield of an asset is the aggregate net
return from it during its whole life.
• In order to determine Prospective yield annual return
of the capital is worked out.
• Aggregate of annual return expected from a capital
asset over its life-time, is called Prospective yield
• Changes in the price prices likely to change
Prospective yield
160. Prospective yield
• Prospective yield can be expressed as
• Py= Q1+Q2+Q3+Q4+…………..+Qn
• Q1, Q2, Q3, Q4,…………..,Qn ( net revenue
received in the first, second, third and fourth year)
161. Supply price
• The other factor affecting the MEC is the is its
supply price. ( is also known as replacement Cost)
• A capital asset actually remains operative more than
one year.
163. MEC and Investment
• Generally it is experienced that as the amount of
investment goes on increasing, MEC of capital goes
on decreasing
Investment MEC
50 12%
100 10%
150 8%
200 6%
164. Relationship between MEC and ROI
Relationship of MEC & ROI Effect on Investment
MEC > ROI Favorable
MEC= ROI Neutral
MEC<ROI Unfavorable
165. Quiz
• Under what conditions would you go for investment?
• Productivity of capital is referred to as ?
• How can taxation decision effect investment
decision?
167. In Economics:
It is a change in Income (∆Y) as a result of change in
Investment (∆I).
The number of times Income exceeds Investment is called
Multiplier (K).
169. This Concept is given by Keynes;
and it defines the Relationship between Income and Investment;
so, its also known as Investment Multiplier.
170. Types of Multiplier:
• Employment Multiplier K1 = N2
N1
N2 – Total Employment
N1 – Primary Employment
• Foreign Trade Multiplier Kf = ∆Y
∆E
Y – Change in Total Income
E – Change in Export Income
171. Size of Multiplier:
• MPC
• MPS
• Larger the MPC, Larger the Multiplier
• Larger the MPS, Smaller the Multiplier
172. Relationship with MPC:
K = ∆Y
∆I
Y = C + I
∆Y = ∆C + ∆I ∆I = ∆Y - ∆C
K = ∆Y
∆Y - ∆C
Dividing by ∆Y
175. • Larger the MPC, Larger the Multiplier
( direct relationship between MPC and K)
• Larger the MPS, Smaller the Multiplier
(inverse relationship between MPS and K)
176. QUIZ
• What is the importance of multiplier?
• Who gave the concept of multiplier?
• What is the difference between foreign trade multiplier and
investment multiplier?
• How is multiplier related to MPC and MPS?
177. Assumptions
• Consumption is a function of current income
• There is no time lag
• There is no change in prices
• The economy is closed unaffected by foreign influences
• There is less than full employment level in the economy
• The marginal propensity to consume is constant
178. Working of multiplier
• Static Multiplier
• Dynamic Multiplier
• i. Forward Multiplier
• Ii.Backward Multiplier
179. Importance of Multiplier
• Income Generation
• Full Employment
• Public Investment
• Trade Cycles
• Inflation and deflation
• State Intervention
• Deficit finanicing
180. Leakages' of multiplier
• Idle Saving
• Imports
• Debt cancellation
• Purchase of old stocks
• Hoarding
• Taxes
• High liquidity preference
• Undistributed profits
• Excess stock of capital goods
181. Relevance of multiplier to
developing countries
• Keynesian multiplier is based on following assumption
• Involuntary unemployment
• Industrialized economy
• Excess capacity in consumption goods industries
• Comparatively elastic supply of raw material and working
capital
182. quiz
• What are the limitations of the concept of multiplier?
• How the concept of multiplier is useful for income
generation?
• What is the difference between static and dynamic
multiplier?
184. LEARNING OBJECTIVES
To understand the economics definition of money;
To understand the various concepts of money;
To understand how money can be used for different
purposes;
To understand how RBI measures the money supply
To understand what are the important factors that affect
the demand for money
186. Meaning
In general, money means currency notes and
coins.
However, in economics, the term money is
used for much wider sense and is defined
differently by different economists.
Conceptually, money can be defined as any
commodity that is generally accepted as a
medium of exchange and measure of value.
187. Definition
H. G. Johnson has classified the approaches
to the definition of money under the
following categories:
The Conventional Approach
The Chicago Approach
The Central Bank Approach
The Gurley-Shaw Approach
188. THE CONVENTIONAL APPROACH
Most oldest and widely accepted approach.
Stresses mainly one the basic functions of
money i.e. medium of exchange and measure
of value.
Any commodity that functions as a medium
of exchange and measure of value is money.
It includes barter system (Exchanging
commodities for commodities)
However, this system had some problems.
189. THE CHICAGO APPROACH
Coined by Milton Friedman and his associates in
Chicago University.
They extended the conventional definition by adding
the time deposits in it.
Thus money include (i) Currency, (ii) Demand
Deposits, (iii) Time Deposits.
They included the time deposits for two reasons:
Time deposits have direct correlation with money supply
and with GNP
Time deposits remain unavailable for transaction only for
a short period.
190. The Gurley-Shaw Approach
This approach is attributed to John G. Gurley
and Edward S. Shaw.
They regarded the liquid assets held by financial
intermediaries and liabilities of non-bank
intermediaries as close substitute for money.
Intermediaries provide substitute for money as a
store of value.
Thus, they gave wider definition of money based
on liquidity which includes bonds, insurance
reserves, pension funds, savings and loan shares.
191. The Central Bank Approach
The central banks take still a wider definition of
money. They view all available means of
payment and credit flows as money.
Thus, money supply constitutes currency plus all
‘realizable assets’ i.e. the assets which have
perfect or near perfect liquidity.
Depending upon objectives of monetary policy
and policy targets central banks make and use
different measures of money supply, referred to
as M1, M2, M3 and M4.
192. Conclusion:
To conclude, money cannot be
described on the basis of matter it is
made of. It can be defined in terms of
its functions:
‘Any thing which is used for medium
of exchange, measure of value, store
of value and standard of deferred
payments’.
194. Functions of Money
The following couplet brings out the major functions
of money:
“Money is a matter of functions four:
A medium, a measure, a standard, a store”
Kinley classified the functions of money into
following three categories:
Primary and Main Functions
Secondary and Subsidiary Functions
Contingent Functions
195. Functions of Money
Primary Functions:
Medium of Exchange
Measure of Value
Secondary Functions:
Standard of Deferred Payments
Store of Value
196. Functions of Money
Contingent Functions:
Basis of Credit Creation
Maximum Satisfaction
Distribution of National Income
Increase in the Liquidity of Capital
Bearer of option
197. QUESTIONS
Money can be defined as any
commodity that is generally accepted as
a _______________.
What are the four approaches to money?
Chicago approach added which factor to
money?
What are the secondary functions of
money?
199. CONCEPTS OF MONEY
Money has been used since time
immemorial. It has only been changing
form over time.
Since its evolution money took several
forms as:
Commodity Money
Metallic Money
Paper Money
Bank Deposits
Near Money
200. CONCEPTS OF MONEY
Commodity Money:
Under this, the people used commodities or
animals as money.
Demerits:
Commodities are not homogeneous
Supply of commodities could be abruptly
change.
Hoarding was not possible
Lack of portability
201. CONCEPTS OF MONEY
Metallic Money:
It was introduced to meet the difficulties of
commodity money. Different metals, such as
iron, gold, brass, silver, copper, etc. were used
to make coins.
Demerits:
Supply of these coins could not always be
adjusted to their demand.
Very heavy.
Continuous use of metal coins resulted in
lot of depreciation.
202. CONCEPTS OF MONEY
Paper Money:
In past traders, used to deposit their metallic
money with money lenders and obtain
certificate of deposit. These certificates were
used as money. Thus, this led to the origin of
paper money.
These days the paper money is issued only by
the Central Bank of the country.
Initially, the paper money was convertible into
gold or gold coins, but these days it is
inconvertible in all countries of the world.
203. CONCEPTS OF MONEY
Paper Money:
Merits:
Not an expensive system of currency
Supply can easily be adjusted according to the
need
Easily transferrable
Demerits:
Always a possibility of excessive supply of paper
money which leads to inflation in the economy
and fall in the value of the currency.
204. CONCEPTS OF MONEY
Bank Deposits:
There are three types of bank deposits:
Current Account Deposits
Saving Deposits
Time Deposits
Current A/C deposits are widely referred to as demand
deposits which are also known as ‘bank money’ and
‘credit money’.
Conventional approach included only demand deposits
in the definition of money but Chicago approach treats
saving and time deposits as close substitute to demand
deposits.
205. CONCEPTS OF MONEY
Near Money:
Near money refers to those promissory notes
which can be easily converted into money, but
can not be used as money to buy goods and
services.
Near money includes treasury bills, bonds,
securities, fixed deposits in banks, insurance
policies, etc.
Thus, compared to paper money near money is
less liquid.
206. FIAT PAPER MONEY
Fiat Paper Money:
It is a kind of inconvertible paper money issued by the
state under emergency conditions. That’s why, it is also
known as emergency money.
Fiat money is not backed up by any reserve.
Since this money is not backed up by any reserves,
government issued it in limited quantity.
German Mark issued during World War I and the entire
paper money during World War II were a sort of fiat
money.
It is different from inconvertible paper money because
the latter is backed up by a reserve fund.
207. QUESTIONS
What are the demerits of commodity
money?
What do you mean by near money?
How paper money come into
existence?
What do you mean by fiat money?
209. FACTORS AFFECTING DEMAND FOR
MONEY
The demand for money is affected by several
factors, including the level of income, interest rates,
and inflation as well as uncertainty about the future.
The way in which these factors affect demand for
money is usually explained in terms of the three
motives for demanding money:
transaction motive,
precautionary motive, and
speculative motive.
210. TRANSACTION MOTIVE
The transactions motive for demanding money
arises from the fact that most transactions involve an
exchange of money.
Because it is necessary to have money available for
transactions, money will be demanded. The total
number of transactions made in an economy tends to
increase over time as income rises.
Hence, as income or GDP rises, the transactions
demand for money also rises.
211. PRECAUTIONARY
MOTIVE
People often demand money as a precaution
against an uncertain future.
Unexpected expenses, such as medical or car
repair bills, often require immediate payment.
The need to have money available in such
situations is referred to as the precautionary
motive for demanding money.
212. SPECULATIVE MOTIVE
Money, like other stores of value, is an asset. The demand
for an asset depends on both its rate of return and its
opportunity cost.
Typically, money holdings provide no rate of return and
often depreciate in value due to inflation.
The opportunity cost of holding money is the interest
rate that can be earned by lending or investing one's
money holdings. The speculative motive for demanding
money arises in situations where holding money is
perceived to be less risky than the alternative of lending
the money or investing it in some other
213. SPECULATIVE MOTIVE
For example, if a stock market crash seemed imminent, the
speculative motive for demanding money would come into
play; those expecting the market to crash would sell their
stocks and hold the proceeds as money.
The presence of a speculative motive for demanding money is
also affected by expectations of future interest rates and inflation.
If interest rates are expected to rise, the opportunity cost of
holding money will become greater, which in turn diminishes
the speculative motive for demanding money. Similarly,
expectations of higher inflation presage a greater depreciation
in the purchasing power of money and therefore lessen the
speculative motive for demanding money.
215. SUPPLY OF MONEY
Modern form of money is simply pieces of paper or numbers in a
ledger.
Earlier money was in the form of coins, composed of gold, silver
and copper ,etc. Value of the coins was based on the value of the
metals they contained.
System of paper money was introduced based on the gold standard or
silver standard or some combination of the two, to ensure people’s
faith in the system.
The gold standard broke down in 1930 in UK, in USA it lasted till
1971
This piece of paper is just like a promissory note issued by a relevant
authority.
A currency issued by the government is called a fiduciary issue (based
on trust and confidence).
216. SUPPLY OF MONEY
• In India the Reserve Bank of India is responsible for money
supply and control.
• India followed the proportional reserve system until 1956,
whereby a reserve of gold, silver, government securities and
foreign securities was maintained, of which gold and or foreign
securities were at least 40% of total reserves.
• In 1956 this was replaced by fixed minimum reserve system in
which reserve worth Rs. 400 crore including gold worth Rs.
115 crores was kept, which was reduced to Rs. 200 crore
including gold worth Rs. 115 crores in 1957.
• Thus practically Indian currency is nonconvertible in any
precious metal and is a fiat money that is declared by state to
be a legal tender. Under this system any number of notes can
be printed as per needs of the economy.
217. MONEY SUPPLY AGGREGATES
• Narrow money includes only very liquid assets like currency, i.e. notes and
coins in the hands of public and demand deposits in the banks
• Broad money includes a set of less liquid assets like term deposits with banks
M1: Currency with public, i.e. coins and notes + demand deposits of public with
banks. It is also known as Narrow Money
M2: M1 + Post office savings deposits
M3: M2 + Time deposits of the public with banks+ “Other” deposits with RBI. It is
also known as Broad Money.
M4: M3 + All other deposits with Post office
M0: Currency in circulation+ Bankers’ deposits with RBI+ “Other” deposits with RBI.
It is also called Reserve Money.
Now RBI calculates only three of the above measures, i.e. M0, M1, and M3.
• Money Multiplier = M3 / M0
• Monetization = M1 / GDP
• Monetary Deepening = M3 / GDP
218. QUESTIONS
What is the precautionary motive for
demand of money?
What is the transaction motive for
demand of money?
What is the speculative motive for
demand of money?
What are the broad and narrow
definitions of money?
221. Lecture Plan
• Inflation
• Causes of Inflation
• Inflation and Decision Making
• Measuring Inflation
• Inflation and Employment
• Control of Inflation
222. Objectives
• To explore the realms of inflation and its different frontiers.
• To delve into concepts like wage price spiral, hyperinflation
and inflationary gap.
• To understand various measures of inflation and their role in
decision making.
• To analyze the reasons behind inflation, its impact on the
economy and the measures to curb it.
223. Inflation
• Coulborn: it is a state of “too much money chasing too few goods”.
• Two broad categories:
• price inflation (generally called as inflation)
• money inflation.
• Money inflation is increase in the amount of currency in circulation. Which may be due
to:
• Deficit financing : direct cause is printing of additional currency on
demand of the government to meet its needs.
• Additional money supply through foreign exchange inflows in the form
of capital, such as foreign direct investment and foreign institutional
investment, tourism and other incomes from abroad.
Price inflation is a persistent increase in the general price level or a
persistent decline in the real income of people, i.e. decline in value
of money.
224. Concepts of Inflation
• Headline Inflation: measure of the total inflation within an economy
• affected by the areas of the market which may experience sudden inflationary
spikes such as food or energy.
• Hyperinflation: prices increase at such a speed that the value of money erodes
drastically
• This is also known as galloping inflation or runaway inflation.
• Stagflation: a typical situation when stagnation and inflation coexist.
• Disinflation: a process of keeping a check on price rise by deliberate attempts.
• Deflation: a state when prices fall persistently; just opposite to inflation
• Inflationary Gap (Keynes): Excess of anticipated expenditure over available output at
base price
• When money income exceeds the supply of goods and services, a gap is
created between demand and supply resulting in inflation.
225. Wage Price Spiral
Prices Rise
Cost of
living rises
Wages rise
Cost of
production rises
Wages chase prices and prices chase wages, thus create a wage price
spiral.
•When prices rise, workers demand
higher money (or nominal) wages to
protect their real wages. This raises
the costs faced by their employers.
• To protect the real value of profits
producers pass the higher costs onto
consumers in the form of higher
prices.
•Workers (who are also consumers
demand for higher money wages.
226. Causes of Inflation
• Demand Pull Inflation: when aggregate demand increases due to any reason, and supply of
output is unable to match this increased demand; i.e demand pulls prices up.
• Increase in money supply/ Increase in disposable income
• Increase in aggregate spending
• Increase in population of the country
• Cost Push Inflation: An increase in price of any of the inputs will increase the cost of
production; i.e. prices pushed up by cost.
• Low Increase in Supply: if supply falls short of demand, prices will increase.
• Obsolete technology/Deficient machinery
• Scarcity of resources
• Natural calamities/ Industrial disputes/ external aggressions
• Built in Inflation: Built in inflation is a type of inflation that has resulted from past events and
persists in the present.
• It is also known as hangover inflation.
227. Inflation and Decision Making
• Impact on Consumers
• increase in any price upsets the home budget.
• Impact on Producers (or Suppliers)
• Producers as sellers are benefited by inflation;
• higher the prices, higher are their profits.
• when as buyers of raw material, they are adversely affected by inflation.
Impact on Government:
• Government has to take the economy to higher levels of growth by encouraging production and
investment,
• At the other end, has to see that taxpayers’ money is not eroded by hyperinflation.
• Thus government has to act as the balancing force between consumers and sellers.
228. Measuring Inflation
• A price index is a numerical measure designed to compare how the prices of
some class of goods and/or services, taken as a whole, differ between time
periods or geographical locations. (prices of the base year are assumed to be
equal to 100.)
Price Index =
• The most common term used to denote inflation is inflation rate, which is
annual rate of increase of prices.
Inflation Rate
100
Index
s
Year'
Current
Index
s
Year'
Current
-
Index
s
year'
Last
100
Price
s
Year'
Base
Price
s
Year'
Current
229. Measuring Inflation
• Producer Price Index (PPI): measures average changes in prices received by domestic
producers for their output.
• Wholesale Price Index (WPI): measures wholesale prices of a wide variety of goods
(including consumer and capital goods.
• USA has replaced WPI with PPI
• Consumer Price Index (CPI): measures the price of a selection of goods purchased by a
typical consumer.
• CPI differs from PPI in that price subsidy, profits, and taxes may cause the amount received
by the producer to differ from what the consumer paid.
• Cost of Living Indices (COLI): used to adjust fixed incomes and contractual incomes to
maintain the real value of such incomes.
• wage indexation is based on such indices.
• Service Price Index (SPI): With the growing importance of service sector across the world,
many countries have started developing services price indices (SPI).
230. Control of Inflation
• Inflation erodes the value of money and discourages
savings
• But zero inflation is undesirable
• Need to control inflation
• monetary policy measures (proposed by those who
believed money supply is the major culprit)
• fiscal policy measures (proposed by Keynes and his
followers).
• Other measures
• The government has to adopt an appropriate
combination of these measures after thorough
examination of the causes of inflation
231. Monetary Policy Measures
• Increasing the discount rate: The central bank
rediscounts the eligible papers offered by commercial
banks. This is also called bank rate.
• Higher reserve ratios:
• Cash Reserve Ratio (CRR)
• Statutory Liquid Ratio (SLR)
• Open market operations: directly sell government
securities to public and restrain their disposable income
• Selective credit control: discourages consumption but
not investment
232. Fiscal Policy Measures
The government may reduce public expenditure or increase public
revenue to keep a check on inflation
• Reducing public expenditure
• When government spends on activities like health, transport,
communication, etc., income of individuals increases; this in turn
increases the aggregate demand.
• Therefore the reverse will also be true.
• Increasing public revenue
• Major source of government revenue is various types of taxes
• Increase in income tax leaves less of disposable income in the hands of
consumers
234. Learning Outcomes:
1. Meaning and Scope of monetary policy;
2. Instruments of monetary policy;
3. Role of Monetary Policy in achieving
macroeconomic goals;
4. Effectiveness and limitations of monetary policy.
235. “Monetary policy refers to the action taken
by the monetary authorities to control and
regulate the demand for and supply of money
with a given purpose.”
236.
237. Scope of Monetary Policy:
The scope of monetary policy depends, by and large, on two
factors:
i. The level of monetization of the economy, and
ii. The level of development of the financial market
238. INSTRUMENTS OF MONETARY
POLICY
General Credit Control
Measures
1. Bank Rate
2. CRR
3. Open Market Operations
4. SLR
5. Repo Rate (Repurchase
operation rate)
6. Reverse Repo Rate
Selective Credit Control
Measures
1. Credit Rationing
2. Change in Lending Margins
3. Moral Suasion
4. Direct Controls
239. General Measures:
1. Bank Rate Policy:
• The rate at which central bank lends money to the commercial
bank and rediscounts the bills of exchange presented by
commercial banks is termed as bank rate
240. • The central bank can change this rate- increase or decrease-
depending on whether it wants to expand or reduce the flow of
credit from the commercial banks.
• Current Bank rate (Dec, 2012): 9.00 %
241. Limitations of BR as a Weapon of Credit Control
1. Nowadays, commercial banks are not dependent only on
financial support from central bank, which makes change in
rate ineffective.
2. With the growth of credit institutions and financial
intermediaries, capital market has widened and share of
banking credit has declined.
242. 2. Cash Reserve Ratio:
• Also termed as Statutory Reserve Ratio (SRR)
• It is the percentage of total deposits which commercial banks
are required to maintain in the form of cash reserve with the
central bank.
• Objective of CRR is to prevent shortage of cash for meeting
the cash demand by depositors.
243. • By changing CRR, the central bank can change the money supply
overnight
• When contractionary monetary policy is to be adopted , then the
central bank raises the CRR
• When expansionary monetary policy is to be adopted then central
bank cuts down the CRR
• Current CRR is 4.75 %
244. 3. Open Market Operations
Open Market Operations is the sale and purchase of
government securities and Treasury Bills by the central bank
of the country.
246. • In India, Treasury Bills are short-term promissory notes issued
by the Government of India through the RBI.
• There are two kinds of Treasury Bills:
a) 91- Day Bill : are issued by the RBI on behalf of the
government at fixed discount rate of 4.6 %. The RBI provides
rediscounting facility within 14 days of issue at an additional
rediscounting fees.
247. b) 182- Day Bill: introduced in 1986, are sold by auction to
residents of India for a minimum value of Rs 1,00,000.
• The auction bid is invited every fortnight and the ‘discount
rate’ is decided on the basis of auction rate.
248. • When central bank decides to pump money into circulation, it
buys back the government securities, bills and bonds
• When it decides to reduce money in circulation, it sells the
government bonds and securities.
249. How the sale of government bonds affects the supply of
credit?
1. Purchase of govt. securities reduces deposits with commercial
banks and their cash reserves which leads to decreased credit
creation capacity of the banks.
250. • When commercial banks themselves decide to buy the govt.
bonds and securities, their cash reserves go down which further
reduces credit creation capacity of the commercial banks.
251. How the sale of government bonds affects the demand
of credit?
1. Central banks sells the government bonds them at a
reduced price, i.e., at a price less than their denominated price.
2. Consequently, the actual rate of interest on the bonds goes up
which causes an upward push in the overall interest rate
structure
252. 3. The rise in the rate of interest reduces the demand for credit.
253. Effectiveness of OMO
Under the following conditions, OMO do not work properly:
1. When commercial banks possess excess liquidity.
2. In UDC’s where banking system is not well developed and
security capital markets are not interdependent, OMO have a
limited effectiveness.
255. 1. What is meant by monetary policy?
2. What monetary measures have been used by the RBI to
control inflation in the country?
3. How does the working of OMO affect the money supply in a
country like India?
256. 4. Statutory Liquidity Ratio:
• Under SLR, the commercial banks are required to maintain a
certain percentage of their total daily demand and time deposits
in the form of liquid assets.
257. • Liquid assets include:
a) Excess reserves
b) Unencumbered government securities, e.g. bonds of IDBI,
NABARD, Development Banks, debentures of ports, trusts
etc.
c) Current account balance with other banks
258. 5. Repo rate: RBI buys securities from banks and thereby provides
funds to the banks. The rate of interest at which the RBI lends
money to the bank is the repo rate.
6. Reverse repo rate: is the rate at which the banks can buy
securities or deposit money with the RBI
259. Quiz
1. What do you understand by SLR, Repo Rate, and Reverse
repo rate
2. Current rates?
3. How increase and decrease in repo rate affects the credit
creation?
260. 2. Selective Credit Control Measures:
1) Credit rationing
2) Change in Lending Margins
3) Moral Suasion
4) Direct Controls
261. Limitations and Effectiveness of Monetary Policy:
1. The Time Lag
2. Problems in Forecasting
3. Growth of Non-Banking Financial Intermediaries
4. Underdeveloped Money and Capital Markets
262. ?
1. Differentiate between general and selective credit control
measures?
2. What are the factors that determine the effectiveness of
monetary policy?
3. What monetary measures have been used by RBI in achieving
the policy targets?
263. FISCAL POLICY
Learning Objectives:
1. Meaning and scope of fiscal policy
2. Differentiate between financial instruments and
target variables
3. Kinds of fiscal policy
4. Fiscal policy and macroeconomic goals
264. • The word ‘fisc’ means ‘state treasury’ and ‘fiscal
policy’ refers to policy concerning the use of ‘state
treasury’ or government finances to achieve certain
macroeconomic goals.
265. Fiscal Instruments
1. Budgetary policy deficit or surplus budgeting
2. Government expenditure
3. Taxation
4. Public borrowings
266. Target Variables
Variables which are sought to be changed through fiscal
instruments are:
1. Private disposable incomes,
2. Private consumption expenditure,
3. Private savings and investment,
4. Exports and imports, and
5. Level and structure of prices
268. Kinds of Fiscal Policy
1. Automatic Stabilization Fiscal Policy,
2. Compensatory Fiscal Policy, and
3. Discretionary Fiscal Policy
269. Fiscal Policy and Macroeconomic Goals
1. Fiscal Policy for Economic Growth
2. Fiscal Policy for Employment
3. Fiscal Policy for stabilization
4. Fiscal Policy for Economic Equality
270. Crowding –Out and Crowding-In Controversy
Crowding-Out refers to the adverse effect of high deficit
spending by the government on private investment.
Crowding-in means rise in the private investment due to deficit
spending by the government.
271. ?
1. What is fiscal policy?
2. Differentiate between fiscal instruments and target variables?
3. Discuss the role of fiscal policy in achieving economic
growth?
4. Fiscal policy is the most powerful tool of achieving
macroeconomic goals. Discuss.
272. BALANCE OF PAYMENTS
Learning Outcomes:
1. Meaning and purpose of BOP
2. Accounting methods of BOP
3. India’s position in BOP
4. Factors responsible for imbalance in BOP
273. • “BOP is statement of economic transactions of a country with
the rest of the world over a period of time.”
• It can also be defined as a statement of all economic
transactions between the residents of a nation and the rest of
the world during a period of time, usually one year.
274. Purpose of BOP
• Yields necessary information on the strength and
weakness of the country in international economic
status.
• By analyzing the BOP account, one can find the
overall gains and losses from the international
economic transactions.
275. • BOP statements give warning signals for future policy
formulation.
276. BALANCE OF PAYMNETS ACCOUNTS
Economic transactions of a country can be categorised as:
1. Current transactions
2. Capital transactions
277. Factors Responsible for Imbalance in BOP
1. Inflation
2. Business cycle
3. Structural changes
4. Short-term disequilibrium factors
278. ?
1. What is BOP?
2. What is disequilibrium in BOP
3. What are the major causes of disequilibrium in the BOP?
Editor's Notes
(Figure 3-3 on p.49)
To the instructor:
It’s straightforward to see that the MPL = the prod function’s slope: The definition of the slope of a curve is the amount the curve rises when you move one unit to the right. On this graph, moving one unit to the right simply means using one additional unit of labor. The amount the curve rises is the amount by which output increases: the MPL.
Emphasize that “K” and “L” (without bars on top) are variables - they can take on various magnitudes. On the other hand, “Kbar” and “Lbar” are specific values of these variables. Hence, “K = Kbar” means that the variable K equals the specific amount Kbar.
Regarding the assumptions:
In chapters 7 and 8 (Economic Growth I and II), we will relax these assumptions: K and L will grow in response to investment and population growth, respectively, and the level of technology will increase over time.
Since the distribution of income depends on factor prices, we need to see how factor prices are determined.
Each factor’s price is determined by supply and demand in a market for that factor. For instance, supply and demand for labor determine the wage.
It’s easy to see that the MPL curve is the firm’s L demand curve.
Let L* be the value of L such that MPL = W/P.
Suppose L < L*. Then, benefit of hiring one more worker (MPL) exceeds cost (W/P), so firm can increase profits by hiring one more worker.
Instead, suppose L > L*. Then, the benefit of the last worker hired (MPL) is less than the cost (W/P), so firm should reduce labor to increase its profits.
When L = L*, then firm cannot increase its profits either by raising or lowering L.
Hence, firm hires L to the point where MPL = W/P.
This establishes that the MPL curve is the firm’s labor demand curve.