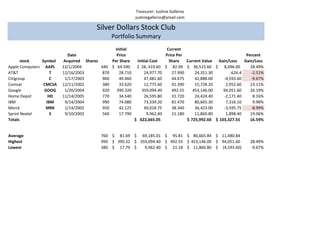
Treasurer: Justine Galleros
                                                           justinegalleros@ymail.com

                                       Silver Dollars Stock Club
                                              Portfolio Summary
                                                Initial                       Current
                           Date                  Price                       Price Per                             Percent
       stock   Symbol    Acquired Shares      Per Share     Initial Cost       Share   Current Value Gain/Loss    Gain/Loss
Apple Computers AAPL    12/1/2004        440 $ 64.590       $ 28,.419.60     $ 82.99 $ 36,515.60 $ 8,096.00          28.49%
AT&T               T    12/16/2003        870     28.710        24,977.70       27.990     24,351.30       -626.4    -2.51%
Citigroup          C     1/17/2003        960     49.460        47,481.60       44.675     42,888.00    -4,593.60    -9.67%
Comsat          CMCSA   12/11/2002        380     33.620        12,775.60       41.390     15,728.20     2,952.60    23.11%
Google          GOOG     1/20/2004        920    390.320      359,094.40        492.55    453,146.00    94,051.60    26.19%
Home Depot        HD    11/14/2005        770     34.540        26,595.80       31.720     24,424.40    -2,171.40     8.16%
IBM              IBM     9/14/2004        990     74.080        73,339.20       81.470     80,665.30     7,316.10     9.98%
Merck            MRK     1/14/2005        950     42.125        40,018.75       38.340     36,423.00    -3,595.75    -8.99%
Sprint Nextel      S     9/10/2003        560     17.790          9,962,40      21.180     11,860.80     1,898.40    19.06%
Totals                                                     $ 622,665.05                $ 725,992.60 $ 103,327.55     16.59%


Average                                  760 $ 81.69 $ 69,185.01 $ 95.81 $ 80,665.84 $ 11,480.84
Highest                                  990 $ 390.32 $ 359,094.40 $ 492.55 $ 453,146.00 $ 94,051.60                28.49%
Lowest                                   380 $ 17.79 $    9,962.40 $ 21.18 $ 11,860.80 $ (4,593.60)                 -9.67%

Galleros silver dollar

  • 1.
    Treasurer: Justine Galleros justinegalleros@ymail.com Silver Dollars Stock Club Portfolio Summary Initial Current Date Price Price Per Percent stock Symbol Acquired Shares Per Share Initial Cost Share Current Value Gain/Loss Gain/Loss Apple Computers AAPL 12/1/2004 440 $ 64.590 $ 28,.419.60 $ 82.99 $ 36,515.60 $ 8,096.00 28.49% AT&T T 12/16/2003 870 28.710 24,977.70 27.990 24,351.30 -626.4 -2.51% Citigroup C 1/17/2003 960 49.460 47,481.60 44.675 42,888.00 -4,593.60 -9.67% Comsat CMCSA 12/11/2002 380 33.620 12,775.60 41.390 15,728.20 2,952.60 23.11% Google GOOG 1/20/2004 920 390.320 359,094.40 492.55 453,146.00 94,051.60 26.19% Home Depot HD 11/14/2005 770 34.540 26,595.80 31.720 24,424.40 -2,171.40 8.16% IBM IBM 9/14/2004 990 74.080 73,339.20 81.470 80,665.30 7,316.10 9.98% Merck MRK 1/14/2005 950 42.125 40,018.75 38.340 36,423.00 -3,595.75 -8.99% Sprint Nextel S 9/10/2003 560 17.790 9,962,40 21.180 11,860.80 1,898.40 19.06% Totals $ 622,665.05 $ 725,992.60 $ 103,327.55 16.59% Average 760 $ 81.69 $ 69,185.01 $ 95.81 $ 80,665.84 $ 11,480.84 Highest 990 $ 390.32 $ 359,094.40 $ 492.55 $ 453,146.00 $ 94,051.60 28.49% Lowest 380 $ 17.79 $ 9,962.40 $ 21.18 $ 11,860.80 $ (4,593.60) -9.67%