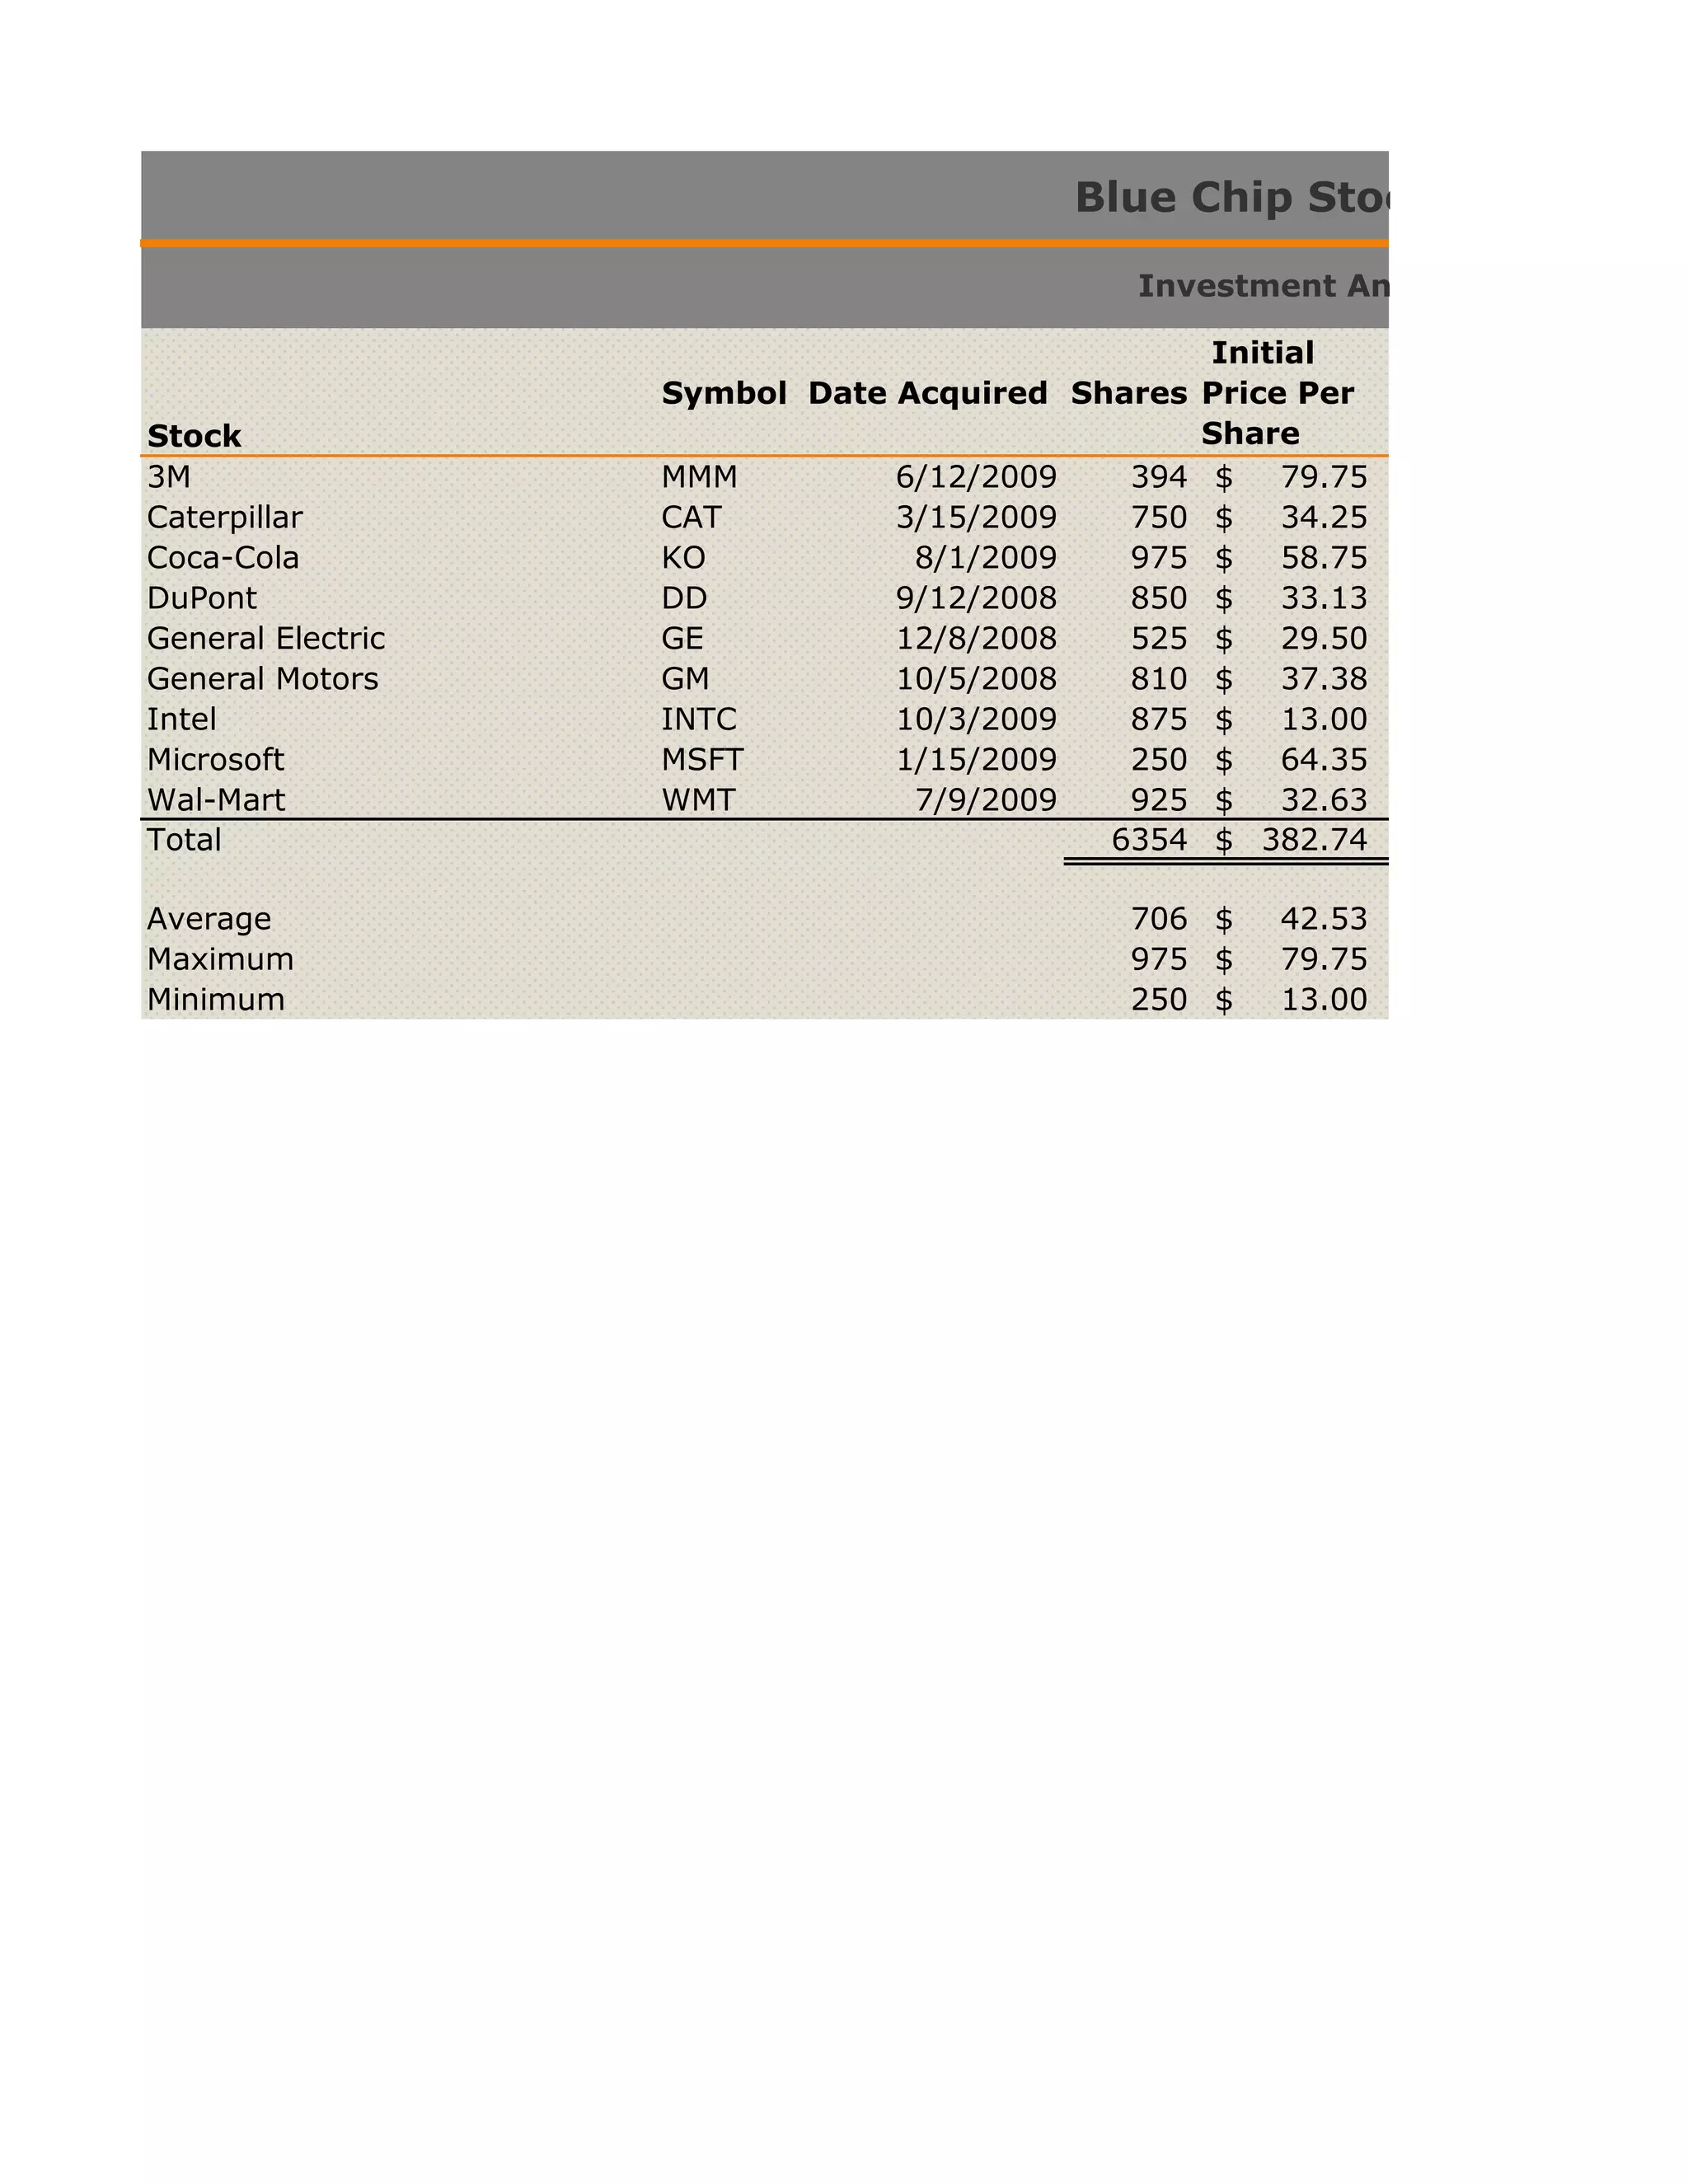
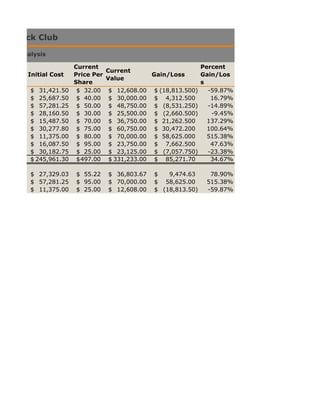
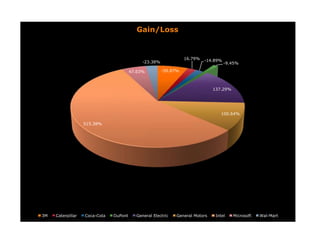
Blue Chip Stock Club

                                            Investment Analysis

                                                  Initial
                   Symbol Date Acquired Shares    Price Per
Stock                                             Share
3M                 MMM        6/12/2009     394    $   79.75
Caterpillar        CAT        3/15/2009     750    $   34.25
Coca-Cola          KO          8/1/2009     975    $   58.75
DuPont             DD         9/12/2008     850    $   33.13
General Electric   GE         12/8/2008     525    $   29.50
General Motors     GM         10/5/2008     810    $   37.38
Intel              INTC       10/3/2009     875    $   13.00
Microsoft          MSFT       1/15/2009     250    $   64.35
Wal-Mart           WMT         7/9/2009     925    $   32.63
Total                                      6354    $ 382.74

Average                                     706 $     42.53
Maximum                                     975 $     79.75
Minimum                                     250 $     13.00
hip Stock Club

tment Analysis

                        Current                                     Percent
                                    Current
        Initial Cost    Price Per                  Gain/Loss        Gain/Los
                                    Value
                        Share                                       s
         $ 31,421.50     $ 32.00    $ 12,608.00    $ (18,813.500)     -59.87%
         $ 25,687.50     $ 40.00    $ 30,000.00    $ 4,312.500         16.79%
         $ 57,281.25     $ 50.00    $ 48,750.00    $ (8,531.250)      -14.89%
         $ 28,160.50     $ 30.00    $ 25,500.00    $ (2,660.500)       -9.45%
         $ 15,487.50     $ 70.00    $ 36,750.00    $ 21,262.500       137.29%
         $ 30,277.80     $ 75.00    $ 60,750.00    $ 30,472.200       100.64%
         $ 11,375.00     $ 80.00    $ 70,000.00    $ 58,625.000       515.38%
         $ 16,087.50     $ 95.00    $ 23,750.00    $ 7,662.500         47.63%
         $ 30,182.75     $ 25.00    $ 23,125.00    $ (7,057.750)      -23.38%
         $ 245,961.30    $ 497.00   $ 331,233.00   $ 85,271.70         34.67%

         $ 27,329.03    $ 55.22     $ 36,803.67    $   9,474.63       78.90%
         $ 57,281.25    $ 95.00     $ 70,000.00    $ 58,625.00       515.38%
         $ 11,375.00    $ 25.00     $ 12,608.00    $ (18,813.50)     -59.87%
Gain/Loss


                                                                 16.79%   -14.89%
                                             -23.38%                                -9.45%

                                        47.63%         -59.87%


                                                                              137.29%


                                                                                  100.64%

                   515.38%


3M   Caterpillar   Coca-Cola   DuPont     General Electric   General Motors    Intel    Microsoft   Wal-Mart

Blue Chip Stock Analysis

  • 1.
    Blue Chip StockClub Investment Analysis Initial Symbol Date Acquired Shares Price Per Stock Share 3M MMM 6/12/2009 394 $ 79.75 Caterpillar CAT 3/15/2009 750 $ 34.25 Coca-Cola KO 8/1/2009 975 $ 58.75 DuPont DD 9/12/2008 850 $ 33.13 General Electric GE 12/8/2008 525 $ 29.50 General Motors GM 10/5/2008 810 $ 37.38 Intel INTC 10/3/2009 875 $ 13.00 Microsoft MSFT 1/15/2009 250 $ 64.35 Wal-Mart WMT 7/9/2009 925 $ 32.63 Total 6354 $ 382.74 Average 706 $ 42.53 Maximum 975 $ 79.75 Minimum 250 $ 13.00
  • 2.
    hip Stock Club tmentAnalysis Current Percent Current Initial Cost Price Per Gain/Loss Gain/Los Value Share s $ 31,421.50 $ 32.00 $ 12,608.00 $ (18,813.500) -59.87% $ 25,687.50 $ 40.00 $ 30,000.00 $ 4,312.500 16.79% $ 57,281.25 $ 50.00 $ 48,750.00 $ (8,531.250) -14.89% $ 28,160.50 $ 30.00 $ 25,500.00 $ (2,660.500) -9.45% $ 15,487.50 $ 70.00 $ 36,750.00 $ 21,262.500 137.29% $ 30,277.80 $ 75.00 $ 60,750.00 $ 30,472.200 100.64% $ 11,375.00 $ 80.00 $ 70,000.00 $ 58,625.000 515.38% $ 16,087.50 $ 95.00 $ 23,750.00 $ 7,662.500 47.63% $ 30,182.75 $ 25.00 $ 23,125.00 $ (7,057.750) -23.38% $ 245,961.30 $ 497.00 $ 331,233.00 $ 85,271.70 34.67% $ 27,329.03 $ 55.22 $ 36,803.67 $ 9,474.63 78.90% $ 57,281.25 $ 95.00 $ 70,000.00 $ 58,625.00 515.38% $ 11,375.00 $ 25.00 $ 12,608.00 $ (18,813.50) -59.87%
  • 3.
    Gain/Loss 16.79% -14.89% -23.38% -9.45% 47.63% -59.87% 137.29% 100.64% 515.38% 3M Caterpillar Coca-Cola DuPont General Electric General Motors Intel Microsoft Wal-Mart