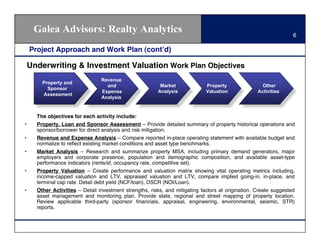
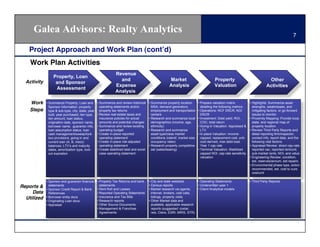
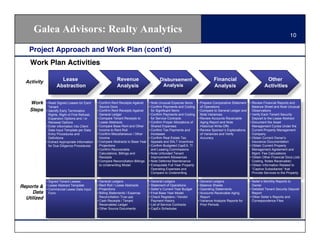
Galea Advisors: Realty Analytics

VALUE CREATION. PERFORMANCE ENHACEMENT. REAL ESTATE SOLUTIONS


Commercial Real Estate Client Services
         Underwriting & Investment Valuation,
           And Due Diligence Services for
         Commercial Real Estate Transactions
                            December 1, 2009


                  © Copyright 2009 Galea Advisors, Inc. All rights reserved.
Galea Advisors: Realty Analytics                                                                                             2


Galea Advisors, Inc (“Galea”) is pleased to present this presentation outlining the commercial real estate outsourcing and
support services we offer in underwriting & investment valuation, and due diligence services. To date, we have completed
comparable services on engagements for lenders, advisory firms, and investment funds of various size and scope including,
most recently, an FDIC structured transaction encompassing over seven hundred loans collateralized by assets located in
fourteen states. This presentation outlines our project approach, typical work plan, staffing plan, firm credentials and professional
biographies.
We believe that Galea represents the best alternative for performing this work due to our:
•    Composition as a "white-label" resource that bolsters internal resources discreetly without altering or disrupting the Client!s
     corporate culture;
•    Highly experienced staff, all of whom have bulge bracket financial firm backgrounds, deep real estate financial and analytical
     skill-sets, and/or principal-level commercial real estate development and investment experience;
•    Expertise in each of the major property types (office, retail, hospitality and multifamily);
•    Service-oriented firm that focuses on providing services uniquely tailored to meet the specific needs of each individual
     Client, respectively.
•    Capacity to provide assistance on short notice with varying time commitments and with limited potential for Client conflicts;
•    Competitive hourly, weekly, or project/asset-based fee structures.
Galea!s professionals have prior experience completing due diligence/underwriting services on billions of dollars of real
estate assets and transactions for commercial real estate groups at the following companies: Deloitte & Touche, Credit Suisse,
Capital Trust, Ernst & Young, Babcock & Brown, Jones Lang LaSalle and Alvarez & Marsal.
Galea is dedicated to providing each Client with in-depth real estate expertise in a highly efficient and cost effective manner.
We would be pleased to meet with you and review our service offerings in person or discuss other avenues for servicing your
commercial real estate needs.

Please call either Eric Andrew at (646) 662-3509 or Vernon Beckford at (914) 582-0450 if Galea can be of assistance.
Galea Advisors: Realty Analytics                   3

   Proposal Contents


                                                  Page
   !           Project Approach and Work Plan       6
                                                    4
   !           Staffing Plan                        13
                                                   11
   !           Summary Professional Biographies    13
                                                    15
   !           Appendix                            16
                                                    18


Privileged and Confidential
Galea Advisors: Realty Analytics                                                                       4

Project Approach and Work Plan

Project Approach

Galea!s approach to completing the underwriting & investment valuation, due diligence and lease
abstraction procedures is geared towards meeting your critical objectives in a timely and cost efficient
manner. Our approach integrates:

•Standardized Procedures and Work Program – At the outset, we will agree upon a base set of
procedures to be undertaken that will be modified, as required, dependent on the specific deal. A formal
work program will be established for each deal against which our progress will be tracked.
•Experienced Personnel – We will dedicate an experienced project team with the required skills to perform
all of the required procedures.
•Formal Weekly Status Updates – We will provide you with a formal status report each week that outlines
our progress against plan, hours incurred versus budget, and resolution status of any issues encountered.
•Ongoing Communication – We will provide you with continuous communications of any problems that we
encounter with respect to completing our work (e.g., difficulty obtaining data) or significant property-
specific issues that we identify as part of our work.

Following is our detailed work plan for completing the due diligence procedures.
Galea Advisors: Realty Analytics                       5

Project Approach and Work Plan


                  Underwriting & Investment Valuation
                           Project Approach
                                  And
                              Work Plan
Galea Advisors: Realty Analytics                                                                              6

    Project Approach and Work Plan (cont!d)

    Underwriting & Investment Valuation Work Plan Objectives
                                 Revenue
        Property and
                                   and                    Market              Property                Other
          Sponsor
                                 Expense                 Analysis             Valuation             Activities
        Assessment
                                 Analysis


      The objectives for each activity include:
•     Property, Loan and Sponsor Assessment – Provide detailed summary of property historical operations and
      sponsor/borrower for direct analysis and risk mitigation.
•     Revenue and Expense Analysis – Compare reported in-place operating statement with available budget and
      normalize to reflect existing market conditions and asset type benchmarks.
•     Market Analysis – Research and summarize property MSA, including primary demand generators, major
      employers and corporate presence, population and demographic composition, and available asset-type
      performance indicators (rents/sf, occupancy rate, competitive set).
•     Property Valuation – Create performance and valuation matrix showing vital operating metrics including,
      income-capped valuation and LTV, appraised valuation and LTV, compare implied going-in, in-place, and
      terminal cap rate. Detail debt yield (NCF/loan), DSCR (NOI/Loan).
•     Other Activities – Detail investment strengths, risks, and mitigating factors at origination. Create suggested
      asset management and monitoring plan. Provide state, regional and street mapping of property location.
      Review applicable third-party (sponsor financials, appraisal, engineering, environmental, seismic, STR)
      reports.
Galea Advisors: Realty Analytics                                                                                                                                                             7

    Project Approach and Work Plan (cont!d)
    Work Plan Activities
                                                                Revenue
                  Property, Loan
  Activity                                                        and                                   Market                            Property                              Other
                   and Sponsor
                                                                Expense                                 Analysis                          Valuation                            Activities
                   Assessment
                                                                Analysis

    Work     • Summarize Property, Loan and         • Summarize and review historical    • Summarize property location         • Prepare valuation matrix           • Highlights: Summarize asset
               Sponsor information: property          operating statements and/or          MSA, demand generators,               detailing the following metrics:     strengths, weaknesses, and
    Steps      type & sub-type, city, state, year     property tax returns                 employment and transportation       • Operations: NCF DSCR, NOI            mitigating factors, or go forward
               built, year purchased, lien type,    • Review real estate taxes and         centers                               DSCR                                 issues to monitor
               lien amount, loan status,              insurance policies for actual      • Research and summarize local        • Investment: Debt yield, ROI,       • Proximity Mapping: Provide local,
               origination date, sponsor name,        amounts and potential changes        demographics (income, age,            COC, total return                    state, and regional map of
               borrower name, guarantor info,       • Summarize and review existing        ethnicity)                          • Going-in Valuation: Appraised &      property location
               loan assumption status, loan           operating budget                   • Research and summarize                LTV                                • Review Third Party Reports and
               cash management/sweep/lock           • Create in-place reported             asset type/class market             • In-place Valuation: Income-          detail reporting firm/inspector,
               box provisions, going-in and           operating statement                  conditions (rate/sf, market size,     capped, replacement cost, unit-      contact info, report date, and the
               current loan (A, B, mezz)            • Create in-place risk-adjusted        occupancy rates)                      cost derived, max debt-load.         following vital factors:
               balances, LTV’s and maturity           operating statement                • Research property competitive         Year 1 cap rate                    • Appraisal Review: direct cap-rate,
               dates, amortization type, lock-      • Create stabilized best and worst     set (sales/leasing)                 • Terminal Valuation: Stabilized       reported vac, reported rent/unit,
               out expiration                         case operating statement                                                   capped NOI, cap-rate sensitivity     sub-market rents, NOI, and value
                                                                                                                                 valuation                          • Engineering Review: condition,
                                                                                                                                                                      est. reserves/annum, est repairs.
                                                                                                                                                                    • Environmental:phase type, action
                                                                                                                                                                      recommended, est. cost to cure,
                                                                                                                                                                      cost/unit

             • Sponsor and guarantor financial      • Property Tax Returns and bank      • City and state websites             • Operating Statements               • Third Party Reports
               statements                             statements                         • Census reports                      • Underwritten year 1
Reports &    • Sponsor Credit Report & Bank         • Rent Roll and Leases               • Market research via agents,         • Client Analytical models
     Data      References                           • Reported Operating Statements        internet, brokers, cold calls,
  Utilized   • Borrower entity docs                 • Insurance and Tax Bills              listings, property visits.
             • Originating Loan docs                • Research reports                   • Other Market data and
             • Appraisal                            • Other Source Documents               available, applicable research
                                                    • Management & Franchise               reports (suggested: costar,
                                                      Agreements                           reis, Claris, ESRI, MRIS, STR)
Galea Advisors: Realty Analytics                       8

Project Approach and Work Plan


                  Due Diligence and Lease Abstraction
                            Project Approach
                                  And
                               Work Plan
Galea Advisors: Realty Analytics                                                                              9

    Project Approach and Work Plan (cont!d)

    Work Plan Objectives

           Lease                   Revenue            Disbursements           Financial               Other
         Abstraction               Analysis              Analysis             Analysis              Activities


      The objectives for each activity include:
•     Lease Abstraction – Provide detailed lease information for direct analysis and comparison to the Seller!s
      reports.
•     Revenue Analysis – Ensure that the tenant base rent and other income items are billed and collected
      accordingly, as stated in the tenant's lease agreement, and the confirm that first year base rents for each
      tenant are accurate.
•     Disbursements Analysis – Verify the general reasonableness of property operating expenses by identifying
      unusual and / or major fluctuations in operating expense accounts, identifying any deferred operating
      maintenance items and verifying contractual payments to the service vendors.
•     Financial Analysis – Highlight, on a comparative basis, the historical trends of the operating accounts and
      provides an analytical review for the variance in account balances. The analysis also provides information for
      evaluation of the accounting records and identifies potential misstatements that may exist.
•     Other Activities – Provide miscellaneous additional information on the property as disclosed during the
      financial due diligence review process. Includes reviewing information that may provide detail supporting
      unusual property activities.
Galea Advisors: Realty Analytics                                                                                                                                                10

    Project Approach and Work Plan (cont!d)
    Work Plan Activities

  Activity            Lease                                   Revenue                       Disbursement                          Financial                          Other
                    Abstraction                               Analysis                       Analysis                             Analysis                          Activities


    Work     • Read Signed Leases for Each       • Confirm Rent Receipts Against     • Note Unusual Expense Items       • Prepare Comparative Statement   • Review Financial Reports and
               Tenant                              Source Docs                       • Confirm Payments and Coding        of Operations                     Balance Sheet and Note Unusual
    Steps    • Identify Early Termination        • Confirm Rent Receipts Against       for Significant Items            • Compare to General Ledger and     Observations
               Rights, Right of First Refusal,     General Ledger                    • Confirm Payments and Coding        Note Variances                  • Verify Each Tenant Security
               Expansion Options and / or        • Compare Tenant Receipts to          for Service Contracts            • Review Accounts Receivable        Deposit to the Lease Abstract
               Renewal Options                     Lease Abstracts                   • Confirm Proper Allocations of      Aging Report and Note           • Document the Asset
             • Enter information into Client     • Compare Base Rent and Other         Shared Expenses                    Historical Write-Offs             Management Cycles Under the
               Data Input Template per Data        Income to Rent Roll               • Confirm Tax Payments and         • Review Sponsor’s Explanations     Current Property Management
               Entry Procedures and              • Confirm Miscellaneous / Other       Increases                          of Variances and Verify           Company
               Definitions                         Income                            • Confirm Real Estate Tax            Accuracy                        • Obtain Current Owner’s
             • Extract Appropriate Information   • Compare Abstracts to Base Year      Appeals and SALT Incentives                                          Insurance Documentation
               for Due Diligence Procedures        Projections                       • Confirm Budgeted CapEX, TI                                         • Obtain Current Property
                                                 • Confirm Recoverable                 and Leasing Commissions                                              Management Agreement and
                                                   Calculations, Billings and        • Note Unfunded Tenant                                                 Mgmt. Fee Calculations
                                                   Receipts                            Improvement Allowances                                             • Obtain Other Financial Docs (Job
                                                 • Compare Reconciliation Billings   • Note Deferred Maintenance                                            Costing, Notes Receivable)
                                                   to Underwriting Model             • Extrapolate Full Year Property                                     • Obtain Information Related to
                                                                                       Operating Expenses and                                               “Captive Subsidiaries” that
                                                                                       Compare to Underwriting                                              Provide Services to the Property

             • Signed Tenant Leases              • General Ledgers                   • General Ledgers                  • General Ledgers                 • Seller’s Monthly Reports to
             • Lease Abstract Template           • Rent Roll / Lease Abstracts       • Statement of Operations          • Balance Sheets                    Owner
Reports &    • Commercial Lease Data Input       • Projections                       • Seller’s Current Year Budget     • Operating Statements            • Detailed Tenant Security Deposit
     Data      Form                              • Billing Statements / Expense      • Final Base Year Model            • Accounts Receivable Aging         Report
  Utilized                                         Reconciliation True-ups           • Check Registers / Vendor           Report                          • Other Seller’s Reports and
                                                 • Cash Receipts / Tenant              Payment History                  • Variance Analysis Reports for     Correspondence Files
                                                   Receivables Ledger                • List of Service Contracts          Prior Periods
                                                 • Other Source Documents            • CapEx Schedules
Galea Advisors: Realty Analytics                                                                                                  11

    Staffing Plan
The sample staffing plans outlined below identify the proposed roles and responsibilities for both Galea and the Client!s personnel during an
offsite and onsite service engagement.

Galea will bring a highly seasoned, multi-disciplinary team to this engagement with deep due diligence, lease abstraction and underwriting
experience. The Galea team includes a Project Management Team, Core Engagement Team and Advisory Team. The Project Management
Team will have overall responsibility for managing the Galea team and ensuring delivery of a quality work product. The Core Engagement Team
will be responsible for conducting the analyses and for producing deliverables. Finally, the Advisory Team will provide functional support on an
as-needed basis, as well as, serve as an internal quality control audit system to provide secondary review of the deliverables.

Galea anticipates ongoing involvement from the Client!s personnel throughout the engagement including participation in meetings and review of
deliverables. We would expect an Oversight Manager to be assigned to this engagement as the primary contact for managing the relationship
with Galea and in approving deliverables.
                                                                                  Client
                                  Onsite Staffing Plan                         Commercial Real
                                                                                                                      Offsite Staffing Plan
         Client
                                                                                 Estate Group
    Commercial Real
      Estate Group                       Galea Project
                                                                       Client                    Galea Project
                                       Management Team
                                                                   Oversight Mgr.              Management Team
                                   •      Managing
                                                                                           •      Managing
                                          Consultant(s)          Client HR Personnel
                                                                                                  Consultant(s)
      Galea Core
   Engagement Team                                                               Galea Core
                                                                                                                      Galea Advisory Team
  • Project Consultant                                                        Engagement Team
                                                                             • Project Consultant                       (Quality Control)
  (1 to 10 Project
  Consultants based on                                                       (1 to 10 Project
                                                                                                                  •      Advisor
  Client!s needs)                                                            Consultants based on
                                                                                                                  •      Advisor
                                                                             Client!s needs)
Galea Advisors: Realty Analytics                                                                       12

Galea Credentials

Real Estate Advisory Services
Galea Advisors, Inc. (“Galea”), headquartered in New York City, was formed in 2008 to provide
specialized operational and financial services to underperforming, over-leveraged or otherwise
distressed property owners and investors of related assets. In addition to advising distressed real
estate companies and investors, Galea provides direct or “white label” creditor advisory services and
liquidation-related services.
Galea!s Real Estate Advisory Group is comprised of a dedicated team of consultants who deliver
independent and objective consultation and analysis to owners, investors, lenders, operators and
corporate users of real estate. Building on Galea!s operational and problem-solving team, our
professionals develop and implement detailed real estate strategies that improve operations, unlock
value and minimize risk. We offer comprehensive solutions that address the need for objective and
independent real estate counsel and execution.


Our real estate advisory services include:
           "    CRE Transaction Services
           "    Owner Advisory Services
           "    Interim and Crisis Management Consulting
           "    Strategy and Operations Consulting
Galea Advisors: Realty Analytics                                                                                         13

Summary Professional Biographies
Overview
As indicated in the Staffing Plan, Galea is prepared to dedicate a core team of highly seasoned professionals to provide
underwriting and investment valuation or financial due diligence and lease abstraction services. Following is a summary
professional biographies for these personnel.

Project Management Team
Vernon Beckford, Managing Consultant
Vernon Beckford is a Director at Galea, overseeing day-to-day operations. Most recently, Mr. Beckford worked at investment
firm Sarus Partners, where he was responsible for strategic repositioning of small and middle market companies pursuing
venture capital & private equity funding. Prior to that, he worked at Credit Suisse in the Real Estate Finance Group, engaging
in fixed and floating rate debt issuance. During his tenure, he performed credit analysis, coordinated due diligence & collateral
analysis for investors and assembled and reconciled pool level data tapes related to investor disclosure. In addition, he
prepared and reviewed cash flow underwritings for commercial and multifamily loans in excess of $5 billion. Vernon also
joined Credit Suisse Asia to help establish a Japanese structured finance platform and executed the first major transaction in
that office. Mr. Beckford holds a B.A. in Political Science with a concentration on Economics from Columbia University. He
holds Series 7 & 63 securities licenses and is a member of the NASD.

Eric Andrew, Managing Consultant
Eric Andrew is a Director at Galea, overseeing commercial real estate deal sourcing. Most recently, Mr. Andrew served as a
Director at Enterprise Community Developers, a real estate development firm specializing in urban development and
distressed asset repositioning. Mr. Andrew also managed the company's direct investment vehicle, Enterprise Capital
Partners, and aided in the development and operations of spin-off subsidiary companies offering third-party services in
construction and asset/property management. Prior to Enterprise, Mr. Andrew worked at Goldman Sachs as an Analyst in the
Investment Management Division. He later joined Capital Trust Real Estate Investment Company, a publicly traded REIT,
acting as Analyst and Deal Underwriter. During his tenure at Capital Trust, he analyzed and worked on underwriting teams for
more than $7 billion worth of commercial loans and equity participations. Mr. Andrew earned a B.A. from Columbia University
with a double major in Economics and History, holds a Venture Management Certification from the Harvard Business School
VMP, graduated with distinction from the New York ICSC Real Estate Associate Program and currently holds candidacy for
CCIM designation. He holds Series 7 & 63 securities licenses and is a member of the NASD.
Galea Advisors: Realty Analytics                                                                                         14

Summary Professional Biographies (cont!d)
Galea Core Engagement Team

Joseph A. DeVenuta, Project Consultant
Prior to joining Galea, Mr. Devenuta worked for institutional real estate firms including Babcock & Brown, and Jones Lang
LaSalle where his various experiences included underwriting, acquisition and asset management of more than $4 billion in
commercial real estate investments across the United States, along with consulting on projects relating to management
structure, process improvement and management software selection and implementation. Sample assignments have
included conducting semi-annual internal valuations for a 28,000+ unit apartment portfolio, coordinating valuations and
investor reporting for a broad portfolio of assets (including retail, self storage, development and debt assets), and managing
a $330 million loan portfolio collateralized by real assets in all major property sectors. Mr. DeVenuta holds a B.S. in
Management and Organizational Behavior with a focus in Commercial Real Estate Finance from New York University!s
Stern School of Business.

Mike Zampetti, Project Consultant
Michael Zampetti has eight years of experience in the commercial real estate industry. Michael is currently an independent
advisor to buyers and sellers of commercial real estate and the debt thereon. In this capacity, he provides underwriting,
valuation, pricing, and marketing services to both buyers and sellers. Previously, Michael was a Vice President in the Real
Estate Finance & Securitization (REFS) group at Credit Suisse, where he oversaw the creation and issuance of
approximately $35 billion of commercial mortgage backed securities (CMBS). In this role, Michael was responsible for the
day-to-day management of small teams and processes including, but not limited to, commercial real estate underwriting
analysis, conducting large scale due diligence efforts, and the sales and marketing efforts of loans and bonds. Prior to
joining the REFS group, Michael worked as a consultant in Credit Suisse!s Realty Investment Group, which was charged
with liquidating a $300 million portfolio of performing and non-performing loans and equity positions. Michael graduated cum
laude from the University of Scranton with a finance major and economics minor. He holds Series 7 & 63 securities licenses
and is a member of the NASD.
Galea Advisors: Realty Analytics                                                                                             15

Summary Professional Biographies (cont!d)
Galea Advisory Team

Dan Wolins, Advisor
Daniel Wolins is currently a partner in a New York-based private real estate equity company. Previously, Dan worked as a
Director for Deutsche Bank's Commercial Real Estate Group in London, where he was responsible for managing the team's
collateral risk in the origination and securitization process. His day-to-day activities included pricing new loans, participating
in lending decisions and working closely with origination, structuring and distribution to ensure consistency of lending
criteria and data dissemination in the distribution process. Prior to joining Deutsche Bank in 2006, Dan worked in the Real
Estate Finance and Securitization Group at Credit Suisse for eight years in New York. He was a deal manager for fixed and
floating rate CMBS securitizations and a member of their internal credit committee. Dan graduated from the University of
Vermont with a Bachelor of Science in Business Administration.

Anthony Nazzaro, Advisor
Anthony Nazzaro is currently a principal of Layton Holdings, a commercial real estate investment and advisory firm with
Clients that include, TIAA-Cref, Brookfield Asset Management, and Rhodes Associates. Anthony has over 25 years
experience and his specialties include strategic planning, operational and organizational design, internal controls and
systems planning. Mr. Nazzaro has advised numerous real estate Clients including Homebuilders / Developers, Hospitality
Companies, Investment Managers, Opportunity Funds, Real Estate Investment Trusts (REITS), Real Estate Operating
Companies, and Corporates. His Client projects include designing and implementing asset management, budgeting
forecasting and valuation processes for a large investment manager and implementing a property and portfolio modeling
system to support the new asset management processes. He has also designed and implemented a centralized lease
administration function across office and retail portfolios of two large property management functions and designed a new
lease abstract process and template that was fully integrated with the property management system. Anthony!s Clients
include AMP Henderson, AMB Property Company and Deutsche Bank. Prior to joining the Galea Advisory Team, he
served as a Director at Alvarez & Marsal and also spent ten years in Los Angeles, New York and Sydney in the real estate
group of a Big Four firm where he served as Senior Manager. Anthony earned an M.B.A. from the University of California,
Irvine and a B.S. in Electrical Engineering from New Jersey Institute of Technology.
Galea Advisors: Realty Analytics   16

Appendix


                         Appendix
Galea Advisors: Realty Analytics                                                                                                                                                      17


                                               Representative Sampling of Client Deliverables


Sample Deliverables detailed herein are representative examples only. Pertinent details have been intentionally changed, deleted, or distorted to protect Client privacy and confidentiality.
Galea Advisors: Realty Analytics                                                                                                                                                                                                                   18

      Investor Reporting - Collateral Valuation Summary (Investment “1-Pager”)
                                                                                                    COLLATERAL VALUATION SUMMARY
                      Loan                                                                    Collateral                                                      Sponsor                                                    Relationship ID:         3
                      Loan ID #                       100351                                  Property Name:              Holiday Inn Express                 Borrower:             Any Borrower LLC
                      Pool ID #                       1234A                                   City:                       Anyros                              Guarantor:            John Doe, Jane Doe, & J&J Transportation
                      Portfolio:                      USA                                     State:                      NM                                                          Loan ID#    Pool ID #       UPB          Loan Status   Lien Position
                      Bank Name:                      ABC Lending                             Prop. Sub Type / Yr. Built: Hotel          1999                 Subject Loan:            100351       1234A         2,501,146     Non-Perf.      First/DOT
                                                                                              Property Size (SF):         48,634         80 Keys              Related Loan #1          100354       1234B         1,465,938     Non-Perf.      First/DOT
                      Loan Status:                    Non-Performing                          Proposed Use:               Hotel                               Related Loan #2          113578       6359A         1,085,431     Non-Perf.      First/DOT
                      UPB / Per Key:                  $2,501,146     $31,264                  Project Completion %:       NAV                                 Related Loan #3
                      Lien Position                   First Mortgage/DOT                      Site Inspection Review:     YES                                 Related Loan #4
                      Loan Purpose:                   Purchase/Acquisition                    Asset Summary:              YES                                 Related Loan #5
                      Origination Date:               2/3/2006                                Appraisal Review:           YES                                 Related Loan #6
                      Maturity Date:                  2/1/2031       NAV                      Legal/Environmental Review YES             YES                  Related Loan #7
                      Last Payment Date:              5/4/2009       89 (Days Late)           Original Appraisal Date:    5/20/05                             Related Loan #8
                      Unfunded Commitment:            $0                                      Original Appraisal Value:   $5,000,000     $62,500              Related Loan #9
                                                                                              BPO/Recent Appraisal        $3,570,000     $44,625              Related Loan #10
                                                                                              Galea UW Value / Per Key $2,880,000        $36,000                Total Exposure to Borrower                       $5,052,515
                      Asset Summary
                      Notes:          Lien: The facility is a Non-Performing $2501146.06 First Mortgage/DOT. The purpose of the Loan was for Purchase/Acquisition
                                  Collateral The Property is a Hotel with 80 Keys located in Anyros, NM
                                             The Property is the newest hotel in the MSA.
                                   Location The Property sits at the corner a major north/south arterial roadway and benefits from good visibility, and walking proximity to local amenities and an adjacent golf course.
                                             Primary demand generators include, Eastern New Mexico University, New Mexico Military Institute, and oil and gas employers.
                                    Market 1) The submarket offers roughly 20 competing limited service and extended stay hospitality properties. 2) Occupancy levels in the MSA are flat. 3) ADR levels in the submarket are trending down. 4) RevPAR
                                             is expecting to trend down until 2011.
                               Other Issues 1) The Property condition at the time of site inspection (8/19/09) was noted as excellent. The Property has been well maintained and does not suffer from any deferred maintenance.
                                             2) Competing flags in the operating area include the Hampton Inn, Days, Inn, Fairfield Inn, Candlewood Suites, Best Western, Econolodge and La Quinta Inn.
                      Borrower / Guarantor
                      Notes:                The Borrower is Any Borrower LLC. The Sponsor for the transaction is John Doe, Jane Doe, & J&J Transportation.

                                            1) John and Jane Doe signed full guarantees.
                                            2) J&J transportation signed full guarantees.
                                            3) As of October 2007, the Guarantors joint PFS stated a net worth of $13.02M based on assets of $17.2M, including $390k in cash, and total liabilities of $4.2.
                                            4) The credit rating for John Doe showed a score of 630 as of 11/07 and reflected nine late payments, but all of his accounts were current. The credit score for Jane Doe as of 11/07 was 740 and reflected no
                                            late payments.
                      Legal Summary
                         Mortgage None                   Title Policy Title Policy includes          Note None                  Issue #1: Mechanics Liens                  Issue #2: None                         Issue #3: None
                       Issue (Y/N):                            (Y/N): material exceptions          Issue:                                 filed
                         Issue #4: None                    Issue #5: None                       Issue #6: None                  Issue #7: None                             Issue #8: None                         Issue #9: None

                      Tape Notes: Loan assigned from Silver State Bank to Sec. Savings - All assignment documentation in file; Title Date Down dated 8/21/09

                      Notes:                Recent communication from 6/09 through 7/09 indicate that the Any Lender was negotiating the sale of their loan position to Any Buyer.


                      Environmental Summary
                                     Asbestos (Y/N): NAP                Soil Contamination X                  UST (Y/N): X                  Ground Water X                           Mold (Y/N): NAP           Other (Y/N): NAP
                                                                                     (Y/N):                                                        (Y/N):
                                  Dry Cleaner (Y/N): NAP                 Gas Station (Y/N): X                        Cost to Cure Environmental Issues: 250000

                                        Tape Notes: 1950-91 site occupied by gasoline station. Low levels of BTEX in soil & groundwater. Results questionable because of location of samples. No doc on UST removals.
                      Notes:               The Borrower signed an environmental indemnity agreement. Possible economic risk resulting from sites prior use pattern.
                      Asset Plan
                      Notes:           UW Multiplier @ 2.5x to 3x (2.0x for quick sale), Cap Rates @ 13-14%, ADR @ $65-80/
                                     Galea        Revenue Drivers: ADR @ $75                                 Cap Rates: 14.0%                     Multiplier 2.0x                   Value                                         $36,000 /key
                                 Resolution The anticipated Loan resolution is a DPO in which the borrower refinances the existing lien within 18 months at par.
                      Underwriter:          Galea                           UW Value                  $2,880,000                                    8/30/09           Reviewer 1: Client TBD                    Reviewer 2: Client TBD


Sample Deliverables detailed herein are representative examples only. Pertinent details have been intentionally changed, deleted, or distorted to protect Client privacy and confidentiality.
Galea Advisors: Realty Analytics                                                                                                                                                                                                                                                                                                                               19

                   Investor Reporting - Collateral Summary
                                                                                                ABC FUND, INC - COLLATERAL SUMMARY
                                                                                               1234 ANYWHERE AVENUE - NEW YORK, NY
                                                                                        PROPERTY & BORROWER INFORMATION
 Property Type:                    Multifamily                   Lien Type:                    Mezzanine                                                        Sponsor:                         John Doe
 Property Sub-Type:                Elevator Apartments           Loan Origination Date:        3/6/09                                                           Borrower:                        John Doe Investments LLC
 # of Units:                       84                            ABC Loan Acquisition Date:    3/6/09                                                           Loan Assumable:                  No
 City, State:                      New York NY                   Acquisition/Refinance:        Refinance                                                        Carve Out Guarantor:             John Doe
 Year Built, Renov.:               1985        1996              Lock Box:                     No                                                               Cash Mgmt/Sweep:                 No/No                                                         ABC FUND, INC - COLLATERAL SUMMARY
                                                                                                               LOAN INFORMATION
                                                                                                                                                                                                                                                              1234 ANYWHERE AVENUE - NEW YORK, NY
                                                         Loan                                                                            Issuer
                                                      Balance           Loan/          Appr.         Fitch      Moodys           S&P        NCF    Init. Mat.     Ext. Mat.                                                      Lock.                PROPERTY CASH FLOW PROJECTIONS AT ORIGINATION (000s)
 Note                              Holder              (000s)            Unit        LTV(1)         DSCR           LTV           LTV       Yield        Date          Date            Index(2)   Spread    Amort.(3)              Exp.           Year 1          Year 2        Year 3        Year 4         Maturity          Year 6       Year 7        Year 8       Year 9      Year 10
 Senior Loan                       XYZ Bank             $5,900        $70,238       44.36%            NAV         NAV            NAV     13.7%        4/1/14        4/1/14             Swaps      1.77%   I/O, Fixed             4/1/14         12 Mos          12 Mos        12 Mos        12 Mos            5 Mos          12 Mos       12 Mos        12 Mos       12 Mos       12 Mos
 Mezz. Loan                        ABC Fund              3,950        117,262       74.06%            NAV         NAV            NAV       8.2%       4/1/14        4/1/14             Swaps      3.35%   I/O, Fixed             4/1/14       FYE 12/09       FYE 12/10     FYE 12/11     FYE 12/12      ending 4/14       FYE 12/14    FYE 12/15     FYE 12/16    FYE 12/17    FYE 12/18
                                                                                                                                                                                         Economic Occupancy                                      96.2%           96.2%         96.2%         96.2%            96.2%           96.2%        96.2%         96.2%        96.2%        96.2%
 Total                                                  $9,850                                                                                                                           Base Rent
                                                                                                                                                                                                  2.40%                                         $1,614          $1,663        $1,712        $1,764             $780          $1,871       $1,927        $1,985       $2,045       $2,106
 (1)
       LTV is based on the appraised value of $13.3 MM, pursuant to the appraisal prepared by Leitner Group, Inc. dated December 08, 2008.                                              Other Income                                                  6               6             6             7                3              7            7             7            8            8
 (2)
       The Swaps rate will be locked-in at closing.                                                                                                                                     Vacancy Loss/Collection Loss                                (61)            (63)          (65)          (67)             (69)           (71)         (73)          (75)         (77)         (80)
 (3)
       The Loan is I/O during the first two years and amortizes based on a 30 year schedule thereafter.                                                                                 Total Revenue                                           $1,559          $1,606        $1,654        $1,704             $753          $1,807       $1,862        $1,918       $1,975       $2,034
                                                                                                                                                                                        RE Taxes and Ins.                                          209             216           222           229              101             243          250           257          265          273
                                                                                                             PROPERTY OPERATIONS                                                        Operating Expenses                                         469             483           497           512              226             543          560           577          594          612
                                                                                                                                                                                        Net Operating Income                                      $881            $907          $935          $963             $426          $1,021       $1,052        $1,084       $1,116       $1,150
 Property Statistics                                    Actual              Issuer U/W                                                     No. of                                       CapEx Escrow
                                                                                                                                                                               Avg. In-Place Galea Adj.                                            (37)            (37)          (37)          (37)             (37)            (37)
 (000s)                             Actual 2006           2007 Actual 2008       NCF(1) Per Unit Unit Type                               Units (2)     Avg. SF                          Adjusted NOI (NCF) % Occ.
                                                                                                                                                                                        Rent Market Rent                                          $844            $871          $898          $926             $389            $985
 Physical Occupancy                      97.4%          99.2%       98.8%       98.0%             1 Bedroom                                   22             540            $1,208         $1,341         100%
                                                                                                                                                                               Plus: CapEx Escrow                                        $37         $37            $37          $37            $37            $37           0              0              0             0
 Economic Occupancy                      96.6%          98.4%       97.1%       98.0%             2 Bedroom                                   48             750             1,680           1,865        100%
                                                                                                                                                                               Less: Actual CapEx                                        (37)        (37)           (37)        (37)            (37)           (36)       (36)           (36)           (36)          (36)
 Base Rent                              $1,369          $1,369     $1,522       $1,614 $19,448 3 Bedroom                                      13             940                                          100%
                                                                                                                                                                             2,100 Funding (Deficit) From Reserve
                                                                                                                                                                               Net           2,331                                         $0          $0             $0          $0              $0             $0
 Other Income                                19             20          20          16        188 Total / Average                             83             724            $1,621         $1,799         100%
 Vacancy Loss                               (47)           (21)        (44)        (33)     (393) Rent roll data as of 11/28/08                 0              0               Ending Loan Balance (Mezz. Loan)
                                                                                                                                                                                  $0             -                                    $9,850      $9,850         $9,624      $9,391          $9,153         $9,153
 Total Revenue                          $1,341          $1,368     $1,497       $1,597 $19,243                                                                                 DSCR @ Actual Rate (Mezz. Loan)
                                                                                                                                    HOUSING ASSISTANCE PAYMENTS ("HAP") CONTRACT                                                        1.11x       1.15x          0.92x       0.96x           0.41x          1.39x
 RE Taxes and Ins.                          162            160         196         220      2,656 Term:                                                                        NCF/Loan (Mezz. Loan)
                                                                                                                         Five years term with unlimited five-year extension options                                                     8.6%        8.8%           9.3%         9.9%          10.2%          10.8%
 Operating Expenses                         622            605         606         529      6,373 Payments:              HUD pays owner a portion of tenant's contract rent minus an amount equal to the greater of (i) 30% of
 NOI                                       $557          $604         $695       $848 $10,214                            tenant adjusted income, (ii) 10% of gross income, or Thethe portion of projections were designated the following assumptions: (i) in-place rents according to the rent roll dated November 28, 2008, (ii) a 3.0% economic vacancy, (iii) historical
                                                                                                                                                                                (iii) cash flow welfare assistance based on
 Capital Expenditures                          0              0           0        (37)     (441)                        for housing.                                          revenues grown at 3.0%, (iv) historical operating expenses grown at 3.0%, (v) management fees projected at 4.61% of effective gross revenue, and (vi) $436/Unit capital reserve ($36,610).
 NCF                                       $557          $604         $695        $811    $9,773 Eligibility:            Families with income below 50% of the area median income.
                                                                                                              Rent Adjustments:        Contract rents are reset to market (upward or downward) every 5 years. They may also adjusted
 Appraised Value/Per Unit/Date:                        $13,300       $158,333       11/15/08                                           annually (upward only).
 Galea Value/Per Unit/Date:                            $13,070       $155,597         3/1/09                  Termination Options:     The owner may terminate contract with written notice to the CA and each tenant in according to law                              PROPERTY PERFORMANCE (000s)
                                                                                                                                       and HUD requirements.
 (1)
       Based on XYZ Bank's underwriting.                                                                                                                                                                                                                                                                   Galea UW
 (2)
       The property contains 84 units. The total number of units shown excludes one 3-bedroom unit occupied rent-free by the superintendent.                                             Property Statistics                                                               Actual 2007 Actual 2008              Yr 1
                                                                                                              GENERAL NARRATIVE                                                          Economic Occupancy                                                                     98.4%       97.1%             96.2%
   The Property, known as John Doe Apartments, is a 100% occupied, 77M sf apartment building containing 84 units located at the southwest corner ofEffective Gross and 115th St. in northern
                                                                                                                                                    Anywhere Ave. Revenue                                                                                                      $1,368      $1,497             $1,559
   Manhattan. Built in 1985 for use as project-based Section 8 affordable housing, the Property generates 79% of the its income from HUD Section Operating Expenses Housing Assistance
                                                                                                                                                   8 subsidies under a                                                                                                             764         802               678
   Payments ("HAP") contract through 2010.                                                                                                         NOI                                                                                                                            $604          $695            $881
                                                                                                                                                                                         Actual CapEx                                                                                0             0             (36)
   The Property's East Harlem neighborhood has seen significant revitalization over the past few years. The East Harlem submarket contained 40M Adjusted NOI (NCF)
                                                                                                                                                            households as of 2008, with an average                                                                                $604          $695            $845
   annual household income of $39M compared to $64M for the nation. Due to a housing shortage throughout the submarket, which has a residential vacancy Debt less than 3%, occupancy rates
                                                                                                                                                           Total rate Service                                                                                                      760           760             760
   approach 100% in most properties, with only short-term vacancies. Contractual rents at the Property, which average $1,621 per unit per month, are set to be 20% below market rents in
                                                                                                                                                           Cash Flow After Debt Service                                                                                         ($156)          ($65)            $84
   accordance with the HAP contract. Galea believes the market rents used by HUD may be high. Galea's analysis indicates market rents to be approximately DSCR for 1-bedroom
                                                                                                                                                           Senior $1,340 - Adjusted NOI apartments,                                                                               1.45           1.66           2.02
   $1,870 for 2-bedroom apartments and $2,330 for 3-bedroom apartments based on broker rental listings for comparable apartments in market rate buildings, which meansNOI
                                                                                                                                                           Total DSCR - Adjusted in-place average                                                                                 0.79           0.91           1.11
   rents at the Property are closer to 10% below market. As part of the Section 8 program, the Property benefits from real estate tax savings as well as lower vacancy and collection loss than
                                                                                                                                                           NCF/Loan                                                                                                              6.1%           7.1%           8.6%
   would be expected in a market-rate building. The Property currently pays a PILOT (payment in lieu of taxes) of $183M, which is estimated at $137M below market real estate taxes. The
                                                                                                                                                           Swaps                                                                                                                5.21%          5.21%          5.21%
   Property does not require the capital outlay that would be necessary to convert and maintain the building at market rate levels within an area with suchImplied Going In Cap Rate
                                                                                                                                                            an abundance of new construction. The                                                                               4.62%          5.32%          6.46%
   tax savings combined with lower maintenance costs and the HAP rents, which are close to market rate and on average 80% HUD-paid, makes continuing under the HAP contract more
                                                                                                                                                           Galea Value(1)                                                                                                                                    $13,070
   profitable for the owner than converting the Property to a market-rate building.                                                                        Galea Value LTV                                                                                                                                    75.4%
                                                                                                                                                                                         (1) Value is based on a 10-year DCF with a 6.75% terminal cap rate and a 9.25% discount rate as of 12/31/08.
   Jake Doe, Martin Doe and Jehoshua Doe (20% ownership) are the general partners responsible for management and operations. John Doe (required to maintain 25% ownership), who reports
                                                                                                                                                         Performance Comments
   a net worth of $1.1B and $80MM liquidity as of 6/30/09, will be the recourse carveout guarantor of the loan and has extensive real estate experience through ownership and management of
   over 21 Section 8 developments (9.5M units), more than 25M residential units and over 10MM sf of commercial and industrial space in the New York Metropolitan area. Alexander Doe (55%
   ownership), whose net worth is reportedly in excess of $50MM, has no control over the operation of the property and will never be allowed to have a controlling interest due to his credit history,                                                                         Galea VALUATION (000s)
   including involuntary bankruptcy petitions that were filed against him and numerous properties being foreclosed upon. The Property is managed by XYZ Realty Corp., a Doe-owned company
   which has been involved in the management of Section 8 housing since its inception in 1957. The company currently manages four buildings with a total GA654 units throughout Manhattan and the
                                                                                                                                                         of Value                                                                                               $13,070                                                 GA LTV (Senior Loan)                                       45.1%
                                                                                                                                                         GA Value / Unit                                                                                         157,471                                                GA LTV (Mezz. Loan)                                        75.4%
   Bronx, all of which have been under their management for over 19 years.                                                                               Cap-Rate (1st Year NCF)                                                                                  6.46%


                                                                                                                                                                                         Appraised Value                                                        $13,300                                                 Appraised Value LTV (Senior Loan)                          44.4%
                                                                                                                                                                                         Appraised Value / Unit                                                  160,241                                                Appraised Value LTV (Mezz. Loan)                           74.1%
                                                                                            INVESTMENT STRENGTHS/ RISKS AT ORIGINATION                                                   Going-In Cap Rate                                                        6.25%
 (+)Occupancy: The Property is currently 100% with a waiting list in excess of 250 people and units that are generally rented within one month.       The Galea underwritten value of $13.1MM is based on a 10-year DCF with a 6.75% terminal cap rate on yr. 11 NOI of $1.2MM and a 9.25% discount rate as of 12/31/08.
 (+/-)HAP Contract: The Property generates nearly 80% of its income from government subsidies, which limits the risk of collection loss and tenant payment defaults, but also provides risk in the
 event of a HAP contract default that could cause HUD to stop payment of all subsidies.
                                                                                                                                                                                                                                TAKE-OUT ANALYSIS (000s)
                                                                                                                                                                                         GA Terminal Cap Rate                                                     6.75%                                                                             Senior Loan    Mezz. Loan
                                                                                                                                                                                         Required DSCR                                                             1.25x                                Ending Loan Balance                              $5,443       $9,153
                                                                                                                                                                                         CT Value (Net Sale Proceeds EO Year 6)                                 $15,585                                 Ending LTV                                         34.9%       58.7%
                                                                                                                                                                                                                                                                                                        Breakeven Constant                               15.15%        9.01%


                                                                                                                                                                                                                                                              LOAN ASSESSMENT/CAPITAL TRUST ASSET PLAN
                                                                                                                                                                                          Portfolio Management to perform quarterly review.
                                                                                                                                                                                          Monitor the level of rents in property submarket.


Sample Deliverables detailed herein are representative examples only. Pertinent details have been intentionally changed, deleted, or distorted to protect Client privacy and confidentiality.
Galea Advisors: Realty Analytics                                                                                                                                                                                                                                                                                                                                                                                                                                      20

             Investor Reporting - Underwriting & Asset Management Summary
                                                                                                        ABC FUND, INC - ASSET MANAGEMENT COLLATERAL SUMMARY
                                                                                                                     1234 ANYWHERE AVENUE - NEW YORK, NY

                                                                                                                                                   OPERATING STATEMENTS
    Year                                                                 2008                                             2008/2009                                             Appraisal U/W                                  Galea In Place Cash Flow                         Galea Underwriting
    Period                                                           Full Year                                             Full Year                                                     As of                                              As of                                          As of                          NOTE
    Period Ended                                                     12/31/08                                             2008/2009                                                    11/15/08                                            12/31/08                                       12/31/08

    Statement Type
                                                              Borrower Provided                                            Budget                                                    Appraisal U/W                               Galea In Place Cash Flow                          Galea Underwriting
    Economic Occupancy                                                   97.1%                                                 98.0%                                                    98.0%                                               99.2%                                          94.2%                                                  ABC FUND, INC - ASSET MANAGEMENT COLLATERAL SUMMARY
                                                                             Per Unit       % of GPR                               Per Unit        % of GPR                                 Per Unit        % of GPR                            Per Unit         % of GPR                      Per Unit       % of GPR
                                                                                                                                                                                                                                                                                                                                                                    1234 ANYWHERE AVENUE - NEW YORK, NY
    Gross Potential Rent                               $1,521,537                $18,114      100.0%         $1,614,192                $19,217       100.0%               $1,614,192             $19,217      100.0%          $1,614,192              $19,217      100.0%    $1,614,192            $19,217      100.0%     1
                                                                                                                                                                                                                                                                                                                                                           SUPPLEMENTARY LOAN AND PROPERTY INFORMATION
    Vacancy Loss                                            (17,688)                (211)      (1.2%)           (32,284)                  (384)       (2.0%)                 (32,596)               (388)      (2.0%)                  -                    -         -         (80,710)              (998)      (5.0%)    2
                                                                                                                                                                                                                                                                                                                                                 Reference Date       Balloon Loan       Annual Debt       Calculation
    Leasing Concessions                                         -                       -        -                    -                        -        -                        -                     -         -                   -                      -         -             -               -              -
                                                                                                                                                                                                                                                                                                                   Note                             Balance             Balance            Service          Method         Interest Rate              Floor             Prepayment Premium
    Credit / Collection Loss                                (26,369)                (314)      (1.7%)                 -                        -        -                        -                     -         -               (12,645)                (145)      (0.8%)      (12,645)
                                                                                                                                                                                                                                                                                      Senior Loan(156)           (0.8%)    3
                                                                                                                                                                                                                                                                                                                                                       $5,900,000          $5,442,521         $417,540        Actual/360           1.77%               N/A             N/A
      Net Rental Income                                $1,477,480                $17,589        97.1%        $1,581,908                $18,832         98.0%              $1,581,596             $18,829        98.0%         $1,601,547              $19,289        99.2%           Mezz. Loan
                                                                                                                                                                                                                                                                             $1,520,837      $18,812              94.2%                                 3,950,000           3,710,697          342,816        Actual/360           3.35%               N/A             N/A
                                                                                                                                                                                                                                                                                          Total                                                        $9,850,000          $9,153,218         $760,356                             2.40%
                                                                                            % of EGR                                               % of EGR                                                 % of EGR                                             % of EGR                                     % of EGR

    Laundry Income                                           $2,702                 $32         0.2%               $6,000                 $71          0.4%                  $6,000                 $71         0.4%              $6,000                 $71         0.4%        $6,000           $71
                                                                                                                                                                                                                                                                                     Portfolio Category:          0.4%     4     ABC INVESTMENT FUND                Senior Loan                                                            Mezzanine Loan
    Parking Income                                            9,400                 112         0.6%                9,600                 114          0.6%                   9,600                  114        0.6%                   -                    -         -             - CDO Loan Number: -         -         5     NAV                                Loan Seller:                         XYZ Bank                          Loan Seller:                      Galea Advisors

    Other Income                                              7,555                  90         0.5%                  -                        -        -                       -                      -         -                     -                    -         -             - Originator Loan- Number: -           6
                                                                                                                                                                                                                                                                                                                                 53746                              Loan Term:                           60                                Loan Term:                        60
                                                                                                                                                                                                                                                                                      Originator:                                Mr. Patrick Lendyamoney            Amortization Term:                   360                               Amortization Term:                360
      Total Other Income                                    $19,657                $234          1.3%           $15,600                  $186           1.0%                $15,600                $186          1.0%             $6,000                 $71          0.4%       $6,000
                                                                                                                                                                                                                                                                                      Property ID: $71          0.4%             NAV                                Remaining Loan Term:                 60                                Remaining Loan Term:              60
                                                                                                                                                                                                                                                                                      Property Address:                          1234 Anywhere Avenue               Remaining Amortization Term:         360                               Remaining Amortization Term:      360
                                                                                                                                                                                                                                                                                      Zip Code:                                  10029                              Amortization Type                    I/O (24 mos.), Fixed (36 mos.)    Amortization Type                 I/O (24 mos.), Fixed (36 mos.)
    Effective Gross Revenue                            $1,497,137                $17,823       100.0%        $1,597,508                $19,018        100.0%              $1,597,196             $19,014       100.0%         $1,607,547              $19,455       100.0%   $1,526,837 / PMSA:
                                                                                                                                                                                                                                                                                      MSA
                                                                                                                                                                                                                                                                                                 $18,887     100.0%
                                                                                                                                                                                                                                                                                                                                 New York/NY                        Seasoning:                           0                                 Seasoning:                        0
                                                                                                                                                                                                                                                                                      Ground Lease:                              No                                 Original Interest Only Period:       24                                Original Interest Only Period:    24
    Real Estate Taxes                                   $170,112                  $2,025       11.4%           $183,172                 $2,181        11.5%                $182,667               $2,175       11.4%           $183,172                $2,181       11.4%     $183,172 Date:$2,181
                                                                                                                                                                                                                                                                                      Exp.                   12.0%         7
                                                                                                                                                                                                                                                                                                                                 N/A                                Remaining Interest Only Period:      24                                Remaining Interest Only Period:   24
                                                                                                                                                                                                                                                                                      Security Interest:                         Fee Simple                         Interest Rate Floor:                 N/A                               Interest Rate Floor:              N/A
    Insurance                                                26,171                 312         1.7%               15,000                 179          0.9%                  37,800                 450         2.4%              26,171                 312         1.6%        26,171              312
                                                                                                                                                                                                                                                                                      Collateral Interest:
                                                                                                                                                                                                                                                                                                               1.7%        7
                                                                                                                                                                                                                                                                                                                                 Mezzanine                          Extension Option:                    No                                Extension Option:                 N0
    Utilities                                               186,247                2,217       12.4%            157,000                  1,869         9.8%                 160,650                1,913       10.1%             186,247                2,217       11.6%       186,247
                                                                                                                                                                                                                                                                                      Crossed: 2,217         12.2%         8     No                                 Lock Box Type:                       N/A                               Lock Box Type:                    N/A
                                                                                                                                                                                                                                                                                      Cross Code:                                N/A                                Default Anticipated / Month:         No / N/A                          Default Anticipated / Month:      No / N/A
    Repairs & Maintenance                                    51,904                 618         3.5%               41,500                 494          2.6%                 154,700                1,842        9.7%              51,904                 618         3.2%        51,904              618       3.4%        8
                                                                                                                                                                                                                                                                                      Annex A Occupancy / Date:                  NAV / N/A                          Loss Anticipated / Amt.:             No / $0.00                        Loss Anticipated / Amt.:          No / $0.00
    Janitorial                                                  -                       -        -                    -                        -        -                        -                     -         -                     -                    -         -             - Number of Properties: -
                                                                                                                                                                                                                                                                                                       -                         1                                  Master Servicer:                     NAV
    General & Administrative                                111,271                1,325        7.4%               70,000                 833          4.4%                  25,000                 298         1.6%              70,000                 833         4.4%        70,000
                                                                                                                                                                                                                                                                                      Swap Rate 833            4.6%        8     5.21%                              Special Servicer:                    NAV

    Advertising & Marketing                                                                                                                                                                                                                                                         - Property Insurance Exp. Date:              6/1/10                             Galea UW Team:                       VB, EA, JD
                                                         ABC FUND, -INC - - ASSET MANAGEMENT COLLATERAL- SUMMARY
                                                           -                         -     -   -              -                                                                                                  -                     -                    -         -                                -         -
                                                                                                                                                                                                                                                                                      Liability Insurance Exp. Date:             6/1/10                             Date of Loan Underwriting:           2/15/09
    Professional Fees                                        26,655                 317         1.8%                  -                        -        -                    10,000                  119        0.6%              26,655                 317         1.7%        26,655              317       1.7%
                                                                                                                                                                                                                                                                                      Terrorism Insurance Exp. Date:       8
                                                                                                                                                                                                                                                                                                                                 NAV
    Payroll & Benefits                                      187,995                2,238123412.6%
                                                                                             ANYWHERE AVENUE - NEW YORK, 130,000
                                                                                                    95,000 1,131 5.9%    NY                                                                        1,548        8.1%              95,000                1,131        5.9%        95,000              1,131        6.2%     8

    Other                                                       -                       -        -                    -                        -        -                        -                     -         -                     -                    -         -              -                    -        -       8
                                                                                                            IN PLACE UNIT MIX                                                                                                                                                                                                                                           SOURCE DOCUMENT INVENTORY
    Management Fee                                           41,609                 495         2.8%               47,925                 571          3.0%                  47,916                 570         3.0%              74,108                 882         4.6%       70,387             838     4.6%   9

    Ground Rent                     Rent Roll Date:             -                    -
                                                                                 12/31/08        -                    -                        -        -                       -                      -         -                   -                      -         -             - Document -             -                                                      Source                               Date Received                     Comments
                                                                                                                                                                                                                                                                                      2009 Budget                                                                   Proforma
      Total Operating Expenses                          $801,964                  $9,547        53.6%          $609,597                 $7,257         38.2%
                                                                                                                                                             No. of $748,733     $8,913  46.9%                                 $713,257 Galea$8,491                  44.4%    $709,536         $8,447      46.5%
                                                                                                                                                                                                                                                                                      2008 Operating Statement                                                      Borrower Provided
                                                                                                                                                          Occupied           No. of Avg. In-Place                             Market    Market                                        2007 Operating Statement                                                      Borrower Provided
    Net Operating Income            Unit Type           $695,173                  $8,276       46.4%      Avg. $987,911
                                                                                                               SF     No. of$11,761
                                                                                                                             Units                    61.8%  Units $848,463 Units
                                                                                                                                                                      Vacant    $10,101 53.1%Rent                             Rent (1)
                                                                                                                                                                                                                               $894,290 Rent$10,646
                                                                                                                                                                                                                                             (2)
                                                                                                                                                                                                                                                                    55.6%     $817,3012006 Operating Statement
                                                                                                                                                                                                                                                                                               $9,730     53.5%                                                     Borrower Provided
                                                                                                                                                                                                                                                                                      2005 Operating Statement                                                      NAV
                                    1 Bedroom                                                                540                              22                     22                     -                    $1,208       $1,600        $1,341           #
                                                                                                                                                                                                                                                                                      Rent Roll                                                                     Borrower Provided                                                      12/31/08
    Capital Expenditure / Reserve                                   $0                  -        -                        $0                   -        -                   $16,800                 200         1.1%             $36,610                 436         2.3%      $21,000             250     1.4%   10
                                    2 Bedroom                                                                750                              48                     48                     -                        1,680     2,100         1,865           #                        Issuer's Asset Summary                                                        XYZ Bank
      Total Capital Expenditures3 Bedroom (3)                       $0            $ -            0.0%                     $0            $ 13
                                                                                                                                          -             0.0%                $16,800                $200          1.1%            $36,610 2,331 $436                   2.3%     $21,000Appraisal $250
                                                                                                                                                                                                                                                                                                 Report     1.4%                                                    ABC Appraisal Firm                                                     12/8/08
                                                                                                             940                                                     13                     -                      2,100       2,500
                                                                                                                                                                                                                                                                                      Engineering Report                                                            ABC Engineering Firm
                                                                                                                                                                 -                          -                                                                                         Environmental Report                                                          EMG
    Net Cash Flow                                       $695,173                  $8,276        46.4%          $987,911                $11,761         61.8%
                                                                                                                                                                 -         $831,663               $9,901        52.1%          $857,680               $11,604        53.4%    $796,301         $9,850
                                                                                                                                                                                                                                                                                      Real Estate Tax Bills52.2%                                                    Borrower Provided
                                          Total / Average                                                    724                              83                     83                     -                    $1,621       $2,030        $1,799                                    Insurance Bills                                                               Borrower Provided
                                                                                                                                                                                                                                                                                      Leases                                                                        Borrower Provided
    NCF Yield on Debt                                          7.1%                                                 10.0%                                                       8.4%                                                8.7%                                          8.1%Non-recourse Guarantor Financial Statements                                   Borrower Provided
                                                                                                                               No. of Units          Physical Occ. Economic Occ.                                       Rent                                                    See Following Page Info
                                                                                                                                                                                                                                                                                      Sponsors For Notes and Comments                                               Borrower Provided
                                                       Occupied                                                                               83               100.0%                  100.8%               $1,614,192
                                                                                                                                                                                                                                                                                         Additional Source Documents
                                           Vacant/Collection Loss                                                                         -                     0.0%                      0.8%                  $12,645                                                                  2009 Proforma                                                              Borrower Provided
                                                              Total                                                                           83               100.0%                  100.0%               $1,601,547


                     NOTES

                     1. Market Rent based on market rates reported in Appraisal Report.
                     2. Galea Market Rent based on based on current broker listings for units in similar properties within the submarket.
                     3. The property contains 84 units. The total number of units shown excludes one 3-bedroom unit occupied rent-free by the superintendent.


Sample Deliverables detailed herein are representative examples only. Pertinent details have been intentionally changed, deleted, or distorted to protect Client privacy and confidentiality.
Galea Advisors: Realty Analytics                                                                                                                                                                                                                                                                                           21

              Investor Reporting - Collateral Valuation Summary
                                                      1234 ANYWHERE AVENUE - NEW YORK, NY
                                                            11-YEAR CASH FLOW AND OCCUPANCY ANALYSIS

                                         Year 1         Year 2        Year 3         Year 4             Year 5      Year 6       Year 7           Year 8              Year 9           Year 10         Year 11
 For the Years Ending                 Dec-2009       Dec-2010      Dec-2011       Dec-2012          Dec-2013     Dec-2014     Dec-2015         Dec-2016          Dec-2017          Dec-2018           Dec-2019


 Gross Potential Rent                 1,614,192     1,662,618     1,712,496      1,763,871          1,816,787    1,871,291    1,927,430       1,985,253         2,044,810         2,106,154          2,169,339
 Vacancy Loss                           (48,426)      (49,879)      (51,375)       (52,916)           (54,504)     (56,139)     (57,823)        (59,558)          (61,344)            (63,185)         (65,080)
 Leasing Concessions                          -             -             -               -                  -           -            -                 -                   -                  -               -
 Credit / Collection Loss               (12,645)      (13,025)      (13,416)       (13,818)           (14,233)     (14,660)     (15,099)        (15,552)          (16,019)            (16,499)         (16,994)


 NET RENTAL INCOME                    1,553,121     1,599,714     1,647,706      1,697,137          1,748,051    1,800,493    1,854,507       1,910,143         1,967,447         2,026,470          2,087,264


 Laundry Income                         $6,000         $6,180        $6,365         $6,556            $6,753       $6,956       $7,164          $7,379               $7,601            $7,829          $8,063
 Parking Income                               -             -             -               -                  -           -            -                 -                   -                  -               -
 Other Income                                 -             -             -               -                  -           -            -                 -                   -                  -               -


 TOTAL OTHER INCOME                      6,000          6,180         6,365          6,556              6,753       6,956        7,164            7,379
                                                                                                                                                                1234 ANYWHERE AVENUE - NEW YORK, NY
                                                                                                                                                                  7,601  7,829  8,063
                                                                                                                                                                                           PROPERTY VALUATION
 EFFECTIVE GROSS REVENUE              1,559,121     1,605,894     1,654,071      1,703,693          1,754,804    1,807,448    1,861,672       1,917,522         1,975,048         2,034,299          2,095,328


 Real Estate Taxes                     183,172        188,667       194,327        200,157           206,162      212,347      218,717         225,278
                                                                                                                                              Year 1             232,037
                                                                                                                                                                 Year 2               238,998
                                                                                                                                                                                      Year 3          246,168
                                                                                                                                                                                                       Year 4           Year 5                Year 6         Year 7           Year 8               Year 9           Year 10        Year 11
 Insurance                              26,171         26,956        27,765         28,598            29,456       30,339       31,250          32,187               33,153            34,147          35,172
                                                                               Fiscal Years Ending December                                    2009                2010                2011             2012             2013                  2014           2015             2016                  2017             2018           2019
 Utilities                             186,247        191,834       197,589        203,517           209,623      215,911      222,389         229,060            235,932             243,010         250,300
 Repairs & Maintenance                  70,635         72,754        74,937         77,185            79,500       81,885       84,342          86,872               89,478            92,163          94,928
 Janitorial                                   -             -             -    Net Operating Income
                                                                                         -                   -           -            -        $881 -              $907 -              $935 -           $963-            $992             $1,021            $1,052           $1,084                $1,116           $1,150         $1,184
 General & Administrative               25,000         25,750        26,523    Net Cash Flow
                                                                                    27,318            28,138       28,982       29,851           845
                                                                                                                                                 30,747             871
                                                                                                                                                                   31,669               899
                                                                                                                                                                                       32,619            927
                                                                                                                                                                                                       33,598                955                985          1,016            1,047                 1,080             1,113
 Advertising & Marketing                      -             0             -               -                  -           -            Valuation Term: -
                                                                                                                                      -                        10 Years -                      -               -
 Professional Fees                      10,000         10,300        10,609         10,927            11,255       11,593       11,941          12,299               12,668            13,048          13,439
                                                                                                                                           2019 NOI:             $1,184
 Payroll & Benefits                    105,000        108,150       111,395        114,736           118,178      121,724      125,375         129,137            133,011             137,001         141,111
                                                                                                                                   Terminal Cap Rate:             6.75%
 Other                                        -             -             -               -                  -           -            -                 -                   -                  -               -
 Management Fee                         71,875         74,032        76,253         78,540            80,896       83,323            Residual Value:
                                                                                                                                85,823         88,398           $17,541
                                                                                                                                                                   91,050              93,781          96,595
 Ground Rent                                  -             -             -               -                  -           -      Cost of Sale @ 3.0%: -
                                                                                                                                     -                               (526) -                   -               -
                                                                                                                                 Net Residual Value:            $17,015
 TOTAL OPERATING EXPENSES              678,100        698,443       719,397        740,979           763,208      786,104      809,687         833,978            858,997             884,767         911,310
                                                                               Net Cash Flow                                                   $845                $871                $899             $927             $955                  $985         $1,016           $1,047                $1,080           $1,113
                                                                               Residual Value                                                      0                    0                  0                  0                0                  0                 0                0                    0         17,015
 NET OPERATING INCOME                  881,020        907,451       934,674        962,715           991,596     1,021,344    1,051,984       1,083,544         1,116,050         1,149,532          1,184,018
                                                                               Total Flow to Investor                                          $845                $871                $899             $927             $955                  $985         $1,016           $1,047                $1,080          $18,128
  Replacement Reserves                  36,174     36174.16667   36174.16667        36,174            36,174       36,174       36,174          36,174               36,174            36,174          36,174
                                                                               Discount Rate:                                     9.25%                                                                                                                          PORTFOLIO PRESENT VALUE MATRIX
 TOTAL CAPITAL EXPENDITURE              36,174         36,174        36,174    Total 36,174Units:
                                                                                     No of            36,174       36,174       36,174
                                                                                                                                    83          36,174               36,174            36,174          36,174                                                                            Capitalization Rate
                                                                                                                                                                                                                                   Discount     Rate
                                                                                                                                                                                                                                                         6.25%            6.50%                6.75%             7.00%          7.25%
 CASH FLOW BEFORE DEBT SERVICE         844,846        871,277       898,500        926,541           955,422      985,170     1,015,810       1,047,370         1,079,876         1,113,358          1,147,843
                                                                                                                                                                                                                                       8.75%           $ 14,130         $ 13,824              $ 13,541         $ 13,279       $ 13,034
 Current Physical Occ. as of 4/08:      100.0%                                                                                                                                                                                                         ($170,237)       ($166,557)           ($163,149)        ($159,985)     ($157,038)
                                                                               Present Value Summary                             Gross $                    $Per Unit             %                                                    9.00%           $ 13,878         $ 13,579              $ 13,303         $ 13,046       $ 12,807
 Total No. of Units                         84             84            84            84
                                                                               PV Residual                  84         84           84
                                                                                                                                  $7,024               84   $84,632      84     53.7%      84                 84                                       ($167,205)       ($163,608)           ($160,278)        ($157,185)     ($154,306)
 Total No. of Rented Units                  83             83            83             83                  83         83           83                 83                83                83                 83
                                                                               PV Income Stream                                   6,046                     $72,840             46.3%                                                  9.25%           $ 13,632         $ 13,340              $ 13,070         $ 12,819       $ 12,586
 Average Occupied Units Per Year            81             81            81             81                  81         81           81               81             81                     81                 81
 Underwritten Physical Occupancy         97.0%          97.0%         97.0%    Present Value of Property
                                                                                    97.0%           97.0%           97.0%        $13,070
                                                                                                                                 97.0%            97.0% $157,471 97.0%          100.0%97.0%             97.0%                                          ($164,242)       ($160,726)           ($157,471)        ($154,449)     ($151,635)
 Less Collection Loss                     -0.8%          -0.8%         -0.8%          -0.8%             -0.8%        -0.8%        -0.8%           -0.8%               -0.8%              -0.8%              -0.8%                      9.50%           $ 13,392         $ 13,107              $ 12,842         $ 12,597       $ 12,369
 Underwritten Economic Occupancy         96.2%          96.2%         96.2%          96.2%              96.2%       96.2%        96.2%            96.2%               96.2%              96.2%          96.2%                                          ($161,346)       ($157,910)           ($154,728)        ($151,774)     ($149,024)
                                                                                                                                                                                                                                       9.75%           $ 13,157         $ 12,878              $ 12,620         $ 12,380       $ 12,157
 NET OPERATING INCOME                     $881           $907          $935           $963              $992       $1,021       $1,052          $1,084               $1,116            $1,150          $1,184
 TOTAL CAPITAL COSTS                        36             36            36             36                  36         36           36                 36                36                36                 36                                       ($158,516)       ($155,157)           ($152,047)        ($149,160)     ($146,471)
 CF BEFORE DEBT SERVICE                   $845           $871          $899           $927              $955         $985       $1,016          $1,047               $1,080            $1,113          $1,148


                                                                                                                                                                                   PRESENT VALUE MATRIX
                                                                                               Discount Rate                                                Terminal Cap Rate ($000's)                                                                        Terminal Cap Rate ($/per unit)
                                                                                                                                   6.25%                     6.50%           6.75%                 7.00%            7.25%              6.25%             6.50%           6.75%             7.00%                 7.25%
                                                                                                    8.75%                         14,130                    13,824              13,541             13,279           13,034            $170,237         $166,557         $163,149              $159,985         $157,038
                                                                                                    9.00%                         13,878                    13,579              13,303             13,046           12,807            $167,205         $163,608         $160,278              $157,185         $154,306
                                                                                                    9.25%                         13,632                    13,340              13,070             12,819           12,586            $164,242         $160,726         $157,471              $154,449         $151,635
                                                                                                    9.50%                         13,392                    13,107              12,842             12,597           12,369            $161,346         $157,910         $154,728              $151,774         $149,024
                                                                                                    9.75%                         13,157                    12,878              12,620             12,380           12,157            $158,516         $155,157         $152,047              $149,160         $146,471


Sample Deliverables detailed herein are representative examples only. Pertinent details have been intentionally changed, deleted, or distorted to protect Client privacy and confidentiality.
Galea Advisors: Realty Analytics                                                                                                                                                      22

      Investor Reporting - Due Diligence and Third Party Report Summary


Sample Deliverables detailed herein are representative examples only. Pertinent details have been intentionally changed, deleted, or distorted to protect Client privacy and confidentiality.
Galea Advisors: Realty Analytics                                                                                                                                                                                                                                                                           23

      Investor Reporting – Loan Summary Report
 SUMMARY OF LOAN TERMS, PURPOSE AND CURRENT STATUS
 The subject loan was originated on 2/3/2006 for the acquisition of an 80-key Holiday Inn Express (the, "Property") hotel in Anyros, NM. The loan balance at
 origination was $2,630,101, and the current outstanding balance is $2,514,854. The collateral for the loan consists of first lien on the Property.

 The loan term is for 25 years (2/1/2031) and the interest rate is fixed for the first five years at 8.647% then converts to an adjustable rate using the "the Secure
 Connect Rate for 4-5 year maturities in the Bullet Rates table published by the FHLB of Dallas" plus a 3.5% margin. During the first five years of the loan, a
 prepayment penalty of 5% is assessed on any prepayment which exceeds 20% of the outstanding loan balance. Based on the most recent payment history
 information provided, the last payment date was 5/4/2009.
                                                                                                            ASSET SUMMARY TEMPLATE                                                                                                                            Page 2
 Most recent entries in communications log as of 8/19/2009 (entries for 06/09 thru 07/10/2009) indicate that Any Lender was negotiating the sale of its position in
                            Client       Any Investment Bank
 the asset to Any Investor. Lender       ABC Lending
                            Servicer             XYZ Asset Management


 COLLATERAL DESCRIPTION & MARKET SUMMARY
 1234 Any Street                    The
                                 # DPD     subject loan is a first Pmt Due Date Property.
                                                Original Date  Nxt lien on the Current Maturity             Accrued Interest      Fixed or Adjust.    Interest Rate            Margin               Index        Nxt Interest Adj Dt   Original Term           PPP (Y/N)
                                                                                               Date                                    Rate                                                                                              (Months)
                                  The Property is a three story, 80-key limited service hotel located in Adjustable NM. The building was built in 1999 and has a stucco
                                                2/3/2006       6/1/2009        2/1/2031        $14,228.02         Anyros, 8.647%        3.50%           501         2/3/2011                                                                300                    Y

                                  exterior over a steel frame with a pitched asphalt shingle roof. It contains 48,637 sf on a 1.9 acre site. Amenities include an
                                  indoor pool, fitness room, and breakfast dining area. There is a 360 square foot meeting space asSUMMARY TEMPLATE
                            Loan Data (continued)                         7/31/09
                                                                                                                                ASSET well as vending areas within                                                                                                                                      Page 1
                                  the facility. MR NCF                       Pool/Performance: 1234 / Non-Performing
                                                 According to the site inspection DSCR
                              MR NOI Date                   MR NCF Date     Current performed on Aug. 18, 2009 by RER Solutions, Inc, the Property was in excellent
                                                                                    Relationship: Any Borrower LLC
                                  condition with no deferred maintenance noted. The subject is located on the northwest corner of Main and Any Street. Main is a
                                                                                           Loan # 100351
                                  major north-south arterial roadway connecting with downtown Anyros approximately 1.5 miles to the south. The subject enjoys
                            NAV                           NAV
                                  good visibility and exposure from its corner location and is within walking distance to local amenities and adjacent golf course.
                                                                                         Loan Data                                                                    As of 7/31/09             CURRENT PORTFOLIO DATA (From File Document Diligence)
                            Loan Data greater Anyros, New Mexico area offers approximately 20 hotels and motel properties offering Prin Balance of Unfunded Amt Dataand Owned
                                  The                               8/14/2009Loan #           Borrower           Bank Code     Curr a variety
                                                                                                DATA REFERENCED IN UNDERWRITING (From Original
                                                                                                                                                                   Part %
                                                                                                                                                   limited service Tape)                                                                Purch / Sold        Part Balance Sold     Loan Type             Loan Purpose

                                    extended Original Date Nxt Pmt Due Date to available market resources, current economic trends
                                 # DPD       stay amenities. According Current Maturity Accrued Interest LLC or Adjust.
                                                                                   100351     Any Borrower Fixed        Interest Rate
                                                                                                                            1234                                         will $2,514,853.67 result$0.00
                                                                                                                                                                              continue to
                                                                                                                                                                                Margin          Index decline Next Interest
                                                                                                                                                                                                   in         in100.00%
                                                                                                                                                                                                                 RevPAR throughOwned at which time marketEstate
                                                                                                                                                                                                                            Wholly 2011,
                                                                                                                                                                                                                            Original Term PPP (Y/N)
                                                                                                                                                                                                                                            NAP      Real sources anticipate that the hotel market will bott
                                                                                                                                                                                                                                                                    Purchase/Acquisition
                                                                                 Date                           Rate                                                                                             Adjustment Date         (Months)

                                    Based on the most recent3/1/2009
                                               2/3/2006
                                                             appraisal dated 5/20/2005, $14,228.02
                                                                                         the property was valued at $5,000,000.00.
                                                                                                       Adjustable     8.647%                                                    3.50%                                 2/3/2011              300                    Y
                                                                                         Loan Data (continued)                                                        As of 7/31/09
                                                                                                   Loan #                  Borrower                     I/O Term            Curr Total Monthly Next P&I Adj. Date Sub. Debt Amount     Balloon Amount       SBA Gty. Gty. %     FSA Gty. Gty. %           MR NOI
                                                                                                                                                                                 Payment
                    Loan Data (continued)                                                8/14/2009
 BORROWER & GUARANTOR SUMMARY
                              MR NOI Date            MR NCF           MR NCF Date          Current100351
                                                                                                   DSCR          Any Borrower LLC                         NAV                     NAV               3/1/2011        $1,229,908.00                   $0.00         NAP                NAP                   $0.00
 The Borrower is Any Borrower LLC. The sponsors, John Doe and Jane Doe, signed a full guaranty as additional collateral for the loan. Additionally, J&J
 Transportation signed full guaranties. The Borrower also signed an environmental indemnity agreement.
                                                                                         Loan Data                                                                    As of 8/14/2009           DATA REFERENCED IN UNDERWRITING (From Original Data Tape)
                                                                                                   Loan #                  Borrower                    Bank Code            Curr Prin Balance    Unfunded Amt       Part % Owned        Purch / Sold        Part Balance Sold     Loan Type             Loan Purpose

                            Collateral Data                                              7/31/09                                (Collateral Pledged Under Loan - From File Document Diligence)
                                 # Units         Original Appraised Original Appraisal      Gross MR                                                                                                                                                                            10 - Commerical
                                                                                                 100351 Net MR Appr Value LLC
                                                                                                             Any Borrower Original LTV                Current LTV
                                                                                                                                                         1234               MR Appr Date
                                                                                                                                                                             $2,528,927.40       Lien Position
                                                                                                                                                                                                      $0.00       Senior Lien Amt
                                                                                                                                                                                                                      100.00%          Occupancy %
                                                                                                                                                                                                                                            P               Occupancy Date
                                                                                                                                                                                                                                                                 $0.00                            3 - ACQUISITION OF HOTEL
                                                       Value              Date            Appraised Value                                                                                                                                                                          real estate


                                            80    $5,000,000.00        12/20/2005        Loan Data (continued)           NAV                                                     NAV
                                                                                                                                                                      As of 8/14/2009                 1                $0.00               NAV                    NAV
                                                                                                   Loan #                  Borrower                     I/O Term            Curr Total Monthly Next P&I Adj. Date Sub. Debt Amount     Balloon Amount       SBA Gty. Gty. %     FSA Gty. Gty. %           MR NOI
                                                                                                                                                                                 Payment

                                                                                                   100351        Any Borrower LLC                                              $21,646.81           3/1/2009


                                                                                         Collateral Data                                                              As of 7/31/09             (Collateral Pledged Under Loan - From File Document Diligence)
                                                                                                   Loan #                Type of Project                Collateral              Collateral          Collateral   Collateral Zip Code   Year Built / Year          Cross             Cross                  Sq. Ft.
                                                                                                                                                        Address                   City               State                               Renovated            Collateralized        Default

                                                                                                   100351                      Lodging               1234 Any Street             Anyros                NM               88201            1999 / NAV                 N                 N                    48,637


Sample Deliverables detailed herein are representative examples only. Pertinent details have been intentionally changed, deleted, or distorted to protect Client privacy and confidentiality.
24


         www.galeaadvisors.com
© Copyright 2009 Galea Advisors, Inc. All rights reserved.

Galea Advisors Client Service Presentation

  • 1.
    Galea Advisors: RealtyAnalytics VALUE CREATION. PERFORMANCE ENHACEMENT. REAL ESTATE SOLUTIONS Commercial Real Estate Client Services Underwriting & Investment Valuation, And Due Diligence Services for Commercial Real Estate Transactions December 1, 2009 © Copyright 2009 Galea Advisors, Inc. All rights reserved.
  • 2.
    Galea Advisors: RealtyAnalytics 2 Galea Advisors, Inc (“Galea”) is pleased to present this presentation outlining the commercial real estate outsourcing and support services we offer in underwriting & investment valuation, and due diligence services. To date, we have completed comparable services on engagements for lenders, advisory firms, and investment funds of various size and scope including, most recently, an FDIC structured transaction encompassing over seven hundred loans collateralized by assets located in fourteen states. This presentation outlines our project approach, typical work plan, staffing plan, firm credentials and professional biographies. We believe that Galea represents the best alternative for performing this work due to our: • Composition as a "white-label" resource that bolsters internal resources discreetly without altering or disrupting the Client!s corporate culture; • Highly experienced staff, all of whom have bulge bracket financial firm backgrounds, deep real estate financial and analytical skill-sets, and/or principal-level commercial real estate development and investment experience; • Expertise in each of the major property types (office, retail, hospitality and multifamily); • Service-oriented firm that focuses on providing services uniquely tailored to meet the specific needs of each individual Client, respectively. • Capacity to provide assistance on short notice with varying time commitments and with limited potential for Client conflicts; • Competitive hourly, weekly, or project/asset-based fee structures. Galea!s professionals have prior experience completing due diligence/underwriting services on billions of dollars of real estate assets and transactions for commercial real estate groups at the following companies: Deloitte & Touche, Credit Suisse, Capital Trust, Ernst & Young, Babcock & Brown, Jones Lang LaSalle and Alvarez & Marsal. Galea is dedicated to providing each Client with in-depth real estate expertise in a highly efficient and cost effective manner. We would be pleased to meet with you and review our service offerings in person or discuss other avenues for servicing your commercial real estate needs. Please call either Eric Andrew at (646) 662-3509 or Vernon Beckford at (914) 582-0450 if Galea can be of assistance.
  • 3.
    Galea Advisors: RealtyAnalytics 3 Proposal Contents Page ! Project Approach and Work Plan 6 4 ! Staffing Plan 13 11 ! Summary Professional Biographies 13 15 ! Appendix 16 18 Privileged and Confidential
  • 4.
    Galea Advisors: RealtyAnalytics 4 Project Approach and Work Plan Project Approach Galea!s approach to completing the underwriting & investment valuation, due diligence and lease abstraction procedures is geared towards meeting your critical objectives in a timely and cost efficient manner. Our approach integrates: •Standardized Procedures and Work Program – At the outset, we will agree upon a base set of procedures to be undertaken that will be modified, as required, dependent on the specific deal. A formal work program will be established for each deal against which our progress will be tracked. •Experienced Personnel – We will dedicate an experienced project team with the required skills to perform all of the required procedures. •Formal Weekly Status Updates – We will provide you with a formal status report each week that outlines our progress against plan, hours incurred versus budget, and resolution status of any issues encountered. •Ongoing Communication – We will provide you with continuous communications of any problems that we encounter with respect to completing our work (e.g., difficulty obtaining data) or significant property- specific issues that we identify as part of our work. Following is our detailed work plan for completing the due diligence procedures.
  • 5.
    Galea Advisors: RealtyAnalytics 5 Project Approach and Work Plan Underwriting & Investment Valuation Project Approach And Work Plan
  • 6.
    Galea Advisors: RealtyAnalytics 6 Project Approach and Work Plan (cont!d) Underwriting & Investment Valuation Work Plan Objectives Revenue Property and and Market Property Other Sponsor Expense Analysis Valuation Activities Assessment Analysis The objectives for each activity include: • Property, Loan and Sponsor Assessment – Provide detailed summary of property historical operations and sponsor/borrower for direct analysis and risk mitigation. • Revenue and Expense Analysis – Compare reported in-place operating statement with available budget and normalize to reflect existing market conditions and asset type benchmarks. • Market Analysis – Research and summarize property MSA, including primary demand generators, major employers and corporate presence, population and demographic composition, and available asset-type performance indicators (rents/sf, occupancy rate, competitive set). • Property Valuation – Create performance and valuation matrix showing vital operating metrics including, income-capped valuation and LTV, appraised valuation and LTV, compare implied going-in, in-place, and terminal cap rate. Detail debt yield (NCF/loan), DSCR (NOI/Loan). • Other Activities – Detail investment strengths, risks, and mitigating factors at origination. Create suggested asset management and monitoring plan. Provide state, regional and street mapping of property location. Review applicable third-party (sponsor financials, appraisal, engineering, environmental, seismic, STR) reports.
  • 7.
    Galea Advisors: RealtyAnalytics 7 Project Approach and Work Plan (cont!d) Work Plan Activities Revenue Property, Loan Activity and Market Property Other and Sponsor Expense Analysis Valuation Activities Assessment Analysis Work • Summarize Property, Loan and • Summarize and review historical • Summarize property location • Prepare valuation matrix • Highlights: Summarize asset Sponsor information: property operating statements and/or MSA, demand generators, detailing the following metrics: strengths, weaknesses, and Steps type & sub-type, city, state, year property tax returns employment and transportation • Operations: NCF DSCR, NOI mitigating factors, or go forward built, year purchased, lien type, • Review real estate taxes and centers DSCR issues to monitor lien amount, loan status, insurance policies for actual • Research and summarize local • Investment: Debt yield, ROI, • Proximity Mapping: Provide local, origination date, sponsor name, amounts and potential changes demographics (income, age, COC, total return state, and regional map of borrower name, guarantor info, • Summarize and review existing ethnicity) • Going-in Valuation: Appraised & property location loan assumption status, loan operating budget • Research and summarize LTV • Review Third Party Reports and cash management/sweep/lock • Create in-place reported asset type/class market • In-place Valuation: Income- detail reporting firm/inspector, box provisions, going-in and operating statement conditions (rate/sf, market size, capped, replacement cost, unit- contact info, report date, and the current loan (A, B, mezz) • Create in-place risk-adjusted occupancy rates) cost derived, max debt-load. following vital factors: balances, LTV’s and maturity operating statement • Research property competitive Year 1 cap rate • Appraisal Review: direct cap-rate, dates, amortization type, lock- • Create stabilized best and worst set (sales/leasing) • Terminal Valuation: Stabilized reported vac, reported rent/unit, out expiration case operating statement capped NOI, cap-rate sensitivity sub-market rents, NOI, and value valuation • Engineering Review: condition, est. reserves/annum, est repairs. • Environmental:phase type, action recommended, est. cost to cure, cost/unit • Sponsor and guarantor financial • Property Tax Returns and bank • City and state websites • Operating Statements • Third Party Reports statements statements • Census reports • Underwritten year 1 Reports & • Sponsor Credit Report & Bank • Rent Roll and Leases • Market research via agents, • Client Analytical models Data References • Reported Operating Statements internet, brokers, cold calls, Utilized • Borrower entity docs • Insurance and Tax Bills listings, property visits. • Originating Loan docs • Research reports • Other Market data and • Appraisal • Other Source Documents available, applicable research • Management & Franchise reports (suggested: costar, Agreements reis, Claris, ESRI, MRIS, STR)
  • 8.
    Galea Advisors: RealtyAnalytics 8 Project Approach and Work Plan Due Diligence and Lease Abstraction Project Approach And Work Plan
  • 9.
    Galea Advisors: RealtyAnalytics 9 Project Approach and Work Plan (cont!d) Work Plan Objectives Lease Revenue Disbursements Financial Other Abstraction Analysis Analysis Analysis Activities The objectives for each activity include: • Lease Abstraction – Provide detailed lease information for direct analysis and comparison to the Seller!s reports. • Revenue Analysis – Ensure that the tenant base rent and other income items are billed and collected accordingly, as stated in the tenant's lease agreement, and the confirm that first year base rents for each tenant are accurate. • Disbursements Analysis – Verify the general reasonableness of property operating expenses by identifying unusual and / or major fluctuations in operating expense accounts, identifying any deferred operating maintenance items and verifying contractual payments to the service vendors. • Financial Analysis – Highlight, on a comparative basis, the historical trends of the operating accounts and provides an analytical review for the variance in account balances. The analysis also provides information for evaluation of the accounting records and identifies potential misstatements that may exist. • Other Activities – Provide miscellaneous additional information on the property as disclosed during the financial due diligence review process. Includes reviewing information that may provide detail supporting unusual property activities.
  • 10.
    Galea Advisors: RealtyAnalytics 10 Project Approach and Work Plan (cont!d) Work Plan Activities Activity Lease Revenue Disbursement Financial Other Abstraction Analysis Analysis Analysis Activities Work • Read Signed Leases for Each • Confirm Rent Receipts Against • Note Unusual Expense Items • Prepare Comparative Statement • Review Financial Reports and Tenant Source Docs • Confirm Payments and Coding of Operations Balance Sheet and Note Unusual Steps • Identify Early Termination • Confirm Rent Receipts Against for Significant Items • Compare to General Ledger and Observations Rights, Right of First Refusal, General Ledger • Confirm Payments and Coding Note Variances • Verify Each Tenant Security Expansion Options and / or • Compare Tenant Receipts to for Service Contracts • Review Accounts Receivable Deposit to the Lease Abstract Renewal Options Lease Abstracts • Confirm Proper Allocations of Aging Report and Note • Document the Asset • Enter information into Client • Compare Base Rent and Other Shared Expenses Historical Write-Offs Management Cycles Under the Data Input Template per Data Income to Rent Roll • Confirm Tax Payments and • Review Sponsor’s Explanations Current Property Management Entry Procedures and • Confirm Miscellaneous / Other Increases of Variances and Verify Company Definitions Income • Confirm Real Estate Tax Accuracy • Obtain Current Owner’s • Extract Appropriate Information • Compare Abstracts to Base Year Appeals and SALT Incentives Insurance Documentation for Due Diligence Procedures Projections • Confirm Budgeted CapEX, TI • Obtain Current Property • Confirm Recoverable and Leasing Commissions Management Agreement and Calculations, Billings and • Note Unfunded Tenant Mgmt. Fee Calculations Receipts Improvement Allowances • Obtain Other Financial Docs (Job • Compare Reconciliation Billings • Note Deferred Maintenance Costing, Notes Receivable) to Underwriting Model • Extrapolate Full Year Property • Obtain Information Related to Operating Expenses and “Captive Subsidiaries” that Compare to Underwriting Provide Services to the Property • Signed Tenant Leases • General Ledgers • General Ledgers • General Ledgers • Seller’s Monthly Reports to • Lease Abstract Template • Rent Roll / Lease Abstracts • Statement of Operations • Balance Sheets Owner Reports & • Commercial Lease Data Input • Projections • Seller’s Current Year Budget • Operating Statements • Detailed Tenant Security Deposit Data Form • Billing Statements / Expense • Final Base Year Model • Accounts Receivable Aging Report Utilized Reconciliation True-ups • Check Registers / Vendor Report • Other Seller’s Reports and • Cash Receipts / Tenant Payment History • Variance Analysis Reports for Correspondence Files Receivables Ledger • List of Service Contracts Prior Periods • Other Source Documents • CapEx Schedules
  • 11.
    Galea Advisors: RealtyAnalytics 11 Staffing Plan The sample staffing plans outlined below identify the proposed roles and responsibilities for both Galea and the Client!s personnel during an offsite and onsite service engagement. Galea will bring a highly seasoned, multi-disciplinary team to this engagement with deep due diligence, lease abstraction and underwriting experience. The Galea team includes a Project Management Team, Core Engagement Team and Advisory Team. The Project Management Team will have overall responsibility for managing the Galea team and ensuring delivery of a quality work product. The Core Engagement Team will be responsible for conducting the analyses and for producing deliverables. Finally, the Advisory Team will provide functional support on an as-needed basis, as well as, serve as an internal quality control audit system to provide secondary review of the deliverables. Galea anticipates ongoing involvement from the Client!s personnel throughout the engagement including participation in meetings and review of deliverables. We would expect an Oversight Manager to be assigned to this engagement as the primary contact for managing the relationship with Galea and in approving deliverables. Client Onsite Staffing Plan Commercial Real Offsite Staffing Plan Client Estate Group Commercial Real Estate Group Galea Project Client Galea Project Management Team Oversight Mgr. Management Team • Managing • Managing Consultant(s) Client HR Personnel Consultant(s) Galea Core Engagement Team Galea Core Galea Advisory Team • Project Consultant Engagement Team • Project Consultant (Quality Control) (1 to 10 Project Consultants based on (1 to 10 Project • Advisor Client!s needs) Consultants based on • Advisor Client!s needs)
  • 12.
    Galea Advisors: RealtyAnalytics 12 Galea Credentials Real Estate Advisory Services Galea Advisors, Inc. (“Galea”), headquartered in New York City, was formed in 2008 to provide specialized operational and financial services to underperforming, over-leveraged or otherwise distressed property owners and investors of related assets. In addition to advising distressed real estate companies and investors, Galea provides direct or “white label” creditor advisory services and liquidation-related services. Galea!s Real Estate Advisory Group is comprised of a dedicated team of consultants who deliver independent and objective consultation and analysis to owners, investors, lenders, operators and corporate users of real estate. Building on Galea!s operational and problem-solving team, our professionals develop and implement detailed real estate strategies that improve operations, unlock value and minimize risk. We offer comprehensive solutions that address the need for objective and independent real estate counsel and execution. Our real estate advisory services include: " CRE Transaction Services " Owner Advisory Services " Interim and Crisis Management Consulting " Strategy and Operations Consulting
  • 13.
    Galea Advisors: RealtyAnalytics 13 Summary Professional Biographies Overview As indicated in the Staffing Plan, Galea is prepared to dedicate a core team of highly seasoned professionals to provide underwriting and investment valuation or financial due diligence and lease abstraction services. Following is a summary professional biographies for these personnel. Project Management Team Vernon Beckford, Managing Consultant Vernon Beckford is a Director at Galea, overseeing day-to-day operations. Most recently, Mr. Beckford worked at investment firm Sarus Partners, where he was responsible for strategic repositioning of small and middle market companies pursuing venture capital & private equity funding. Prior to that, he worked at Credit Suisse in the Real Estate Finance Group, engaging in fixed and floating rate debt issuance. During his tenure, he performed credit analysis, coordinated due diligence & collateral analysis for investors and assembled and reconciled pool level data tapes related to investor disclosure. In addition, he prepared and reviewed cash flow underwritings for commercial and multifamily loans in excess of $5 billion. Vernon also joined Credit Suisse Asia to help establish a Japanese structured finance platform and executed the first major transaction in that office. Mr. Beckford holds a B.A. in Political Science with a concentration on Economics from Columbia University. He holds Series 7 & 63 securities licenses and is a member of the NASD. Eric Andrew, Managing Consultant Eric Andrew is a Director at Galea, overseeing commercial real estate deal sourcing. Most recently, Mr. Andrew served as a Director at Enterprise Community Developers, a real estate development firm specializing in urban development and distressed asset repositioning. Mr. Andrew also managed the company's direct investment vehicle, Enterprise Capital Partners, and aided in the development and operations of spin-off subsidiary companies offering third-party services in construction and asset/property management. Prior to Enterprise, Mr. Andrew worked at Goldman Sachs as an Analyst in the Investment Management Division. He later joined Capital Trust Real Estate Investment Company, a publicly traded REIT, acting as Analyst and Deal Underwriter. During his tenure at Capital Trust, he analyzed and worked on underwriting teams for more than $7 billion worth of commercial loans and equity participations. Mr. Andrew earned a B.A. from Columbia University with a double major in Economics and History, holds a Venture Management Certification from the Harvard Business School VMP, graduated with distinction from the New York ICSC Real Estate Associate Program and currently holds candidacy for CCIM designation. He holds Series 7 & 63 securities licenses and is a member of the NASD.
  • 14.
    Galea Advisors: RealtyAnalytics 14 Summary Professional Biographies (cont!d) Galea Core Engagement Team Joseph A. DeVenuta, Project Consultant Prior to joining Galea, Mr. Devenuta worked for institutional real estate firms including Babcock & Brown, and Jones Lang LaSalle where his various experiences included underwriting, acquisition and asset management of more than $4 billion in commercial real estate investments across the United States, along with consulting on projects relating to management structure, process improvement and management software selection and implementation. Sample assignments have included conducting semi-annual internal valuations for a 28,000+ unit apartment portfolio, coordinating valuations and investor reporting for a broad portfolio of assets (including retail, self storage, development and debt assets), and managing a $330 million loan portfolio collateralized by real assets in all major property sectors. Mr. DeVenuta holds a B.S. in Management and Organizational Behavior with a focus in Commercial Real Estate Finance from New York University!s Stern School of Business. Mike Zampetti, Project Consultant Michael Zampetti has eight years of experience in the commercial real estate industry. Michael is currently an independent advisor to buyers and sellers of commercial real estate and the debt thereon. In this capacity, he provides underwriting, valuation, pricing, and marketing services to both buyers and sellers. Previously, Michael was a Vice President in the Real Estate Finance & Securitization (REFS) group at Credit Suisse, where he oversaw the creation and issuance of approximately $35 billion of commercial mortgage backed securities (CMBS). In this role, Michael was responsible for the day-to-day management of small teams and processes including, but not limited to, commercial real estate underwriting analysis, conducting large scale due diligence efforts, and the sales and marketing efforts of loans and bonds. Prior to joining the REFS group, Michael worked as a consultant in Credit Suisse!s Realty Investment Group, which was charged with liquidating a $300 million portfolio of performing and non-performing loans and equity positions. Michael graduated cum laude from the University of Scranton with a finance major and economics minor. He holds Series 7 & 63 securities licenses and is a member of the NASD.
  • 15.
    Galea Advisors: RealtyAnalytics 15 Summary Professional Biographies (cont!d) Galea Advisory Team Dan Wolins, Advisor Daniel Wolins is currently a partner in a New York-based private real estate equity company. Previously, Dan worked as a Director for Deutsche Bank's Commercial Real Estate Group in London, where he was responsible for managing the team's collateral risk in the origination and securitization process. His day-to-day activities included pricing new loans, participating in lending decisions and working closely with origination, structuring and distribution to ensure consistency of lending criteria and data dissemination in the distribution process. Prior to joining Deutsche Bank in 2006, Dan worked in the Real Estate Finance and Securitization Group at Credit Suisse for eight years in New York. He was a deal manager for fixed and floating rate CMBS securitizations and a member of their internal credit committee. Dan graduated from the University of Vermont with a Bachelor of Science in Business Administration. Anthony Nazzaro, Advisor Anthony Nazzaro is currently a principal of Layton Holdings, a commercial real estate investment and advisory firm with Clients that include, TIAA-Cref, Brookfield Asset Management, and Rhodes Associates. Anthony has over 25 years experience and his specialties include strategic planning, operational and organizational design, internal controls and systems planning. Mr. Nazzaro has advised numerous real estate Clients including Homebuilders / Developers, Hospitality Companies, Investment Managers, Opportunity Funds, Real Estate Investment Trusts (REITS), Real Estate Operating Companies, and Corporates. His Client projects include designing and implementing asset management, budgeting forecasting and valuation processes for a large investment manager and implementing a property and portfolio modeling system to support the new asset management processes. He has also designed and implemented a centralized lease administration function across office and retail portfolios of two large property management functions and designed a new lease abstract process and template that was fully integrated with the property management system. Anthony!s Clients include AMP Henderson, AMB Property Company and Deutsche Bank. Prior to joining the Galea Advisory Team, he served as a Director at Alvarez & Marsal and also spent ten years in Los Angeles, New York and Sydney in the real estate group of a Big Four firm where he served as Senior Manager. Anthony earned an M.B.A. from the University of California, Irvine and a B.S. in Electrical Engineering from New Jersey Institute of Technology.
  • 16.
    Galea Advisors: RealtyAnalytics 16 Appendix Appendix
  • 17.
    Galea Advisors: RealtyAnalytics 17 Representative Sampling of Client Deliverables Sample Deliverables detailed herein are representative examples only. Pertinent details have been intentionally changed, deleted, or distorted to protect Client privacy and confidentiality.
  • 18.
    Galea Advisors: RealtyAnalytics 18 Investor Reporting - Collateral Valuation Summary (Investment “1-Pager”) COLLATERAL VALUATION SUMMARY Loan Collateral Sponsor Relationship ID: 3 Loan ID # 100351 Property Name: Holiday Inn Express Borrower: Any Borrower LLC Pool ID # 1234A City: Anyros Guarantor: John Doe, Jane Doe, & J&J Transportation Portfolio: USA State: NM Loan ID# Pool ID # UPB Loan Status Lien Position Bank Name: ABC Lending Prop. Sub Type / Yr. Built: Hotel 1999 Subject Loan: 100351 1234A 2,501,146 Non-Perf. First/DOT Property Size (SF): 48,634 80 Keys Related Loan #1 100354 1234B 1,465,938 Non-Perf. First/DOT Loan Status: Non-Performing Proposed Use: Hotel Related Loan #2 113578 6359A 1,085,431 Non-Perf. First/DOT UPB / Per Key: $2,501,146 $31,264 Project Completion %: NAV Related Loan #3 Lien Position First Mortgage/DOT Site Inspection Review: YES Related Loan #4 Loan Purpose: Purchase/Acquisition Asset Summary: YES Related Loan #5 Origination Date: 2/3/2006 Appraisal Review: YES Related Loan #6 Maturity Date: 2/1/2031 NAV Legal/Environmental Review YES YES Related Loan #7 Last Payment Date: 5/4/2009 89 (Days Late) Original Appraisal Date: 5/20/05 Related Loan #8 Unfunded Commitment: $0 Original Appraisal Value: $5,000,000 $62,500 Related Loan #9 BPO/Recent Appraisal $3,570,000 $44,625 Related Loan #10 Galea UW Value / Per Key $2,880,000 $36,000 Total Exposure to Borrower $5,052,515 Asset Summary Notes: Lien: The facility is a Non-Performing $2501146.06 First Mortgage/DOT. The purpose of the Loan was for Purchase/Acquisition Collateral The Property is a Hotel with 80 Keys located in Anyros, NM The Property is the newest hotel in the MSA. Location The Property sits at the corner a major north/south arterial roadway and benefits from good visibility, and walking proximity to local amenities and an adjacent golf course. Primary demand generators include, Eastern New Mexico University, New Mexico Military Institute, and oil and gas employers. Market 1) The submarket offers roughly 20 competing limited service and extended stay hospitality properties. 2) Occupancy levels in the MSA are flat. 3) ADR levels in the submarket are trending down. 4) RevPAR is expecting to trend down until 2011. Other Issues 1) The Property condition at the time of site inspection (8/19/09) was noted as excellent. The Property has been well maintained and does not suffer from any deferred maintenance. 2) Competing flags in the operating area include the Hampton Inn, Days, Inn, Fairfield Inn, Candlewood Suites, Best Western, Econolodge and La Quinta Inn. Borrower / Guarantor Notes: The Borrower is Any Borrower LLC. The Sponsor for the transaction is John Doe, Jane Doe, & J&J Transportation. 1) John and Jane Doe signed full guarantees. 2) J&J transportation signed full guarantees. 3) As of October 2007, the Guarantors joint PFS stated a net worth of $13.02M based on assets of $17.2M, including $390k in cash, and total liabilities of $4.2. 4) The credit rating for John Doe showed a score of 630 as of 11/07 and reflected nine late payments, but all of his accounts were current. The credit score for Jane Doe as of 11/07 was 740 and reflected no late payments. Legal Summary Mortgage None Title Policy Title Policy includes Note None Issue #1: Mechanics Liens Issue #2: None Issue #3: None Issue (Y/N): (Y/N): material exceptions Issue: filed Issue #4: None Issue #5: None Issue #6: None Issue #7: None Issue #8: None Issue #9: None Tape Notes: Loan assigned from Silver State Bank to Sec. Savings - All assignment documentation in file; Title Date Down dated 8/21/09 Notes: Recent communication from 6/09 through 7/09 indicate that the Any Lender was negotiating the sale of their loan position to Any Buyer. Environmental Summary Asbestos (Y/N): NAP Soil Contamination X UST (Y/N): X Ground Water X Mold (Y/N): NAP Other (Y/N): NAP (Y/N): (Y/N): Dry Cleaner (Y/N): NAP Gas Station (Y/N): X Cost to Cure Environmental Issues: 250000 Tape Notes: 1950-91 site occupied by gasoline station. Low levels of BTEX in soil & groundwater. Results questionable because of location of samples. No doc on UST removals. Notes: The Borrower signed an environmental indemnity agreement. Possible economic risk resulting from sites prior use pattern. Asset Plan Notes: UW Multiplier @ 2.5x to 3x (2.0x for quick sale), Cap Rates @ 13-14%, ADR @ $65-80/ Galea Revenue Drivers: ADR @ $75 Cap Rates: 14.0% Multiplier 2.0x Value $36,000 /key Resolution The anticipated Loan resolution is a DPO in which the borrower refinances the existing lien within 18 months at par. Underwriter: Galea UW Value $2,880,000 8/30/09 Reviewer 1: Client TBD Reviewer 2: Client TBD Sample Deliverables detailed herein are representative examples only. Pertinent details have been intentionally changed, deleted, or distorted to protect Client privacy and confidentiality.
  • 19.
    Galea Advisors: RealtyAnalytics 19 Investor Reporting - Collateral Summary ABC FUND, INC - COLLATERAL SUMMARY 1234 ANYWHERE AVENUE - NEW YORK, NY PROPERTY & BORROWER INFORMATION Property Type: Multifamily Lien Type: Mezzanine Sponsor: John Doe Property Sub-Type: Elevator Apartments Loan Origination Date: 3/6/09 Borrower: John Doe Investments LLC # of Units: 84 ABC Loan Acquisition Date: 3/6/09 Loan Assumable: No City, State: New York NY Acquisition/Refinance: Refinance Carve Out Guarantor: John Doe Year Built, Renov.: 1985 1996 Lock Box: No Cash Mgmt/Sweep: No/No ABC FUND, INC - COLLATERAL SUMMARY LOAN INFORMATION 1234 ANYWHERE AVENUE - NEW YORK, NY Loan Issuer Balance Loan/ Appr. Fitch Moodys S&P NCF Init. Mat. Ext. Mat. Lock. PROPERTY CASH FLOW PROJECTIONS AT ORIGINATION (000s) Note Holder (000s) Unit LTV(1) DSCR LTV LTV Yield Date Date Index(2) Spread Amort.(3) Exp. Year 1 Year 2 Year 3 Year 4 Maturity Year 6 Year 7 Year 8 Year 9 Year 10 Senior Loan XYZ Bank $5,900 $70,238 44.36% NAV NAV NAV 13.7% 4/1/14 4/1/14 Swaps 1.77% I/O, Fixed 4/1/14 12 Mos 12 Mos 12 Mos 12 Mos 5 Mos 12 Mos 12 Mos 12 Mos 12 Mos 12 Mos Mezz. Loan ABC Fund 3,950 117,262 74.06% NAV NAV NAV 8.2% 4/1/14 4/1/14 Swaps 3.35% I/O, Fixed 4/1/14 FYE 12/09 FYE 12/10 FYE 12/11 FYE 12/12 ending 4/14 FYE 12/14 FYE 12/15 FYE 12/16 FYE 12/17 FYE 12/18 Economic Occupancy 96.2% 96.2% 96.2% 96.2% 96.2% 96.2% 96.2% 96.2% 96.2% 96.2% Total $9,850 Base Rent 2.40% $1,614 $1,663 $1,712 $1,764 $780 $1,871 $1,927 $1,985 $2,045 $2,106 (1) LTV is based on the appraised value of $13.3 MM, pursuant to the appraisal prepared by Leitner Group, Inc. dated December 08, 2008. Other Income 6 6 6 7 3 7 7 7 8 8 (2) The Swaps rate will be locked-in at closing. Vacancy Loss/Collection Loss (61) (63) (65) (67) (69) (71) (73) (75) (77) (80) (3) The Loan is I/O during the first two years and amortizes based on a 30 year schedule thereafter. Total Revenue $1,559 $1,606 $1,654 $1,704 $753 $1,807 $1,862 $1,918 $1,975 $2,034 RE Taxes and Ins. 209 216 222 229 101 243 250 257 265 273 PROPERTY OPERATIONS Operating Expenses 469 483 497 512 226 543 560 577 594 612 Net Operating Income $881 $907 $935 $963 $426 $1,021 $1,052 $1,084 $1,116 $1,150 Property Statistics Actual Issuer U/W No. of CapEx Escrow Avg. In-Place Galea Adj. (37) (37) (37) (37) (37) (37) (000s) Actual 2006 2007 Actual 2008 NCF(1) Per Unit Unit Type Units (2) Avg. SF Adjusted NOI (NCF) % Occ. Rent Market Rent $844 $871 $898 $926 $389 $985 Physical Occupancy 97.4% 99.2% 98.8% 98.0% 1 Bedroom 22 540 $1,208 $1,341 100% Plus: CapEx Escrow $37 $37 $37 $37 $37 $37 0 0 0 0 Economic Occupancy 96.6% 98.4% 97.1% 98.0% 2 Bedroom 48 750 1,680 1,865 100% Less: Actual CapEx (37) (37) (37) (37) (37) (36) (36) (36) (36) (36) Base Rent $1,369 $1,369 $1,522 $1,614 $19,448 3 Bedroom 13 940 100% 2,100 Funding (Deficit) From Reserve Net 2,331 $0 $0 $0 $0 $0 $0 Other Income 19 20 20 16 188 Total / Average 83 724 $1,621 $1,799 100% Vacancy Loss (47) (21) (44) (33) (393) Rent roll data as of 11/28/08 0 0 Ending Loan Balance (Mezz. Loan) $0 - $9,850 $9,850 $9,624 $9,391 $9,153 $9,153 Total Revenue $1,341 $1,368 $1,497 $1,597 $19,243 DSCR @ Actual Rate (Mezz. Loan) HOUSING ASSISTANCE PAYMENTS ("HAP") CONTRACT 1.11x 1.15x 0.92x 0.96x 0.41x 1.39x RE Taxes and Ins. 162 160 196 220 2,656 Term: NCF/Loan (Mezz. Loan) Five years term with unlimited five-year extension options 8.6% 8.8% 9.3% 9.9% 10.2% 10.8% Operating Expenses 622 605 606 529 6,373 Payments: HUD pays owner a portion of tenant's contract rent minus an amount equal to the greater of (i) 30% of NOI $557 $604 $695 $848 $10,214 tenant adjusted income, (ii) 10% of gross income, or Thethe portion of projections were designated the following assumptions: (i) in-place rents according to the rent roll dated November 28, 2008, (ii) a 3.0% economic vacancy, (iii) historical (iii) cash flow welfare assistance based on Capital Expenditures 0 0 0 (37) (441) for housing. revenues grown at 3.0%, (iv) historical operating expenses grown at 3.0%, (v) management fees projected at 4.61% of effective gross revenue, and (vi) $436/Unit capital reserve ($36,610). NCF $557 $604 $695 $811 $9,773 Eligibility: Families with income below 50% of the area median income. Rent Adjustments: Contract rents are reset to market (upward or downward) every 5 years. They may also adjusted Appraised Value/Per Unit/Date: $13,300 $158,333 11/15/08 annually (upward only). Galea Value/Per Unit/Date: $13,070 $155,597 3/1/09 Termination Options: The owner may terminate contract with written notice to the CA and each tenant in according to law PROPERTY PERFORMANCE (000s) and HUD requirements. (1) Based on XYZ Bank's underwriting. Galea UW (2) The property contains 84 units. The total number of units shown excludes one 3-bedroom unit occupied rent-free by the superintendent. Property Statistics Actual 2007 Actual 2008 Yr 1 GENERAL NARRATIVE Economic Occupancy 98.4% 97.1% 96.2% The Property, known as John Doe Apartments, is a 100% occupied, 77M sf apartment building containing 84 units located at the southwest corner ofEffective Gross and 115th St. in northern Anywhere Ave. Revenue $1,368 $1,497 $1,559 Manhattan. Built in 1985 for use as project-based Section 8 affordable housing, the Property generates 79% of the its income from HUD Section Operating Expenses Housing Assistance 8 subsidies under a 764 802 678 Payments ("HAP") contract through 2010. NOI $604 $695 $881 Actual CapEx 0 0 (36) The Property's East Harlem neighborhood has seen significant revitalization over the past few years. The East Harlem submarket contained 40M Adjusted NOI (NCF) households as of 2008, with an average $604 $695 $845 annual household income of $39M compared to $64M for the nation. Due to a housing shortage throughout the submarket, which has a residential vacancy Debt less than 3%, occupancy rates Total rate Service 760 760 760 approach 100% in most properties, with only short-term vacancies. Contractual rents at the Property, which average $1,621 per unit per month, are set to be 20% below market rents in Cash Flow After Debt Service ($156) ($65) $84 accordance with the HAP contract. Galea believes the market rents used by HUD may be high. Galea's analysis indicates market rents to be approximately DSCR for 1-bedroom Senior $1,340 - Adjusted NOI apartments, 1.45 1.66 2.02 $1,870 for 2-bedroom apartments and $2,330 for 3-bedroom apartments based on broker rental listings for comparable apartments in market rate buildings, which meansNOI Total DSCR - Adjusted in-place average 0.79 0.91 1.11 rents at the Property are closer to 10% below market. As part of the Section 8 program, the Property benefits from real estate tax savings as well as lower vacancy and collection loss than NCF/Loan 6.1% 7.1% 8.6% would be expected in a market-rate building. The Property currently pays a PILOT (payment in lieu of taxes) of $183M, which is estimated at $137M below market real estate taxes. The Swaps 5.21% 5.21% 5.21% Property does not require the capital outlay that would be necessary to convert and maintain the building at market rate levels within an area with suchImplied Going In Cap Rate an abundance of new construction. The 4.62% 5.32% 6.46% tax savings combined with lower maintenance costs and the HAP rents, which are close to market rate and on average 80% HUD-paid, makes continuing under the HAP contract more Galea Value(1) $13,070 profitable for the owner than converting the Property to a market-rate building. Galea Value LTV 75.4% (1) Value is based on a 10-year DCF with a 6.75% terminal cap rate and a 9.25% discount rate as of 12/31/08. Jake Doe, Martin Doe and Jehoshua Doe (20% ownership) are the general partners responsible for management and operations. John Doe (required to maintain 25% ownership), who reports Performance Comments a net worth of $1.1B and $80MM liquidity as of 6/30/09, will be the recourse carveout guarantor of the loan and has extensive real estate experience through ownership and management of over 21 Section 8 developments (9.5M units), more than 25M residential units and over 10MM sf of commercial and industrial space in the New York Metropolitan area. Alexander Doe (55% ownership), whose net worth is reportedly in excess of $50MM, has no control over the operation of the property and will never be allowed to have a controlling interest due to his credit history, Galea VALUATION (000s) including involuntary bankruptcy petitions that were filed against him and numerous properties being foreclosed upon. The Property is managed by XYZ Realty Corp., a Doe-owned company which has been involved in the management of Section 8 housing since its inception in 1957. The company currently manages four buildings with a total GA654 units throughout Manhattan and the of Value $13,070 GA LTV (Senior Loan) 45.1% GA Value / Unit 157,471 GA LTV (Mezz. Loan) 75.4% Bronx, all of which have been under their management for over 19 years. Cap-Rate (1st Year NCF) 6.46% Appraised Value $13,300 Appraised Value LTV (Senior Loan) 44.4% Appraised Value / Unit 160,241 Appraised Value LTV (Mezz. Loan) 74.1% INVESTMENT STRENGTHS/ RISKS AT ORIGINATION Going-In Cap Rate 6.25% (+)Occupancy: The Property is currently 100% with a waiting list in excess of 250 people and units that are generally rented within one month. The Galea underwritten value of $13.1MM is based on a 10-year DCF with a 6.75% terminal cap rate on yr. 11 NOI of $1.2MM and a 9.25% discount rate as of 12/31/08. (+/-)HAP Contract: The Property generates nearly 80% of its income from government subsidies, which limits the risk of collection loss and tenant payment defaults, but also provides risk in the event of a HAP contract default that could cause HUD to stop payment of all subsidies. TAKE-OUT ANALYSIS (000s) GA Terminal Cap Rate 6.75% Senior Loan Mezz. Loan Required DSCR 1.25x Ending Loan Balance $5,443 $9,153 CT Value (Net Sale Proceeds EO Year 6) $15,585 Ending LTV 34.9% 58.7% Breakeven Constant 15.15% 9.01% LOAN ASSESSMENT/CAPITAL TRUST ASSET PLAN Portfolio Management to perform quarterly review. Monitor the level of rents in property submarket. Sample Deliverables detailed herein are representative examples only. Pertinent details have been intentionally changed, deleted, or distorted to protect Client privacy and confidentiality.
  • 20.
    Galea Advisors: RealtyAnalytics 20 Investor Reporting - Underwriting & Asset Management Summary ABC FUND, INC - ASSET MANAGEMENT COLLATERAL SUMMARY 1234 ANYWHERE AVENUE - NEW YORK, NY OPERATING STATEMENTS Year 2008 2008/2009 Appraisal U/W Galea In Place Cash Flow Galea Underwriting Period Full Year Full Year As of As of As of NOTE Period Ended 12/31/08 2008/2009 11/15/08 12/31/08 12/31/08 Statement Type Borrower Provided Budget Appraisal U/W Galea In Place Cash Flow Galea Underwriting Economic Occupancy 97.1% 98.0% 98.0% 99.2% 94.2% ABC FUND, INC - ASSET MANAGEMENT COLLATERAL SUMMARY Per Unit % of GPR Per Unit % of GPR Per Unit % of GPR Per Unit % of GPR Per Unit % of GPR 1234 ANYWHERE AVENUE - NEW YORK, NY Gross Potential Rent $1,521,537 $18,114 100.0% $1,614,192 $19,217 100.0% $1,614,192 $19,217 100.0% $1,614,192 $19,217 100.0% $1,614,192 $19,217 100.0% 1 SUPPLEMENTARY LOAN AND PROPERTY INFORMATION Vacancy Loss (17,688) (211) (1.2%) (32,284) (384) (2.0%) (32,596) (388) (2.0%) - - - (80,710) (998) (5.0%) 2 Reference Date Balloon Loan Annual Debt Calculation Leasing Concessions - - - - - - - - - - - - - - - Note Balance Balance Service Method Interest Rate Floor Prepayment Premium Credit / Collection Loss (26,369) (314) (1.7%) - - - - - - (12,645) (145) (0.8%) (12,645) Senior Loan(156) (0.8%) 3 $5,900,000 $5,442,521 $417,540 Actual/360 1.77% N/A N/A Net Rental Income $1,477,480 $17,589 97.1% $1,581,908 $18,832 98.0% $1,581,596 $18,829 98.0% $1,601,547 $19,289 99.2% Mezz. Loan $1,520,837 $18,812 94.2% 3,950,000 3,710,697 342,816 Actual/360 3.35% N/A N/A Total $9,850,000 $9,153,218 $760,356 2.40% % of EGR % of EGR % of EGR % of EGR % of EGR Laundry Income $2,702 $32 0.2% $6,000 $71 0.4% $6,000 $71 0.4% $6,000 $71 0.4% $6,000 $71 Portfolio Category: 0.4% 4 ABC INVESTMENT FUND Senior Loan Mezzanine Loan Parking Income 9,400 112 0.6% 9,600 114 0.6% 9,600 114 0.6% - - - - CDO Loan Number: - - 5 NAV Loan Seller: XYZ Bank Loan Seller: Galea Advisors Other Income 7,555 90 0.5% - - - - - - - - - - Originator Loan- Number: - 6 53746 Loan Term: 60 Loan Term: 60 Originator: Mr. Patrick Lendyamoney Amortization Term: 360 Amortization Term: 360 Total Other Income $19,657 $234 1.3% $15,600 $186 1.0% $15,600 $186 1.0% $6,000 $71 0.4% $6,000 Property ID: $71 0.4% NAV Remaining Loan Term: 60 Remaining Loan Term: 60 Property Address: 1234 Anywhere Avenue Remaining Amortization Term: 360 Remaining Amortization Term: 360 Zip Code: 10029 Amortization Type I/O (24 mos.), Fixed (36 mos.) Amortization Type I/O (24 mos.), Fixed (36 mos.) Effective Gross Revenue $1,497,137 $17,823 100.0% $1,597,508 $19,018 100.0% $1,597,196 $19,014 100.0% $1,607,547 $19,455 100.0% $1,526,837 / PMSA: MSA $18,887 100.0% New York/NY Seasoning: 0 Seasoning: 0 Ground Lease: No Original Interest Only Period: 24 Original Interest Only Period: 24 Real Estate Taxes $170,112 $2,025 11.4% $183,172 $2,181 11.5% $182,667 $2,175 11.4% $183,172 $2,181 11.4% $183,172 Date:$2,181 Exp. 12.0% 7 N/A Remaining Interest Only Period: 24 Remaining Interest Only Period: 24 Security Interest: Fee Simple Interest Rate Floor: N/A Interest Rate Floor: N/A Insurance 26,171 312 1.7% 15,000 179 0.9% 37,800 450 2.4% 26,171 312 1.6% 26,171 312 Collateral Interest: 1.7% 7 Mezzanine Extension Option: No Extension Option: N0 Utilities 186,247 2,217 12.4% 157,000 1,869 9.8% 160,650 1,913 10.1% 186,247 2,217 11.6% 186,247 Crossed: 2,217 12.2% 8 No Lock Box Type: N/A Lock Box Type: N/A Cross Code: N/A Default Anticipated / Month: No / N/A Default Anticipated / Month: No / N/A Repairs & Maintenance 51,904 618 3.5% 41,500 494 2.6% 154,700 1,842 9.7% 51,904 618 3.2% 51,904 618 3.4% 8 Annex A Occupancy / Date: NAV / N/A Loss Anticipated / Amt.: No / $0.00 Loss Anticipated / Amt.: No / $0.00 Janitorial - - - - - - - - - - - - - Number of Properties: - - 1 Master Servicer: NAV General & Administrative 111,271 1,325 7.4% 70,000 833 4.4% 25,000 298 1.6% 70,000 833 4.4% 70,000 Swap Rate 833 4.6% 8 5.21% Special Servicer: NAV Advertising & Marketing - Property Insurance Exp. Date: 6/1/10 Galea UW Team: VB, EA, JD ABC FUND, -INC - - ASSET MANAGEMENT COLLATERAL- SUMMARY - - - - - - - - - - - Liability Insurance Exp. Date: 6/1/10 Date of Loan Underwriting: 2/15/09 Professional Fees 26,655 317 1.8% - - - 10,000 119 0.6% 26,655 317 1.7% 26,655 317 1.7% Terrorism Insurance Exp. Date: 8 NAV Payroll & Benefits 187,995 2,238123412.6% ANYWHERE AVENUE - NEW YORK, 130,000 95,000 1,131 5.9% NY 1,548 8.1% 95,000 1,131 5.9% 95,000 1,131 6.2% 8 Other - - - - - - - - - - - - - - - 8 IN PLACE UNIT MIX SOURCE DOCUMENT INVENTORY Management Fee 41,609 495 2.8% 47,925 571 3.0% 47,916 570 3.0% 74,108 882 4.6% 70,387 838 4.6% 9 Ground Rent Rent Roll Date: - - 12/31/08 - - - - - - - - - - - Document - - Source Date Received Comments 2009 Budget Proforma Total Operating Expenses $801,964 $9,547 53.6% $609,597 $7,257 38.2% No. of $748,733 $8,913 46.9% $713,257 Galea$8,491 44.4% $709,536 $8,447 46.5% 2008 Operating Statement Borrower Provided Occupied No. of Avg. In-Place Market Market 2007 Operating Statement Borrower Provided Net Operating Income Unit Type $695,173 $8,276 46.4% Avg. $987,911 SF No. of$11,761 Units 61.8% Units $848,463 Units Vacant $10,101 53.1%Rent Rent (1) $894,290 Rent$10,646 (2) 55.6% $817,3012006 Operating Statement $9,730 53.5% Borrower Provided 2005 Operating Statement NAV 1 Bedroom 540 22 22 - $1,208 $1,600 $1,341 # Rent Roll Borrower Provided 12/31/08 Capital Expenditure / Reserve $0 - - $0 - - $16,800 200 1.1% $36,610 436 2.3% $21,000 250 1.4% 10 2 Bedroom 750 48 48 - 1,680 2,100 1,865 # Issuer's Asset Summary XYZ Bank Total Capital Expenditures3 Bedroom (3) $0 $ - 0.0% $0 $ 13 - 0.0% $16,800 $200 1.1% $36,610 2,331 $436 2.3% $21,000Appraisal $250 Report 1.4% ABC Appraisal Firm 12/8/08 940 13 - 2,100 2,500 Engineering Report ABC Engineering Firm - - Environmental Report EMG Net Cash Flow $695,173 $8,276 46.4% $987,911 $11,761 61.8% - $831,663 $9,901 52.1% $857,680 $11,604 53.4% $796,301 $9,850 Real Estate Tax Bills52.2% Borrower Provided Total / Average 724 83 83 - $1,621 $2,030 $1,799 Insurance Bills Borrower Provided Leases Borrower Provided NCF Yield on Debt 7.1% 10.0% 8.4% 8.7% 8.1%Non-recourse Guarantor Financial Statements Borrower Provided No. of Units Physical Occ. Economic Occ. Rent See Following Page Info Sponsors For Notes and Comments Borrower Provided Occupied 83 100.0% 100.8% $1,614,192 Additional Source Documents Vacant/Collection Loss - 0.0% 0.8% $12,645 2009 Proforma Borrower Provided Total 83 100.0% 100.0% $1,601,547 NOTES 1. Market Rent based on market rates reported in Appraisal Report. 2. Galea Market Rent based on based on current broker listings for units in similar properties within the submarket. 3. The property contains 84 units. The total number of units shown excludes one 3-bedroom unit occupied rent-free by the superintendent. Sample Deliverables detailed herein are representative examples only. Pertinent details have been intentionally changed, deleted, or distorted to protect Client privacy and confidentiality.
  • 21.
    Galea Advisors: RealtyAnalytics 21 Investor Reporting - Collateral Valuation Summary 1234 ANYWHERE AVENUE - NEW YORK, NY 11-YEAR CASH FLOW AND OCCUPANCY ANALYSIS Year 1 Year 2 Year 3 Year 4 Year 5 Year 6 Year 7 Year 8 Year 9 Year 10 Year 11 For the Years Ending Dec-2009 Dec-2010 Dec-2011 Dec-2012 Dec-2013 Dec-2014 Dec-2015 Dec-2016 Dec-2017 Dec-2018 Dec-2019 Gross Potential Rent 1,614,192 1,662,618 1,712,496 1,763,871 1,816,787 1,871,291 1,927,430 1,985,253 2,044,810 2,106,154 2,169,339 Vacancy Loss (48,426) (49,879) (51,375) (52,916) (54,504) (56,139) (57,823) (59,558) (61,344) (63,185) (65,080) Leasing Concessions - - - - - - - - - - - Credit / Collection Loss (12,645) (13,025) (13,416) (13,818) (14,233) (14,660) (15,099) (15,552) (16,019) (16,499) (16,994) NET RENTAL INCOME 1,553,121 1,599,714 1,647,706 1,697,137 1,748,051 1,800,493 1,854,507 1,910,143 1,967,447 2,026,470 2,087,264 Laundry Income $6,000 $6,180 $6,365 $6,556 $6,753 $6,956 $7,164 $7,379 $7,601 $7,829 $8,063 Parking Income - - - - - - - - - - - Other Income - - - - - - - - - - - TOTAL OTHER INCOME 6,000 6,180 6,365 6,556 6,753 6,956 7,164 7,379 1234 ANYWHERE AVENUE - NEW YORK, NY 7,601 7,829 8,063 PROPERTY VALUATION EFFECTIVE GROSS REVENUE 1,559,121 1,605,894 1,654,071 1,703,693 1,754,804 1,807,448 1,861,672 1,917,522 1,975,048 2,034,299 2,095,328 Real Estate Taxes 183,172 188,667 194,327 200,157 206,162 212,347 218,717 225,278 Year 1 232,037 Year 2 238,998 Year 3 246,168 Year 4 Year 5 Year 6 Year 7 Year 8 Year 9 Year 10 Year 11 Insurance 26,171 26,956 27,765 28,598 29,456 30,339 31,250 32,187 33,153 34,147 35,172 Fiscal Years Ending December 2009 2010 2011 2012 2013 2014 2015 2016 2017 2018 2019 Utilities 186,247 191,834 197,589 203,517 209,623 215,911 222,389 229,060 235,932 243,010 250,300 Repairs & Maintenance 70,635 72,754 74,937 77,185 79,500 81,885 84,342 86,872 89,478 92,163 94,928 Janitorial - - - Net Operating Income - - - - $881 - $907 - $935 - $963- $992 $1,021 $1,052 $1,084 $1,116 $1,150 $1,184 General & Administrative 25,000 25,750 26,523 Net Cash Flow 27,318 28,138 28,982 29,851 845 30,747 871 31,669 899 32,619 927 33,598 955 985 1,016 1,047 1,080 1,113 Advertising & Marketing - 0 - - - - Valuation Term: - - 10 Years - - - Professional Fees 10,000 10,300 10,609 10,927 11,255 11,593 11,941 12,299 12,668 13,048 13,439 2019 NOI: $1,184 Payroll & Benefits 105,000 108,150 111,395 114,736 118,178 121,724 125,375 129,137 133,011 137,001 141,111 Terminal Cap Rate: 6.75% Other - - - - - - - - - - - Management Fee 71,875 74,032 76,253 78,540 80,896 83,323 Residual Value: 85,823 88,398 $17,541 91,050 93,781 96,595 Ground Rent - - - - - - Cost of Sale @ 3.0%: - - (526) - - - Net Residual Value: $17,015 TOTAL OPERATING EXPENSES 678,100 698,443 719,397 740,979 763,208 786,104 809,687 833,978 858,997 884,767 911,310 Net Cash Flow $845 $871 $899 $927 $955 $985 $1,016 $1,047 $1,080 $1,113 Residual Value 0 0 0 0 0 0 0 0 0 17,015 NET OPERATING INCOME 881,020 907,451 934,674 962,715 991,596 1,021,344 1,051,984 1,083,544 1,116,050 1,149,532 1,184,018 Total Flow to Investor $845 $871 $899 $927 $955 $985 $1,016 $1,047 $1,080 $18,128 Replacement Reserves 36,174 36174.16667 36174.16667 36,174 36,174 36,174 36,174 36,174 36,174 36,174 36,174 Discount Rate: 9.25% PORTFOLIO PRESENT VALUE MATRIX TOTAL CAPITAL EXPENDITURE 36,174 36,174 36,174 Total 36,174Units: No of 36,174 36,174 36,174 83 36,174 36,174 36,174 36,174 Capitalization Rate Discount Rate 6.25% 6.50% 6.75% 7.00% 7.25% CASH FLOW BEFORE DEBT SERVICE 844,846 871,277 898,500 926,541 955,422 985,170 1,015,810 1,047,370 1,079,876 1,113,358 1,147,843 8.75% $ 14,130 $ 13,824 $ 13,541 $ 13,279 $ 13,034 Current Physical Occ. as of 4/08: 100.0% ($170,237) ($166,557) ($163,149) ($159,985) ($157,038) Present Value Summary Gross $ $Per Unit % 9.00% $ 13,878 $ 13,579 $ 13,303 $ 13,046 $ 12,807 Total No. of Units 84 84 84 84 PV Residual 84 84 84 $7,024 84 $84,632 84 53.7% 84 84 ($167,205) ($163,608) ($160,278) ($157,185) ($154,306) Total No. of Rented Units 83 83 83 83 83 83 83 83 83 83 83 PV Income Stream 6,046 $72,840 46.3% 9.25% $ 13,632 $ 13,340 $ 13,070 $ 12,819 $ 12,586 Average Occupied Units Per Year 81 81 81 81 81 81 81 81 81 81 81 Underwritten Physical Occupancy 97.0% 97.0% 97.0% Present Value of Property 97.0% 97.0% 97.0% $13,070 97.0% 97.0% $157,471 97.0% 100.0%97.0% 97.0% ($164,242) ($160,726) ($157,471) ($154,449) ($151,635) Less Collection Loss -0.8% -0.8% -0.8% -0.8% -0.8% -0.8% -0.8% -0.8% -0.8% -0.8% -0.8% 9.50% $ 13,392 $ 13,107 $ 12,842 $ 12,597 $ 12,369 Underwritten Economic Occupancy 96.2% 96.2% 96.2% 96.2% 96.2% 96.2% 96.2% 96.2% 96.2% 96.2% 96.2% ($161,346) ($157,910) ($154,728) ($151,774) ($149,024) 9.75% $ 13,157 $ 12,878 $ 12,620 $ 12,380 $ 12,157 NET OPERATING INCOME $881 $907 $935 $963 $992 $1,021 $1,052 $1,084 $1,116 $1,150 $1,184 TOTAL CAPITAL COSTS 36 36 36 36 36 36 36 36 36 36 36 ($158,516) ($155,157) ($152,047) ($149,160) ($146,471) CF BEFORE DEBT SERVICE $845 $871 $899 $927 $955 $985 $1,016 $1,047 $1,080 $1,113 $1,148 PRESENT VALUE MATRIX Discount Rate Terminal Cap Rate ($000's) Terminal Cap Rate ($/per unit) 6.25% 6.50% 6.75% 7.00% 7.25% 6.25% 6.50% 6.75% 7.00% 7.25% 8.75% 14,130 13,824 13,541 13,279 13,034 $170,237 $166,557 $163,149 $159,985 $157,038 9.00% 13,878 13,579 13,303 13,046 12,807 $167,205 $163,608 $160,278 $157,185 $154,306 9.25% 13,632 13,340 13,070 12,819 12,586 $164,242 $160,726 $157,471 $154,449 $151,635 9.50% 13,392 13,107 12,842 12,597 12,369 $161,346 $157,910 $154,728 $151,774 $149,024 9.75% 13,157 12,878 12,620 12,380 12,157 $158,516 $155,157 $152,047 $149,160 $146,471 Sample Deliverables detailed herein are representative examples only. Pertinent details have been intentionally changed, deleted, or distorted to protect Client privacy and confidentiality.
  • 22.
    Galea Advisors: RealtyAnalytics 22 Investor Reporting - Due Diligence and Third Party Report Summary Sample Deliverables detailed herein are representative examples only. Pertinent details have been intentionally changed, deleted, or distorted to protect Client privacy and confidentiality.
  • 23.
    Galea Advisors: RealtyAnalytics 23 Investor Reporting – Loan Summary Report SUMMARY OF LOAN TERMS, PURPOSE AND CURRENT STATUS The subject loan was originated on 2/3/2006 for the acquisition of an 80-key Holiday Inn Express (the, "Property") hotel in Anyros, NM. The loan balance at origination was $2,630,101, and the current outstanding balance is $2,514,854. The collateral for the loan consists of first lien on the Property. The loan term is for 25 years (2/1/2031) and the interest rate is fixed for the first five years at 8.647% then converts to an adjustable rate using the "the Secure Connect Rate for 4-5 year maturities in the Bullet Rates table published by the FHLB of Dallas" plus a 3.5% margin. During the first five years of the loan, a prepayment penalty of 5% is assessed on any prepayment which exceeds 20% of the outstanding loan balance. Based on the most recent payment history information provided, the last payment date was 5/4/2009. ASSET SUMMARY TEMPLATE Page 2 Most recent entries in communications log as of 8/19/2009 (entries for 06/09 thru 07/10/2009) indicate that Any Lender was negotiating the sale of its position in Client Any Investment Bank the asset to Any Investor. Lender ABC Lending Servicer XYZ Asset Management COLLATERAL DESCRIPTION & MARKET SUMMARY 1234 Any Street The # DPD subject loan is a first Pmt Due Date Property. Original Date Nxt lien on the Current Maturity Accrued Interest Fixed or Adjust. Interest Rate Margin Index Nxt Interest Adj Dt Original Term PPP (Y/N) Date Rate (Months) The Property is a three story, 80-key limited service hotel located in Adjustable NM. The building was built in 1999 and has a stucco 2/3/2006 6/1/2009 2/1/2031 $14,228.02 Anyros, 8.647% 3.50% 501 2/3/2011 300 Y exterior over a steel frame with a pitched asphalt shingle roof. It contains 48,637 sf on a 1.9 acre site. Amenities include an indoor pool, fitness room, and breakfast dining area. There is a 360 square foot meeting space asSUMMARY TEMPLATE Loan Data (continued) 7/31/09 ASSET well as vending areas within Page 1 the facility. MR NCF Pool/Performance: 1234 / Non-Performing According to the site inspection DSCR MR NOI Date MR NCF Date Current performed on Aug. 18, 2009 by RER Solutions, Inc, the Property was in excellent Relationship: Any Borrower LLC condition with no deferred maintenance noted. The subject is located on the northwest corner of Main and Any Street. Main is a Loan # 100351 major north-south arterial roadway connecting with downtown Anyros approximately 1.5 miles to the south. The subject enjoys NAV NAV good visibility and exposure from its corner location and is within walking distance to local amenities and adjacent golf course. Loan Data As of 7/31/09 CURRENT PORTFOLIO DATA (From File Document Diligence) Loan Data greater Anyros, New Mexico area offers approximately 20 hotels and motel properties offering Prin Balance of Unfunded Amt Dataand Owned The 8/14/2009Loan # Borrower Bank Code Curr a variety DATA REFERENCED IN UNDERWRITING (From Original Part % limited service Tape) Purch / Sold Part Balance Sold Loan Type Loan Purpose extended Original Date Nxt Pmt Due Date to available market resources, current economic trends # DPD stay amenities. According Current Maturity Accrued Interest LLC or Adjust. 100351 Any Borrower Fixed Interest Rate 1234 will $2,514,853.67 result$0.00 continue to Margin Index decline Next Interest in in100.00% RevPAR throughOwned at which time marketEstate Wholly 2011, Original Term PPP (Y/N) NAP Real sources anticipate that the hotel market will bott Purchase/Acquisition Date Rate Adjustment Date (Months) Based on the most recent3/1/2009 2/3/2006 appraisal dated 5/20/2005, $14,228.02 the property was valued at $5,000,000.00. Adjustable 8.647% 3.50% 2/3/2011 300 Y Loan Data (continued) As of 7/31/09 Loan # Borrower I/O Term Curr Total Monthly Next P&I Adj. Date Sub. Debt Amount Balloon Amount SBA Gty. Gty. % FSA Gty. Gty. % MR NOI Payment Loan Data (continued) 8/14/2009 BORROWER & GUARANTOR SUMMARY MR NOI Date MR NCF MR NCF Date Current100351 DSCR Any Borrower LLC NAV NAV 3/1/2011 $1,229,908.00 $0.00 NAP NAP $0.00 The Borrower is Any Borrower LLC. The sponsors, John Doe and Jane Doe, signed a full guaranty as additional collateral for the loan. Additionally, J&J Transportation signed full guaranties. The Borrower also signed an environmental indemnity agreement. Loan Data As of 8/14/2009 DATA REFERENCED IN UNDERWRITING (From Original Data Tape) Loan # Borrower Bank Code Curr Prin Balance Unfunded Amt Part % Owned Purch / Sold Part Balance Sold Loan Type Loan Purpose Collateral Data 7/31/09 (Collateral Pledged Under Loan - From File Document Diligence) # Units Original Appraised Original Appraisal Gross MR 10 - Commerical 100351 Net MR Appr Value LLC Any Borrower Original LTV Current LTV 1234 MR Appr Date $2,528,927.40 Lien Position $0.00 Senior Lien Amt 100.00% Occupancy % P Occupancy Date $0.00 3 - ACQUISITION OF HOTEL Value Date Appraised Value real estate 80 $5,000,000.00 12/20/2005 Loan Data (continued) NAV NAV As of 8/14/2009 1 $0.00 NAV NAV Loan # Borrower I/O Term Curr Total Monthly Next P&I Adj. Date Sub. Debt Amount Balloon Amount SBA Gty. Gty. % FSA Gty. Gty. % MR NOI Payment 100351 Any Borrower LLC $21,646.81 3/1/2009 Collateral Data As of 7/31/09 (Collateral Pledged Under Loan - From File Document Diligence) Loan # Type of Project Collateral Collateral Collateral Collateral Zip Code Year Built / Year Cross Cross Sq. Ft. Address City State Renovated Collateralized Default 100351 Lodging 1234 Any Street Anyros NM 88201 1999 / NAV N N 48,637 Sample Deliverables detailed herein are representative examples only. Pertinent details have been intentionally changed, deleted, or distorted to protect Client privacy and confidentiality.
  • 24.
    24 www.galeaadvisors.com © Copyright 2009 Galea Advisors, Inc. All rights reserved.