Download to read offline


![Page 35
January 24, 2011
Industry Report
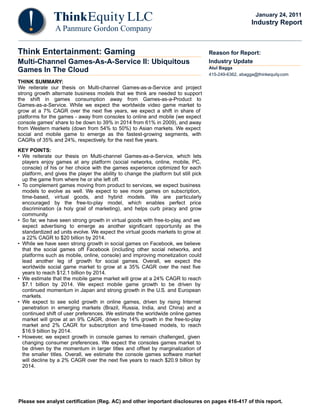
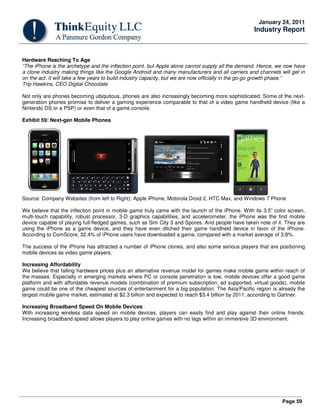
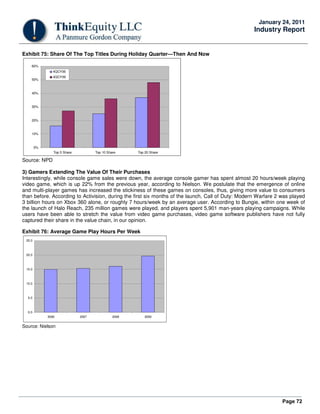
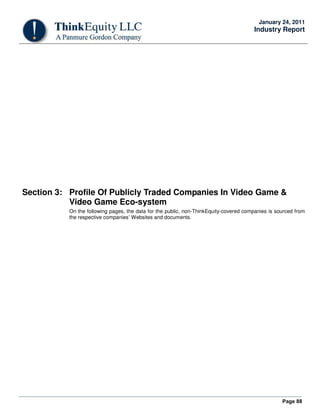
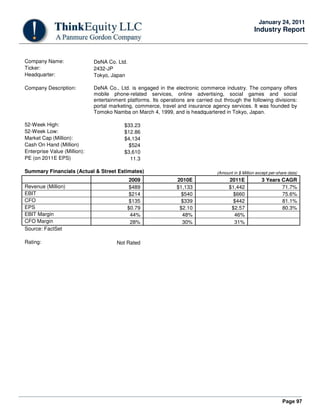
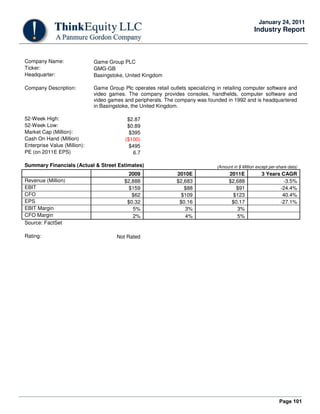
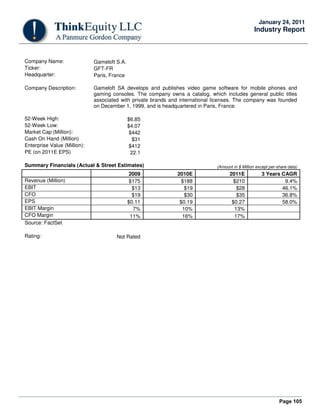
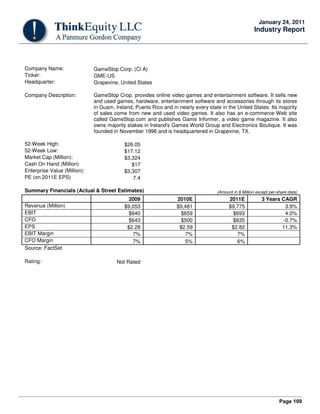
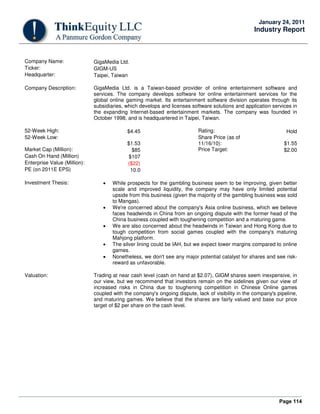
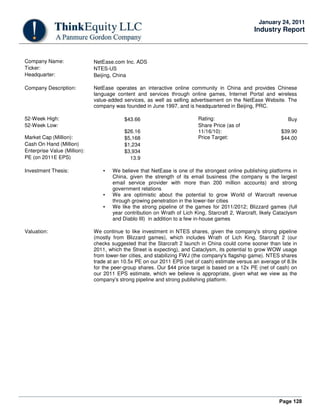
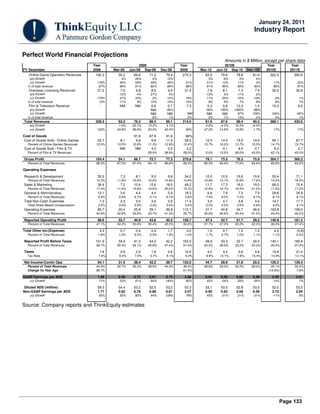
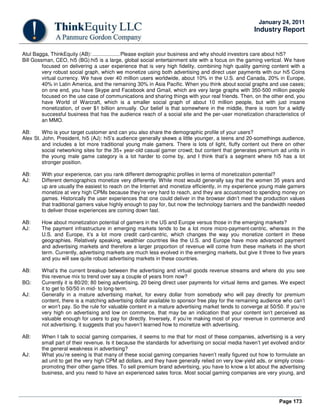
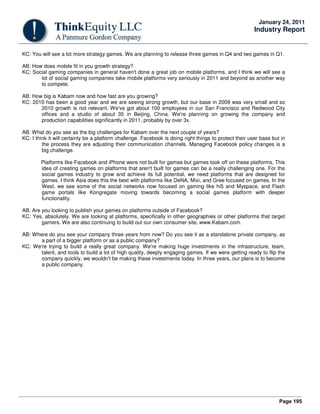
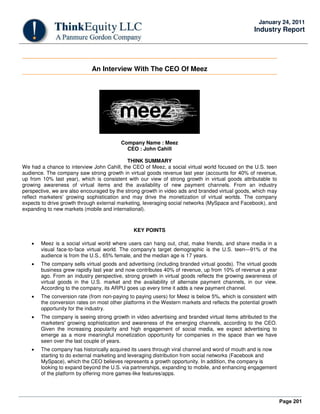
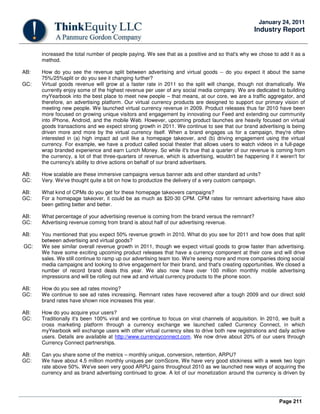
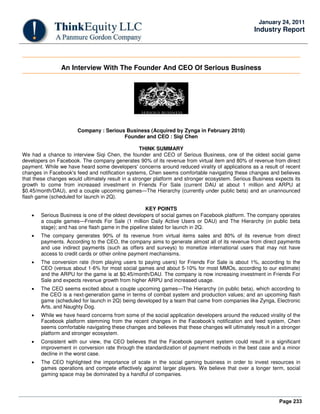
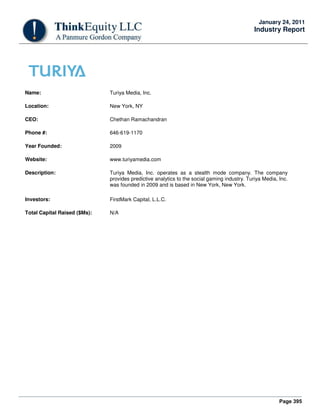
Why Are We Excited About Social Games
“With over 50 foreign cars already on sale here, the Japanese auto industry isn't likely to carve out a big slice of the U.S.
market.”
Business Week, August 2, 1968.
“For the first time ever, we're letting them [users] engage in games with their real friends in their real social networks.
Gaming is a fundamentally social experience, not a single-player experience, and not a technology experience. We are
bringing gaming back to its roots.”
Mark Pincus, Founder & CEO, Zynga
“Today, audiences want to be connected. They expect games to have a strong social component and they want the ability
to customize and express themselves through their entertainment experiences.”
Bobby Kotick, CEO, Activision-Blizzard
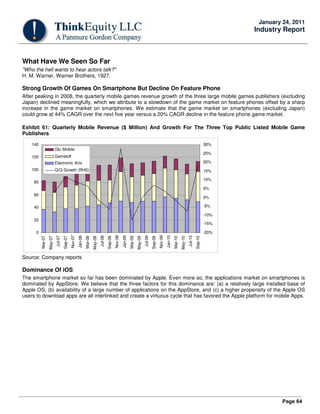
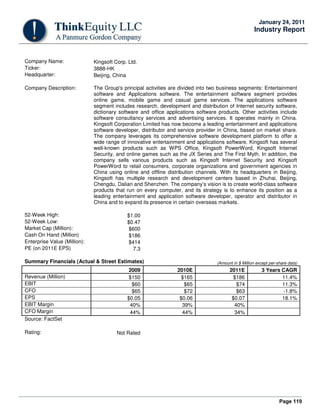
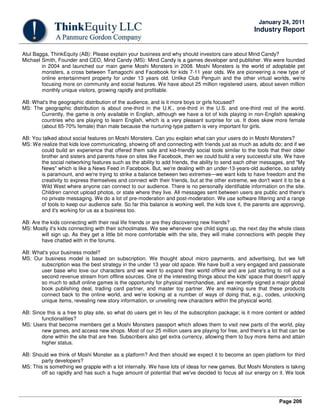
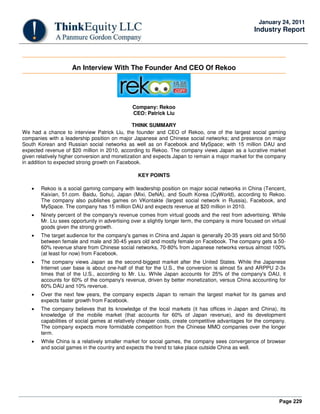
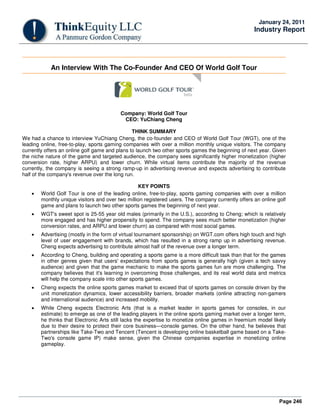
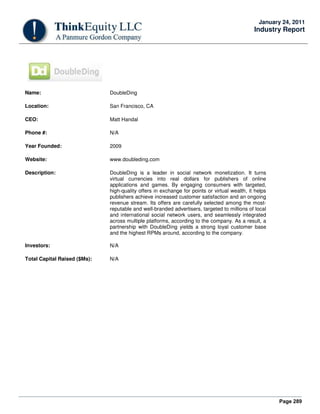
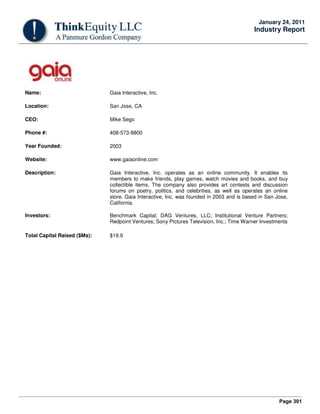
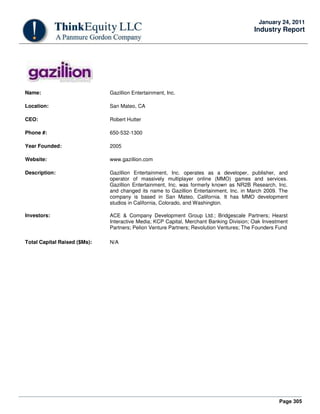
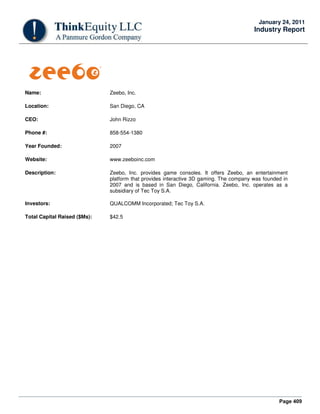
Broadening Market To Include Non-Gamers
“Target customer is anybody who lives inside the social networks….Facebook has users from 13 to 80 years old and it
has equal distribution between men and women…In our markets we have 300-plus million people on Facebook
alone….While hardcore gamers, like a World of Warcraft have limited reach, games like a Maple Story or a Mobsters 2 or
a Sorority Life game reach much broader demographics.”
John Pleasants, CEO, Playdom
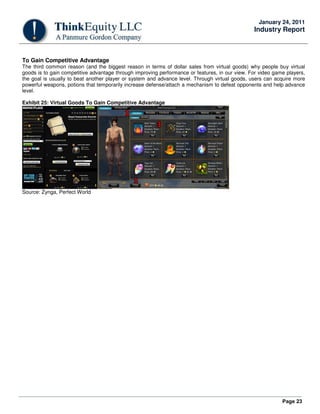
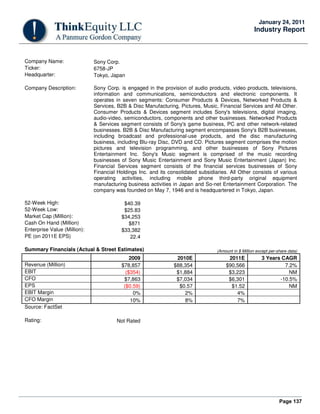
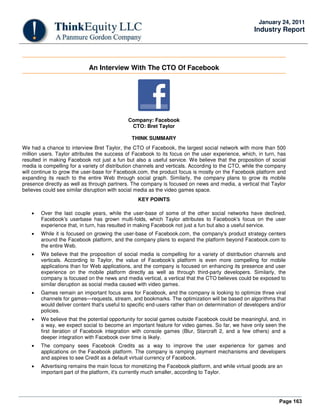
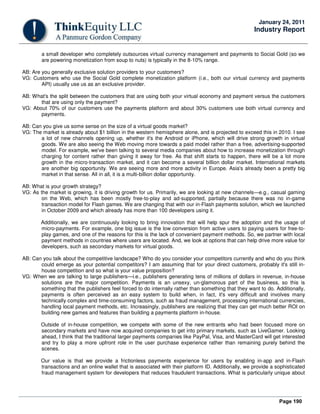
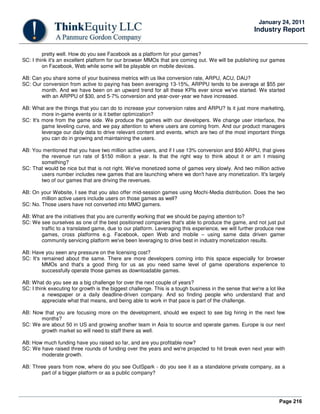
We believe that similar to the Nintendo Wii, which broadened the console game audience to families from mostly males,
social games further broaden the game market to include non-gamers. Today’s generation is connected on social
networks. According to comScore, more than two-thirds of Internet users are also on social networks, and the number is
still growing. The popularity of social networking sites is not just limited to the Y generation, more and more people 35
years of age and older are joining these social networks. The latest statistics regarding Facebook users show that the
number of users in the 35-54 years of age population has increased 10x versus 88% growth for the 18-34 years of age
group since October 2007. Not only are more people joining these social networks, but they are also spending more time
on these social networks. According to Hitwise, the average user is now spending approximately 27 minutes/day, up 71%
Y/Y. We believe the reach and the demographic of users on these sites make social networks fertile ground for game
vendors to acquire users, build awareness, and create buzz through viral marketing.
Viral Marketing
“Over 95% of our growth is viral. In fact, when we launched our first title a year ago, we started by inviting 100 of our own
friends and we've grown from there to over 60 million registered players across our games organically.”
Kristian Segerstrale, CEO, Playfish
For online game vendors, social networks offer an inexpensive way of marketing their games to new users and improve
stickiness through viral distribution. We believe that social networking sites level the playing field for small developers to
compete with large companies like Electronic Arts (recall the success of Scrabulous, developed by two brothers in remote
corners in India, which became a rage on Facebook through viral marketing).
For social networking sites, games provide an easier way to monetize their users, in our view.
Despite significant size, strong community, and solid ecommerce platforms, most social networks have struggled with
monetizing their users. With ARPU hovering in the $0.10-0.25/month range for most social networks versus as high as
$150/month for some online games, social networks do look under-monetized. Most social networks rely largely on
banner and text ads for user monetization, but, given low conversion rates (less than one-tenth of a percent), display ad
rates for most social networks hover at about $0.10-0.25 cost per thousand (CPM) versus as high as $35 for video ads
and $8 for display ads for in-game advertising. We believe that online games provide a natural way for social networks to
monetize users through in-game advertising and, more importantly, through virtual goods sales.](https://image.slidesharecdn.com/9f3e0384-5c68-4280-87ab-c09a5a0212d7-150425212220-conversion-gate01/85/GaaS-Whitepaper-2011-35-320.jpg)

![Page 52
January 24, 2011
Industry Report
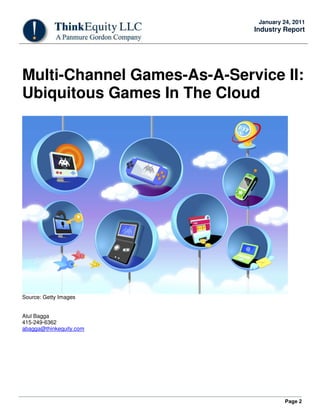
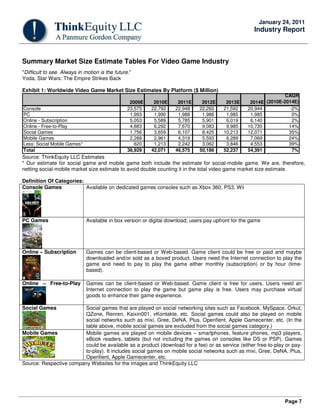
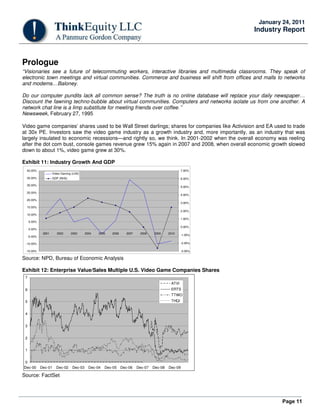
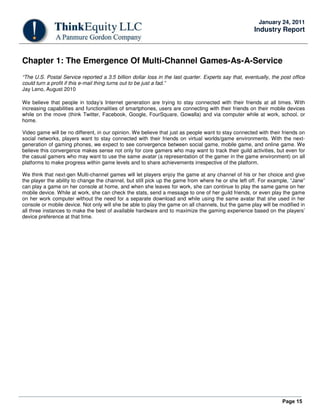
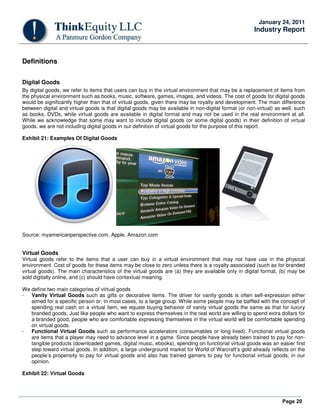
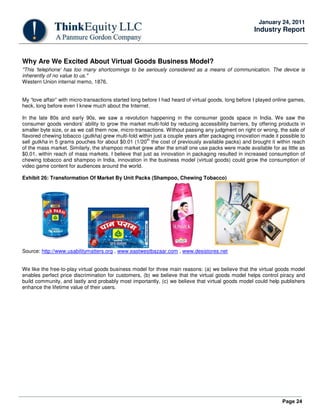
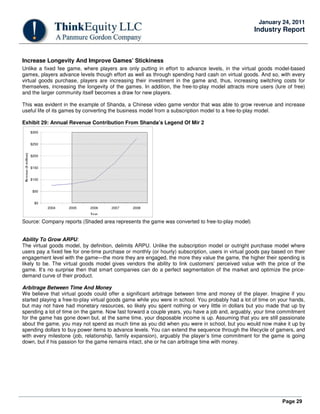
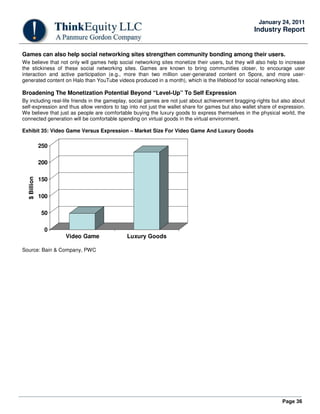
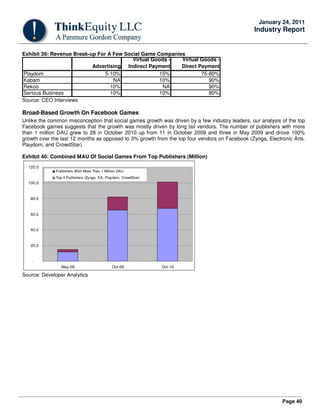
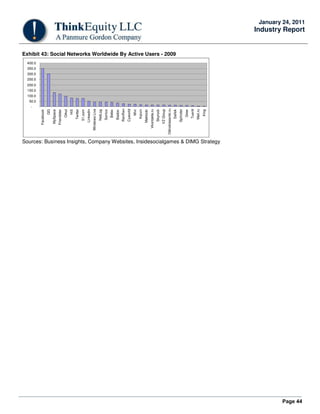
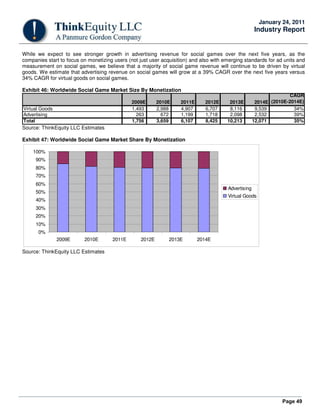
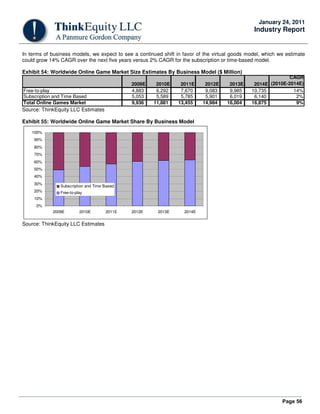
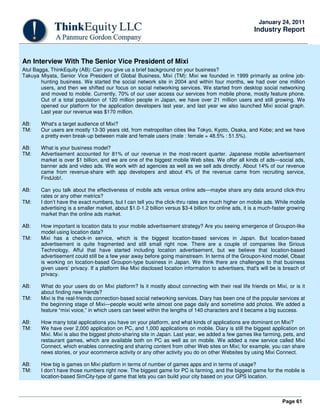
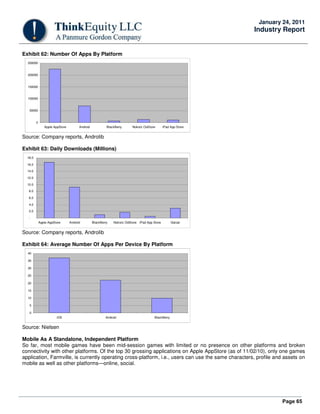
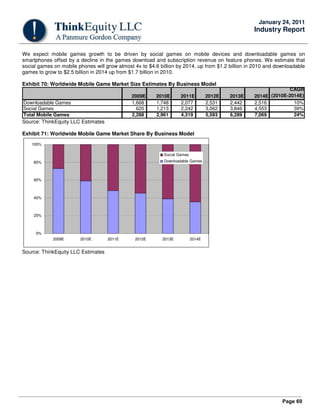
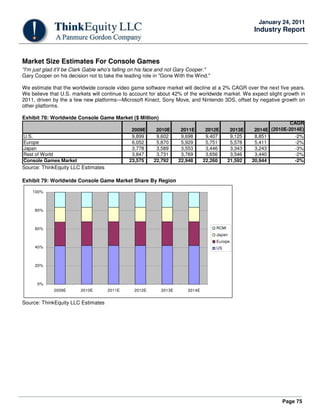
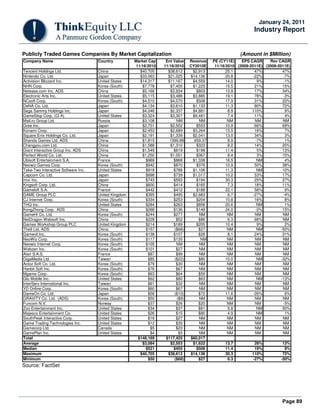
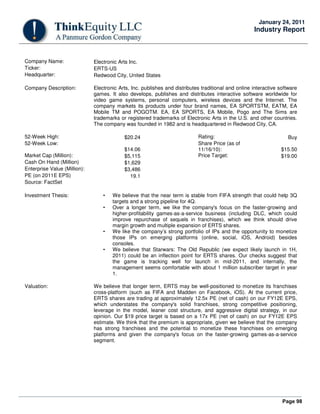
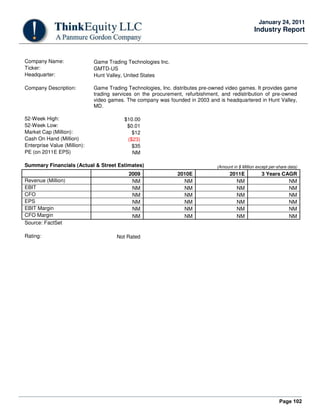
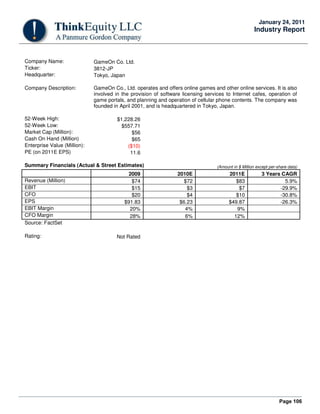
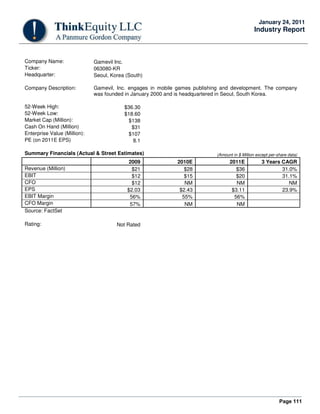
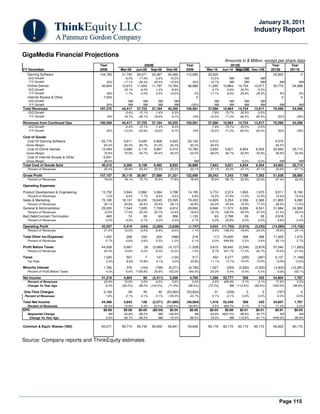
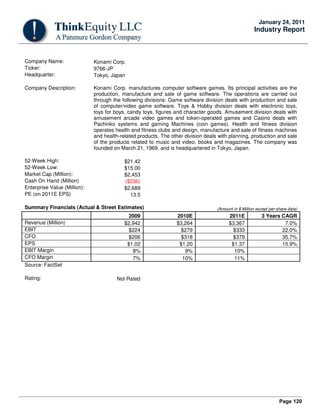
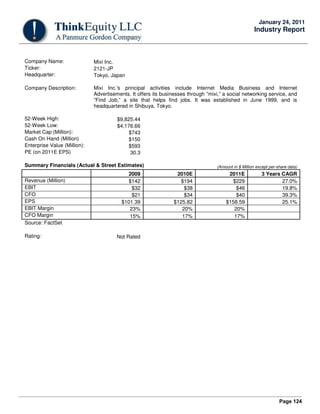
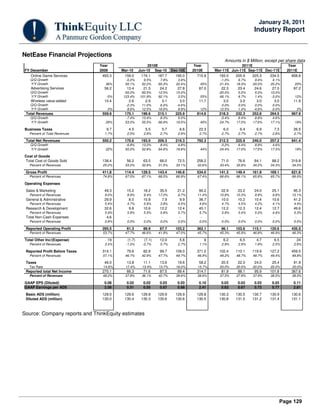
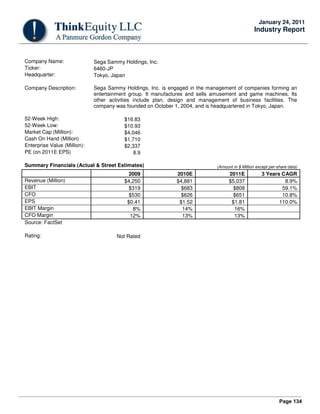
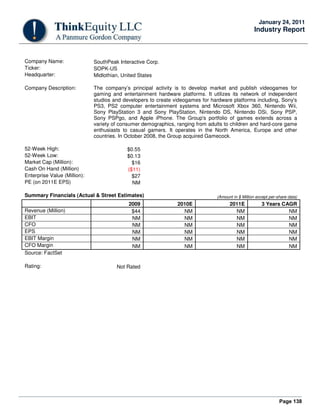
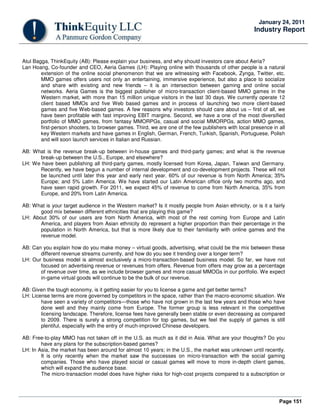
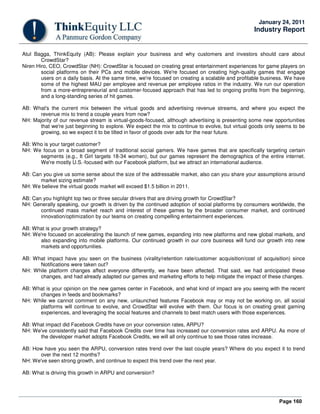
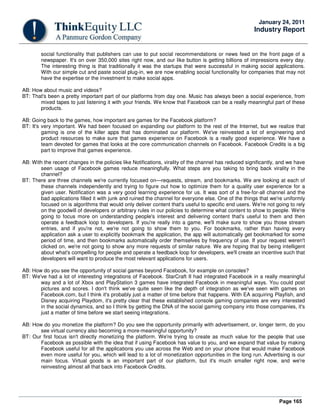
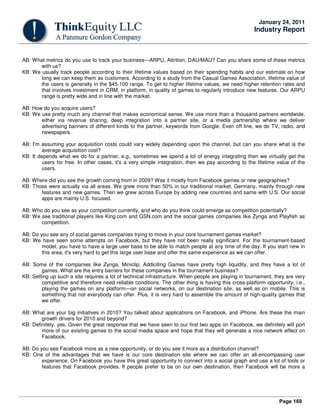
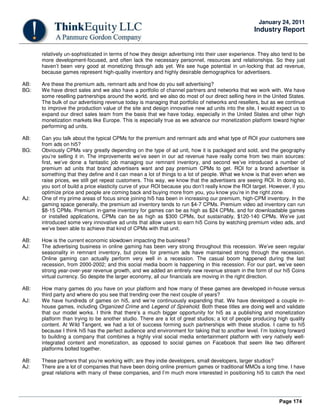
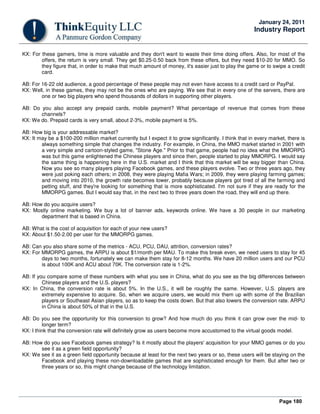
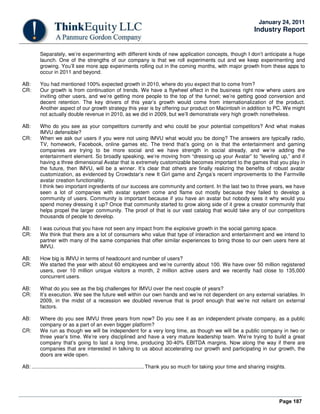
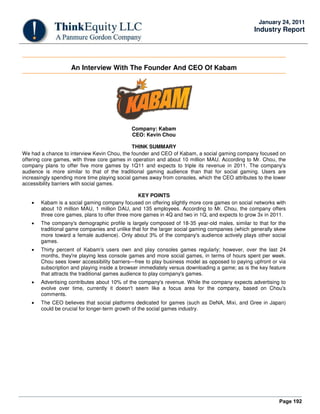
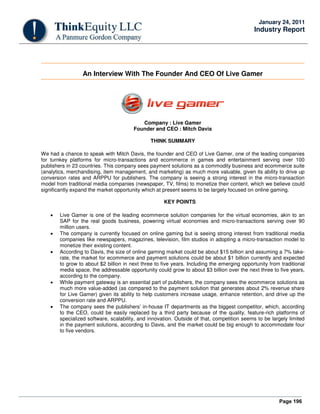
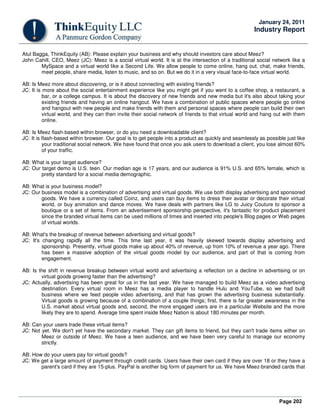
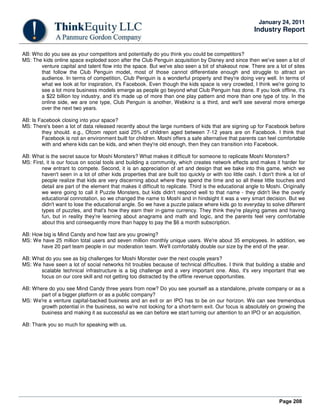
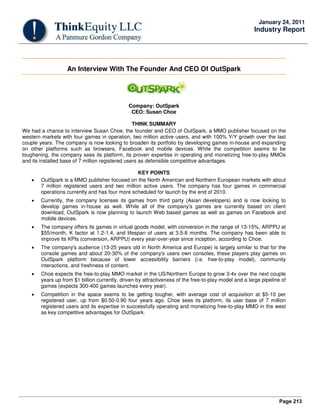
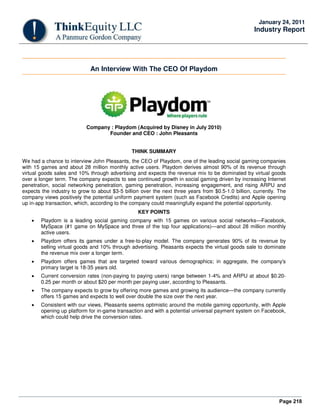
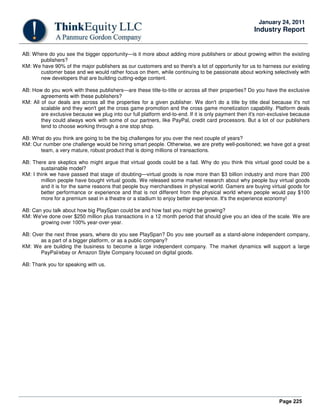
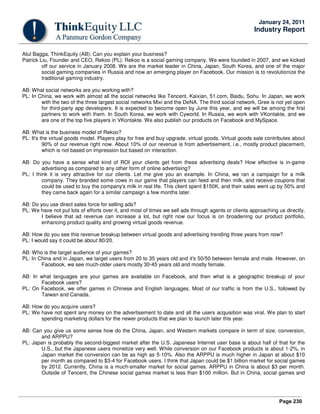
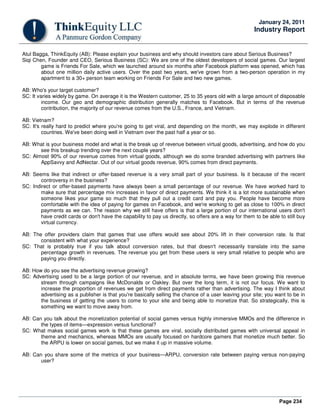
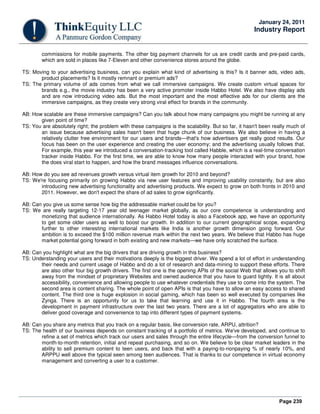
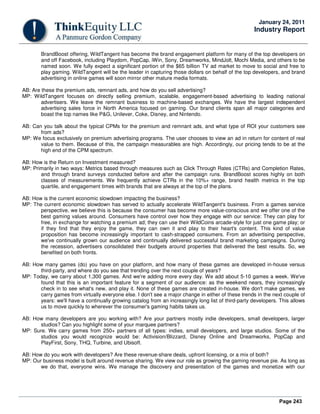
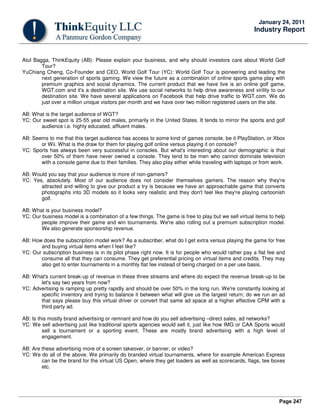
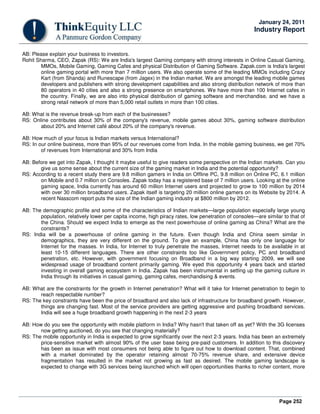
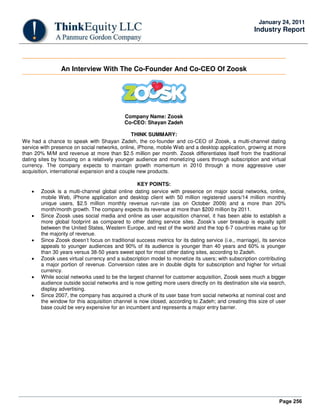
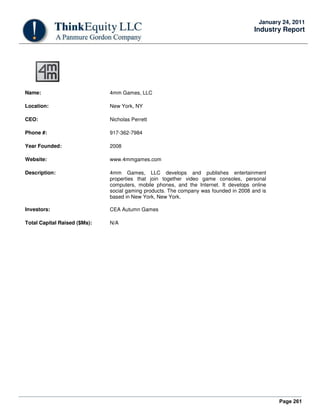
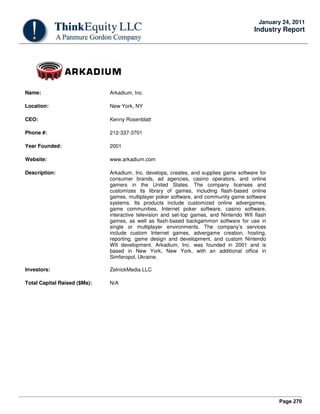
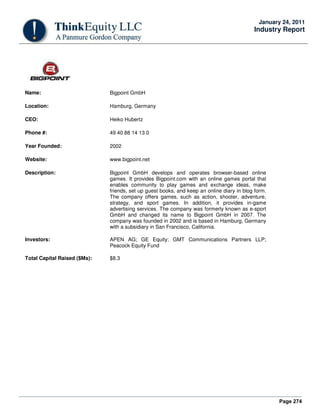
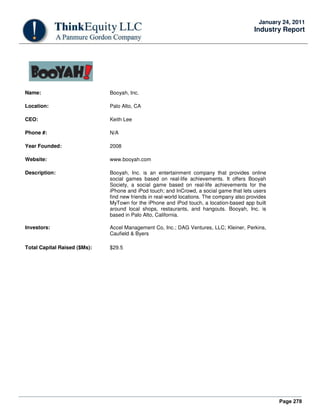
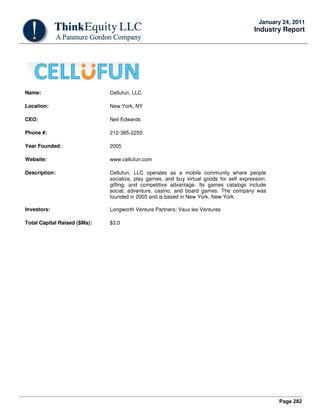
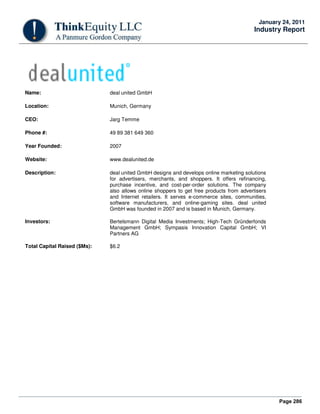
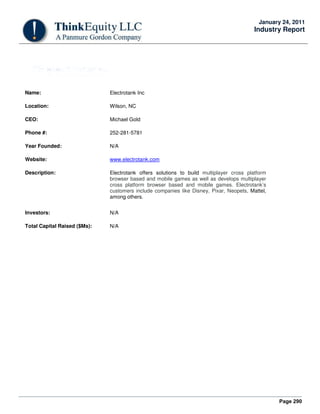
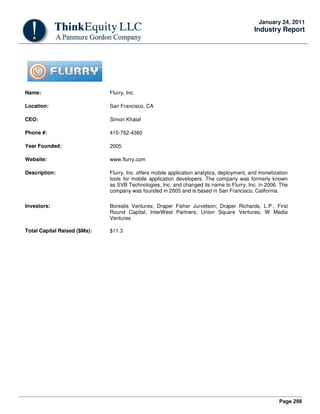
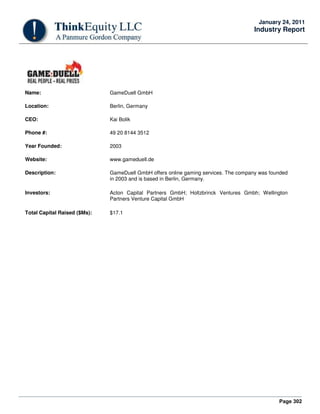
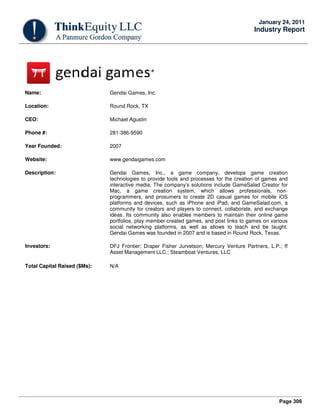
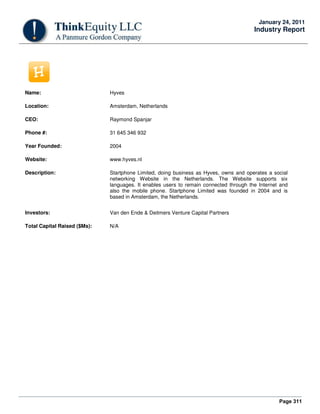
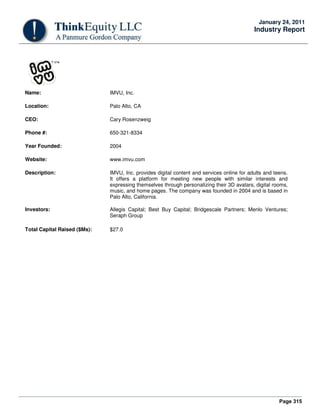
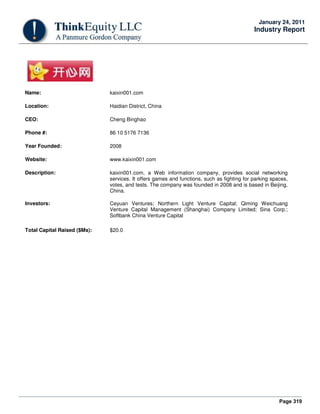
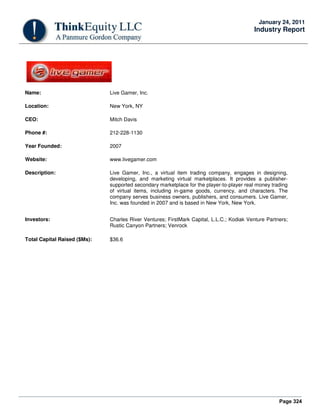
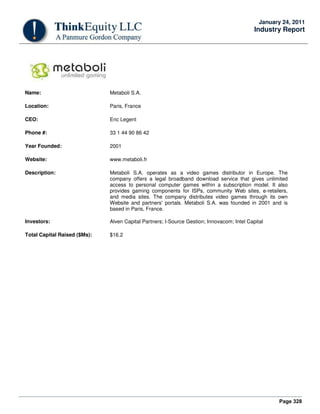
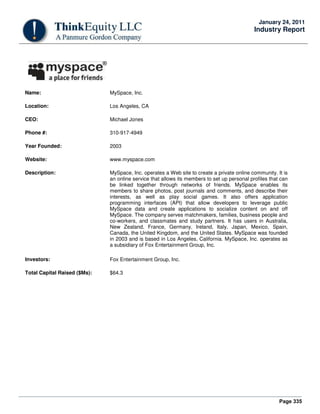
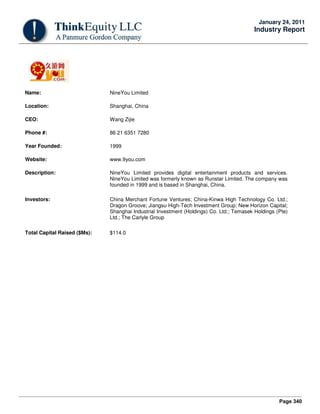
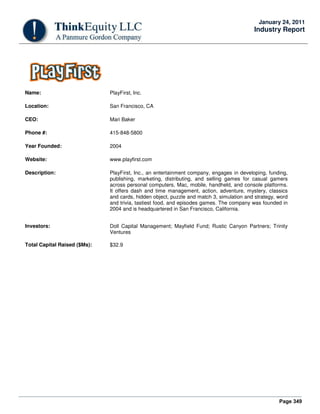
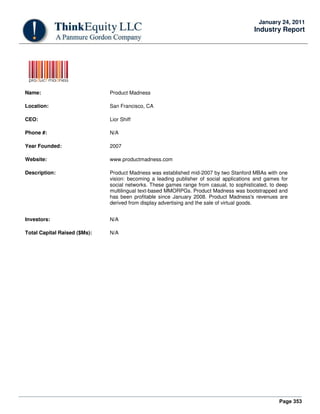
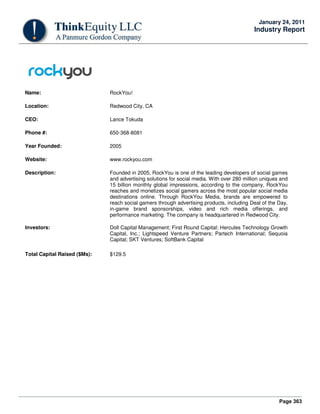
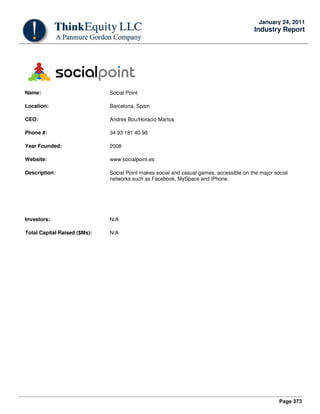
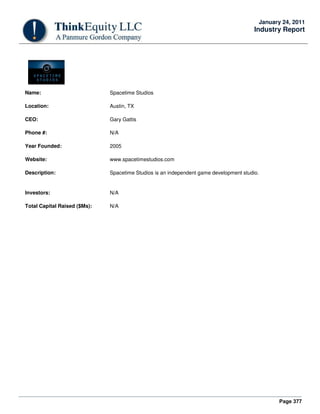
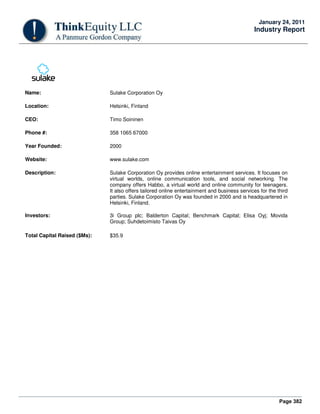
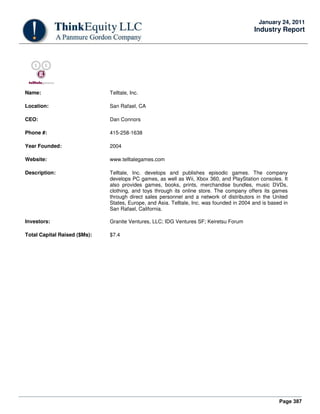
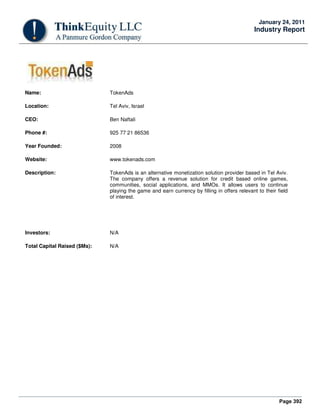
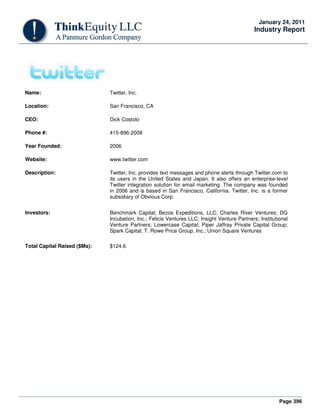
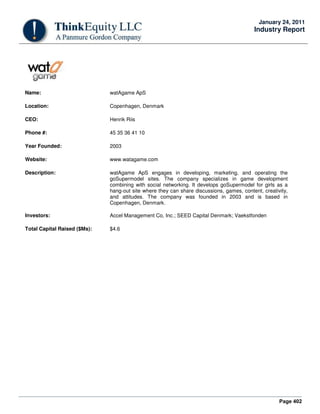
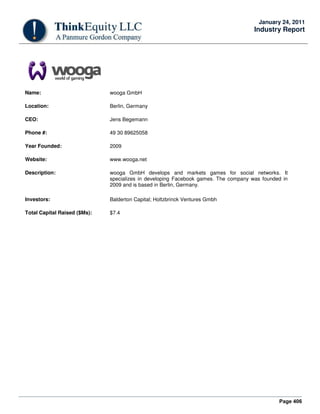
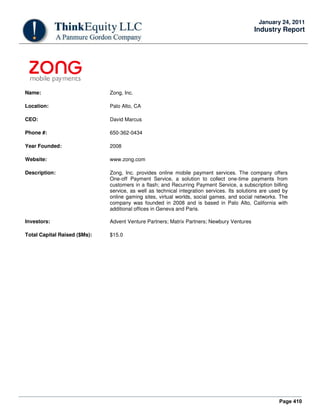
Exhibit 50: Sample Of The Immersive 3D Experience With Online Games
Source: Company Websites (clockwise from top left): World of Warcraft by Blizzard, Star Wars: The Old Republic by
Electronic Arts, League of Legends by Riot Games, and Uberstrike by Cmune
Reduced Cost Of Ownership For Consumers
If you are like most gamers, you will want to play at least 20-30 different games per year, you will want to own all the
major consoles, and you will need to buy a new generation console every three to four years to play these games in their
full glories. That works out to an annual spend of about $2,000-2,500 per user on games, which might be out of budget for
many gamers. Even more importantly, although the marginal entertainment value of every next game for a user is
arguably lower than that of the previous game that he/she owned, the marginal cost remains the same. And, as a result,
most gamers end up buying about four to five titles (about $250-300) per year. Since Games-as–a-Service enables
players to pay as they go, a player doesn’t have to buy all 30 games (that she wants to play) at $60 apiece. Rather, the
user can play all the games only as much as he/she wants to play and pays only for as much as he/she plays. Game
companies should benefit as many players, for whom a marginal $60 investment for the 10
th
game didn’t make sense, will
now be willing to open their wallets for not only the 10
th
best game but also for 11
th
, 12
th
, and all the games that they would
not have bought.
Avoid Buyer’s Remorse
“For the premium [subscription] offer, they [subscribers] play ten different games a month; for the basic offer, they try or
play four to five games a month. … They try them, and concentrate on those they really like, which is the interest of this
service. Our customers don't have the stress to choose one game among the others in the shelves, which is a bet,
because every gamer has made several times the wrong choice. A game is very personal; the packaging does not tell you
what is really inside the box, and the game reviews, and friends' recommendations, only limit the risk to make the wrong
choice.”
Thibaut de Robien, Cofounder of Metaboli
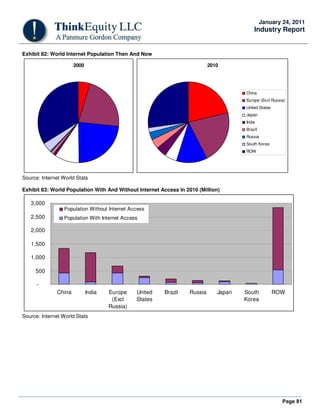
And then there is always the case of buyer’s remorse, players getting stuck after buying a game because the game was
not really their type. The problem is exacerbated for kids’ games, as these players arguably have a lower attention span.
With Games-as-a-Service, players are paying only for their playtime and, therefore, avoid buyer’s remorse. Not only that,](https://image.slidesharecdn.com/9f3e0384-5c68-4280-87ab-c09a5a0212d7-150425212220-conversion-gate01/85/GaaS-Whitepaper-2011-52-320.jpg)
![Page 53
January 24, 2011
Industry Report
Games-as-a-Service enables the vendors to offer “Try and Buy”—the idea is to offer a free trial for a limited time, and if
the player likes the game, he or she can either buy unlimited play or enroll in some other form of game subscription. By
offering a free trial, the vendor can cast a wider net and players who otherwise may not have bought the game, may now
try the game and eventually convert to become paying customers. Furthermore, since the players have already tried the
game before making a monetary commitment, the buyer’s remorse is limited, resulting in fewer returns and fewer
customer service calls.
Improved Efficiency With Digital Distribution
“There's a shift and a disruption going on in the games industry that had for so long relied on producing very expensive,
high budget games, and when these big budget games fail, developers go out of business. The times are changing. Now
solo game developer and hobbyists can develop a game in their spare time and find an audience through sites like
Miniclip and they don't have to get involved in this very complex, hierarchy of distributors and publishers.”
Robert Small, Founder & CEO, Miniclip.com
In the traditional packaged game distribution channel, since the shelf space is limited, retailers are willing to assign the
premium shelf space only to the super-hyped, highly anticipated, AAA games. As a result, most of the smaller or second-
tier titles are either left out for non-premium shelf space where they have limited visibility from walk-in customers or, even
worse, these titles may not get any distribution deals. This creates a Catch-22 situation for smaller titles—since they don’t
have the fire power of a AAA title, they cannot get the premium shelf to get the players’ attention, and since they don’t
have the players’ attention, they have even less chance to succeed. Not only that, larger video game companies mostly
focus on AAA titles that may appeal to broader mass markets, ignoring the needs for smaller niche markets, which creates
inefficiency in the market.
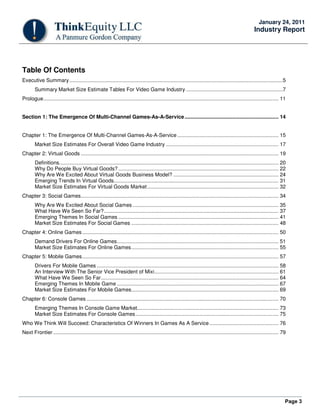
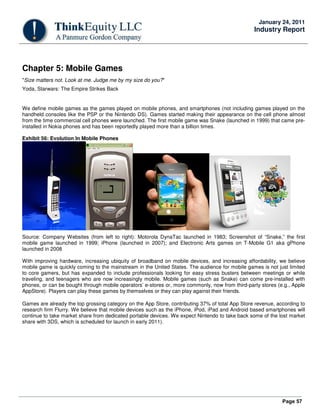
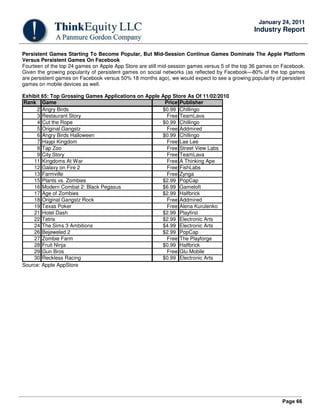
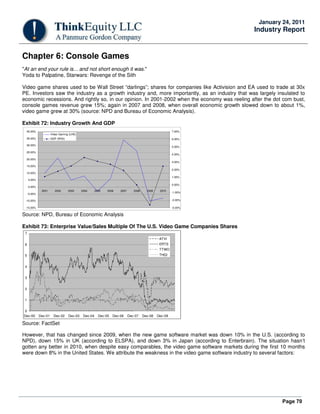
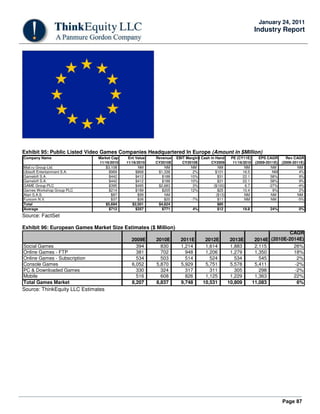
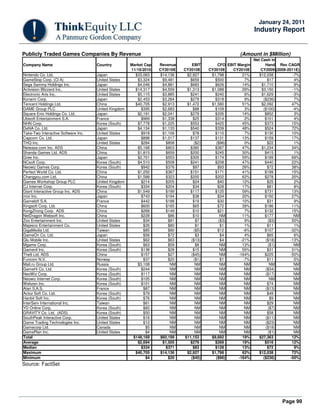
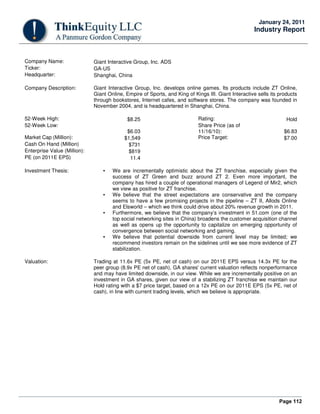
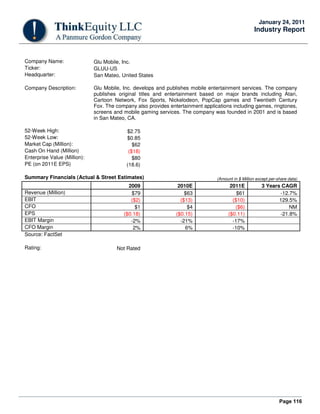
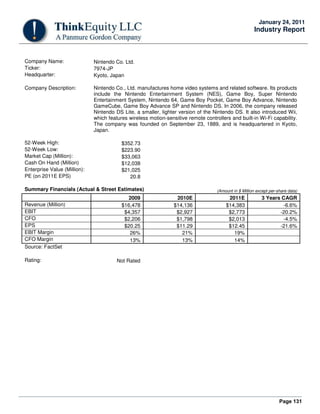
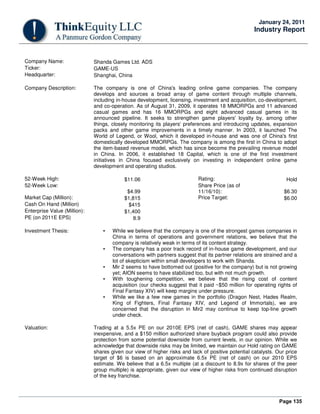
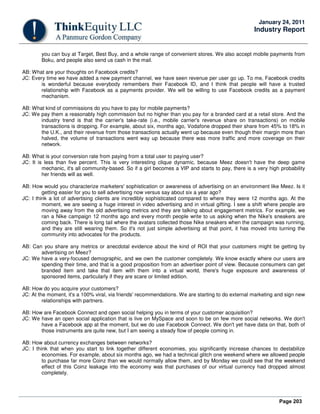
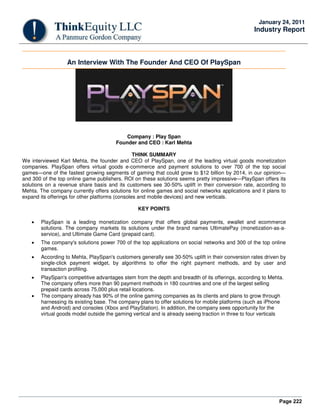
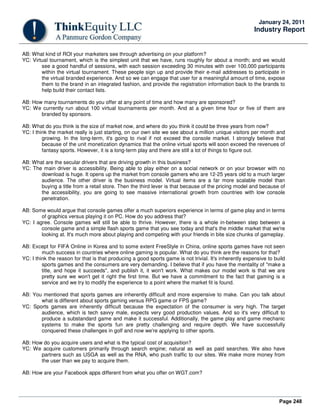
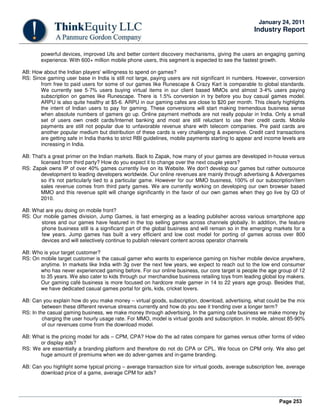
Digital distribution by definition breaks the barrier of limited shelf space, which makes the distribution to niche markets
financially viable. With digital distribution, vendors can publish titles focused on the smallest of the niche and use guerrilla
marketing or viral marketing to reach the desired segment efficiently. Digital distribution may also help expand margin for
vendors—as vendors save on the cost of medium, packaging, and slotting expenses.
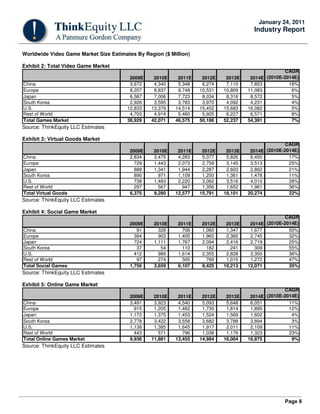
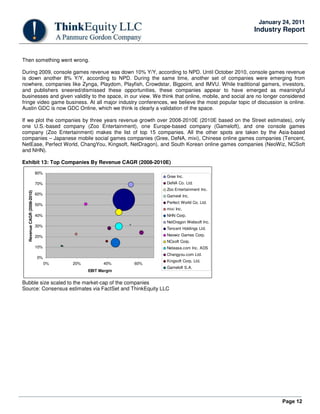
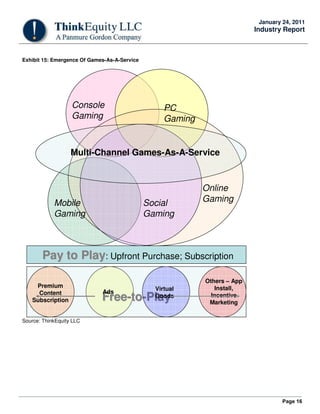
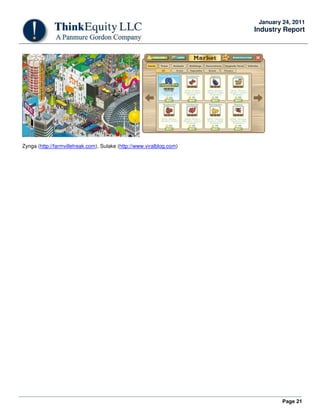
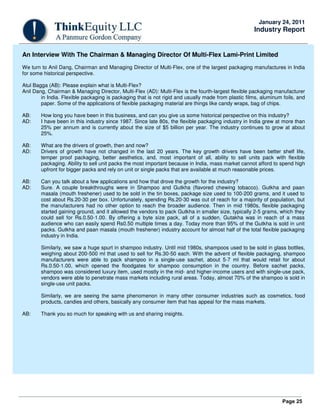
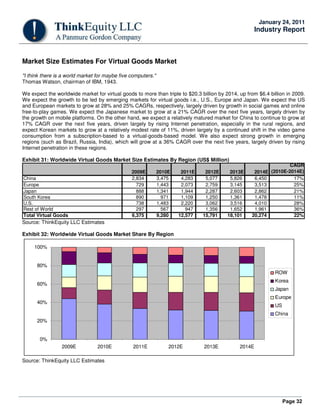
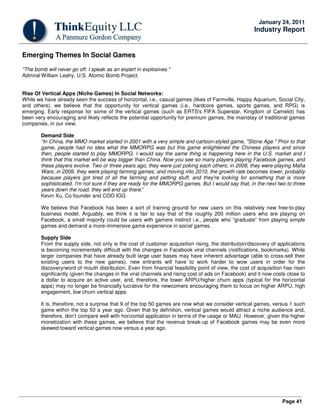
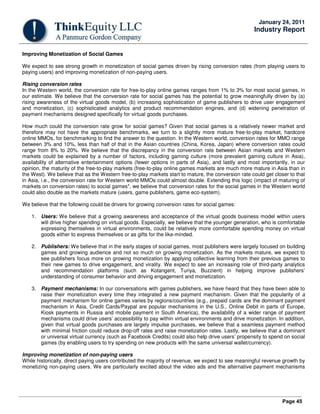
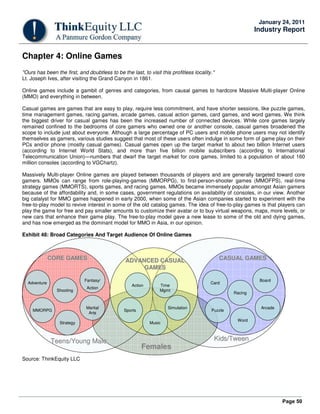
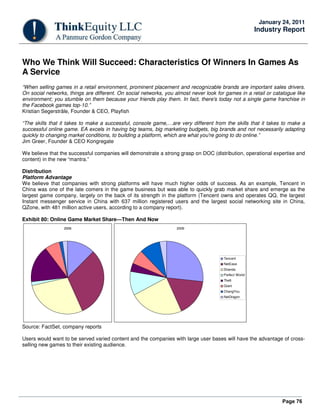
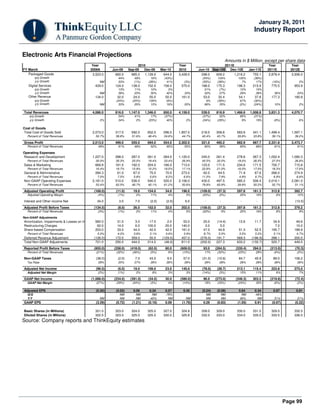
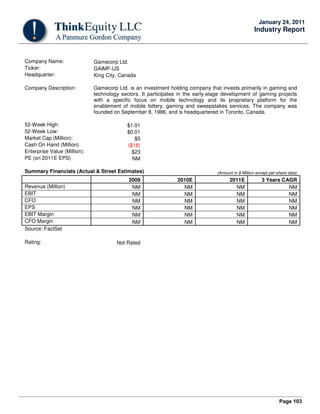
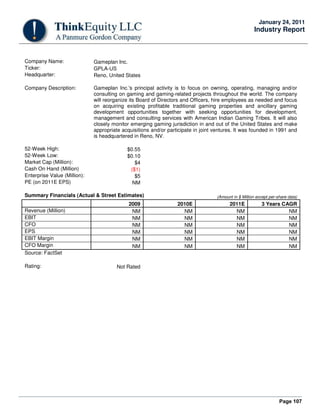
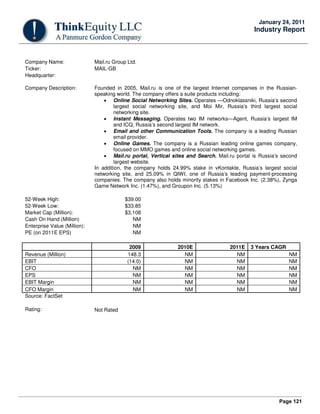
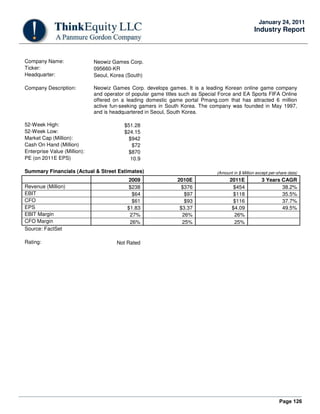
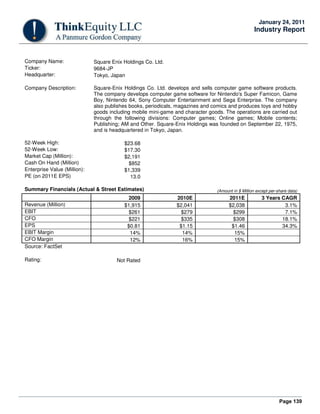
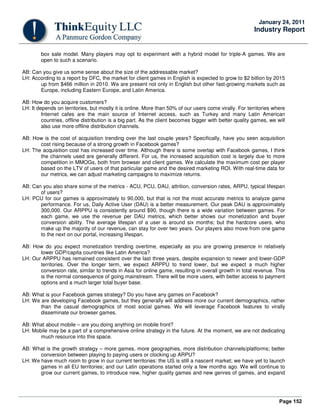
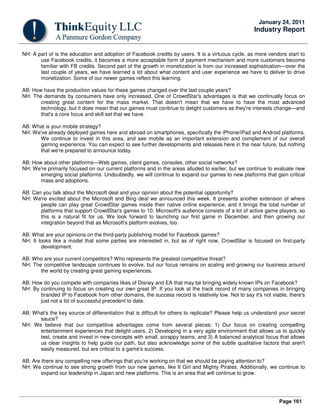
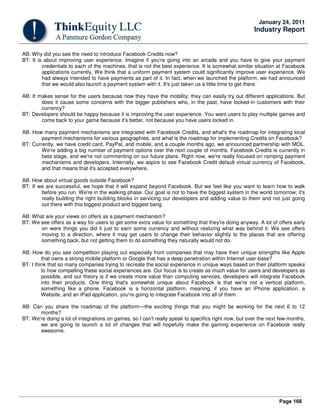
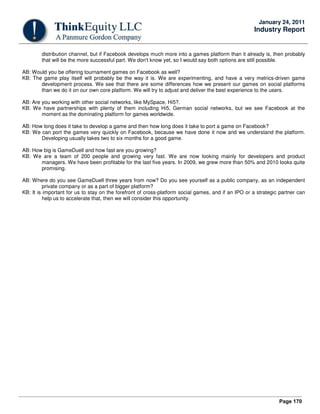
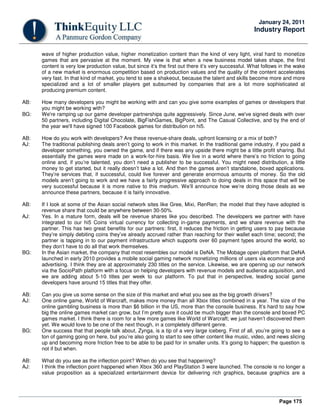
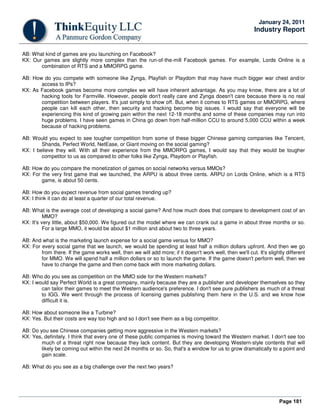
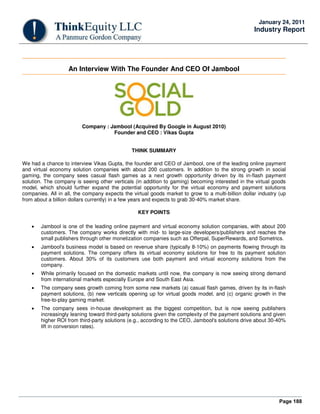
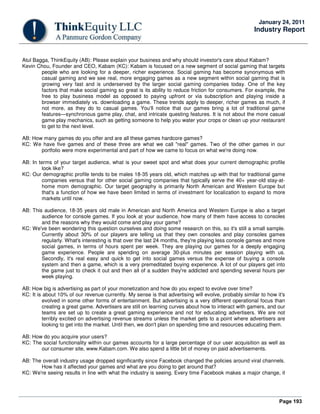
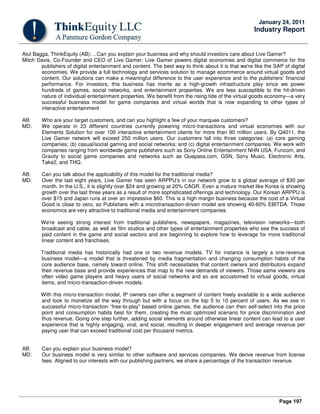
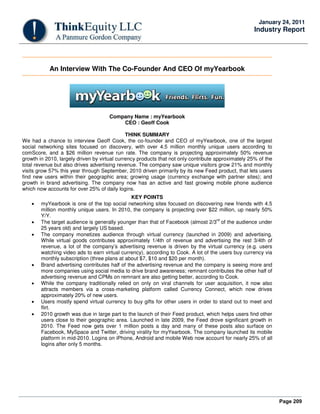
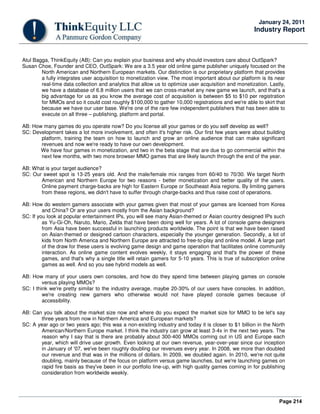
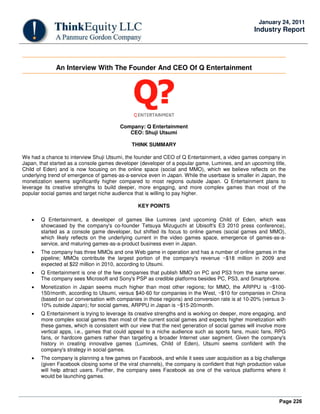
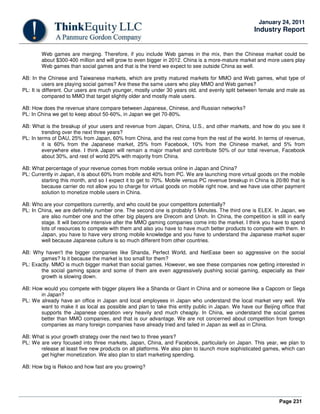
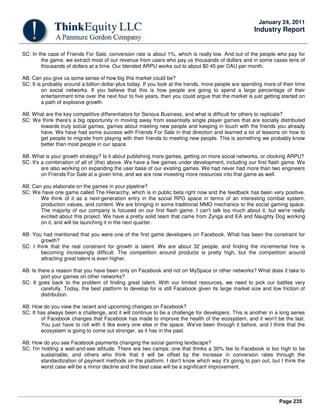
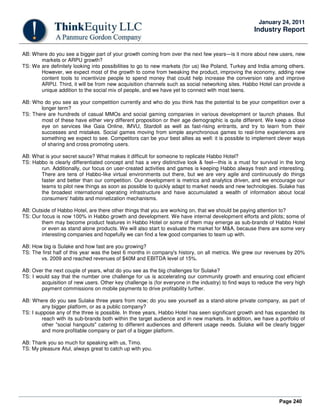
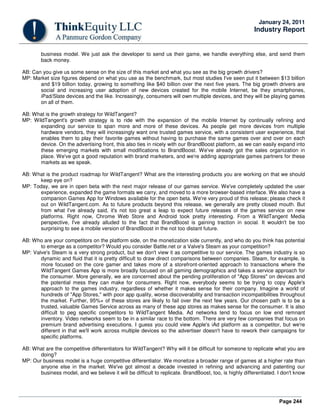
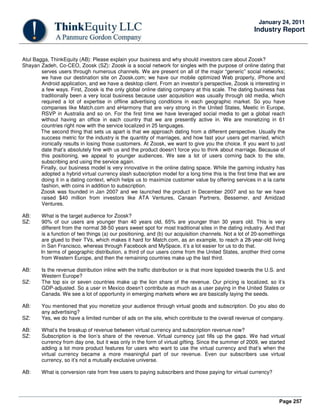
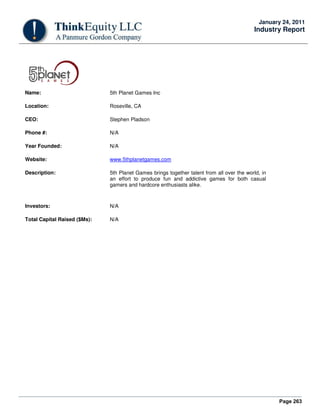
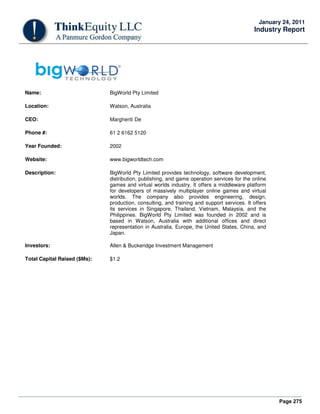
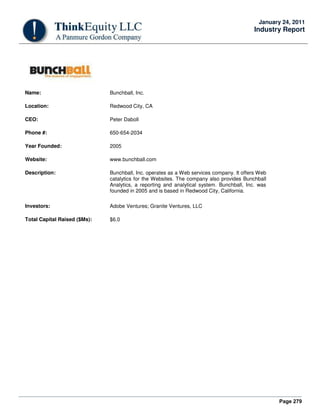
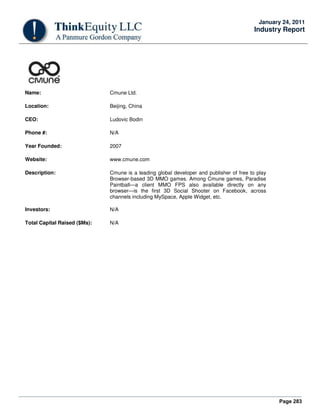
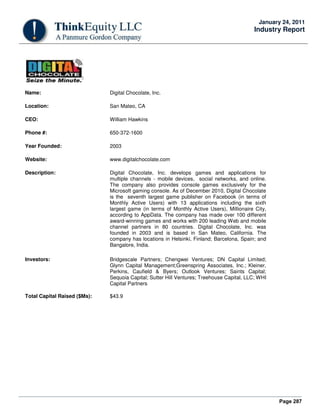
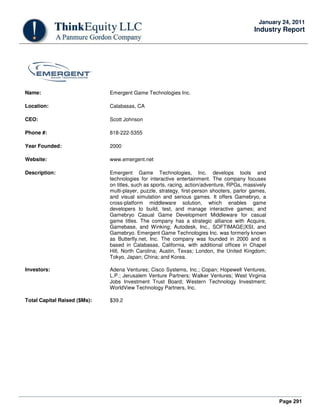
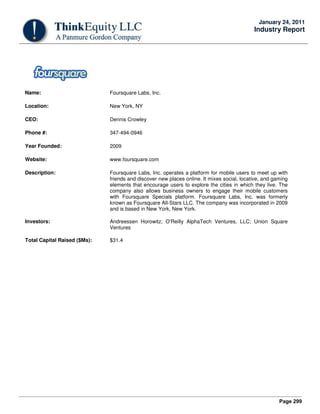
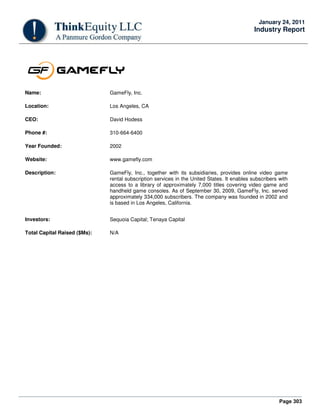
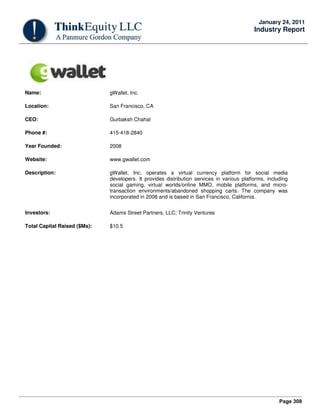
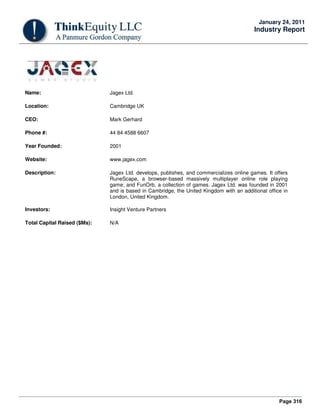
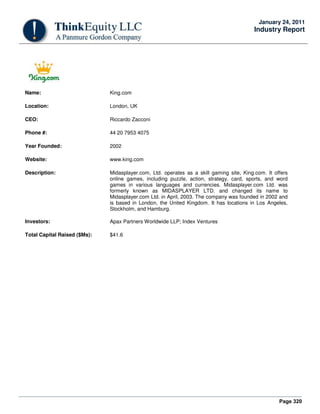
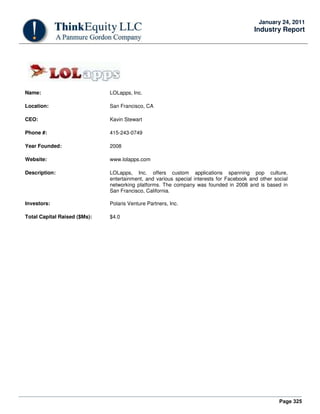
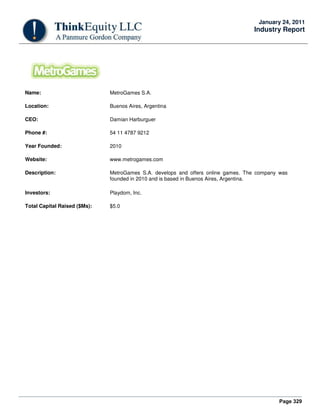
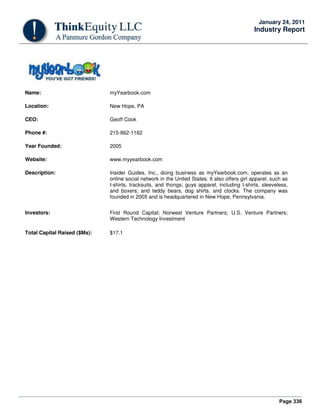
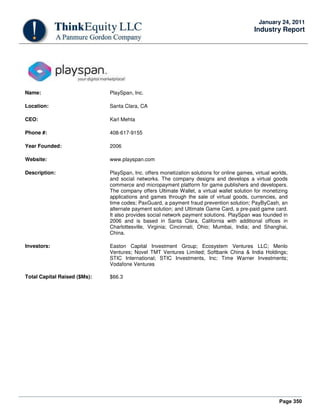
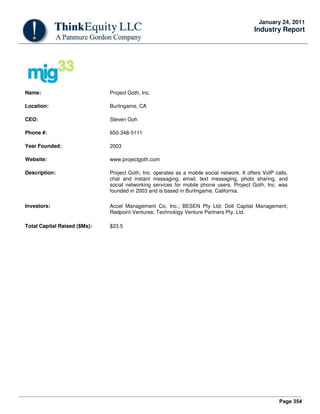
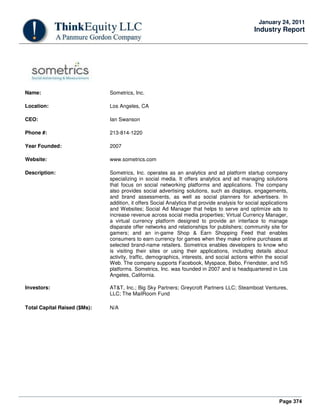
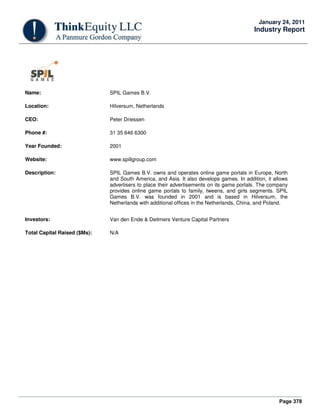
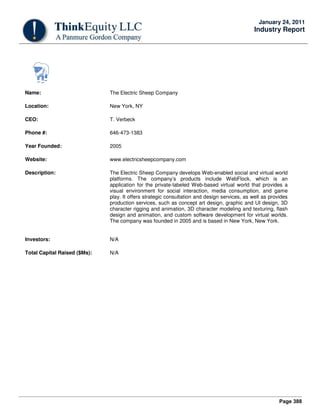
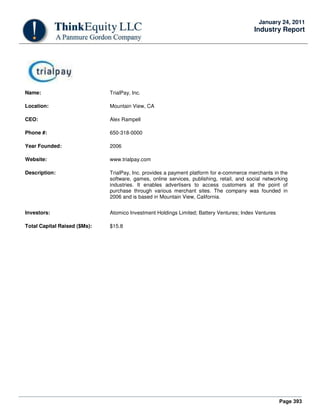
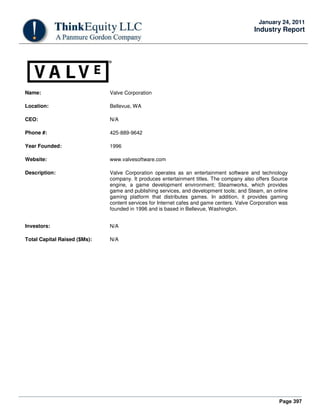
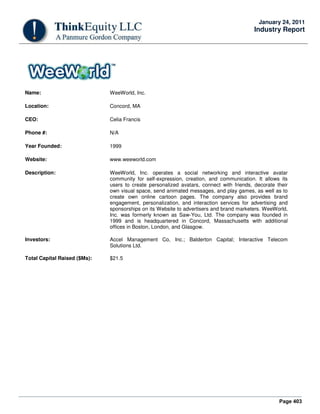
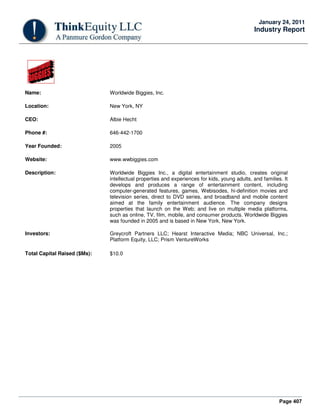
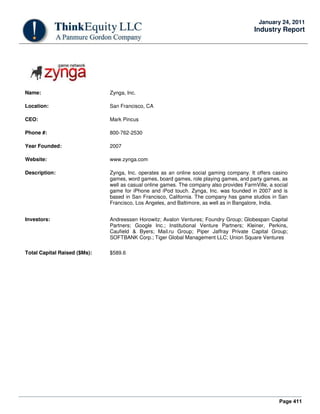
Exhibit 51: Digital Distribution Enables Reaching Out Long Tail
Rhapsody
Wal-Mart
Amazon.com
Barnes & Noble
Netflix
Blockbuster
Source: The Long Tail by Chris Anderson
Ability To Respond To Changing Consumer Demands
“It [online game] is more similar to a Web 2.0 business model than a pure video gaming business. The traditional video
gaming business companies are in a retail business where you ship games and then it's a one-off sale until there is a next
expansion or sequel. … We have a large number of experienced, dedicated, full-time employees whose job is to interact
with our gamers and generate revenues. We get gamers' feedback, their needs and wants and desires, and we funnel that
information directly toward our developer and then we update the game on a regular basis.”
Joshua Hong, CEO, K2 Networks
Video game is largely a hit-driven business, and predicting a hit or miss before a game launch is not an accurate
science—it is more of a guessing game. In the traditional video game business model, after a game is launched, there is
little that the video game vendors can do to fix issues with the game or make changes based on the users’ response.
735,000 Songs
2.3 mil Books
25,000 DVDs
39,000 Songs
130,000 Books
3000 DVDs](https://image.slidesharecdn.com/9f3e0384-5c68-4280-87ab-c09a5a0212d7-150425212220-conversion-gate01/85/GaaS-Whitepaper-2011-53-320.jpg)

![Page 60
January 24, 2011
Industry Report
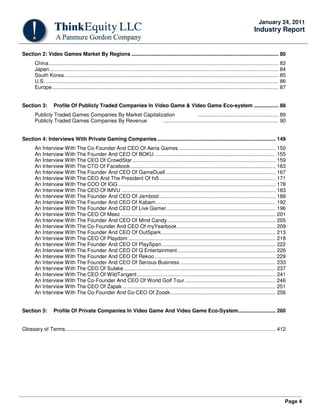
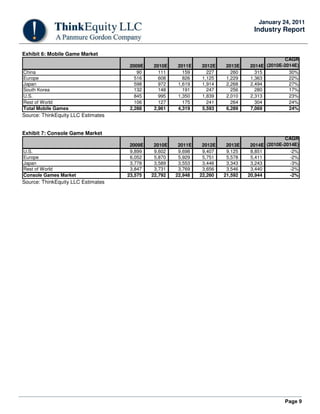
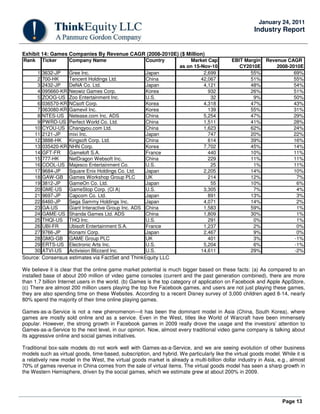
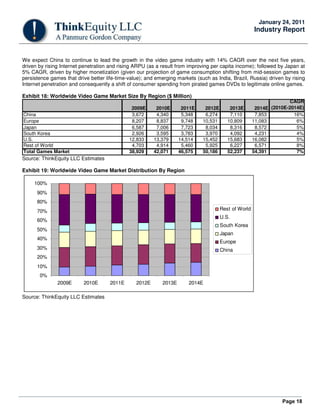
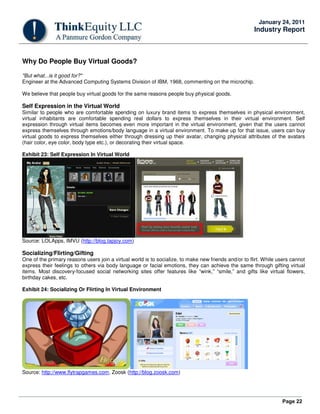
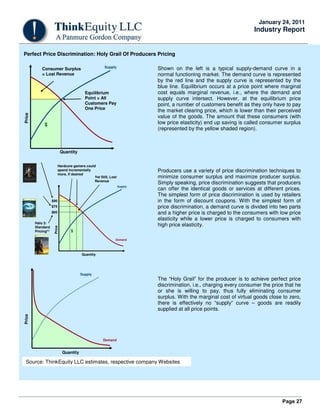
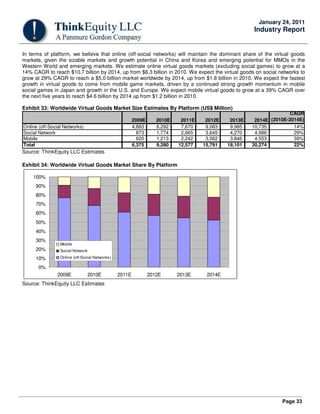
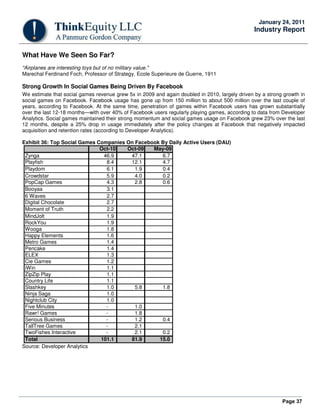
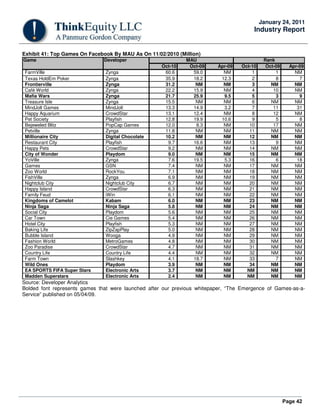
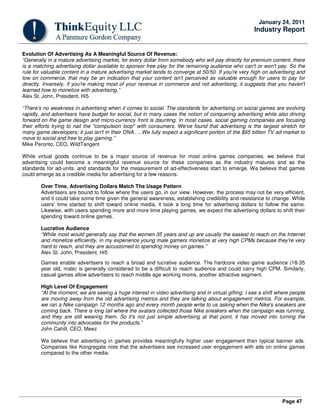
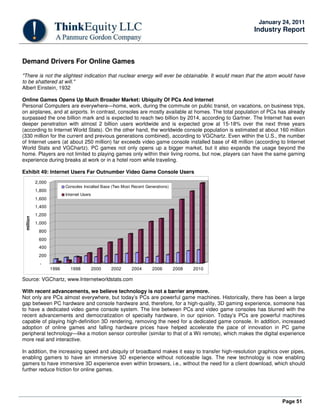
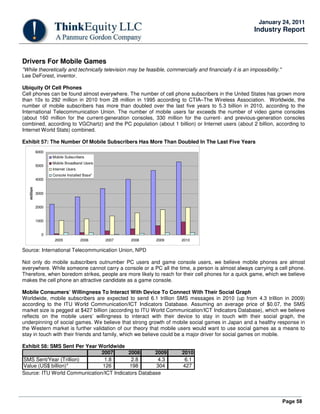
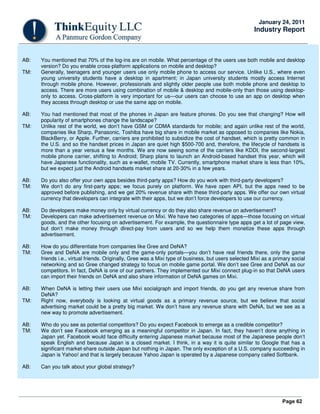
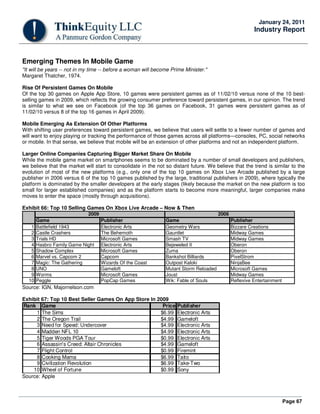
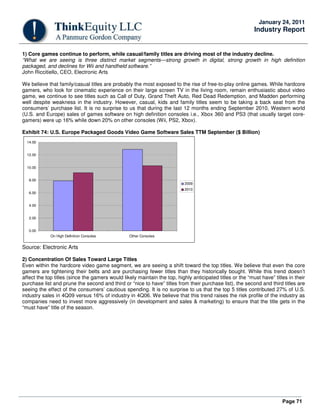
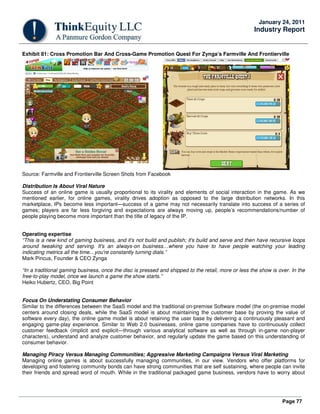
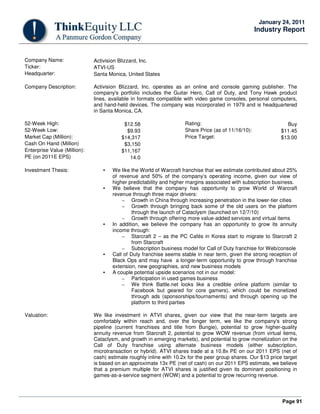
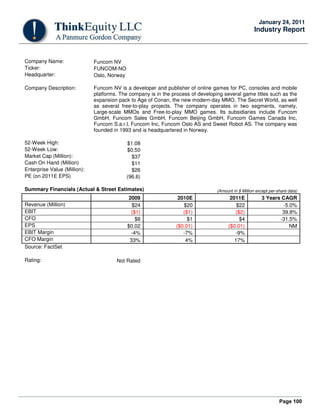
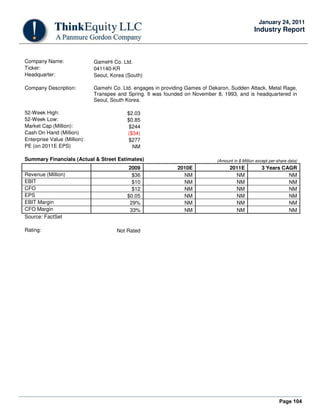
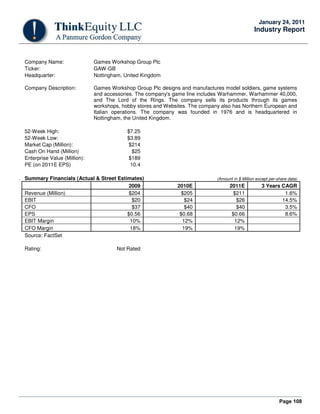
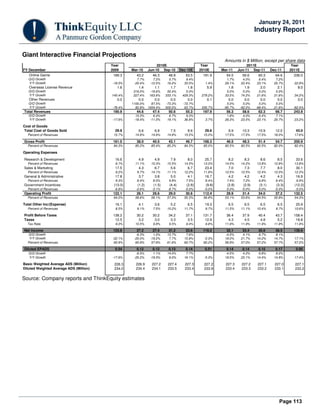
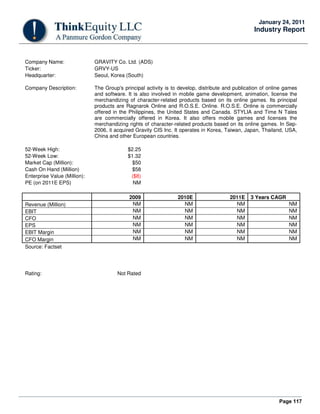
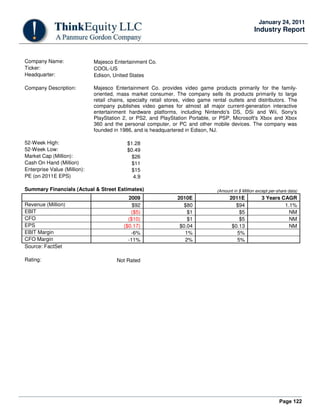
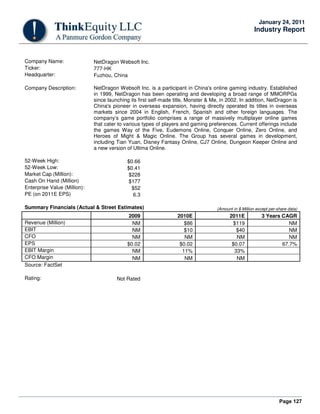
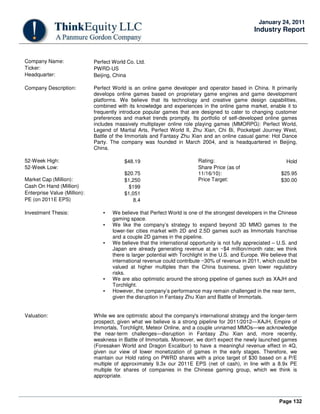
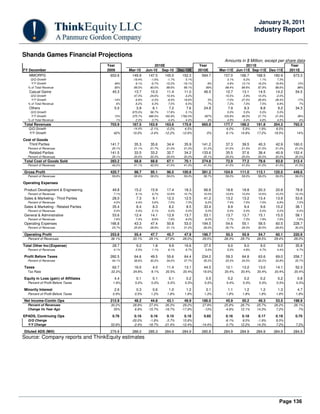
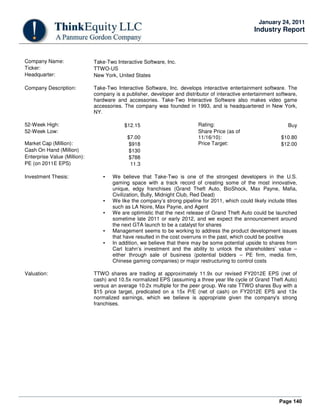
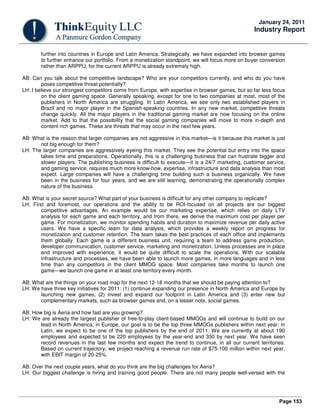
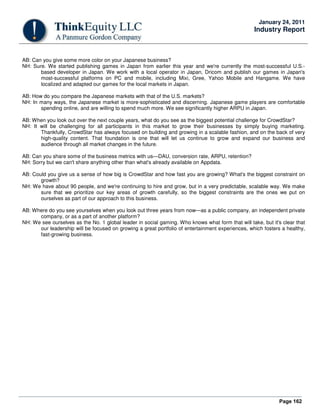
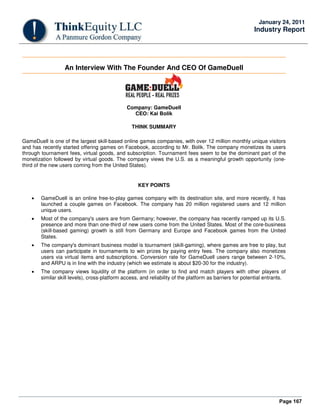
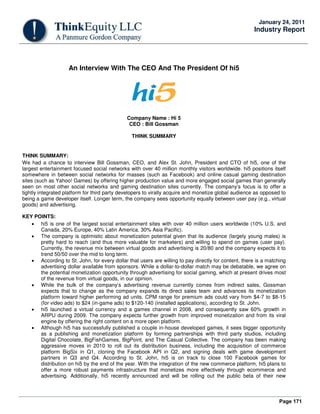
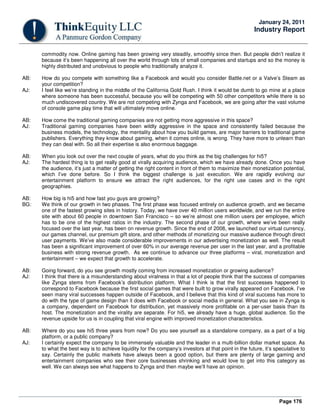
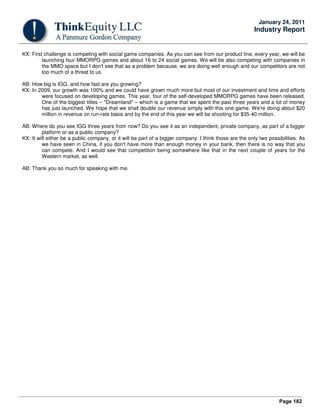
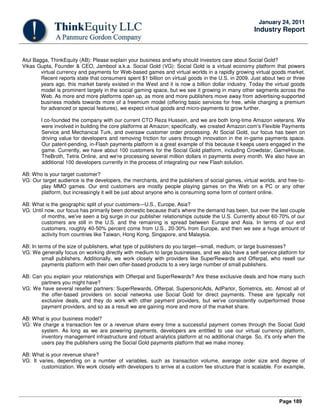
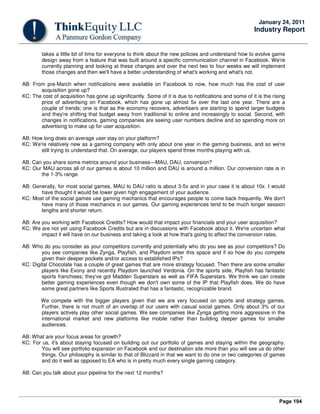
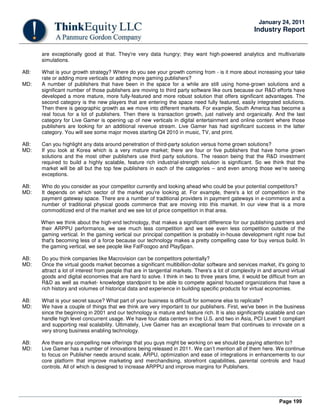
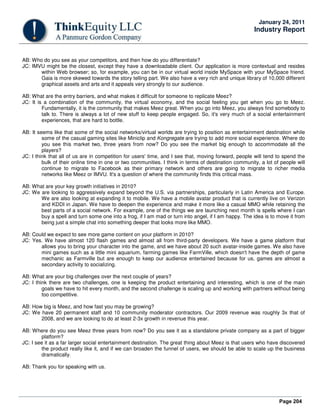
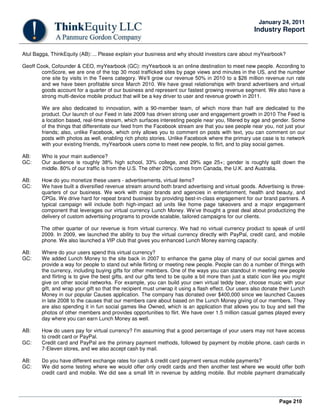
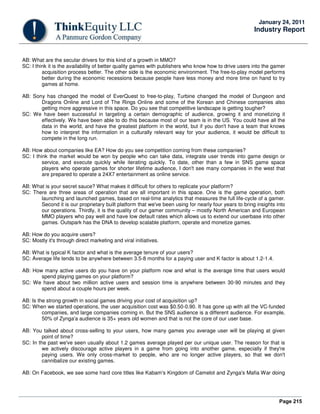
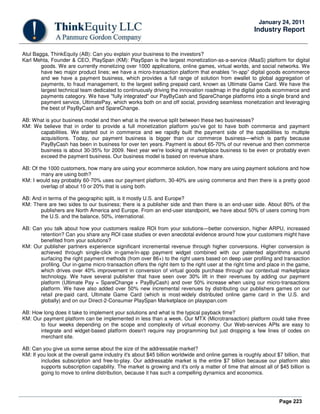
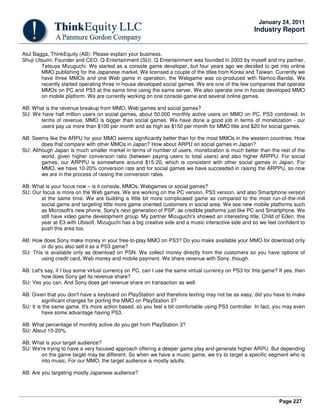
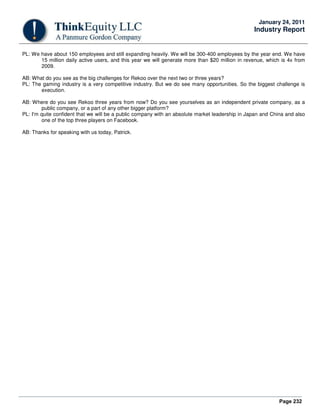
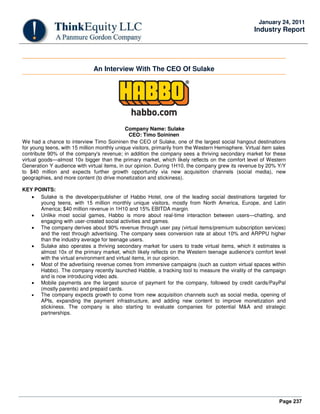
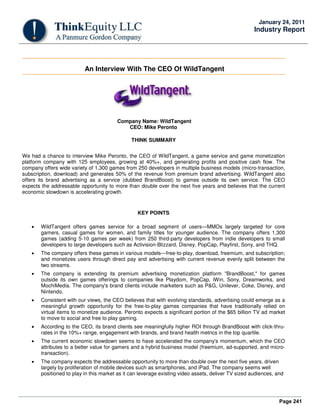
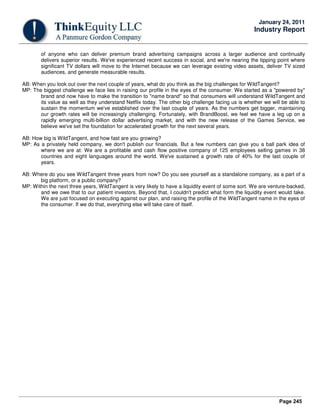
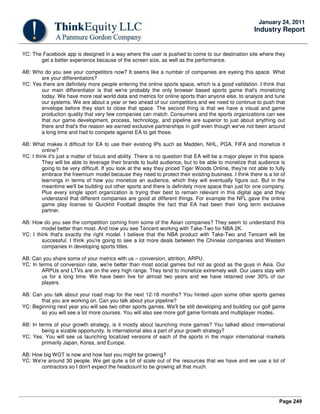
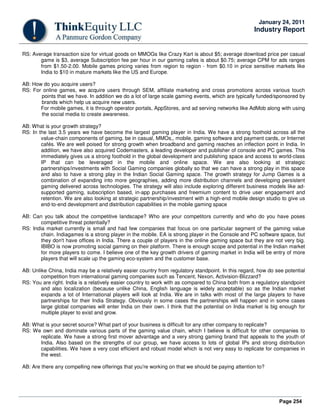
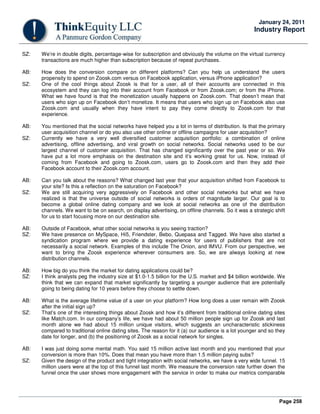
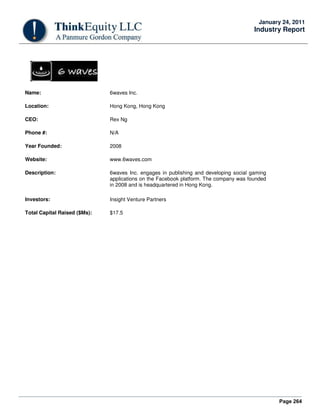
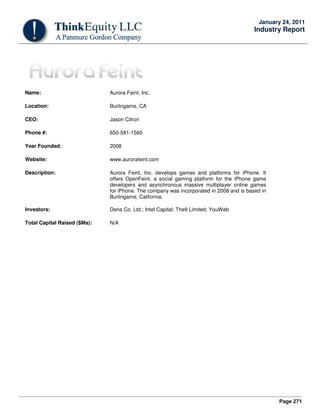
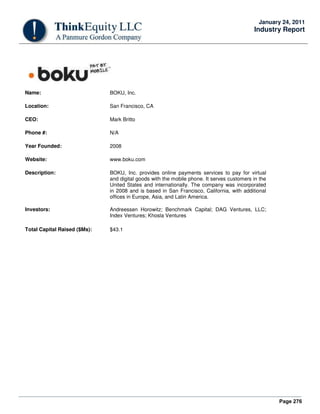
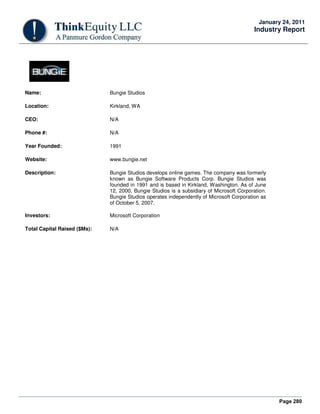
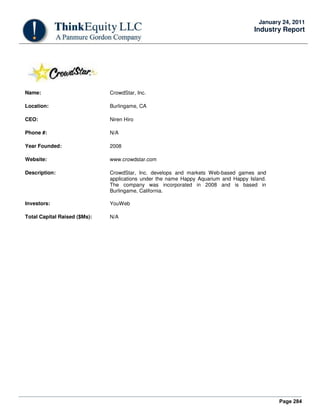
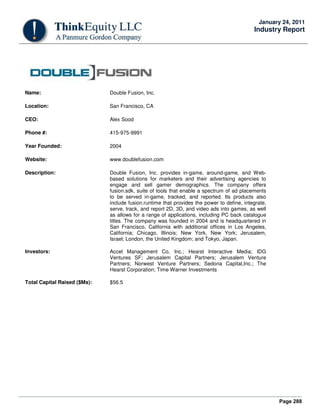
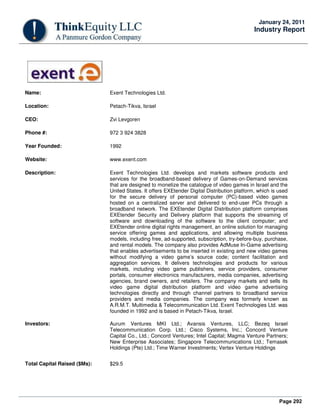
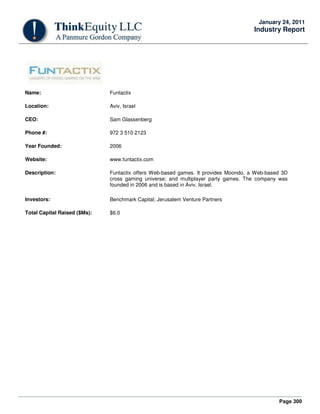
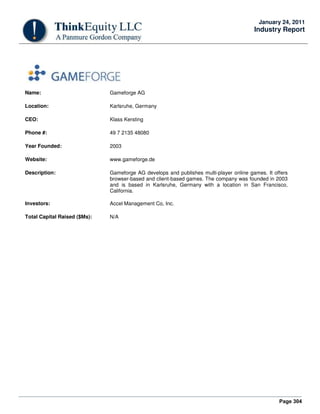
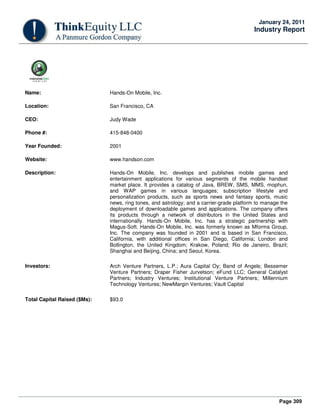
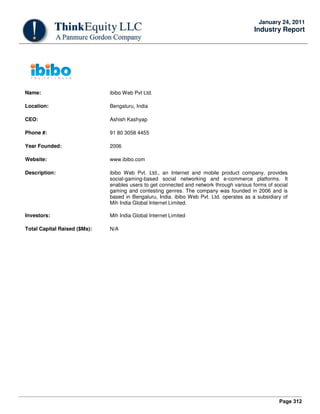
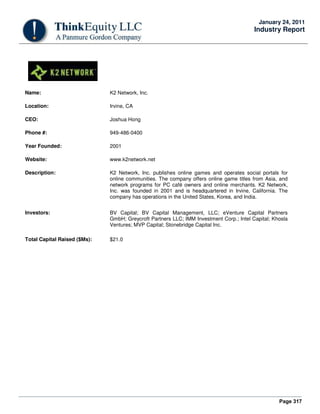
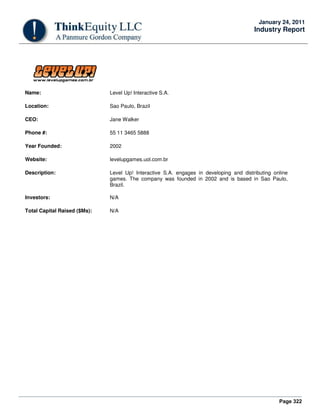
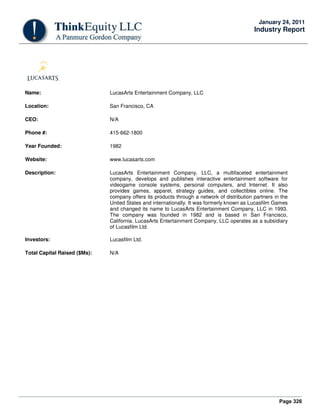
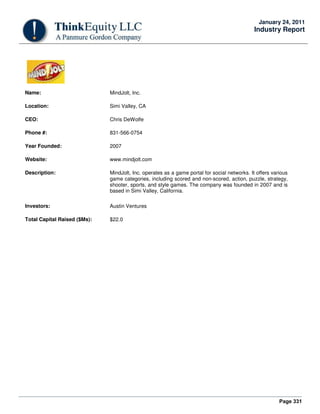
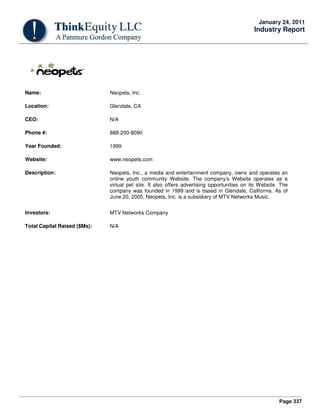
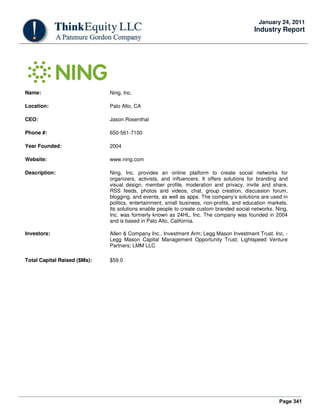
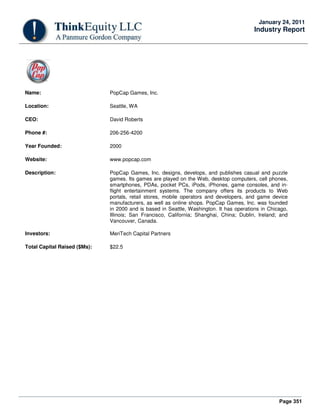
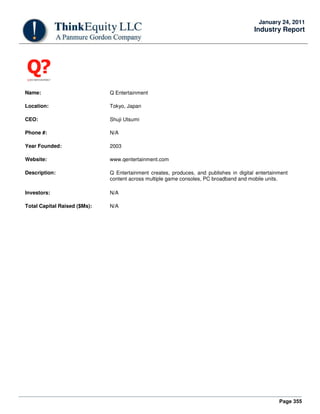
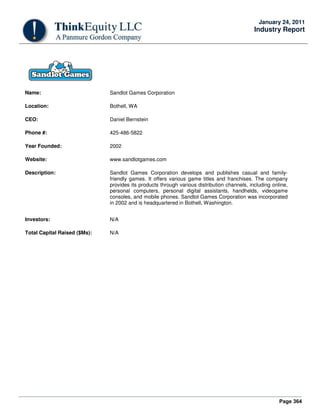
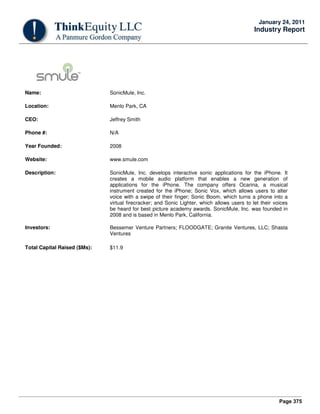
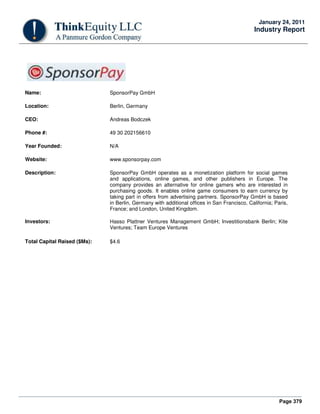
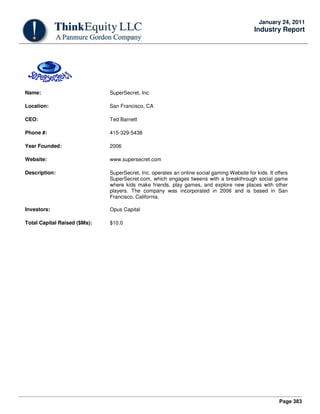
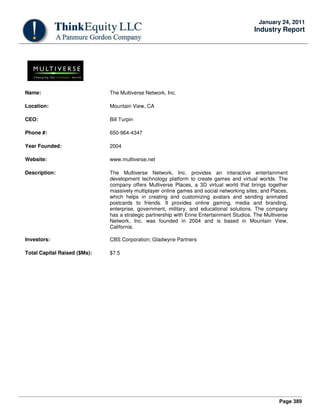
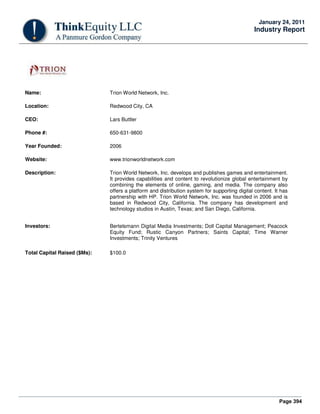
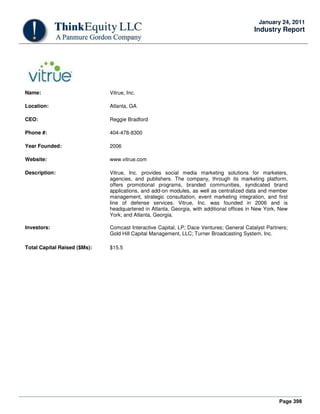
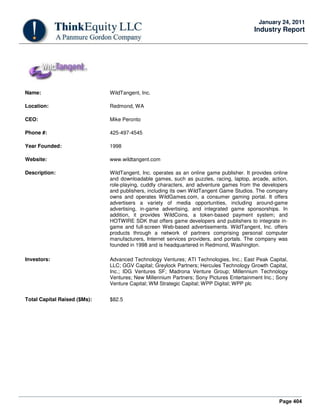
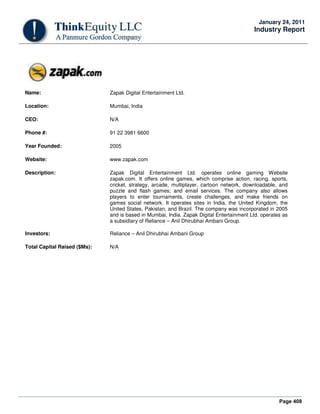
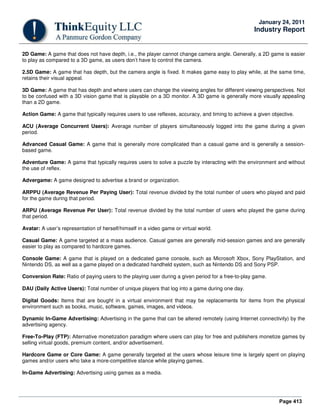
Exhibit 60: Broadband Speedometer
Broadband Speedometer – Maximum Download Speeds
Wireline 2.5 G Wireless 3G Wireless 4G Wireless
Cable
Modem
768kbps
30Mbps
56kbps
144kbps
144kbps
384kbps
2Mbps
3Mbps
3.6Mbps
2Mbps
Dial-Up
ADSL
IXRTT
GPRS
EDGE
EVDO UMTS /
WCDMA
HSDPAEVDO
Rev. A
WiMAX
20Mbps
FiOS
30Mbps
3Mbps
1.5Mbps
ADSL
ADSL
15Mbps
5Mbps
FiOS
FiOS
NottoScale
Source: CTIA Website
Easy To Use And Consumer-Friendly eStores For Games
We believe that improving the user experience of buying and installing mobile games will drive the adoption of mobile
games. Historically, most people played only those games that came pre-installed with the mobile phone, given that the
process of installing games on the phone has been pretty complex. Apple changed that with the launch of AppStore,
which made the process of browsing, searching, downloading, and installing games very easy and user-friendly. The
popularity of the AppStore can be gauged by the fact that since it opened in July 2008, there have already been almost 10
billion applications downloaded (according to Apple) on 120 million iPhone and iPod Touch, i.e., about 83 apps/iPhone.
Lucrative Business Model For Wireless Operators And Platform Vendors
In our view, video game provides an attractive revenue stream for mobile operators in the form of accompanying sale of
data plans and also revenue share with game developers. Although the revenue from video game remains pretty small
compared to the overall mobile business, it could start to look as an attractive way to grow a company’s ARPU as it
struggles with falling prices and slowing growth. We believe that, not only is the opportunity lucrative for carriers, but that it
makes a lot of sense for video game vendors, as the incremental cost of porting existing games on a new platform is
minimal and, therefore, incremental profit margins substantial. According to an article in The Wall Street Journal, Simon
Jeffery, the U.S. president of Sega said he believes that [despite 30% revenue share with Apple] "games sold via the
AppStore are the most profitable in terms of any of the formats.”
Emerging Standardized Platforms For Games
Historically, non-standardized phones, varied carriers specifications, and multiple operating systems meant that the
mobile game companies had to port their games on a number of platforms and support hundreds, if not thousands, of
SKUs, which involved significant upfront costs and maintenance costs and stifled innovation. With the emergence of the
iPhone (although a proprietary platform, given the high reach of iPhone, it eliminates the need to support multiple
platforms to achieve similar penetration), Google Android, and Nokia Ngage, the mobile game market, in our opinion, will
concentrate on a few standardized platforms, which should make the job of maintaining and supporting versions of mobile
games easier for developers and encourage innovation.](https://image.slidesharecdn.com/9f3e0384-5c68-4280-87ab-c09a5a0212d7-150425212220-conversion-gate01/85/GaaS-Whitepaper-2011-60-320.jpg)
![Page 73
January 24, 2011
Industry Report
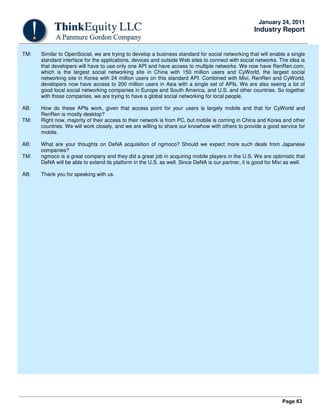
Emerging Themes In Console Game Market
"Decide you must how to serve them best. If you leave now, help them you could. But you would destroy all for which they
have fought and suffered."
Yoda, Starwars: The Empire Strikes Back
Expect Market To Continue To Shrink
We estimate that the console game market could shrink moderately over the next few years. We believe that consumers
who grew up on console games may remain loyal to console games. We would expect to see a tectonic shift in games
purchasing habits over the next 5-10 years as the next generation of gamers (users who are growing up in connected
environments like Facebook and Twitter and who have already been trained in the free-to-play environment) becomes the
core consumer of games software in the next 5-10 years. Over the next five years, we estimate that the console game
market will shrink at a 2% CAGR for three reasons:
1) Publishers Trying To Monetize Online Gameplay On Consoles
As the market continues to evolve and favor larger titles, and as consumers continue to extend their value from the
purchases, we believe that companies will seek to increase their value through alternative revenues from console games
to improve return and investment to justify the enhanced risk profile of the top titles. We expect companies to add
subscription and micro-transaction models on top of the box purchase model for ancillary revenue streams.
2) Next-Generation Consoles From New Players
While we expect a very small likelihood of a next-generation console from either Microsoft and/or Sony (we wouldn’t be
surprised to see an HD version of Nintendo Wii sometime in 2011/12), we believe that companies like Apple and Google
may want to stake claims in this space. With the advances in the set-up boxes and with GPU pricing going down and with
the Internet pipeline getting broader (i.e., average download speed going up), we believe that the next-generation set-top
box could also double up as a game console. We believe that publishers may be excited about a next-generation open
source game console given our view of broader distribution and lower royalty.
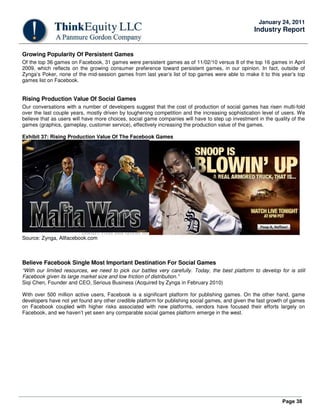
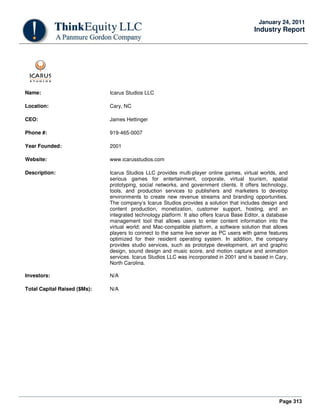
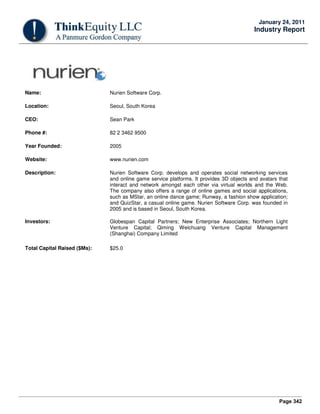
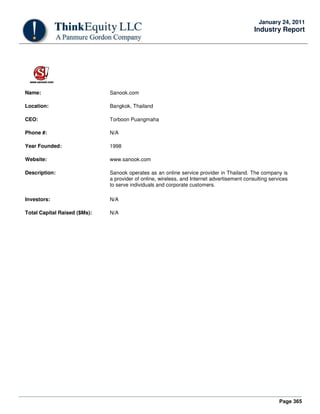
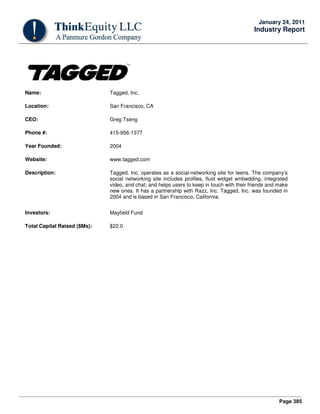
Exhibit 77: New Games Consoles?
Google.com/TV, Apple TV, Logitech Revue, OnLive
3) Traditional Video Game Companies Extending Brands From GaaP To GaaS
“We have transferred many elements of Blizzard's expertise to our approach to Call of Duty, which now joins the very
short list of entertainment properties that have successfully bridged traditional and emerging models.”
Bobby Kotick, CEO, Activision-Blizzard
“What we've been doing is bringing our titles down in terms of the number, and broadening it…short and fat is the new tall
and thin. Meaning a shorter list but more broadly exploited across properties [platforms]”.
John Riccitiello, CEO, Electronic Arts
Given significantly higher growth, higher margins, better predictability, and lower risks associated with it, coupled with
declining sales of the Games-as-a-Product business, the Games-as-a-Service segment has become much more lucrative
to traditional packaged software publishers. We believe there could be a meaningful opportunity for traditional video game
companies to monetize their strong licenses and/or owned IPs on these new platforms. On the other hand, we believe that
GaaS requires a completely different mindset—as a service, games have to be operational 24x7 and be able to withstand](https://image.slidesharecdn.com/9f3e0384-5c68-4280-87ab-c09a5a0212d7-150425212220-conversion-gate01/85/GaaS-Whitepaper-2011-73-320.jpg)


![Page 156
January 24, 2011
Industry Report
Atul Bagga, ThinkEquity (AB): Please explain your business and why should investors care about BOKU?
Mark Britto, Founder and CEO, BOKU (MB): BOKU is the leading mobile payments company. We enable consumers in
more than 60 countries around the world to make a purchase, typically of digital or virtual goods. Instead of using
a credit card, the consumer gives us his or her cell phone number and at the end of the month, the purchase of
that item shows up on his or her cell phone bill. We incorporated the business in January of 2009. Since then
we've acquired a couple businesses that pre-date our January 2009 company formation. We have some of the
best VCs in the world invested in BOKU, including Andreessen Horowitz, Benchmark Capital, DAG Ventures,
Index Capital and Khosla Ventures. What PayPal did for the email address, BOKU wants to do for the mobile
phone number.
AB: What is the value proposition for payment by mobile? Is it mostly for the users who do not have access to credit
cards such as minors or international?
MB: The biggest value proposition is that we take friction out of the buying process. Everyone knows their cell phone
number but not everyone knows their credit card number. When you're completing a credit card purchase you've
got to get up from your computer, get your wallet, find your credit card, type in 16 digits, give the security code,
the expiration date, your billing address. On the other hand, since you know your cell phone number, a
transaction can be completed much quicker and with fewer keystrokes. That is one piece of it. The other is that a
consumer can complete a transaction without giving personal financial information over the Web, which is a very
compelling feature for people who are security conscious. Finally, in many of our international markets, many
consumers either don't have a credit card or if they have a credit card, the publisher doesn't accept credit cards.
So the only way that the consumer can transact with that publisher is using a payment system like ours.
AB: How do you define your target audience?
MB: Our target audience is typically consumers who are buying virtual or digital goods in online games. Last year, the
virtual currency was roughly an $8 billion market, growing at 50-75% annually. We work on games from
companies like Zynga, Playdom and Playfish and payment companies like Offerpal. We're currently working with
about 250 publishers and processing millions of transactions a month.
AB: What about Facebook? Are you doing anything with them?
MB: Many discussions are taking place, but there’s nothing to announce at this time.
AB: What is the break-up of revenue geographically?
MB: U.S. and North America represents roughly one-third of our volume, roughly one-third from Europe, and then one-
third from Asia and Latin America.
AB: What is age distribution of your users in the U.S.?
MB: It's across the board and it skews significantly to over 18. Our user demographic is relatively consistent with the
age demographic of games like Farmville, Mafia Wars.
AB: Can you explain how do you work with telecom carriers, publishing partner, and ultimately consumers?
MB: We connect into 200+ carriers in 60+ countries. When a consumer from that country wants to make a purchase,
he gives us his cell phone number, we send a SMS message to the consumer asking him to authorize the
transaction. When we receive authorization, we fund the transaction and send a message to the carrier telling the
carrier to bill the consumer for transaction amount at the end of the month.
AB: Who takes the risk of any fraud? Is this BOKU or the telecom carrier?
MB: It is BOKU. We are very focused on risk management, fraud management, on behalf of our publishing partners.
We look at the history of a consumer across games. We look at how much they spend, where they spend it, when
they spend it. We’ve created a risk service that at the time of transaction executes a host of rules based on our
algorithms and limits we’ve set at the country, carrier, and merchant.
AB: Typically, what kind of transaction service fee [would] a mobile carrier charge, what kind of fees [would] you
charge, and how does that compare with that for a credit card or PayPal transaction fee?](https://image.slidesharecdn.com/9f3e0384-5c68-4280-87ab-c09a5a0212d7-150425212220-conversion-gate01/85/GaaS-Whitepaper-2011-156-320.jpg)

![Page 158
January 24, 2011
Industry Report
AB: Who do you see [as] your competitors currently and potentially?
MB: We don’t worry about our competitors. We worry about building a world-class product and a great customer
experience, always knowing that if we do that, the competitive landscape would take care of itself.
AB: What is your secret sauce or what will make it difficult for someone to replicate what BOKU is doing?
MB: There are a couple of things. One is that we've got great experience and data that is specific to this environment
and replicating that is not possible without operating in this environment. Two, we have built connections into 200
carriers throughout the world. And that's difficult to do and complicated to architect, and I think replicating that will
be will be expensive. Finally, I think that the risk management systems that we build as a result of our domain
expertise give us a competitive advantage relative to someone that is trying to get into this business.
AB: When you look out next three years from now, what do you see as the big challenges for BOKU?
MB: I think our challenge is the same as our opportunity. And that is to convince the carriers that it's in their best
interest to work more closely with us to promote the service and make it a more mainstream option. We spend a
lot of time focusing on that and to the extent that we're successful that will represent the opportunity for the
company as well.
AB: Can you give us some sense of how big BOKU is right now and how fast you might be growing?
MB: We're processing millions of transactions a month. On average we process about one transaction every second.
We're 60 people, based in San Francisco, an office in London and a small sales presence in Asia.
AB: Where do you see BOKU three years from now? Do you see yourself as an independent company, or as a part of
a bigger platform?
MB: It is unclear to me and definitely not something that we spend time thinking about. Our view on this is that if we
build a great product, build a great customer experience, that the rest will take care of itself.
AB: Thank you for speaking with us, Mark.](https://image.slidesharecdn.com/9f3e0384-5c68-4280-87ab-c09a5a0212d7-150425212220-conversion-gate01/85/GaaS-Whitepaper-2011-158-320.jpg)
![Page 164
January 24, 2011
Industry Report
Atul Bagga, ThinkEquity (AB): Over the last couple years, while Facebook has grown from 150 million to 500 million users,
during the same time, a few other social networks have seen a big decline. What do you attribute Facebook's success to?
What have you done different that your competitors missed?
Bret Taylor, CTO, Facebook (BT): I think the primary thing is that we were exclusively focused [on the] user experience.
We want to create a product that's not just trendy or fun but also just extremely useful for people. And that
manifests itself in a number of attributes that makes Facebook different from other social networks; the most
important is that we're focused on real identity and because of that, Facebook has become a valuable utility for
people. I think that a combination of making it an extremely useful service that people use every day in addition to
fun social destination where people can play games, shares photos and videos, has been the main distinguishing
factor of Facebook.
AB: Facebook population is now almost 30% of the total Internet population. Where do you expect the growth to come
from over the next couple years?
BT: We're very focused on growing our user base. Internally, we say that the most important feature that we can add is
the one that gets your friend on Facebook because when you put people who are meaningful to you in your real
life on Facebook, it makes Facebook even more valuable service for you. Having said that, our product strategy is
focused on our platform. We view social graph as the core of our service and communications channels as
features on top of that platform. We are focused on expanding our platform from Facebook.com to the entire Web
and launch social functionality in the form of social plug-ins. We think that any given service has the potential to
be disrupted by the presence of deeply integrated social functionality.
AB: In terms of your expectations from growth, is it more about growing the user base or more about expanding your
reach through the social plug-in?
BT: We would like to do both. To some degree, Facebook.com is the killer app for the social graph that makes people
want to sign up for the service and makes them actively use Facebook every day. The core value of
Facebook.com is our platform, which is also valuable to third-party developers. I think, over time, the third-party
applications would become a very meaningful part of people's Facebook experience but you really can't have one
without the other. They're closely connected.
AB: How do you see Places expanding the reach of Facebook.com?
BT: It's very early. Right now, we're focused on creating a great user experience around people checking in, finding out
where their friends are, and we have integrated it into our platform really deeply on day one. I think location is a
really meaningful part of our platform and will continue to grow particularly as mobile devices continue to grow as
a predominant platform for people to interact with social networks.
AB: What is your expectation around penetration of Facebook within the Internet users?
BT: I think it's useful to everybody. Facebook is an efficient way for connecting and sharing with others; and those are
fundamental human needs. Likewise, our platform helps cater to particular interests whether it's a game or
charities through applications. A good example is the disruption in video games space.
AB: Facebook has already gained a lot of ground with mobile apps. How meaningful is the mobile for Facebook currently
and, over a longer term, how do you see mobile opportunity evolve as compared to the PC opportunity?
BT: The phone is already a very social device, and I'm very excited about integrating the Facebook platform on the
phones. I think that there is a huge value in integrating the social channels, serendipity, and discovery with the
Facebook platform, and the value is even more for mobile applications than that for Web applications. We're
focused not only in making the Facebook experience really good on the phones but enabling phone developers to
integrate Facebook into their own applications.
AB: Outside of games, what other verticals do you see where Facebook has potential to create a similar disruption that we
saw in games?
BT: That's something we talk a lot about internally. One of the areas that we are focusing on right now is media and news.
Currently, the front page of a newspaper represents the editorial voice of the newspaper, but there are a lot more
articles than can fit on that front page, and everyone's interest are very diverse and people will like to see the
story of their interest promoted to the front page. In April, we launched social plug-ins, which is cut-and-paste](https://image.slidesharecdn.com/9f3e0384-5c68-4280-87ab-c09a5a0212d7-150425212220-conversion-gate01/85/GaaS-Whitepaper-2011-164-320.jpg)


![Page 184
January 24, 2011
Industry Report
Atul Bagga, ThinkEquity (AB): ...............Please explain your business and why should investors care about IMVU?
Cary Rosenzweig, CEO, IMVU (CR):IMVU is a social entertainment network where members use three-dimensional
avatars to dress up, chat, create and play games with their friends. Investors should keep an eye on IMVU,
because we’re one of the fastest growing businesses in the social entertainment space.
AB: Is IMVU more about discovery or is it more about meeting with existing friends in an online environment?
CR: Currently people come to IMVU for multiple reasons, but primarily they come to make new friends. Although
increasingly we’re finding that people are bringing their existing friends, and we believe over time that will become
a more important aspect.
AB: What are the things that people can do at IMVU?
CR: IMVU is a virtual world where people can create an avatar, dress up the avatar, and chat with their friends. They
often create their own games by role playing, by sharing their interests with each other. Music is also a very
important aspect to our users of IMVU. In fact, we’re the only social entertainment network that sells music to our
own users. Shopping for all kinds of virtual goods, in general, is very popular and it drives a significant part of user
engagement for IMVU members.
AB: How do you position IMVU between a virtual world such as Second Life and an instant messenger such as QQ?
CR: We’re no longer a virtual world; rather, we’re a social entertainment network, focusing on casual games and the
social network, enhanced by 3D avatars. At the very beginning we positioned it essentially as instant messaging.
However, we quickly learned that users wanted IMVU to be more than that. For everyday instant messaging there
is no need for an avatar, because people want [a] very rapid way to communicate. The presence of the avatar
creates a completely new and even emotional aspect to communicating between people. The avatar becomes
your alter ego online and becomes a wonderful way for to present yourself in the way that you like to present
yourself to other people, which make it ideal for making new friends, for meeting new people who share your
interests.
AB: What is the target audience of IMVU?
CR: About 40% of our users currently are between 13-17 years and 60% over the age of 18 years. The average age is
22 years. About 70% of the users are female.
AB: What about geographic break-up of users?
CR: About 60% of the active and paying customers are in the United States. 40% users come from English-speaking
countries, U.K., Canada, Australia, and also Western Europe. We have a lot of users from Spain, Germany,
France, and they communicate with each other in their native language. At the moment, we offer IMVU only in the
English language, and one of our initiatives in the fourth quarter of 2010 is to offer IMVU in many languages and
we expect the majority of active and paying customers to be non-U.S.
AB: What is your business model?
CR: Our business model is free-to-play. A vast majority of our users use IMVU for free and a small percentage pay
money. About 85% of our revenue comes directly from consumers buying IMVU credits that they can use to buy
virtual goods. Key to our business model is that the virtual goods that users buy are created by other users. We
have an extremely effective user generate content (UGC), system that has resulted in IMVU offering our users the
world’s largest catalog of virtual goods; well over three million items. The remaining 15% revenue comes from
advertising, which is comprised of two elements. One is the offers category i.e. people taking surveys, advertisers’
offers; that is about 10% of revenue. 5% of the revenue comes from traditional form of advertising, including
banner ads and video ads.
AB: I saw that some of your deals with marketers like Charlotte Russe, Nike. Can you talk about your vision on
sponsored virtual goods?
CR: We’ve been experimenting with presenting real world brands to our users. So far, we have structured the deal
where our users pay for these branded goods and we split revenue with advertisers. We believe that there is
probably a larger benefit for the brand if this is structured as advertising so that we could reach to almost all of our](https://image.slidesharecdn.com/9f3e0384-5c68-4280-87ab-c09a5a0212d7-150425212220-conversion-gate01/85/GaaS-Whitepaper-2011-184-320.jpg)

![Page 191
January 24, 2011
Industry Report
Social Gold, is that it was natively designed for gaming platforms, ensuring a lightweight API that is easy and fast
to integrate into online applications. In the end, developers can easily and quickly launch their own white-labeled
virtual currency and a direct payments solution for their online applications that is secure and scalable.
AB: How do you compete with someone like PayPal, or even PlaySpan that has a big network of retail credit card
distribution?
VG: We partner with PayPal rather than compete with them. We present payment method options to a developer that
includes PayPal. Publishers typically pay us a little bit higher fees by working directly with us versus working
directly with those payment methods. Additionally, they look at the convenience and benefits of a single payments
platform and the potential lift that they can generate by working with us. We consistently see that our platform
results in 30-40% lift versus if the publisher had been working directly with each and every local payment method.
In terms of competition with PlaySpan, we're not focused on having a retail card presence because we believe
that gamers want to buy a cash card that belongs to the game itself and have a direct experience with the brand,
rather than buying a third party card. So, we're focused on helping game developers to bring their game card
within the game through our platform, solidify the branding experience, and make it more seamless for users.
AB: What drives this 30-40% lift that you highlighted—is it the improved experience or analytics?
VG: Usually, it's a combination of using all the tools in the Social Gold suite, but people who use only our payments
solution also see that kind of a lift. We focus heavily on creating a user experience that keeps users engaged
within a game that in turn creates an extremely seamless and frictionless repeat user purchase experience, which
results in a higher ARPU than the publishers would be seeing otherwise.
AB: Do you offer solutions for mobile channels?
VG: Currently, we don't offer solutions for mobile channels, but we're looking at notable platforms that are now opening
up, such as Android. We're not looking into development for the iPhone at this time because Apple has
implemented tight controls around it—it's basically a closed system, where payments are processed only through
iTunes. For open platforms, such as Android, Social Gold would be an ideal solution for micro-payments because
we could bring the same kind of repeat user purchase experience as we would do on the Web.
AB: When you look out [a] few years from now, what do you think are the big challenges for Jambool?
VG: I think the big challenge for us is continuing to innovate in [the] online payments and virtual goods space and grow
market share because I don't believe it's a sprint, I think it's a marathon. In the short term, we have to continue to
differentiate ourselves from others in a relatively crowded space. Another challenge is to tap into international
markets, whether it is through reaching publishers or end-users.
AB: Can you give us some sense as to how big Jambool is and how fast you might be growing?
VG: I expect the market to grow to a multi-billion dollar market in a few years, and we expect Social Gold to grab 30-40%
market share. Currently, we process several million dollars in payments every month and, as we expand our
business to new channels and continents, we project these payments to increase rapidly. Additionally, we have
about 25 employees across offices in San Francisco, Seattle, and Singapore, and we're continuing to grow.
AB: Where do you see Social Gold/Jambool three years from now? Do you see yourself as a standalone company, as a
part of a bigger platform, or a public company?
VG: Neither of those options—standalone or public company—are out of the question. It depends on how the market
shapes up, how well we are able to capitalize on the growth in the market. I believe we are on target to build a
very successful independent company in this space.
AB: Thank you so much for speaking with us.](https://image.slidesharecdn.com/9f3e0384-5c68-4280-87ab-c09a5a0212d7-150425212220-conversion-gate01/85/GaaS-Whitepaper-2011-191-320.jpg)
![Page 198
January 24, 2011
Industry Report
AB: Payments versus the e-commerce solution - what is the bigger part of your business?
MD: The ecommerce solution certainly drives the primary value for our publishers and majority of our revenue.
Payment gateways are an essential part of the business, but of limited value to publishers. It is kind of a two-
percent business. But providing the Elements Commerce solution that enables a digital economy is a significantly
larger set of services and solutions and clearly more valuable.
Our Clients are generally focused on three goals—increasing users, usage, and ARPPU. Our technology helps
drive all three, with an emphasis on increasing ARPPU. Live Gamer’s tech stack and services focus on features
that deliver the highest free-to-paying conversion rates, highest revenue per user and those that help to boost
user retention. Those features are typically centered on effective item management, sophisticated analytics,
marketing and merchandising of virtual content to end users.
AB: Can you give us some sense what is a size of addressable market?
MD: The addressable online gaming market is in the order of $15 billion today—hardcore games at about $4 billion,
casual and social at about $7 billion, and secondary market of virtual goods at about $3-4 billion. The derivative
market for our transaction solution business, assuming a 7% take-rate, is over a billion dollars. Our addressable
market is benefitting from two growth factors—one is at 40% CAGR in the micro-transaction based gaming
market, which itself can expand Live Gamer’s addressable market to greater than two billion dollars in three to
five years; and then the opportunity in the related categories of digital entertainment could be at least 50 percent
of the Game market or $7.5B over the next 3-5 years.
AB: Can you talk about a few secular drivers that are driving growth in this market?
MD: There [are] four major drivers. Firstly, increased broadband penetration and social activity on the Web are very
significant drivers. When you’ve got 500 million users on Facebook and 450,000 apps, it drives a lot of
transactions. Of course, globally there are many social networks like Oak Pacific that have greater than 100
million users. My sense is that the micro-transaction value of social networks is probably worth well north of a
billion dollars today and heading to five plus billion dollars by 2012.
Secondly, advances in game development technology have lowered the cost and increased the speed of
development. Publishers are delivering a portfolio of quality entertainment experiences on the Web. The current
generation MMOs are great games; they're fun to play, there's a ton of social interactivity in there and it's a
rewarding entertainment experience. Similarly, innovations in social gaming have created compelling game
experiences with low budgets and short development cycles. Both game forms are structured around item-based
game leveling—a significant driver for micro-transactions.
The third driver is the global recession. Since the disposable income available for entertainment has reduced over
the last two years, it has brought a lot of people into free to play games from expensive box games and
subscriptions and accelerated the sector’s growth.
Finally, mass distribution of free to play games has changed the demography of gaming. That has bought a mass
market to micro-transaction driven entertainment. People from 6 to 60 play social games like Zynga’s. That
demographic is now entrenched in micro-transactions, consuming all sorts of entertainment forms from music to
film to sports.
AB: How easy or difficult it is to sell your solutions now versus it was about a year ago?
MD: A year ago, the market was growing so fast and consumer demand was so strong that publishers were just
focused on creating virtual goods for distribution inside the games. Now they've moved to another level of
sophistication and they need to analyze their demographics, their ARPUs, their SKUs performance, payment
method effectiveness and so on. In many respects, it resembles the kind of sophistication that Amazon or Wal-
Mart have around managing their businesses. Yes you're running a game-as-a-service, but you have to be able
to merchandise virtual goods and manage your digital economy at optimal levels. We see a lot of publishers that](https://image.slidesharecdn.com/9f3e0384-5c68-4280-87ab-c09a5a0212d7-150425212220-conversion-gate01/85/GaaS-Whitepaper-2011-198-320.jpg)


![Page 219
January 24, 2011
Industry Report
Atul Bagga, ThinkEquity, (AB): Please explain your business and why investors should care about Playdom?
John Pleasants, CEO, Playdom (JP): We are in the social gaming space, which is defined as online games that live
primarily inside existing social networks. Our products are a combination of games and social interactivity and it's
the hybrid of the two that makes them differentiated from traditional games that tend to be more immersive and
generally more focused on production qualities, graphic capabilities. Social gaming is a free-to-play model, so it
attracts a broad demographic of people. There are now hundreds of millions [of] people playing social games, and
as a category, social gaming is still in infancy. So it's a disruptive model. Relative to traditional gaming, this model
has lower cost of production and higher returns, because you can very quickly capitalize on your user base, and
it's a live service, so you change and evolve your product over time. You don't have the risk of spending a lot of
money and time building a product then shipping it and hoping people come. You're mitigating all of that risk in
the traditional entertainment model, and hence, we have a superior model for entertainment, production, and
distribution.
AB: Can you explain how do you make money—virtual goods, advertising, what could be the mix between these different
revenue streams and how do you see it trending over a longer term?
JP: We are primarily a virtual goods model. People acquire items in order to accelerate in a game or to unlock new parts
of the game and limited edition items. That represents 90 percent of our revenue. Between five and 10 percent of
our revenue comes from advertising. I think that the revenue mix will always be dominated by direct consumer
payments.
AB: How much of the virtual goods revenue comes from direct payment versus indirect payment and maybe if you can
share your thoughts on indirect payment that lead generation offers, et cetera?
JP: A vast majority of our revenue comes from the direct payment. We want to have direct billing relationships with all of
our customers. Offers can be a good thing for people who can't or don't want to pay but are willing to invest time
or some personal information. Only about 15% of our revenue comes from the indirect payments. As long as the
offers are clean, legitimate and transparent, they can be acceptable. But if they are less than transparent and
manipulative, they don't create a good user experience and they are not good for us.
AB: You mentioned that about five or 10 percent of revenue coming from advertising. What kind of advertisements are
these—are these video ads, in-game ads, banner ads?
JP: These are primarily adjacency ads to our existing products. We've done a few things, sort of in-game experiences, but
it's rather limited. And advertising has not, to date, been a focus for us. We do not even have one person in our
company dedicated to advertising at this time.
AB: If we look at the Chinese online gaming space, it seems like highly immersive massive multiplayer online games are
better monetized than the casual games. And given that your games are shorter duration, more casual; what
gives you the confidence about the ability to monetize these games?
JP: Well, it really all comes down to reach in different behaviors. You've got game room phenomena over in China and
Korea, so people go in games rooms and play these online games. We don't have that phenomenon here
because we have a lot of personal computers in the home and people can buy downloadable games. In our
markets we have 300-plus million people on Facebook alone, so that's the equivalent of our game room. That's
where everybody has congregated and we're simply going there and offering them a free model. While hardcore
gamers, like a World of Warcraft have limited reach, games like a Maple Story or a Mobsters 2 or a Sorority Life
game reach much broader demographics.
AB: Can you talk a little bit about who is your target customer.
JP: Target customer is anybody who lives inside the social networks, which these days feels like anybody. Facebook has
users from 13 to 80 years old and it has equal distribution between men and women. Each of our game has a
different demographic. Sorority Life appeals more to women; Mobsters 2 appeals more to men; Poker application
appeals to a gaming or casino demographic. So if you took the aggregate of it, it's broad-based and follows the
populations of the social networks, with a primary target of 18 to 35.
AB: Can you give us some sense on how big this market could be and maybe if you could share some of your
assumptions around market-sizing estimates?](https://image.slidesharecdn.com/9f3e0384-5c68-4280-87ab-c09a5a0212d7-150425212220-conversion-gate01/85/GaaS-Whitepaper-2011-219-320.jpg)
![Page 220
January 24, 2011
Industry Report
JP: I think the western market is somewhere between $0.5-1.0 billion today and it can be $3-5 billion over the next three
years. It's growing more than 100 percent a year and all the metrics are moving in the right way. That starts with
Internet penetration worldwide, followed by social networking penetration, followed by percent of users of social
networks that play games, followed by percent of people who pay inside of these games, followed by how many
games they play per month, followed by ARPU per paying user. Add it all up; they're all growing and if each of
those things goes up you know 20 or 30 percent or whatever the respective numbers are, it adds to 5-10x of the
category over a three to four-year period of time.
AB: Can you share some of the metrics with us—typical conversion rate between playing users versus paying users;
typical ARPU?
JP: It's all over the map, but we see conversion in the range of 1-4%. Our ARPU per paying user tends to be about $20;
but when you average it all in with all the non-paying people, it is about $0.20-0.25 cents per month.
AB: What is your growth strategy? Is it more about getting in more social network, clocking-up ARPU, or adding more
games to get a bigger audience?
JP: Yes, the latter; more games, bigger audience. We have 15 games now and we hope to well more than double our size
over the course of the next year. We have also acquired (Lil) Fram Life through our acquisition of Green Patch.
AB: Can you talk about your mobile strategy? Now that Apple has opened up its platform for in-game transaction, how
does that change the landscape?
JP: We have our Mobsters product both online, as well as on the iPhone. We have booster packs that come off of that and
that product is doing well for us. We have recently acquired Trippert Labs, which gives us dozens of applications
on iPhone. Micro-transactions are an important part of this economy; it's how it works, so I'm very excited that
Apple is opening up their platform and enabling more Flash over time to live and exist inside the iPhone
environment. Our games are live services and a consumer should be able to access them from any device they
have, whether that's a mobile device or a Notebook or a PC.
AB: Who do you think represents the biggest competitive threat for Playdom?
JP: Surely, Zynga and Playfish both are very similar companies as ours. Some of the independent developers can come
up quickly and do nice jobs. Some of the big media companies are trying to get into this, foreign companies
especially from China are aggressively moving into this space as well.
AB: What is the key source of differentiation for Playdom that is difficult for others to replicate?
JP: You have to make the products, and you have to know how to run a live service, and you have to have the
infrastructure to manage the scale, which I think is one of our strengths. The other thing is that we've a very good
combination of Internet people, gaming people, creative people, and live services people. You have to get the
right blend of talent that can keep these things.
AB: Can you talk about the Facebook Credit? How does that change the payment landscape and what does that mean for
a social gaming company like yours?
JP: I think that if Facebook were to create a universal payment system for a platform as large as theirs, I can imagine it
would grow the ecosystem and drive conversion rates. Look at what happened to Amazon when they did 1-Click
Ordering. I think it could have [a] material impact on our business.
AB: When you look out a couple of years, what do you see as the biggest challenges for Playdom?
JP: Our company has tripled in size in the last three months and when you're growing like that, just staying high quality
and high efficiency while driving absolute volume and throughput is a challenge. We are on a path to increase the
size of our company by 5-10x in one year from a not-so-insignificant base. And in doing that you can create chaos
or you can create a beautiful piece of art, that is the challenge.
AB: Can you give us some sense of how big Playdom is and how fast you might be growing?
JP: We have about 28 million users a month right now. We have about 220 full-time people, rapidly growing. We have
north of $50 million in revenue this year. We are profitable.](https://image.slidesharecdn.com/9f3e0384-5c68-4280-87ab-c09a5a0212d7-150425212220-conversion-gate01/85/GaaS-Whitepaper-2011-220-320.jpg)
![Page 221
January 24, 2011
Industry Report
AB: Of 25 million people that you mentioned, what's the breakup between Facebook and MySpace?
JP: I'm guessing 60/40 on MySpace because we [have] 13 applications on MySpace and six on Facebook; but our
revenue distribution tilts a little bit more toward Facebook.
AB: If you look out three years from now, where do you see Playdom? Do you see yourself as a public company, as an
independent private company, or as a part of any bigger platform?
JP: We're still a very young company with very big dreams and we're trying to build a great self-sustaining enterprise.
There are all kinds of things that could happen along the way. We're not building the company to be sold rapidly.
We're trying to create IP. We're trying to create a strong and lasting infrastructure. We can be a company that is
worth billions of dollars by having hundreds of millions of revenue and having high profit margins. And mostly
we're trying to build great products that people love to play and enjoy playing and hopefully make their lives
happier and meet more people and all the things that come from social gaming.
AB: Thank you so much for speaking with me.](https://image.slidesharecdn.com/9f3e0384-5c68-4280-87ab-c09a5a0212d7-150425212220-conversion-gate01/85/GaaS-Whitepaper-2011-221-320.jpg)


![Page 417
Effective October 7, 2009, ThinkEquity LLC moved from a four-tier Buy/Accumulate/Source of Funds/Sell rating system to a three-tier
Buy/Hold/Sell system. The new ratings appear in our Distribution of Ratings, Firmwide chart. To request historical information, including
previously published reports or statistical information, please call: 866-288-8206, or write to: Director of Research, ThinkEquity LLC, 600
Montgomery Street, San Francisco, California, 94111.
Buy: ThinkEquity expects the stock to generate positive risk-adjusted returns of more than 10% over the next 12 months. ThinkEquity
recommends initiating or increasing exposure to the stock.
Hold: ThinkEquity expects the stock to generate risk-adjusted returns of +/-10% over the next 12 months. ThinkEquity believes the stock
is fairly valued.
Sell: ThinkEquity expects the stock to generate negative risk-adjusted returns of more than 10% during the next 12 months. ThinkEquity
recommends decreasing exposure to the stock.
Distribution of Ratings, Firmwide
ThinkEquity LLC
IB Serv./Past 12 Mos.
Rating Count Percent Count Percent
BUY [B] 154 68.40 20 12.99
HOLD [H] 70 31.10 0 0.00
SELL [S] 1 0.40 0 0.00
This report does not purport to be a complete statement of all material facts related to any company, industry, or security mentioned. The
information provided, while not guaranteed as to accuracy or completeness, has been obtained from sources believed to be reliable. The
opinions expressed reflect our judgment at this time and are subject to change without notice and may or may not be updated. Past
performance should not be taken as an indication or guarantee of future performance, and no representation or warranty, express or
implied, is made regarding future performance. This notice shall not constitute an offer to sell or the solicitation of an offer to buy, nor shall
there be any sale of these securities in any state in which said offer, solicitation, or sale would be unlawful prior to registration or
qualification under the securities laws of any such state. This research report was originally prepared and distributed to institutional clients
of ThinkEquity LLC. Recipients who are not market professionals or institutional clients of ThinkEquity LLC should seek the advice of their
personal financial advisors before making any investment decisions based on this report. Additional information on the securities
referenced is available upon request. In the event that this is a compendium report (covers more than six ThinkEquity LLC-covered
subject companies), ThinkEquity LLC may choose to provide specific disclosures for the subject companies by reference. To request
more information regarding these disclosures, please call: 866-288-8206, or write to: Director of Research, ThinkEquity LLC, 600
Montgomery Street, San Francisco, California, 94111. Stocks mentioned in this report are not covered by ThinkEquity LLC unless
otherwise mentioned. Member of FINRA and SIPC. Copyright 2011 ThinkEquity LLC, A Panmure Gordon Company
January 24, 2011
Industry Report](https://image.slidesharecdn.com/9f3e0384-5c68-4280-87ab-c09a5a0212d7-150425212220-conversion-gate01/85/GaaS-Whitepaper-2011-417-320.jpg)

This report summarizes the analyst's thesis on the emergence of multi-channel games-as-a-service and ubiquitous games accessed through cloud computing. Some key points: - The report estimates the worldwide video game market will grow at a 7% CAGR to $54 billion by 2014, with shifting platform shares away from consoles towards online and mobile games. - Emerging business models like free-to-play, virtual goods, subscriptions, and hybrid models are expected to complement the shift from games as products to games as services. Virtual goods revenues are projected to reach $20 billion by 2014. - Social and mobile games are forecasted to be the fastest growing segments, at 35% and


