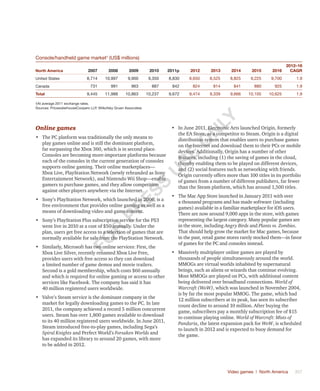
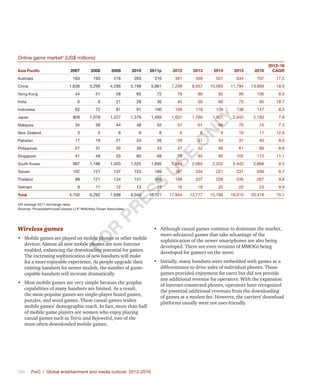
Downloaded 256 times
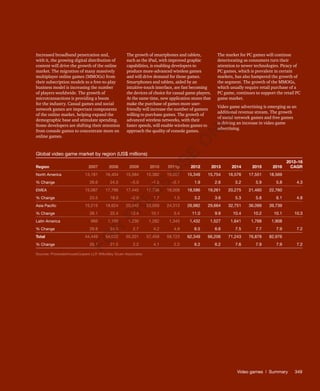


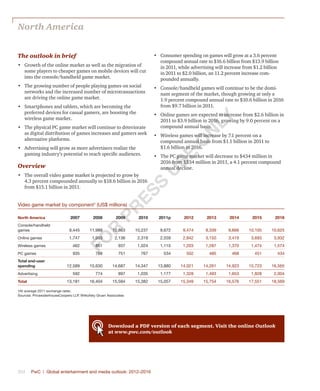
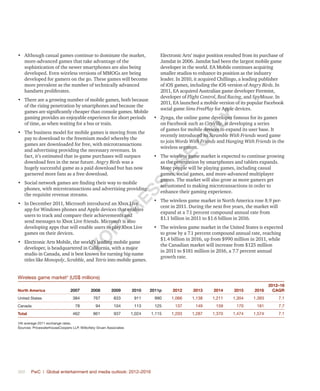
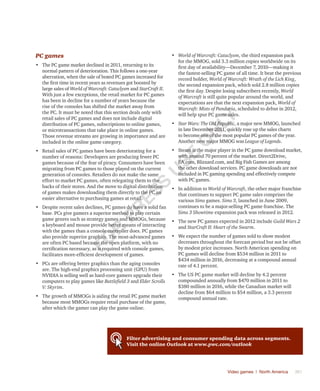
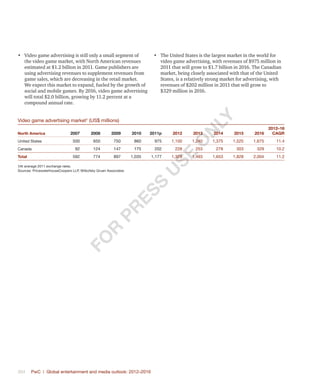
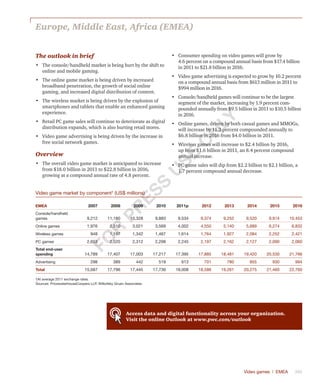
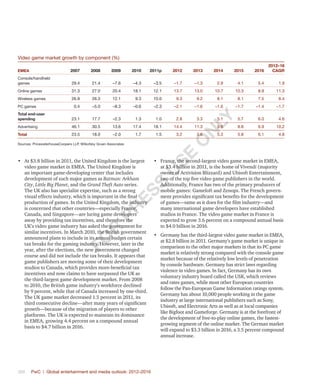
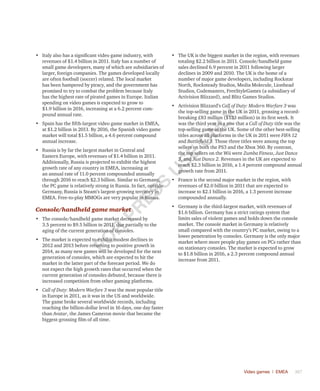

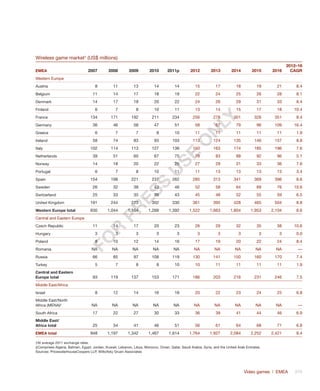
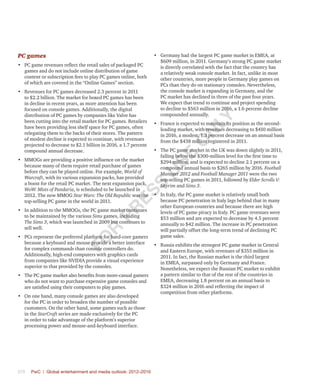
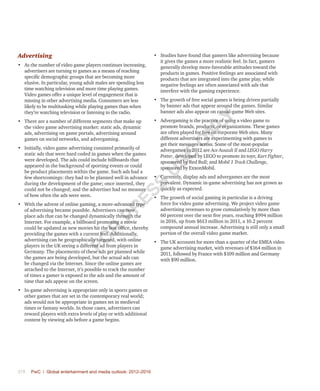
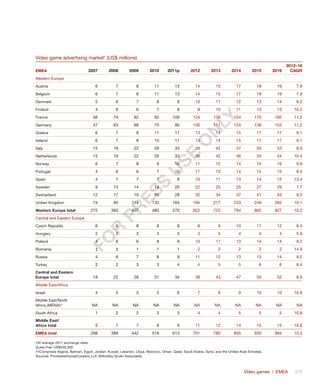
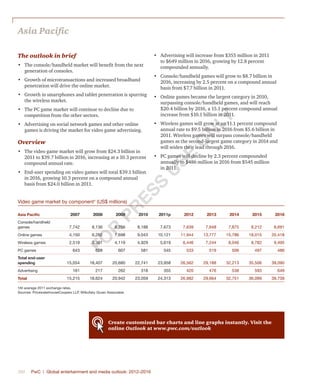
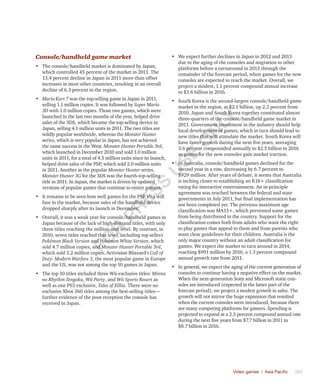
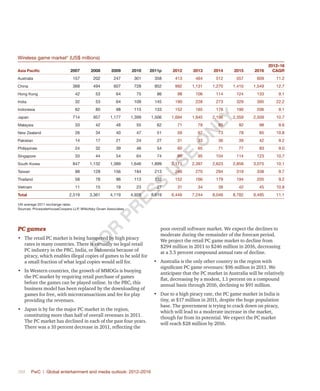
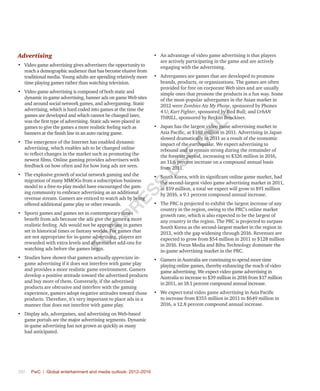
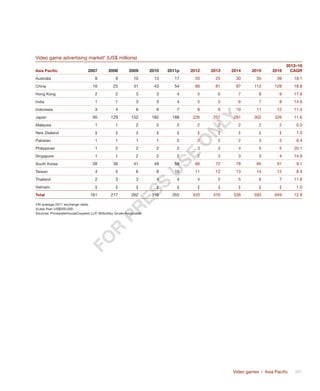
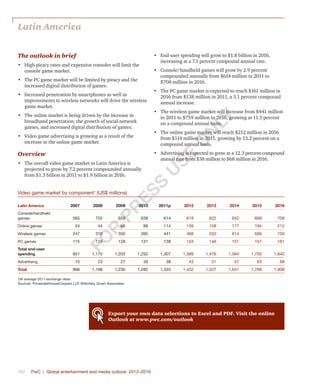
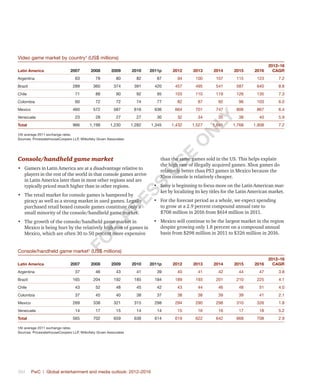
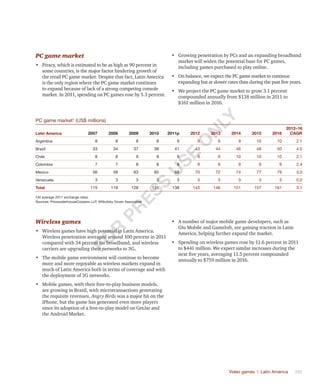
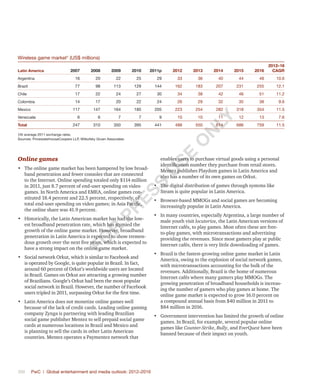

The video game market is projected to grow from $58.7 billion in 2011 to $83 billion in 2016, with Asia Pacific being the largest and fastest growing region. Online games and wireless games will be the fastest growing categories, with online games surpassing console games to become the largest category by 2016. Increased broadband penetration and the shift to free-to-play online games is driving online game growth, while improved smartphone and tablet graphics are fueling wireless game expansion. The growth of new platforms is offsetting declines in console and PC games.


![[ls머트리얼즈]LS Materials 417200 Algorithm Investment Report](https://cdn.slidesharecdn.com/ss_thumbnails/lsmaterials417200algorithminvestmentreport-260202182715-66072c7b-thumbnail.jpg?width=640&height=640&fit=bounds)


