Download to read offline

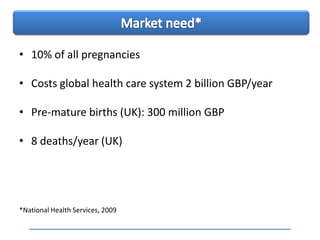


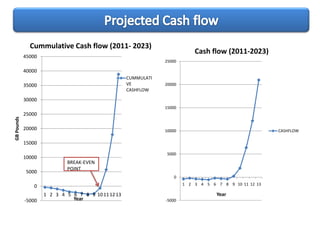


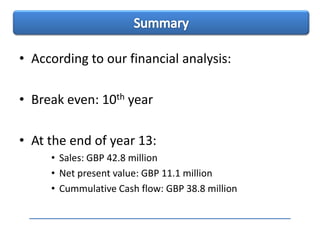


The document outlines a financial plan for G7 Diagnostics to develop, manufacture, and commercialize a point-of-care diagnostic device called SAPHVID for early detection of pre-eclampsia, including projected costs, sales forecasts, profitability, and an exit strategy after 13 years when competition increases and new technologies emerge. The analysis estimates break even will occur in year 10 and the company will have positive cash flow, an NPV of £11.1 million, and cumulative cash of £38.8 million by the end of year 13 when an acquisition by companies like Alere or Roche is planned.


