Download to read offline


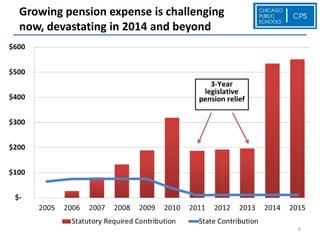


The Chicago Public Schools budget faces major deficits over the next three years due to declining revenues and increasing expenses like pensions. The FY13 budget is projected to have a $600-700 million deficit, with FY14 and FY15 deficits expected to exceed $1 billion each. To address this, the budget process aims to maximize funding to schools while reducing central office costs. However, bold actions are needed to solve the district's long-term financial problems, especially growing pension expenses, and this will require cooperation from teachers, principals, and state legislators.


![Presentation to Board on School Actions [CPS Portfolio Office]](https://cdn.slidesharecdn.com/ss_thumbnails/cpsportfoliooffice-schoolactionsboardpresentation-120222152252-phpapp01-thumbnail.jpg?width=640&height=640&fit=bounds)


