- Konami Corporation reported consolidated financial results for the year ended March 31, 2010, with net revenues of 262.1 billion yen, operating income of 18.6 billion yen, and net income attributable to the company of 13.3 billion yen.
- Key highlights included a 15.4% decrease in net revenues and 31.8% decrease in operating income compared to the previous fiscal year.
- For the fiscal year ending March 31, 2011, the company is forecasting net revenues to increase 8.7% to 285 billion yen and net income attributable to the company to increase 1.4% to 13.5 billion yen.
Presentatie Locatus tijdens Symposium Deventer Binnenstad 2020deventerbinnenstad
Presentatie Gerard Zandbergen
— algemeen directeur Locatus BV — tijdens het Symposium "Deventer Binnenstad 2020"
Het symposium Deventer binnenstad 2020 is een initiatief van de Vereniging Commercieel Onroerend goed Deventer (VCOD), MKB Deventer, Koninklijke Horeca Nederland afdeling Deventer, en de gemeente Deventer. Het symposium werdt georganiseerd door de Stichting Deventer Binnenstadsmanagement.
VIII Jornadas de la tapa de Albacete
Del 3 al 6, del 10 al 13, del 17 al 20 y del 24 al 27 de octubre
El precio de la tapa será de 2€ tapa o media ración, excluida la bebida o se puede pedir con caña por 3€.
Implicitly or explicitly all competing businesses employ a strategy to select a mix
of marketing resources. Formulating such competitive strategies fundamentally
involves recognizing relationships between elements of the marketing mix (e.g.,
price and product quality), as well as assessing competitive and market conditions
(i.e., industry structure in the language of economics).
Personal Brand Statement:
As an Army veteran dedicated to lifelong learning, I bring a disciplined, strategic mindset to my pursuits. I am constantly expanding my knowledge to innovate and lead effectively. My journey is driven by a commitment to excellence, and to make a meaningful impact in the world.
Cracking the Workplace Discipline Code Main.pptxWorkforce Group
Cultivating and maintaining discipline within teams is a critical differentiator for successful organisations.
Forward-thinking leaders and business managers understand the impact that discipline has on organisational success. A disciplined workforce operates with clarity, focus, and a shared understanding of expectations, ultimately driving better results, optimising productivity, and facilitating seamless collaboration.
Although discipline is not a one-size-fits-all approach, it can help create a work environment that encourages personal growth and accountability rather than solely relying on punitive measures.
In this deck, you will learn the significance of workplace discipline for organisational success. You’ll also learn
• Four (4) workplace discipline methods you should consider
• The best and most practical approach to implementing workplace discipline.
• Three (3) key tips to maintain a disciplined workplace.
Attending a job Interview for B1 and B2 Englsih learnersErika906060
It is a sample of an interview for a business english class for pre-intermediate and intermediate english students with emphasis on the speking ability.
[Note: This is a partial preview. To download this presentation, visit:
https://www.oeconsulting.com.sg/training-presentations]
Sustainability has become an increasingly critical topic as the world recognizes the need to protect our planet and its resources for future generations. Sustainability means meeting our current needs without compromising the ability of future generations to meet theirs. It involves long-term planning and consideration of the consequences of our actions. The goal is to create strategies that ensure the long-term viability of People, Planet, and Profit.
Leading companies such as Nike, Toyota, and Siemens are prioritizing sustainable innovation in their business models, setting an example for others to follow. In this Sustainability training presentation, you will learn key concepts, principles, and practices of sustainability applicable across industries. This training aims to create awareness and educate employees, senior executives, consultants, and other key stakeholders, including investors, policymakers, and supply chain partners, on the importance and implementation of sustainability.
LEARNING OBJECTIVES
1. Develop a comprehensive understanding of the fundamental principles and concepts that form the foundation of sustainability within corporate environments.
2. Explore the sustainability implementation model, focusing on effective measures and reporting strategies to track and communicate sustainability efforts.
3. Identify and define best practices and critical success factors essential for achieving sustainability goals within organizations.
CONTENTS
1. Introduction and Key Concepts of Sustainability
2. Principles and Practices of Sustainability
3. Measures and Reporting in Sustainability
4. Sustainability Implementation & Best Practices
To download the complete presentation, visit: https://www.oeconsulting.com.sg/training-presentations
LA HUG - Video Testimonials with Chynna Morgan - June 2024Lital Barkan
Have you ever heard that user-generated content or video testimonials can take your brand to the next level? We will explore how you can effectively use video testimonials to leverage and boost your sales, content strategy, and increase your CRM data.🤯
We will dig deeper into:
1. How to capture video testimonials that convert from your audience 🎥
2. How to leverage your testimonials to boost your sales 💲
3. How you can capture more CRM data to understand your audience better through video testimonials. 📊
Skye Residences | Extended Stay Residences Near Toronto Airportmarketingjdass
Experience unparalleled EXTENDED STAY and comfort at Skye Residences located just minutes from Toronto Airport. Discover sophisticated accommodations tailored for discerning travelers.
Website Link :
https://skyeresidences.com/
https://skyeresidences.com/about-us/
https://skyeresidences.com/gallery/
https://skyeresidences.com/rooms/
https://skyeresidences.com/near-by-attractions/
https://skyeresidences.com/commute/
https://skyeresidences.com/contact/
https://skyeresidences.com/queen-suite-with-sofa-bed/
https://skyeresidences.com/queen-suite-with-sofa-bed-and-balcony/
https://skyeresidences.com/queen-suite-with-sofa-bed-accessible/
https://skyeresidences.com/2-bedroom-deluxe-queen-suite-with-sofa-bed/
https://skyeresidences.com/2-bedroom-deluxe-king-queen-suite-with-sofa-bed/
https://skyeresidences.com/2-bedroom-deluxe-queen-suite-with-sofa-bed-accessible/
#Skye Residences Etobicoke, #Skye Residences Near Toronto Airport, #Skye Residences Toronto, #Skye Hotel Toronto, #Skye Hotel Near Toronto Airport, #Hotel Near Toronto Airport, #Near Toronto Airport Accommodation, #Suites Near Toronto Airport, #Etobicoke Suites Near Airport, #Hotel Near Toronto Pearson International Airport, #Toronto Airport Suite Rentals, #Pearson Airport Hotel Suites
RMD24 | Retail media: hoe zet je dit in als je geen AH of Unilever bent? Heid...BBPMedia1
Grote partijen zijn al een tijdje onderweg met retail media. Ondertussen worden in dit domein ook de kansen zichtbaar voor andere spelers in de markt. Maar met die kansen ontstaan ook vragen: Zelf retail media worden of erop adverteren? In welke fase van de funnel past het en hoe integreer je het in een mediaplan? Wat is nu precies het verschil met marketplaces en Programmatic ads? In dit half uur beslechten we de dilemma's en krijg je antwoorden op wanneer het voor jou tijd is om de volgende stap te zetten.
Discover the innovative and creative projects that highlight my journey throu...dylandmeas
Discover the innovative and creative projects that highlight my journey through Full Sail University. Below, you’ll find a collection of my work showcasing my skills and expertise in digital marketing, event planning, and media production.
"𝑩𝑬𝑮𝑼𝑵 𝑾𝑰𝑻𝑯 𝑻𝑱 𝑰𝑺 𝑯𝑨𝑳𝑭 𝑫𝑶𝑵𝑬"
𝐓𝐉 𝐂𝐨𝐦𝐬 (𝐓𝐉 𝐂𝐨𝐦𝐦𝐮𝐧𝐢𝐜𝐚𝐭𝐢𝐨𝐧𝐬) is a professional event agency that includes experts in the event-organizing market in Vietnam, Korea, and ASEAN countries. We provide unlimited types of events from Music concerts, Fan meetings, and Culture festivals to Corporate events, Internal company events, Golf tournaments, MICE events, and Exhibitions.
𝐓𝐉 𝐂𝐨𝐦𝐬 provides unlimited package services including such as Event organizing, Event planning, Event production, Manpower, PR marketing, Design 2D/3D, VIP protocols, Interpreter agency, etc.
Sports events - Golf competitions/billiards competitions/company sports events: dynamic and challenging
⭐ 𝐅𝐞𝐚𝐭𝐮𝐫𝐞𝐝 𝐩𝐫𝐨𝐣𝐞𝐜𝐭𝐬:
➢ 2024 BAEKHYUN [Lonsdaleite] IN HO CHI MINH
➢ SUPER JUNIOR-L.S.S. THE SHOW : Th3ee Guys in HO CHI MINH
➢FreenBecky 1st Fan Meeting in Vietnam
➢CHILDREN ART EXHIBITION 2024: BEYOND BARRIERS
➢ WOW K-Music Festival 2023
➢ Winner [CROSS] Tour in HCM
➢ Super Show 9 in HCM with Super Junior
➢ HCMC - Gyeongsangbuk-do Culture and Tourism Festival
➢ Korean Vietnam Partnership - Fair with LG
➢ Korean President visits Samsung Electronics R&D Center
➢ Vietnam Food Expo with Lotte Wellfood
"𝐄𝐯𝐞𝐫𝐲 𝐞𝐯𝐞𝐧𝐭 𝐢𝐬 𝐚 𝐬𝐭𝐨𝐫𝐲, 𝐚 𝐬𝐩𝐞𝐜𝐢𝐚𝐥 𝐣𝐨𝐮𝐫𝐧𝐞𝐲. 𝐖𝐞 𝐚𝐥𝐰𝐚𝐲𝐬 𝐛𝐞𝐥𝐢𝐞𝐯𝐞 𝐭𝐡𝐚𝐭 𝐬𝐡𝐨𝐫𝐭𝐥𝐲 𝐲𝐨𝐮 𝐰𝐢𝐥𝐥 𝐛𝐞 𝐚 𝐩𝐚𝐫𝐭 𝐨𝐟 𝐨𝐮𝐫 𝐬𝐭𝐨𝐫𝐢𝐞𝐬."
Putting the SPARK into Virtual Training.pptxCynthia Clay
This 60-minute webinar, sponsored by Adobe, was delivered for the Training Mag Network. It explored the five elements of SPARK: Storytelling, Purpose, Action, Relationships, and Kudos. Knowing how to tell a well-structured story is key to building long-term memory. Stating a clear purpose that doesn't take away from the discovery learning process is critical. Ensuring that people move from theory to practical application is imperative. Creating strong social learning is the key to commitment and engagement. Validating and affirming participants' comments is the way to create a positive learning environment.
What is the TDS Return Filing Due Date for FY 2024-25.pdfseoforlegalpillers
It is crucial for the taxpayers to understand about the TDS Return Filing Due Date, so that they can fulfill your TDS obligations efficiently. Taxpayers can avoid penalties by sticking to the deadlines and by accurate filing of TDS. Timely filing of TDS will make sure about the availability of tax credits. You can also seek the professional guidance of experts like Legal Pillers for timely filing of the TDS Return.
Falcon stands out as a top-tier P2P Invoice Discounting platform in India, bridging esteemed blue-chip companies and eager investors. Our goal is to transform the investment landscape in India by establishing a comprehensive destination for borrowers and investors with diverse profiles and needs, all while minimizing risk. What sets Falcon apart is the elimination of intermediaries such as commercial banks and depository institutions, allowing investors to enjoy higher yields.
The Influence of Marketing Strategy and Market Competition on Business Perfor...
Fy 2010
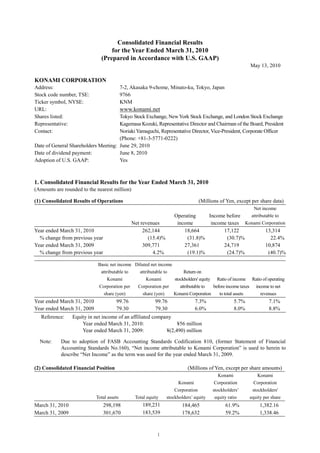
1. Consolidated Financial Results
for the Year Ended March 31, 2010
(Prepared in Accordance with U.S. GAAP)
May 13, 2010
KONAMI CORPORATION
Address: 7-2, Akasaka 9-chome, Minato-ku, Tokyo, Japan
Stock code number, TSE: 9766
Ticker symbol, NYSE: KNM
URL: www.konami.net
Shares listed: Tokyo Stock Exchange, New York Stock Exchange, and London Stock Exchange
Representative: Kagemasa Kozuki, Representative Director and Chairman of the Board, President
Contact: Noriaki Yamaguchi, Representative Director, Vice-President, Corporate Officer
(Phone: +81-3-5771-0222)
Date of General Shareholders Meeting: June 29, 2010
Date of dividend payment: June 8, 2010
Adoption of U.S. GAAP: Yes
1. Consolidated Financial Results for the Year Ended March 31, 2010
(Amounts are rounded to the nearest million)
(1) Consolidated Results of Operations (Millions of Yen, except per share data)
Net income
Operating Income before attributable to
Net revenues income income taxes Konami Corporation
Year ended March 31, 2010 262,144 18,664 17,122 13,314
% change from previous year (15.4)% (31.8)% (30.7)% 22.4%
Year ended March 31, 2009 309,771 27,361 24,719 10,874
% change from previous year 4.2% (19.1)% (24.7)% (40.7)%
Basic net income Diluted net income
attributable to attributable to Return on
Konami Konami stockholders' equity Ratio of income Ratio of operating
Corporation per Corporation per attributable to before income taxes income to net
share (yen) share (yen) Konami Corporation to total assets revenues
Year ended March 31, 2010 99.76 99.76 7.3% 5.7% 7.1%
Year ended March 31, 2009 79.30 79.30 6.0% 8.0% 8.8%
Reference: Equity in net income of an affiliated company
Year ended March 31, 2010: ¥56 million
Year ended March 31, 2009: ¥(2,490) million
Note: Due to adoption of FASB Accounting Standards Codification 810, (former Statement of Financial
Accounting Standards No.160), “Net income attributable to Konami Corporation” is used to herein to
describe “Net Income” as the term was used for the year ended March 31, 2009.
(2) Consolidated Financial Position (Millions of Yen, except per share amounts)
Konami Konami
Konami Corporation Corporation
Corporation stockholders’ stockholders'
Total assets Total equity stockholders’ equity equity ratio equity per share
March 31, 2010 298,198 189,231 184,465 61.9% 1,382.16
March 31, 2009 301,670 183,539 178,632 59.2% 1,338.46
1
2. (3) Consolidated Cash Flows (Millions of Yen)
Net cash provided by (used in) Cash and
Operating Investing Financing cash equivalents
activities activities activities at end of year
Year ended March 31, 2010 14,297 (6,449) (10,744) 50,740
Year ended March 31, 2009 30,131 (5,715) (21,004) 53,568
2. Cash Dividends
Cash dividends per share (yen) Cash dividend
Total cash rate for
First Second Third Payout ratio
Record Date dividends stockholders’
quarter quarter quarter Year end Annual (consolidated)
(annual) equity
end end end
(consolidated)
Year ended March
- 27.00 - 27.00 54.00 ¥7,315 million 68.1% 4.0%
31, 2009
Year ended March
- 27.00 - 27.00 54.00 ¥7,206 million 54.1% 4.0%
31, 2010
Year ending March
- 16.00 - 16.00 32.00 31.6%
31, 2011 -Forecast-
3. Consolidated Earnings Forecast for the Year Ending March 31, 2011
(Millions of Yen, except per share data)
Net income
Net income attributable to
Net income attributable to Konami
Operating before income Konami Corporation per
Net revenues income taxes Corporation share
Year ending March 31, 2011 285,000 24,500 22,500 13,500
101.15
% change from previous year 8.7% 31.3% 31.4% 1.4%
Note: We do not disclose projected consolidated results for interim periods.
4. Other
(1) Changes in significant consolidated subsidiaries during the period (status changes of subsidiaries due to
changes in the scope of consolidation) : None
(2) Changes in accounting principles, procedures and reporting policies for quarterly consolidated financial
statements (items to be disclosed in “Significant change in preparation basis for quarterly consolidated
financial statements”)
1. Changes accompanying amendment of accounting standard: Yes
2. Other: None
Please refer to page 25 for details.
(3) Number of shares issued (Common Stock)
1. Number of shares issued: (Treasury stock included)
Year ended March 31, 2010 143,500,000 shares
Year ended March 31, 2009 143,500,000 shares
2. Number of Treasury Stock:
Year ended March 31, 2010 10,039,336 shares
Year ended March 31, 2009 10,038,498 shares
3. Average number of shares outstanding:
Year ended March 31, 2010 133,461,138 shares
Year ended March 31, 2009 137,124,130 shares
2
3. (Reference) Summary of Non-consolidated Financial Results
1. Results for the Year Ended March 31, 2010
(1) Non-consolidated Results of Operations
(Millions of Yen, except per share data)
Operating revenues Operating income Ordinary income Net income
Year ended March 31, 2010 19,295 14,609 14,495 14,092
% change from previous year (10.1)% (7.3)% (7.8)% 49.1 %
Year ended March 31, 2009 21,456 15,755 15,721 9,454
% change from previous year (15.8)% (24.4)% (23.2)% (45.7)%
Basic net income Diluted net income
per share (yen) per share (yen)
Year ended March 31, 2010 105.60 -
Year ended March 31, 2009 68.95 -
(2) Non-consolidated Financial Position
(Millions of Yen, except per share data)
Net assets
Total assets Total net assets Equity ratio per share
March 31, 2010 178,743 153,012 85.6% 1,146.50
March 31, 2009 180,952 146,136 80.8% 1,094.97
Reference: Total Stockholders’ equity
Year ended March 31, 2010: ¥ 153,012 million
Year ended March 31, 2009: ¥ 146,136 million
Cautionary Statement with Respect to Forward-Looking Statements:
Statements made in this document with respect to our current plans, estimates, strategies and beliefs, including
the above forecasts, are forward-looking statements about our future performance. These statements are based on
management's assumptions and beliefs in light of information currently available to it and, therefore, you should
not place undue reliance on them. A number of important factors could cause actual results to be materially
different from and worse than those discussed in forward-looking statements. Such factors include, but are not
limited to: (i) changes in economic conditions affecting our operations; (ii) fluctuations in currency exchange
rates, particularly with respect to the value of the Japanese yen, the U.S. dollar and the Euro; (iii) our ability to
continue to win acceptance of our products, which are offered in highly competitive markets characterized by the
continuous introduction of new products, rapid developments in technology and subjective and changing
consumer preferences; (iv) our ability to successfully expand internationally with a focus on our Digital
Entertainment business and Gaming & System business; (v) our ability to successfully expand the scope of our
business and broaden our customer base through our Health & Fitness business; (vi) regulatory developments and
changes and our ability to respond and adapt to those changes; (vii) our expectations with regard to further
acquisitions and the integration of any companies we may acquire; and (viii) the outcome of existing
contingencies.
Please refer to pages 8 and 9 for further information regarding our business forecasts.
3
4. 1. Business Performance
1. Analysis of Business Performance
(1) Business Overview
Although the Japanese economy showed signs of recovery from the recession that had been continuing since
last year, the business environment during the fiscal year ended March 31, 2010 continued to be uncertain,
with reduced personal consumption due to factors such as severe income and employment situations.
Regarding the entertainment industry that KONAMI CORPORATION and its subsidiaries (“Konami”)
operate in, despite measures taken to arouse demand as its platforms have become widespread, the home
video game market remained challenging – both in Japan and overseas – as compared to the previous fiscal
year. The measures included the reduction of standalone video game console prices by various hardware
manufacturers, the launch of new handheld video game consoles and the release of major game titles by
various software producing companies towards the year-end sales season. The amusement arcade market
also continued to see a decline in the volume of customer traffic due to the impact of the H1N1 influenza
pandemic as well as a decline in the operators’ investment motive affected by the severe economic
condition. In the gaming market, while the environment continued to be severe, affecting even the major
operators in Las Vegas, there are some promising signs overseas, such as the case where casinos in
Singapore were legalized and opened.
In the health and fitness industry, heightened interest in and demand related to the maintenance and
promotion of good health is expected to continue into the future due to the aging population of Japan as well
as concern over lifestyle diseases.
Against such a backdrop, the digital entertainment segment of the KONAMI CORPORATION and its
subsidiaries (“Konami”) rolled out the latest titles in home video game software series, with a focus on
popular Konami series such as the soccer game Winning Eleven (known in the US and Europe as PRO
EVOLUTION SOCCER). New titles, such as LOVEPLUS, which is a new romantic communication game,
and titles featuring popular overseas content enjoyed steady sales. As products for amusement arcades,
MAH-JONG FIGHT CLUB GARYOTENSEI, the latest in the series, and the large-scale mass medal game
FORTUNE TRINITY continued to be satisfactory. Card game products also showed favorable sales.
Turnover in home video game software and arcade games, however, has declined in comparison to the same
period of the previous year, which was marked by the release of major game titles.
As for the Gaming & System segment, Konami enriched its product lineup in the North American and
Australian markets, with a focus, in the case of video slot machines, on the new-generation cabinet (outer
structure) Podium running the K2V series, and on the Advantage 5 series in the case of mechanical stepper
machines. Those sales progressed steadily. Meanwhile, we also increased the sale of the Konami Casino
Management System and the profits from participation agreements (equipment sales in which profits are
shared).
In the Health & Fitness segment, we increased the number of new fitness clubs under Konami’s direct
management and expanded the portfolio of fitness clubs outsourced to us. At the same time, we advanced
the development and introduction of facilities and services that meet the diversifying needs of customers.
Furthermore, we reinforced the marketing of health products, drove forward the computerization of health
management and strove to expand and enrich services, both within and outside our facilities, supporting the
promotion and maintenance of good health.
4
5. Our consolidated results for the year ended March 31, 2010 are as follows: consolidated net revenues
amounted to ¥262,144 million (a year-on-year decrease of 15.4%), operating income was ¥18,664 million (a
year-on-year decrease of 31.8%), net income before income taxes was ¥17,122 million (a year-on-year
decrease of 30.7%), and net income attributable to Konami Corporation was ¥13,314 million (a year-on-year
increase of 22.4%).
(2) Performance by Business Segment
Summary of net revenues by business segment:
Millions of Yen
Year ended Year ended
% change
March 31, 2009 March 31, 2010
Digital Entertainment ¥187,628 ¥142,650 (24.0)
Gaming & System 18,336 19,996 9.1
Health & Fitness 89,965 85,765 (4.7)
Other and Eliminations 13,842 13,733 (0.8)
Consolidated net revenues ¥309,771 ¥262,144 (15.4)
Digital Entertainment
Computer & Video Games business: In Japan, a diverse lineup of home video game products was released
by Konami. In addition to sports titles – which are Konami’s forte – such as WORLD SOCCER Winning
Eleven 2010 (known in the US and Europe as PES 2010 - Pro Evolution Soccer) and the JIKKYOU
PAWAFURU PUROYAKYU series, Konami also released the animated title Pen 1 Grand Prix: A penguin's
troubles Special and LOVEPLUS in the romance themed simulation series, as one of the home video game
software.
Furthermore, we promoted various popular Konami titles through online distribution for mobile phones and
terminals. This included the commencement of the online distribution, such as DanceDanceRevolution S and
Mobile PAWAFURU PUROYAKYU, for the Windows phone, following the distribution of software titles for
the iPhone and iPod touch.
Amusement business: As amusement arcade video games, MAH-JONG FIGHT CLUB GARYOTENSEI,
BASEBALL HEROES 2009 HA-SHA and QUIZ MAGIC ACADEMY Ⅶ, the latest titles in their series, were
released in addition to popular music game titles. Meanwhile, in medal games, the large-scale token pusher
FORTUNE TRINITY began operation in addition to the new genre mass medal game Infinity Rings.
FORTUNE TRINITY, which was inspired by Las Vegas, is proving popular with its highly innovative show
quality and design.
In order to arouse new demand, Konami launched, in March 2010, an e-money service named PASELI that
utilizes the Konami e-AMUSEMENT service, which links amusement arcades nationwide in Japan through
its network. PASELI has seen favorable reactions since its introduction. Card games business continued to
mark favorable sales.
In North America and Europe, PES 2010 - Pro Evolution Soccer, the music game series
DanceDanceRevolution and game content for overseas consumption, such as SAW, enjoyed favorable sales.
Konami is also promoting the development of content, which meets the needs of overseas markets, for
5
6. mobile phones and terminals. Mobile application programs for the iPhone/iPod touch that were produced
overseas won international awards abroad.
Due to the absence of major titles, such as METAL GEAR SOLID 4 GUNS OF THE PATRIOTS of our
previous fiscal year, however, the overall sales fell this quarter as compared to the same period in the
previous fiscal year.
In terms of financial performance, consolidated net revenues for the year ended March 31, 2010 in this
segment amounted to ¥142,650 million (a year-on-year decrease of 24.0%).
Gaming & System
In the North American market, the Advantage 5 five-reel stepper machine series, which has become a
standard item, and the Podium, a new generation cabinet (outer structure) running the K2V series, continue
to enjoy favorable sales. Sales of the Konami Casino Management System, a system that supports a steady
flow of income through maintenance and services, and sales through participation agreements (in which
profits are shared with casino operators) increased and are steadily expanding their respective market shares.
Full-scale marketing and sales are also expanding in Central and South America, building a distributor
network for the market.
In the Australian market, sales of video slot machines, including the new cabinet Podium running the K2V
series, increased favorably. The introduction of the Konami Casio Management System in the market also
contributed to the improvement of Konami revenues.
The Global Gaming Expo, one of the gaming industry’s largest trade fairs, was held in November 2009 in
Las Vegas. Konami exhibited, and received favorable reviews for, a wide-ranging product lineup that
responded to the needs of each relevant market. It included new content for the K2V series, which was
loaded onto the Podium new cabinet (outer structure) for the expo; Advantage Revolution, the latest slot
machine in which progress has been made in the staging elements; Advantage 5; and the Konami Casino
Management System.
In terms of financial performance, consolidated net revenues for the year ended March 31, 2010 in this
segment amounted to ¥19,996 million (a year-on-year increase of 9.1%).
Health & Fitness
A difficult business climate persisted in the fitness club industry as consumer spending remained suppressed
due to uncertainty over the future, price-competition progressed further and the increase in the number of
fitness clubs made it difficult to recruit new members. Against such a backdrop, Konami strove to enhance
its services – both within and outside its facilities – and its health products as well as expand the range of
services and the lineup of products that meet regional characteristics and customer needs.
Operation of fitness clubs: Regarding directly managed facilities, 21 facilities were closed through merger
and elimination of facilities executed as part of structural reform. Meanwhile, a total of the six facilities,
including relocated and reconstructed facilities, were opened during the fiscal year such as
Motoyamaminami (Hyogo Prefecture), Kitahama (Osaka Prefecture) and Sendai Nagamachi (Miyagi
Prefecture). Furthermore, at some facilities, we introduced a digital golf simulator system to enhance the
golf teaching program and health management and exercise guidance that combine the services provided by
fitness clubs and medical institutions. We developed facilities meeting the characteristics of each region,
upgraded and enhanced services utilizing IT and Konami’s strengths in health management, exercise and
nutritional guidance, and provided support for the maintenance and promotion of good health – both within
and outside our facilities – to our customers, whose health consciousness is on the rise.
6
7. Operation of sports facilities outsourced to us: As to the management of facilities outsourced to Konami, we
added six facilities including the Mikamo Clean Center Residual Heat Utilization Facility (Tochigi
Prefecture), the Hiroshima Prefectural Sports Center (Hiroshima Prefecture) and the Sakai Municipal
Mihara Sports Center (Osaka Prefecture) to the portfolio, and we continued to promote the health of
community residents by making use of Konami’s know-how and experience in the operation of public
facilities, etc. The number of sports facilities managed by Konami, including those that are directly managed
or managed on an outsourced basis, was 327 nationwide as of March 31, 2010.
Health products: As to health products, we released EXERCISEWATER ZERO, a sugar-free beverage with
zero calories. We also launched the second catalog sales at post offices in Tokyo through an alliance with
the Tokyo Branch of Japan Post Network Co., Ltd.
In terms of financial performance, consolidated net revenues for the year ended March 31, 2010 in this
segment amounted to ¥85,765 million (a year-on-year decrease of 4.7%).
7
8. (3) Outlook for the Fiscal Year Ending March 31, 2011
Digital Entertainment
In digital entertainment, we will continue to focus on the large-scale European and North American video
game software markets in addition to Japan. In particular, regarding global titles, we launched the latest
installment of the METAL GEAR series, METAL GEAR SOLID PEACE WALKER, which includes
cooperative game-play utilizing the game console’s local wireless ad-hoc connection (a first for this series),
and intend to launch Castlevania -Lords of Shadow- sequentially in Japan, Asia, North America and Europe.
As for the globally popular Winning Eleven (known in the US and Europe as PES (PRO EVOLUTION
SOCCER)) soccer game series, we will focus on further enriching the content so that it responds even more
to expectations during this official “Year of Sports” in Japan when soccer fans are becoming even more
passionate than usual. We will continue rolling out titles worldwide on multiple platforms, beginning with
the Japan launch of WORLD SOCCER WinningEleven 2010 Aoki Samurai no Chosen, the newest title in the
series, which is scheduled in May 2010 as the popularity of soccer is expected to be heightened in Japan. We
also plan to launch fulfilling core titles sequentially in Japan, including LOVEPLUSPLUS, a sequel to
LOVEPLUS, which is winning favorable recognition in the market.
In North America and Europe, in addition to soccer titles and animated content, we will focus our efforts on
the music game DanceDanceRevolution series—which remains a perennial favorite—and other music
games, which is a genre that Konami exhibits particular strength in. Furthermore, we will also devote our
efforts to the online marketing of titles for the increasing number of game consoles with network
connectivity as well as for mobile phones and terminals.
In arcade video games, we will further seek to upgrade and enlarge the lineup of products that utilize the
e-AMUSEMENT service. In addition to titles from our standard game series, we are scheduled to launch
METAL GEAR ARCADE, a nationwide competitive online game utilizing a 3D TV system. The game has
been attracting the attention of the media since it was shown at the AOU 2010 Amusement Expo.
Meanwhile, in medal games, we are scheduled to launch GI-Turf TV. We also intend to propose a wide
range of industry-leading innovative services by sequentially expanding the number of game machines, such
as the MAH-JONG FIGHT CLUB GARYOTENSEI, that support the PASELI e-money service which was
launched during the spring 2010.
In card games, we will continue to develop our business widely in Japan and abroad.
As for popular content, we will pursue high synergy through multifaceted development that is not restricted
to home video game software, arcade games and card games.
Gaming & System
In slot machine marketing, regarding steppers, we will continue to promote the aggressive marketing of the
Advantage 5 series that is enjoying popularity. In the future, we will actively enter the gaming market in
Asia, such as in Singapore. Regarding video slot machines, we will reinforce product rollout and marketing
with a focus on the new Podium cabinet (outer structure), which was launched during the fiscal year ended
March 31, 2010.
The Konami Casino Management System continues to be adopted in North American and Australian
markets, particularly by major operators. In the future, we will aggressively market this system in other
markets, develop new functions and reinforce the system’s strength as a product. Furthermore, we will seek
to stabilize operations by increasing the amount of steady, periodical income through expansion of
participation agreement (profit sharing with operators) sales.
8
9. Konami plans to further strengthen the collaboration between its three bases—the US, Australia and
Japan—and promote the efficiency of operations and the reinforcement of production and sales.
Furthermore, we plan to develop new products that respond to changes in society and meet demands, and
enhance the added-value of existing products. We will continue to use Konami’s strengths in the domain of
entertainment as the foundation for proposing new products that will bring even greater enjoyment to our
customers.
Health & Fitness
Market conditions are expected to remain harsh for the health and fitness segment. However, we believe that
opportunities for the operation of fitness clubs and the development and marketing of health and fitness
equipment will continue to increase with heightened social awareness, against the backdrop of an aging
society and government measures taken against lifestyle diseases, of promoting good health. Under such
circumstances, Konami strives to accurately grasp diversifying customer needs and aim to enhance the
added-value of Konami Sports Clubs by proposing new lifestyles.
In April 2010, we opened Konami Sports Club Kami-Ooka. We intend to prepare extensive programs that
meet the various needs of customers of all ages—from children to adults—by opening facilities at highly
convenient locations in communities that promise to become a center of various people’s lives, adopting
fitness equipment such as the BODYBIKE (stationary bicycle), which allows body fat to be burned while
pedaling to music, and programs like the LES MILLS PROGRAMS (group exercise), which is featured in 75
countries around the world, and the Undojuku (sports school), based on the concept of physical and mental
training as well as self-development.
We will promote our health and fitness business by leveraging, to the utmost, our strengths in the operation
of more than 300 of Japan’s largest-scale sports clubs, rolling out new facilities that meet regional
characteristics and customer needs, expanding our products and services and by creating synergy through
the enrichment of the programs offered at the facilities, the computerization of health management and the
upgrading, the expansion of our product lineup and other efforts.
Projected consolidated results for the coming year are as follows: net revenue of ¥285,000 million;
operating income of ¥24,500 million; net income before taxes of ¥22,500 million; and net income
attributable to Konami Corporation of ¥13,500 million.
Konami, as a business affected by “hit” products, requires flexibility in how its products are released and is
subject to fluctuations in sales throughout the course of the fiscal year. For this reason, projected
consolidated results for the half year are not disclosed.
We will continue to make efforts to disclose quarterly financial results,.
9
10. 2. Cash Flows
Cash flow summary for the year ended March 31, 2010:
Millions of Yen
Year ended Year ended
Change
March 31, 2009 March 31, 2010
Net cash provided by operating activities ¥30,131 ¥14,297 ¥(15,834)
Net cash used in investing activities (5,715) (6,449) (734)
Net cash used in financing activities (21,004) (10,744) 10,260
Effect of exchange rate changes on cash
(1,974) 68 2,042
and cash equivalents
Net increase (decrease) in cash and cash
1,438 (2,828) (4,266)
equivalents
Cash and cash equivalents, end of the year ¥53,568 ¥50,740 ¥(2,828)
Cash and cash equivalents (hereafter, referred to as “Net cash”), for the year ended March 31, 2010,
amounted to ¥50,740 million, an decrease of ¥2,828 million compared to the year ended March 31, 2009,
and a year-on-year decrease of 5.3%.
Cash flow summary for each activity for the year ended March 31, 2010 is as follows:
Cash flows from operating activities:
Net cash provided by operating activities amounted to ¥14,297 million for the year ended March 31, 2010, a
year-on-year decrease of 52.6%. This primarily resulted from a decrease in the collection amount of sales
proceeds and an increase in the inventories following a decrease in net income compared to that for the year
ended March 31, 2009, when our Digital Entertainment segment released hit titles for video game software
and amusement arcades. Meanwhile, the amount of income taxes paid in the year ended March 31, 2010
decreased from the year ended March 31, 2009 due to a decrease in taxable income.
Cash flows from investing activities:
Net cash used in investing activities amounted to ¥6,449 million for the year ended March 31, 2010, a
year-on-year increase of 12.8%. This increase mainly resulted from the lack of proceeds from sale of
property and equipment which existed for the year ended March 31, 2009, despite a decrease in capital
expenditures for investments.
Cash flows from financing activities:
Net cash used in financing activities amounted to ¥10,744 million for the year ended March 31, 2010, a
year-on-year decrease of 48.8%. These financing activities primarily resulted from the lack of purchases of
treasury stock and redemption of bonds which took place during the year ended March 31, 2009.
10
11. The trends of cash flow index are as follows
Year ended Year ended
March 31, 2009 March 31, 2010
Equity-assets ratio (%) 59.2 61.9
Equity-assets ratio at fair value (%) 65.4 80.7
Liabilities to cash flow ratio (years) 1.4 3.0
Interest coverage ratio (times) 20.5 9.1
Equity-assets ratio: Total stockholders' equity / Total assets
Equity-assets ratio at fair value: Total stockholders' equity at fair value / Total assets
Liabilities to cash flow ratio: Interest-bearing liabilities / Cash flows from operating activities
Interest coverage ratio: Cash flows from operating activities / Interest expense
Notes:
1. Each index is calculated from figures prepared in accordance with U.S. generally accepted accounting
principles (U.S. GAAP).
2. Cash flows from operating activities derive from our consolidated cash flow statement.
3. Interest-bearing debt covers all liabilities with interest in our consolidated balance sheet.
3. Basic Policy on the Distribution of Profits
Konami believes that the provision of dividends and the enhancement of corporate value are important
ways to return profits to our shareholders. It is our policy to use retained earnings for investments focused
on business fields with good future possibility in order to continually reinforce Konami’s growth potential
and competitiveness.
As for term-end dividends for the consolidated year ended March 31, 2010, 27 yen per share dividend
was approved at the Board Meeting held on May 13, 2010. As a result, the dividends on an annual basis
will be 54 yen per share, including the distributed interim dividend of 27 yen per share.
Konami plans to distribute dividends of 32 yen per share for the fiscal year ending March 31, 2011.
Special Note:
This document contains “forward-looking statements,” or statements related to future events that are
based on management’s assumptions and beliefs in light of information currently available. These
statements are subject to various risks and uncertainties.
When relying on forward-looking statements to make investments, you should not place undue reliance
on such forward-looking statements. Actual results may be affected by a number of important factors
and materially different from those discussed in forward-looking statements. Such factors include, but
are not limited to, changes in economic conditions affecting our operations, and market trends and
fluctuations in currency exchange rates, particularly with respect to the value of the Japanese yen, the
U.S. dollar and the Euro.
11
12. 2. Organizational Structure of the Konami Group
The Konami Group is a corporate group engaged in the entertainment and health fitness industries
providing customers with “High Quality Life.” The Konami Group is comprised of KONAMI
CORPORATION (“the Company”) and its 22 consolidated subsidiaries and one equity-method affiliate.
The summary overview of the Company, consolidated subsidiaries and equity-method affiliate and the
business segment in which they operate are as follows.
The four business segments shown below are based on the same categorization as described below in “6.
Segment Information” under “4. Consolidated Financial Statements.”
Business Segments Major Companies
Digital Entertainment Konami Digital Entertainment Co., Ltd.
Domestic HUDSON SOFT CO., LTD.
Konami Manufacturing & Service, Inc., One other company
Konami Digital Entertainment, Inc.
Konami Digital Entertainment GmbH
Overseas Konami Digital Entertainment B.V.
Konami Digital Entertainment Limited
Konami Software Shanghai, Inc., Two other companies
Gaming & System Konami Gaming, Inc.
Overseas
Konami Australia Pty Ltd., One other company
Health & Fitness Konami Sports & Life Co., Ltd. (Notes 3)
COMBI WELLNES Corporation
Domestic
Konami Manufacturing & Service, Inc.
Resort Solution Co., Ltd. (Note 2), One other company
Other Domestic KPE, Inc., Konami Real Estate, Inc., One other company
Konami Corporation of America
Overseas
Konami Digital Entertainment B.V., One other company
Notes:
1. Major companies that have operations in more than one business segment are included in each segment in
which they operate.
2. Resort Solution Co., Ltd. is an equity-method affiliate.
3. Konami Sports & Life Co., Ltd. merged with Self Fitness Club Corporation in May 2009.
12
14. 3. Management Policy
1. Management Policy
We, Konami Group of Companies, are aiming to be a business group that is always highly regarded by all
people, by creating and providing them with "Valuable Time". Furthermore, our basic management policy
is to “value shareholders,” “maintain sound relationships with all stakeholders, including our
shareholders, and contribute to society as a good corporate citizen.” We aim for the optimum use of the
group's managerial resources with the following as specific guiding principles for management: to "follow
global standards," "engage in fair competition" and "pursue high profits".
To “value shareholders,” our basic policy is to emphasize payment of dividends and enhance our
corporate value to return profits to our shareholders. It is also our policy to focus the investment of
retained earnings after dividends in highly promising fields so that we may increase corporate value and
enlarge resources for the payment of dividends in the future.
To “maintain sound relationships with all stakeholders, including our shareholders, and contribute to
society as a good corporate citizen,” we focus on maintaining sound relationships with shareholders,
investors, customers, business partners, employees and society as a whole, as well as carry out support
activities in a wide range of fields including education, sports and culture.
In accordance with such basic policies, Konami will continue to seek to deliver dreams and excitement to
people around the world by creating and providing “Valuable Time.”
2. Profit Appropriation Policy
Konami aims to continually enhance profitability through the improvement of operational efficiency.
Emphasis is placed on three managerial indexes: the ratio of operating income to net sales, the ratio of net
income to net sales and return on equity.
3. Medium- to Long-term Corporate Strategies and Objectives
Build a powerful organization that can respond to rapid changes in the global economy
Although there were signs of gradual recovery from the ongoing economic slowdown from the previous
fiscal year, the global economy remains uncertain. There is also concern of a difficult business climate
which persisted in our businesses – Digital Entertainment, Gaming & System and Health & Fitness – due
to the impact of the Economic Uncertainty.
On the other hand, in our business environment, progress has been made in developing a network
environment. In the process, users have begun sharing a variety of information, and communities are
starting to emerge each of which is characterized by its distinct taste.
Konami has shifted to a holding company structure so that it may respond appropriately to a rapidly
changing market environment and evolve into a flexible and sustainable entity. As such, there is now a
clear separation between the management of the Konami group and the execution of duties for each
business segment. In promoting the globalization of each business segment, we shifted to a system in
which each Konami director is ultimately responsible for a business segment. This is to enable on-target
response to the needs of each market as well as promote the agile development of each business. We also
intend to promote the competitiveness and the sustainable growth of each group company. We believe that
this will allow the whole Konami group to make a leap forward.
14
15. Enhance profitability and channel managerial resources to growth areas
In the Digital Entertainment segment, various hardware manufacturers have expanded standalone video
game consoles and handheld video game consoles. Furthermore, new gaming platforms, including mobile
phones or other handheld devices, also continue to expand, and online access is available globally on
multiple platforms. As a result, users seeking a new and diversity of ways to play games with an emphasis
on connection with others over a network are on the increase.
With such diversity and globalization sought by users, Konami intends to channel appropriate managerial
resources in selective and focused manners.
In the Gaming & System segment, as for the casino market where Konami operates, the legalization of
gambling is progressing in various countries and regions around the world, and the number of casinos is
increasing each year. Business opportunities are continuously increasing for Konami, which manufactures
and markets slot machines and offers participation agreements and the Konami Casino Management
System that secure stable revenues for Konami. We will endeavor to expand our business in the future
with strategic alliances with other companies.
In the Health & Fitness segment, we have been promoting, against the backdrop of higher health
consciousness and increase in those with more leisure time due to the retirement of baby boomers, new
Konami Sports Club outlets as well as taking on management of fitness clubs outsourced to Konami.
It is anticipated that health consciousness will become even higher in the future while preferences and
lifestyles will diversify. In order to achieve further growth, we will take proactive steps to create value.
This includes the reinforcement of our proprietary IT-based health management system that keeps an
ongoing record of users’ exercise history in various real-life situations (e.g., at the fitness club, outside the
home and in the home) and manages data for the promotion of good health, provision of new services and
even the marketing of supplements.
Konami plans to allocate appropriate managerial resources not only to the existing Digital Entertainment,
Gaming & System segments, and Health & Fitness but also to new business fields where growth is
anticipated in the medium- to long-term.
15
16. 4. Consolidated Financial Statements
1. Consolidated Balance Sheets (Unaudited)
Thousands of U.S.
Millions of Yen Dollars
March 31, 2009 March 31, 2010 March 31, 2010
% %
ASSETS
CURRENT ASSETS:
Cash and cash equivalents ¥53,568 ¥50,740 $545,357
Trade notes and accounts receivable, net
of allowance for doubtful accounts of
¥470 million and 680 million
($7,309 thousand) at March 31, 2009
and March 31, 2010, respectively 30,624 30,164 324,204
Inventories 23,512 23,497 252,547
Deferred income taxes, net 19,203 20,669 222,152
Prepaid expenses and other current
assets 9,768 9,492 102,021
Total current assets 136,675 45.3 134,562 45.1 1,446,281
PROPERTY AND EQUIPMENT, net 60,552 20.1 62,434 20.9 671,045
INVESTMENTS AND OTHER ASSETS:
Investments in marketable securities 560 226 2,429
Investments in affiliates 2,119 2,146 23,065
Identifiable intangible assets 35,883 35,246 378,826
Goodwill 21,925 21,899 235,372
Lease deposits 27,959 27,685 297,560
Deferred income taxes, net 3,641 3,531 37,952
Other assets 12,356 10,469 112,522
Total investments and other assets 104,443 34.6 101,202 34.0 1,087,726
TOTAL ASSETS ¥301,670 100.0 ¥298,198 100.0 $3,205,052
16
17. Thousands of U.S.
Millions of Yen Dollars
March 31, 2009 March 31, 2010 March 31, 2010
% %
LIABILITIES
CURRENT LIABILITIES:
Current portion of long-term debt and
capital lease obligations ¥3,627 ¥2,433 $26,150
Trade notes and accounts payable 17,430 16,138 173,452
Accrued income taxes 6,683 3,962 42,584
Accrued expenses 17,738 18,568 199,570
Deferred revenue 7,586 6,246 67,132
Other current liabilities 9,322 6,118 65,757
Total current liabilities 62,386 20.7 53,465 17.9 574,645
LONG-TERM LIABILITIES:
Long-term debt and capital lease
obligations, less current portion 37,739 39,885 428,687
Accrued pension and severance costs 2,941 2,861 30,750
Deferred income taxes, net 6,564 4,162 44,733
Other long-term liabilities 8,501 8,594 92,369
Total long-term liabilities 55,745 18.5 55,502 18.6 596,539
TOTAL LIABILITIES 118,131 39.2 108,967 36.5 1,171,184
COMMITMENTS AND
CONTINGENCIES
EQUITY:
Konami Corporation stockholders’ equity:
Common stock, no par value-
Authorized 450,000,000 shares;
issued 143,500,000 shares at March
31, 2009 and March 31, 2010 47,399 15.7 47,399 15.9 509,448
Additional paid-in capital 77,090 25.6 77,089 25.9 828,558
Legal reserve 284 0.1 284 0.1 3,052
Retained earnings 76,947 25.5 83,055 27.9 892,680
Accumulated other comprehensive
income (loss) 98 0.0 (175) (0.1) (1,881)
Treasury stock, at cost-
10,038,498 shares and 10,039,336
shares at March 31, 2009 and March
31, 2010, respectively (23,186) (7.7) (23,187) (7.8) (249,215)
Total Konami Corporation
stockholders’ equity 178,632 59.2 184,465 61.9 1,982,642
Noncontrolling interest 4,907 1.6 4,766 1.6 51,226
TOTAL EQUITY 183,539 60.8 189,231 63.5 2,033,868
TOTAL LIABILITIES AND EQUITY ¥301,670 100.0 ¥298,198 100.0 $3,205,052
17
18. 2. Consolidated Statements of Income (Unaudited)
Thousands of U.S.
Millions of Yen Dollars
Year ended Year ended Year ended
March 31, 2009 March 31, 2010 March 31, 2010
% %
NET REVENUES:
Product sales revenue ¥227,821 ¥185,514 $1,993,917
Service revenue 81,950 76,630 823,624
Total net revenues 309,771 100.0 262,144 100.0 2,817,541
COSTS AND EXPENSES:
Costs of products sold 133,670 109,910 1,181,320
Costs of services rendered 78,966 75,824 814,961
Selling, general and administrative 58,653 55,407 595,518
Restructuring and impairment charges 11,121 2,339 25,140
Total costs and expenses 282,410 91.2 243,480 92.9 2,616,939
Operating income 27,361 8.8 18,664 7.1 200,602
OTHER INCOME (EXPENSES):
Interest income 459 165 1,773
Interest expense (1,468) (1,574) (16,917)
Foreign currency exchange gain (loss), net (1,641) 67 720
Other, net 8 (200) (2,150)
Other income (expenses), net (2,642) (0.8) (1,542) (0.6) (16,574)
INCOME BEFORE INCOME TAXES 24,719 8.0 17,122 6.5 184,028
INCOME TAXES 10,715 3.5 3,600 1.3 38,693
EQUITY IN NET INCOME (LOSS) OF
AFFILIATED COMPANIES (2,490) (0.8) 56 0.0 602
NET INCOME 11,514 3.7 13,578 5.2 145,937
NET INCOME ATTRIBUTABLE TO THE
NONCONTROLLING INTEREST 640 0.2 264 0.1 2,837
NET INCOME ATTRIBUTABLE TO
KONAMI CORPORATION ¥10,874 3.5 ¥13,314 5.1 $143,100
PER SHARE DATA: Yen U.S. Dollar
Year ended Year ended Year ended
March 31, 2009 March 31, 2010 March 31, 2010
Basic net income attributable to Konami
Corporation per share ¥79.30 ¥99.76 $1.07
Diluted net income attributable to
Konami Corporation per share 79.30 99.76 1.07
Weighted-average common
share outstanding 137,124,130 133,461,138
Diluted weighted-average
common shares outstanding 137,124,130 133,461,138
18
19. 3. Consolidated Statements of Equity (Unaudited)
Millions of Yen
Stockholders' Equity
Accumulate Total
d Other Konami
Additional Comprehen Treasury Corporation Non
Common Paid-in Legal Retained sive Income Stock, stockholders’ controlling
Stock Capital Reserve Earnings (Loss) at Cost equity Interest Total Equity
Balance at March 31, 2008 ¥47,399 ¥77,078 ¥284 ¥73,492 ¥2,579 ¥(18,073) ¥182,759 ¥4,324 ¥187,083
Cash dividends attributable to
Konami Corporation (7,419) (7,419) (7,419)
Cash dividends attributable to
noncontrolling interest (2) (2)
Purchase of treasury stock (5,576) (5,576) (5,576)
Reissuance of treasury stock (0) 463 463 463
Others 12 12 (55) (43)
Comprehensive income
Net income 10,874 10,874 640 11,514
Foreign currency
translation adjustments (2,078) (2,078) (2,078)
Net unrealized losses on
available-for-sale securities (59) (59) (59)
Pension liability adjustment (344) (344) (344)
Total comprehensive income 8,393 640 9,033
Balance at March 31, 2009 ¥47,399 ¥77,090 ¥284 ¥76,947 ¥98 ¥(23,186) ¥178,632 ¥4,907 ¥183,539
Cash dividends attributable to
Konami Corporation (7,206) (7,206) (7,206)
Cash dividends attributable to
noncontrolling interest (381) (381)
Purchase of treasury stock (3) (3) (3)
Reissuance of treasury stock (1) 2 1 1
Comprehensive income
Net income 13,314 13,314 264 13,578
Foreign currency
translation adjustments (207) (207) (4) (211)
Net unrealized losses on
available-for-sale securities (8) (8) (8)
Pension liability adjustment (58) (58) (20) (78)
Total comprehensive income 13,041 240 13,281
Balance at March 31, 2010 ¥47,399 ¥77,089 ¥284 ¥83,055 ¥ (175) ¥ (23,187) ¥184,465 ¥4,766 ¥189,231
19
20. Thousands of U.S. Dollars
Stockholders' Equity
Accumulate Total
d Other Konami
Additional Comprehen Treasury Corporation Non
Common Paid-in Legal Retained sive Income Stock, stockholders’ controlling
Stock Capital Reserve Earnings (Loss) at Cost equity Interest Total Equity
Balance at March 31, 2009 $509,448 $828,568 $3,052 $827,031 $1,053 $(249,205) $1,919,947 $52,741 $1,972,688
Cash dividends attributable to
Konami Corporation (77,451) (77,451) (77,451)
Cash dividends attributable to
noncontrolling interest (4,095) (4,095)
Purchase of treasury stock (32) (32) (32)
Reissuance of treasury stock (10) 22 12 12
Comprehensive income 143,100 143,100 2,838 145,938
Net income
Foreign currency
translation adjustments (2,225) (2,225) (43) (2,268)
Net unrealized losses on
available-for-sale securities (86) (86) (86)
Pension liability adjustment (623) (623) (215) (838)
Balance at March 31, 2010 $509,448 $828,558 $3,052 $892,680 $(1,881) $(249,215) $1,982,642 $51,226 $2,033,868
20
21. 4. Consolidated Statements of Cash Flows (Unaudited)
Thousands of
Millions of Yen U.S. Dollars
Year ended Year ended Year ended
March 31, 2009 March 31, 2010 March 31, 2010
Cash flows from operating activities:
Net income ¥11,514 ¥13,578 $145,937
Adjustments to reconcile net income to net cash
provided by operating activities -
Depreciation and amortization 13,731 12,899 138,639
Provision for doubtful receivables 209 259 2,784
Restructuring and impairment charges 11,121 2,339 25,140
Gain or loss on sale or disposal of property and
equipment, net (337) 822 8,835
Equity in net loss (income) of affiliated
company 2,490 (56) (602)
Deferred income taxes (4,811) (3,577) (38,446)
Change in assets and liabilities, net of business
acquired:
Decrease (increase) in trade notes and
accounts receivable 175 (261) (2,805)
Decrease (increase) in inventories (1,424) (2,455) (26,386)
Decrease (increase) in other receivables 1,111 (406) (4,364)
Decrease (increase) in prepaid expenses (918) (24) (258)
Increase (decrease) in trade notes and
accounts payable (556) (949) (10,200)
Increase (decrease) in accrued income taxes,
net of tax refunds (2,157) (2,526) (27,150)
Increase (decrease) in accrued expenses (1,266) (262) (2,816)
Increase (decrease) in deferred revenue (234) (1,294) (13,908)
Increase (decrease) in advance received (796) (478) (5,138)
Increase (decrease) in deposits (93) (396) (4,256)
Other, net 2,372 (2,916) (31,341)
Net cash provided by operating activities 30,131 14,297 153,665
21
22. Thousands of
Millions of Yen U.S. Dollars
Year ended Year ended Year ended
March 31, 2009 March 31, 2010 March 31, 2010
Cash flows from investing activities:
Capital expenditures (8,531) (6,318) (67,906)
Proceeds from sales of property and equipment 1,355 10 107
Decrease (increase) in lease deposits, net 1,616 (374) (4,020)
Other, net (155) 233 2,504
Net cash used in investing activities (5,715) (6,449) (69,315)
Cash flows from financing activities:
Repayments of long-term debt (592) (592) (6,363)
Redemption of bonds (5,000) - -
Principal payments under capital lease obligations (2,886) (2,581) (27,741)
Dividends paid (7,414) (7,569) (81,352)
Purchases of treasury stock by parent company (5,576) (3) (32)
Other, net 464 1 11
Net cash used in financing activities (21,004) (10,744) (115,477)
Effect of exchange rate changes on cash and cash
equivalents (1,974) 68 734
Net increase (decrease) in cash and cash
equivalents 1,438 (2,828) (30,393)
Cash and cash equivalents, beginning of the
period 52,130 53,568 575,750
Cash and cash equivalents, end of the period ¥53,568 ¥50,740 $545,357
5. Going concern assumption:
None
22
23. 6. Segment Information (Unaudited)
(1) Segment information
Year ended Digital Other, Corporate and
March 31, 2009 Entertainment Gaming & System Health & Fitness Eliminations Consolidated
(Millions of Yen)
Net revenue:
Customers ¥ 187,308 ¥ 18,336 ¥ 89,702 ¥ 14,425 ¥ 309,771
Intersegment 320 - 263 (583) -
Total 187,628 18,336 89,965 13,842 309,771
Operating expenses 146,076 14,889 98,235 23,210 282,410
Operating income (loss) ¥ 41,552 ¥ 3,447 ¥ (8,270) ¥ (9,368) ¥ 27,361
Year ended Digital Other, Corporate and
March 31, 2010 Entertainment Gaming & System Health & Fitness Eliminations Consolidated
(Millions of Yen)
Net revenue:
Customers ¥ 142,239 ¥ 19,996 ¥ 85,480 ¥ 14,429 ¥ 262,144
Intersegment 411 - 285 (696) -
Total 142,650 19,996 85,765 13,733 262,144
Operating expenses 121,167 15,323 87,687 19,303 243,480
Operating income (loss) ¥ 21,483 ¥ 4,673 ¥ (1,922) ¥ (5,570) ¥ 18,664
Year ended Digital Other, Corporate and
March 31, 2010 Entertainment Gaming & System Health & Fitness Eliminations Consolidated
(Thousands of U.S. Dollars)
Net revenue:
Customers $ 1,528,794 $ 214,918 $ 918,745 $ 155,084 $ 2,817,541
Intersegment 4,417 - 3,063 (7,480) -
Total 1,533,211 214,918 921,808 147,604 2,817,541
Operating expenses 1,302,311 164,693 942,466 207,469 2,616,939
Operating income (loss) $ 230,900 $ 50,225 $ (20,658) $ (59,865) $ 200,602
Notes: 1. Primary businesses of each segment are as follows:
Digital Entertainment Segment: Production and sale of digital content and related products including
Computer & Video Games, Amusement, Card Games, and Online.
Gaming & System Segment: Production, manufacture, sale and service of gaming machines and the
Casino Management System for overseas markets.
Health & Fitness Segment: Operation of health and fitness clubs, and production and sale of health and
fitness related goods.
2. “Other” consists of segments which do not meet the quantitative criteria for separate presentation under ASC
No. 280 “Segment Reporting” (former SFAS No. 131 “Disclosures about Segments of an Enterprise and
Related Information”)
3. “Corporate” primarily consists of administrative expenses of the Company.
4. “Eliminations” primarily consists of eliminations of intercompany sales and of intercompany profits on
inventories.
23
24. (2) Geographic information
Year ended North Asia/
March 31, 2009 Japan America Europe Oceania Total Eliminations Consolidated
(Millions of Yen)
Net revenue:
Customers ¥ 223,662 ¥ 44,051 ¥ 37,216 ¥ 4,842 ¥ 309,771 - ¥ 309,771
Intersegment 24,762 4,266 96 596 29,720 ¥ (29,720) -
Total 248,424 48,317 37,312 5,438 339,491 (29,720) 309,771
Operating expenses 229,411 43,779 33,158 5,784 312,132 (29,722) 282,410
Operating income (loss) ¥ 19,013 ¥ 4,538 ¥ 4,154 ¥ (346) ¥ 27,359 ¥ 2 ¥ 27,361
Year ended North Asia/
March 31, 2010 Japan America Europe Oceania Total Eliminations Consolidated
(Millions of Yen)
Net revenue:
Customers ¥ 198,500 ¥ 33,743 ¥ 23,682 ¥ 6,219 ¥ 262,144 - ¥ 262,144
Intersegment 14,272 3,805 89 669 18,835 ¥ (18,835) -
Total 212,772 37,548 23,771 6,888 280,979 (18,835) 262,144
Operating expenses 199,427 33,845 22,598 6,560 262,430 (18,950) 243,480
Operating income (loss) ¥ 13,345 ¥ 3,703 ¥ 1,173 ¥ 328 ¥ 18,549 ¥ 115 ¥ 18,664
Year ended North Asia/
March 31, 2010 Japan America Europe Oceania Total Eliminations Consolidated
(Thousands of U.S. Dollars)
Net revenue:
Customers $ 2,133,491 $ 362,672 $ 254,536 $ 66,842 $ 2,817,541 - $ 2,817,541
Intersegment 153,396 40,896 958 7,190 202,440 $ (202,440) -
Total 2,286,887 403,568 255,494 74,032 3,019,981 (202,440) 2,817,541
Operating expenses 2,143,454 363,768 242,886 70,507 2,820,615 (203,676) 2,616,939
Operating income (loss) $ 143,433 $ 39,800 $ 12,608 $ 3,525 $ 199,366 $ 1,236 $ 200,602
For the purpose of presenting its operations in the geographic areas above, Konami attributes revenues from
external customers to individual countries in each area based on where products are sold and services are
rendered.
North America presented in the table above substantially consists of the United States.
- Notes: (Unaudited)
The consolidated financial statements presented herein were prepared in accordance with U.S. generally
accepted accounting principles (U.S. GAAP).
24
25. - Significant change in preparation basis for quarterly consolidated financial statements
1. In the three months began July 1, 2009, Konami adopted ASC No.105, “Generally Accepted Accounting
Principles” (former Statement of Financial Accounting Standards (“SFAS”) No.168 “The FASB
Accounting Standards Codification TM and the Hierarchy of Generally Accepted Accounting Principles - a
replacement of FASB Statement No.162”). ASC No. 105 establishes that the FASB Accounting Standard
Codification ™ is the single official source of authoritative U.S. Generally Accepted Accounting
Principles, other than guidance issued by the Securities and Exchange Commission, doing away with the
previous various hierarchy. The adoption of ASC No. 105 did not have a material effect on Konami’s
consolidated financial position or results of operations.
2. Effective April 1, 2009, Konami has adopted ASC No.805, “Business Combinations” (former SFAS
No.141 (revised 2007), “Business Combinations” (“SFAS 141R”)). ASC No.805 establishes principles and
requirements for how an acquirer recognizes and measures in its financial statements the assets acquired,
the liabilities assumed, any noncontrolling interest in the acquiree and the goodwill acquired. As of the
effective date, the adoption of ASC No.805 did not have a significant impact on its consolidated financial
statements.
3. Effective April 1, 2009, Konami has adopted ASC No. 810, “Consolidation” (former SFAS No. 160
“Noncontrolling Interests in Consolidated Financial Statement, an amendment of ARB No. 51”). ASC No.
810 establishes accounting standards for noncontrolling interests and the valuation of retained
noncontrolling equity investments when a subsidiary is deconsolidated. ASC No. 810 requires (i) that
consolidated net income include the amounts attributable to both the parent and the noncontrolling interest,
(ii) that a parent recognize a gain or loss in net income when a subsidiary is deconsolidated and (iii)
expanded disclosures that clearly identify and distinguish between the interests of the parent owner and the
interests of the noncontrolling owners of a subsidiary. Upon the adoption of ASC No. 810 noncontrolling
interests, which were previously referred to as minority interests and classified between total liabilities and
stockholders' equity on the consolidated balance sheets, are now included as a separate component in
equity. In addition, the presentation of consolidated statements of income and cash flows has been
changed. The consolidated financial statements of the prior year have also been reclassified to conform to
the presentation used for this current period.
- Subsequent Events
For the Fiscal Year Ended March 31, 2009 (April 1, 2008 – March 31, 2009): None
For the Fiscal Year Ended March 31, 2010 (April 1, 2009 – March 31, 2010): None
25
26. 5. Non-consolidated Financial Statements
1. Non-consolidated Balance Sheets (Unaudited)
(Millions of Yen)
March 31, 2009 March 31, 2010
% %
ASSETS
CURRENT ASSETS:
Cash and cash equivalents ¥33,495 ¥32,037
Trade accounts receivable 3,833 3,097
Prepaid expense 201 181
Deferred income taxes, net 146 160
Short-term loans to affiliates 24,477 9,393
Income tax receivable 2,342 2,245
Other 214 246
Allowance for doubtful accounts (5) (2)
Total current assets 64,706 35.8 47,360 26.5
FIXED ASSETS:
Tangible fixed assets
Building improvement 156 191
Transportation equipment 18 24
Tools and fixtures 268 191
Total tangible fixed assts 442 0.2 406 0.2
Intangible fixed assets
In-house software 3 4
Trademark 3 2
Design - 4
Other 0 0
Total intangible fixed assets 7 0.0 11 0.0
Investments and other assets
Investment securities 855 521
Investments in subsidiaries and affiliate 112,120 116,120
Long-term loans to subsidiaries 2,130 13,949
Long-term prepaid expenses 8 5
Deferred income taxes, net 65 76
Lease deposit 563 232
Other 54 64
Allowance for doubtful accounts (0) (6)
Total investments and other assets 115,797 64.0 130,963 73.3
Total fixed assets 116,246 64.2 131,382 73.5
TOTAL ASSETS ¥180,952 100.0 ¥178,743 100.0
26
27. (Millions of Yen)
March 31, 2009 March 31, 2010
% %
LIABILITIES AND NET ASSETS
CURRENT LIABILITIES:
Short-term borrowings ¥15,204 ¥7,307
Current portion of long-term debt 592 204
Other accounts payables 671 568
Accrued expenses 341 200
Income taxes payable 1,098 886
Deposits received 26 23
Total Current liabilities 17,934 9.9 9,191 5.1
LONG-TERM LIABILITIES:
Straight bonds 15,000 15,000
Long-term borrowings 204 -
Long-term borrowings from subsidiaries 350 350
Accrued pension and severance costs 6 -
Asset retirement obligation - 93
Other 1,321 1,096
Total long-term liabilities 16,881 9.3 16,539 9.3
Total liabilities 34,816 19.2 25,730 14.4
NET ASSETS:
Common stock 47,398 26.2 47,398 26.5
Capital surplus 43,240 23.9 43,240 24.2
Additional paid-in capital 36,893 36,893
Other capital surplus 6,347 6,346
Retained earnings 77,843 43.0 84,729 47.4
Legal reserve 283 283
Special reserves 55,794 58,294
Retained earnings brought forward 21,764 26,150
Treasury Stock (22,354) (12.3) (22,355) (12.5)
Total stockholders’equity 146,127 80.8 153,012 85.6
Difference of appreciation and conversion 8 0.0 - -
Net unrealized gains on
available-for-sale securities 8 0.0 - -
Total net assets 146,136 80.8 153,012 85.6
TOTAL LIABILITIES AND NET ASSETS ¥180,952 100.0 ¥178,743 100.0
27
28. 2. Non-consolidated Statements of Income (Unaudited)
(Millions of Yen)
Year ended Year ended
March 31, 2009 March 31, 2010
% %
Operating revenues ¥21,456 100.0 ¥19,295 100.0
Management fee revenue 6,999 5,054
Dividend income 14,457 14,241
Selling, general and administrative expenses 5,700 26.6 4,685 24.3
Operating income 15,755 73.4 14,609 75.7
Non-operating income 380 1.8 300 1.6
Interest income 342 256
Other 37 44
Non-operating expense 413 1.9 415 2.2
Interest expenses 115 41
Bond interest expenses 242 242
Foreign exchange loss 29 100
Other 26 30
Ordinary income 15,721 73.3 14,495 75.1
Extraordinary gain 17 0.1 50 0.3
Gain on sale of equity securities - 50
Gain on reversal of allowance for doubtful accounts 17 -
Extraordinary losses 4,225 19.7 256 1.3
Loss on disposal of property and equipment 1 -
Loss on sale of equity securities - 235
Loss on impairment of equity securities 3,874 -
Loss on sale of shares of an affiliated company 349 -
Effect of adoption of an accounting standard for
asset retirement obligations - 20
Income before income taxes 11,513 53.7 14,289 74.1
Income taxes
Current 1,473 215
Deferred 585 (19)
Total income taxes 2,058 9.6 196 1.1
Net income ¥9,454 44.1 ¥14,092 73.0
28
29. 3. Non-consolidated Statement of Changes in Stockholders’ Equity (Unaudited)
For the Fiscal Year Ended March 31, 2009 (Millions of yen)
Stockholders’ equity
Difference of appreciation
Capital surplus Retained earnings
and conversion
Other retained earnings
Total Net Total Total net
Common Additional Other Total Total Treasury assets
Legal Retained stockholders’ unrealized difference
stock paid-in capital capital retained stock
reserve Special earnings equity gains on of
capital surplus surplus reserves brought earnings available-for- appreciation
forward sale and
securities conversion
Balance at
¥47,398 ¥36,893 ¥6,347 ¥43,240 ¥283 ¥52,094 ¥23,429 ¥75,807 ¥(17,241) ¥149,205 ¥67 ¥67 ¥149,272
March 31, 2008
Changes during the
year
Cash dividends (7,419) (7,419) (7,419) (7,419)
Other reserves 3,700 (3,700) - - -
Net income 9,454 9,454 9,454 9,454
Purchase of
(5,582) (5,582) (5,582)
treasury stock
Reissuance of
(0) (0) 469 469 469
treasury stock
Net change of items
other than
(58) (58) (58)
stockholders’
equity
Total changes during
- - (0) (0) - 3,700 (1,664) 2,035 (5,113) (3,078) (58) (58) (3,136)
the year
Balance at
¥47,398 ¥36,893 ¥6,347 ¥43,240 ¥283 ¥55,794 ¥21,764 ¥77,843 ¥(22,354) ¥146,127 ¥8 ¥8 ¥146,136
March 31, 2009
29
30. For the Fiscal Year Ended March 31, 2010 (Millions of yen)
Stockholders’ equity
Difference of appreciation
Capital surplus Retained earnings
and conversion
Other retained earnings
Total Net Total net
Common Additional Other Total Total Treasury Total
Retained stockholders’ unrealized assets
stock Legal stock difference of
paid-in capital capital Special earnings retained equity gains on
reserve appreciation
capital surplus surplus reserves brought earnings available-for-
and
forward sale
conversion
securities
Balance at
¥47,398 ¥36,893 ¥6,347 ¥43,240 ¥283 ¥55,794 ¥21,764 ¥77,843 ¥(22,354) ¥146,127 ¥8 ¥8 ¥146,136
March 31, 2009
Changes during the
year
Cash dividends (7,206) (7,206) (7,206) (7,206)
Other reserves 2,500 (2,500) - - -
Net income 14,092 14,092 14,092 14,092
Purchase of
(2) (2) (2)
treasury stock
Reissuance of
(0) (0) 1 1 1
treasury stock
Net change of items
other than
(8) (8) (8)
stockholders’
equity
Total changes during
- - (0) (0) - 2,500 4,385 6,885 (0) 6,884 (8) (8) 6,876
the year
Balance at
¥47,398 ¥36,893 ¥6,346 ¥43,240 ¥283 ¥58,294 ¥26,150 ¥84,729 ¥(22,355) ¥153,012 - - ¥153,012
March 31, 2010
4. Going concern assumption:
None
30