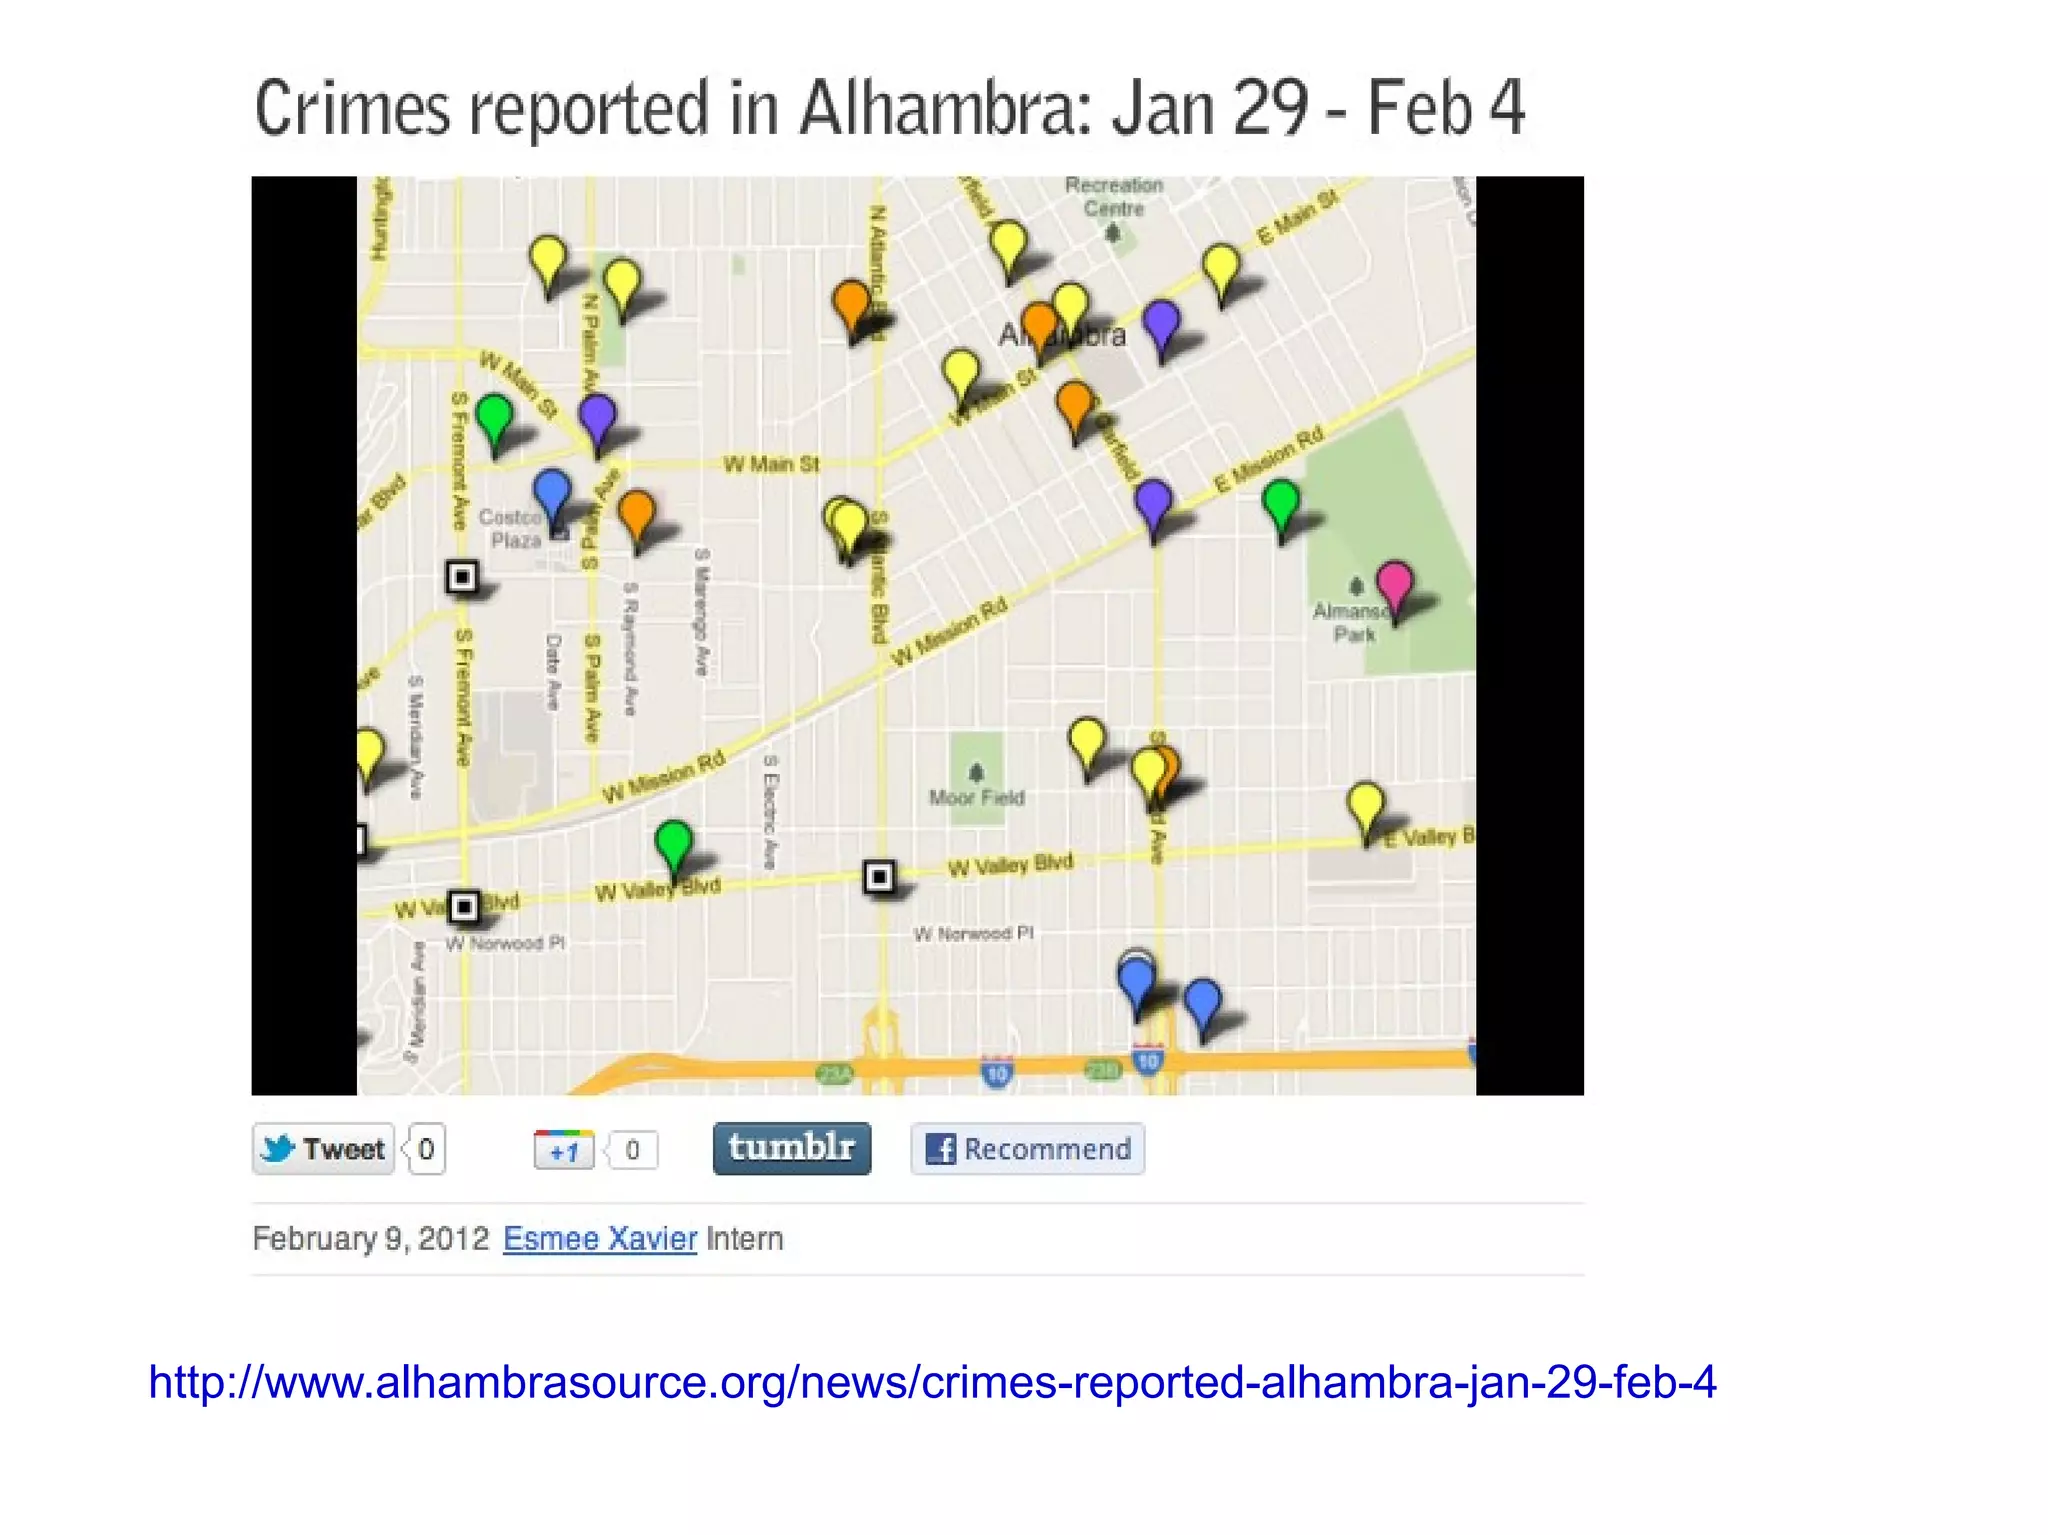
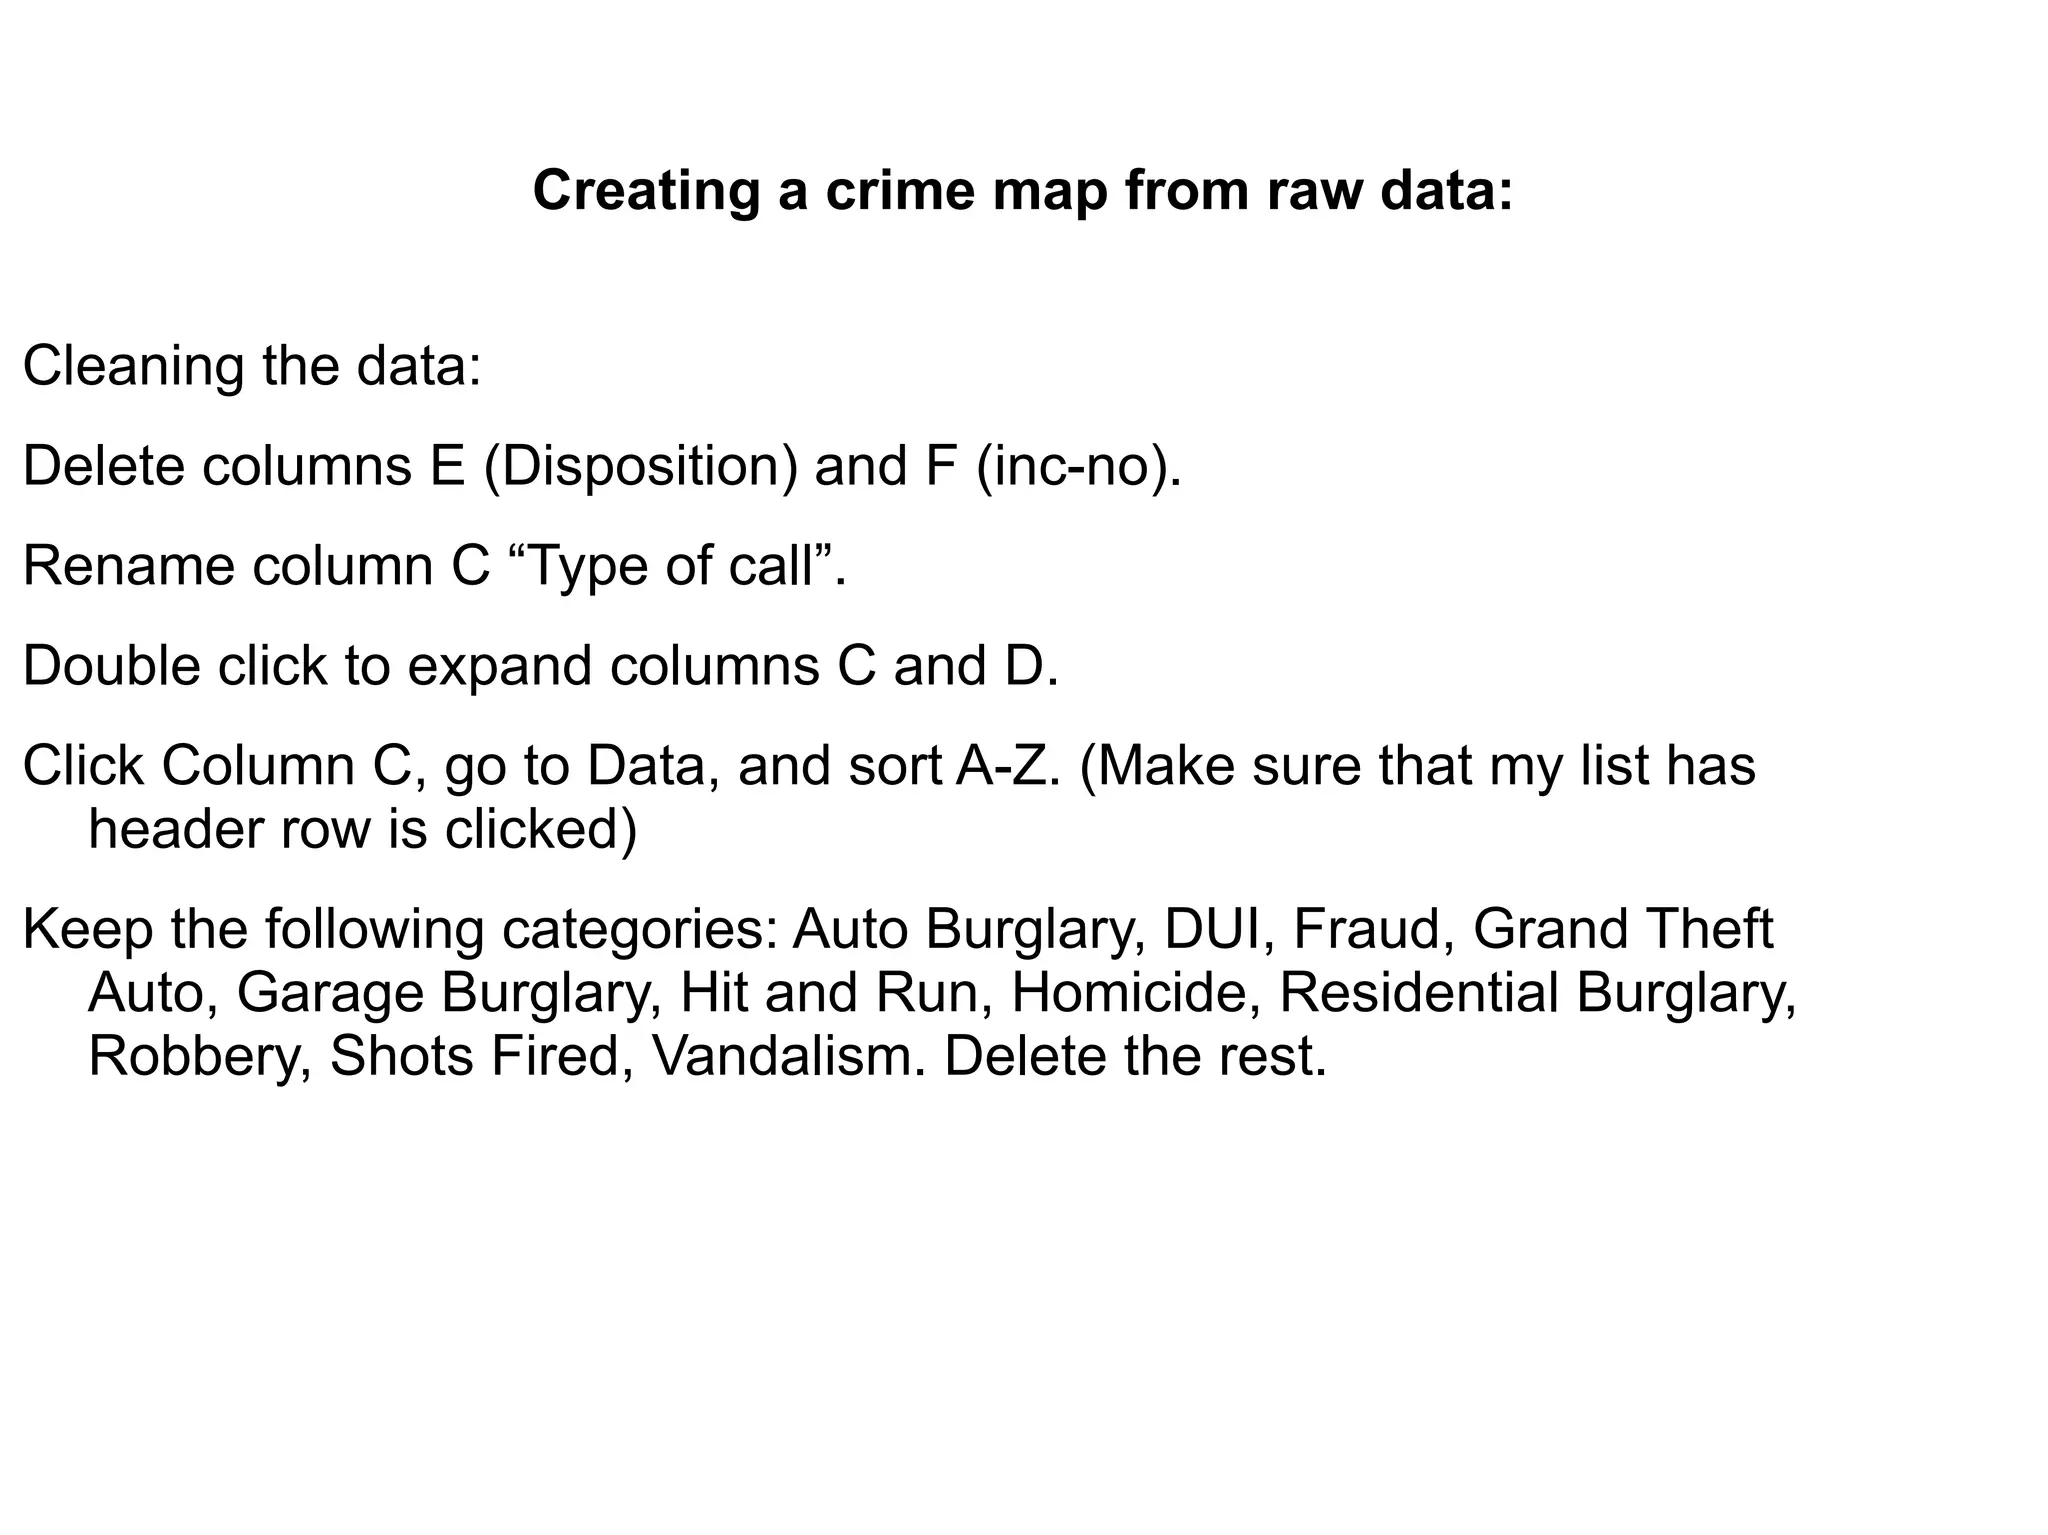
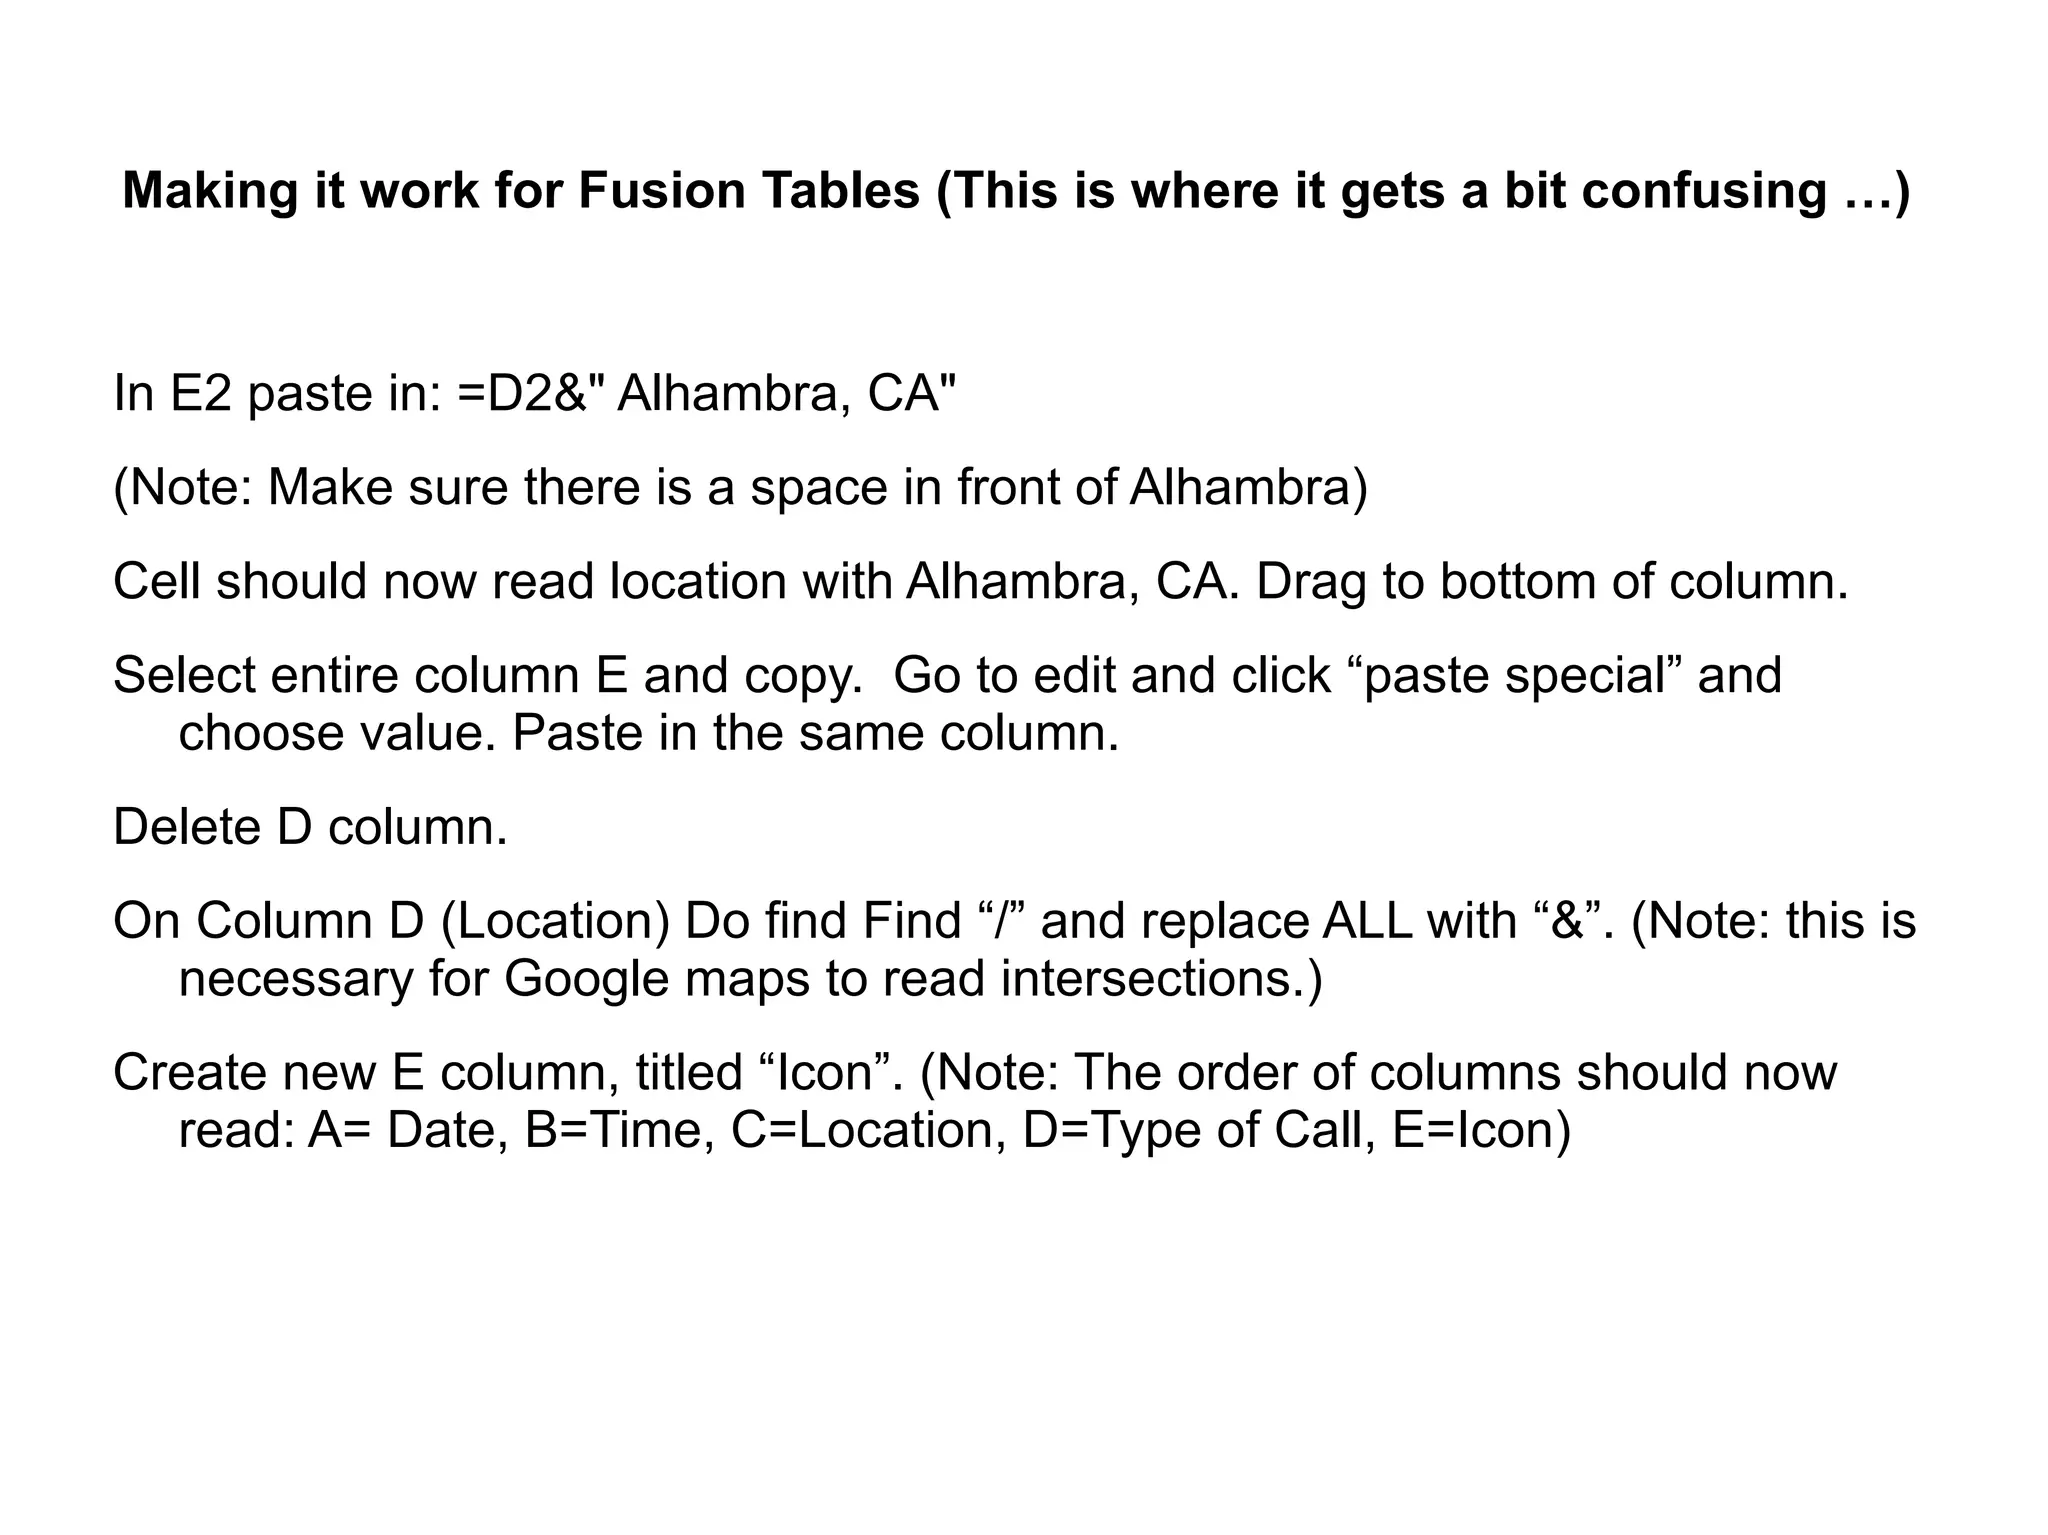
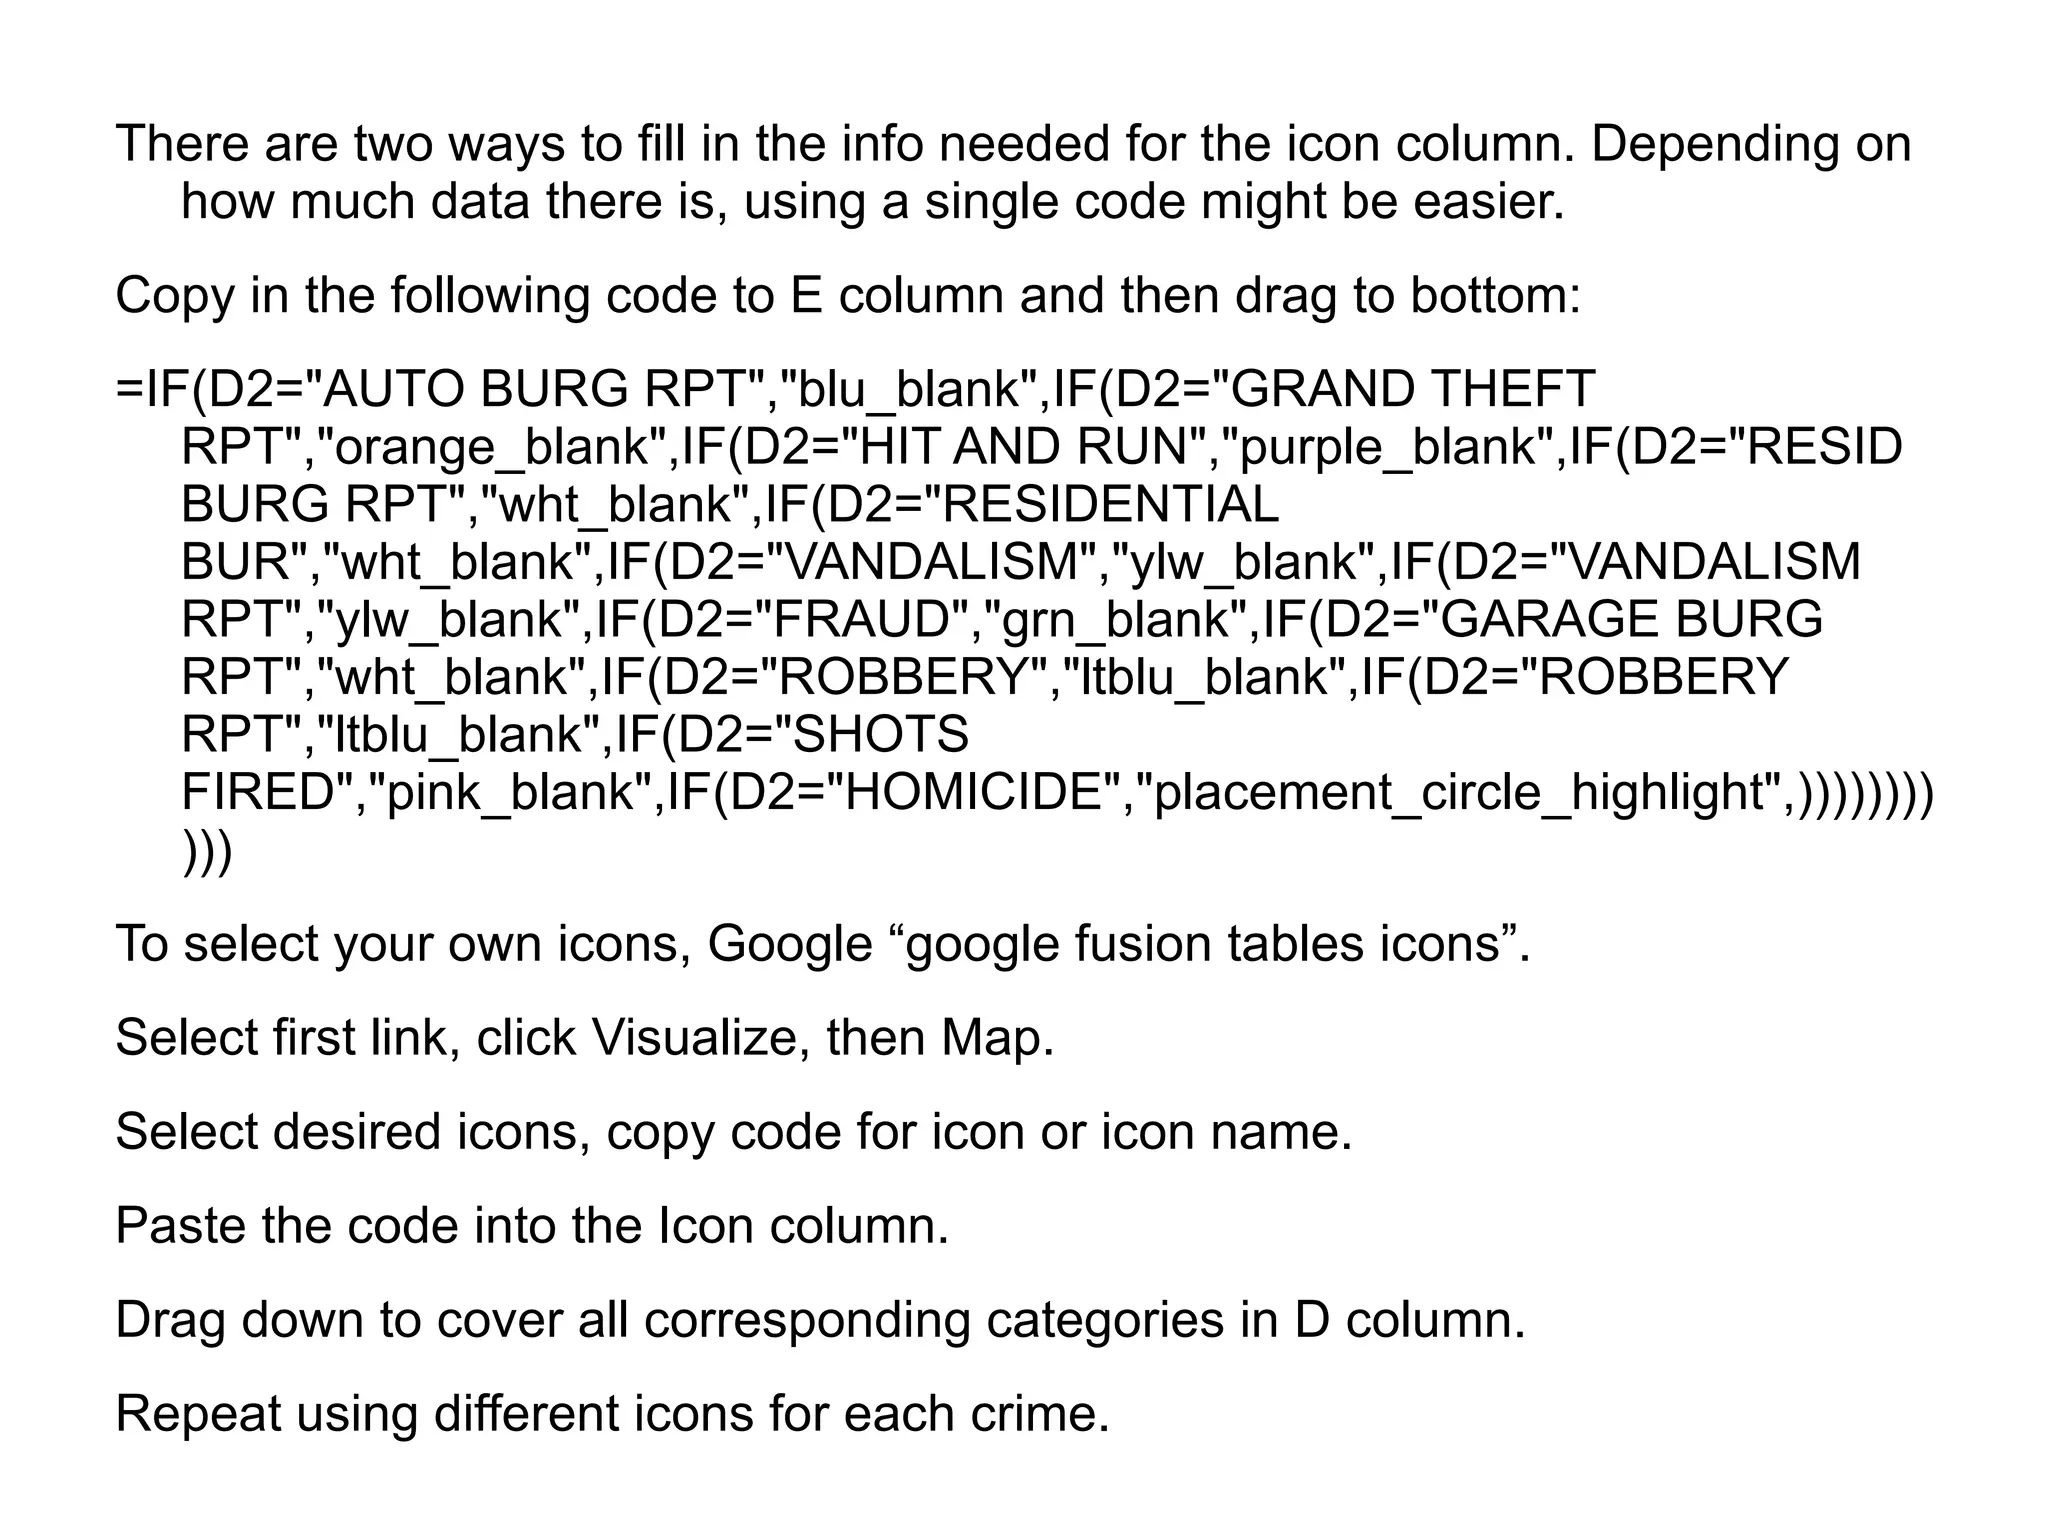
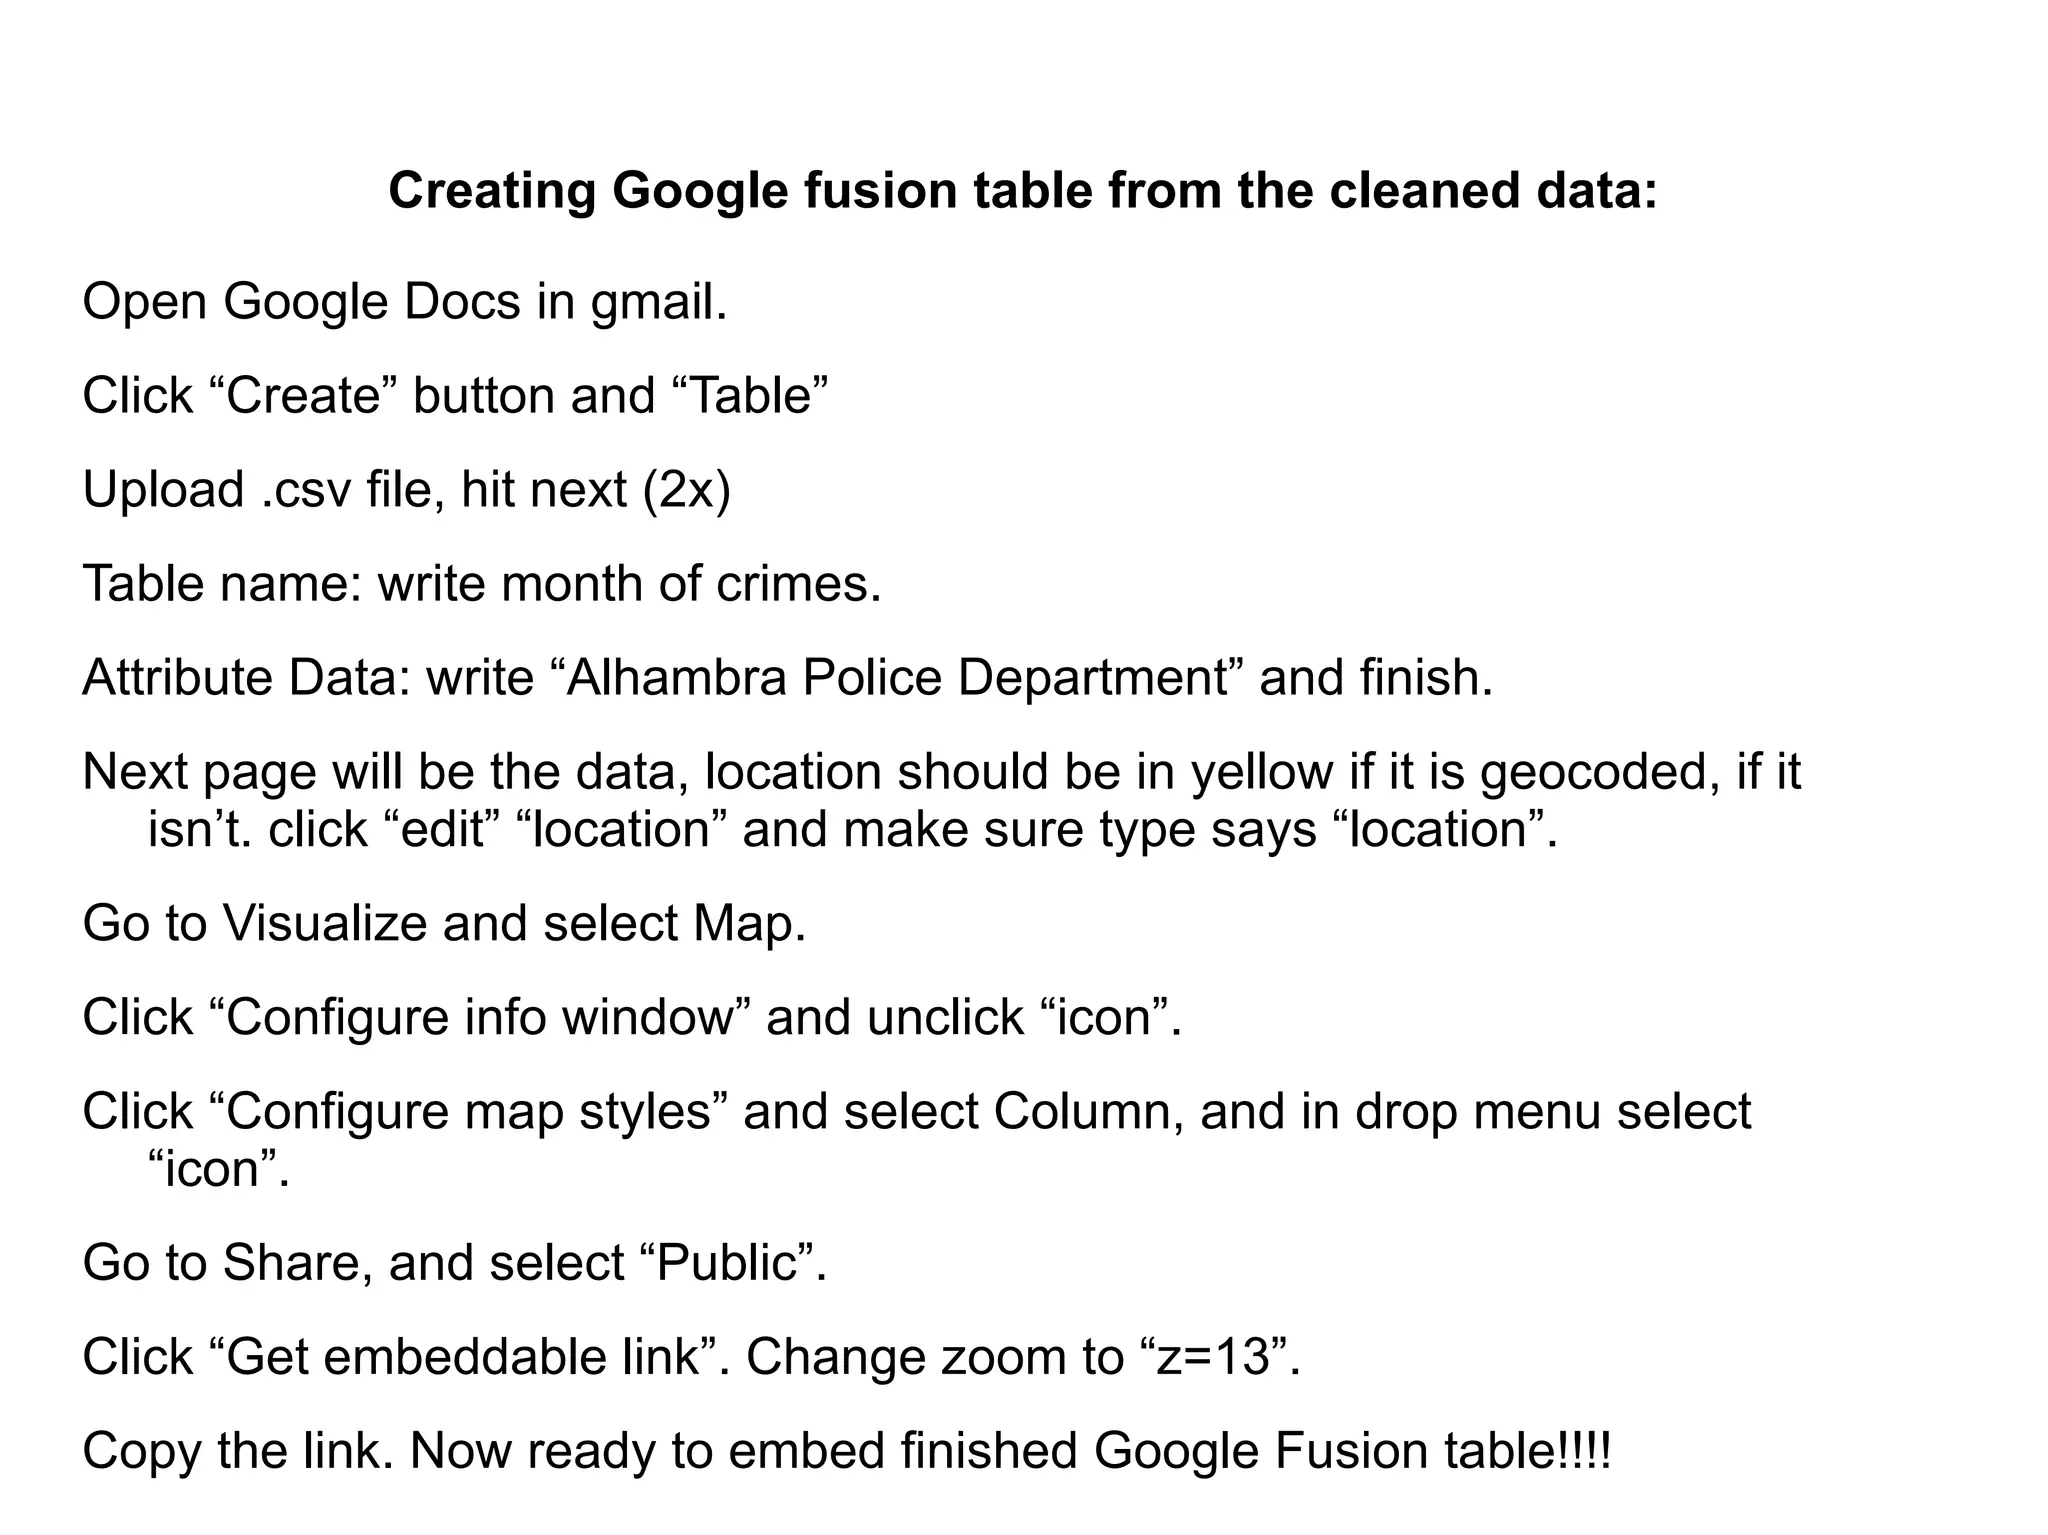
WNYC


http://www.wnyc.org/articles/wnyc-news-2/2010/dec/30/mapping-storm-clean/
http://www.alhambrasource.org/news/coyotes-attack-chihuahua-cat-%E2%80%94-and-map-wher
Alhambra food secrets revealed


http://www.alhambrasource.org/news/whats-your-alhambra-food-secret
http://www.alhambrasource.org/news/crimes-reported-alhambra-jan-29-feb-4
Google map marker or Icon names


http://www.google.com/fusiontables/DataSource?dsrcid=308519
Creating a crime map from raw data:


Cleaning the data:
Delete columns E (Disposition) and F (inc-no).
Rename column C “Type of call”.
Double click to expand columns C and D.
Click Column C, go to Data, and sort A-Z. (Make sure that my list has
   header row is clicked)
Keep the following categories: Auto Burglary, DUI, Fraud, Grand Theft
  Auto, Garage Burglary, Hit and Run, Homicide, Residential Burglary,
  Robbery, Shots Fired, Vandalism. Delete the rest.
Making it work for Fusion Tables (This is where it gets a bit confusing …)


In E2 paste in: =D2&" Alhambra, CA"
(Note: Make sure there is a space in front of Alhambra)
Cell should now read location with Alhambra, CA. Drag to bottom of column.
Select entire column E and copy. Go to edit and click “paste special” and
  choose value. Paste in the same column.
Delete D column.
On Column D (Location) Do find Find “/” and replace ALL with “&”. (Note: this is
  necessary for Google maps to read intersections.)
Create new E column, titled “Icon”. (Note: The order of columns should now
  read: A= Date, B=Time, C=Location, D=Type of Call, E=Icon)
There are two ways to fill in the info needed for the icon column. Depending on
  how much data there is, using a single code might be easier.
Copy in the following code to E column and then drag to bottom:
=IF(D2="AUTO BURG RPT","blu_blank",IF(D2="GRAND THEFT
   RPT","orange_blank",IF(D2="HIT AND RUN","purple_blank",IF(D2="RESID
   BURG RPT","wht_blank",IF(D2="RESIDENTIAL
   BUR","wht_blank",IF(D2="VANDALISM","ylw_blank",IF(D2="VANDALISM
   RPT","ylw_blank",IF(D2="FRAUD","grn_blank",IF(D2="GARAGE BURG
   RPT","wht_blank",IF(D2="ROBBERY","ltblu_blank",IF(D2="ROBBERY
   RPT","ltblu_blank",IF(D2="SHOTS
   FIRED","pink_blank",IF(D2="HOMICIDE","placement_circle_highlight",))))))))
   )))
To select your own icons, Google “google fusion tables icons”.
Select first link, click Visualize, then Map.
Select desired icons, copy code for icon or icon name.
Paste the code into the Icon column.
Drag down to cover all corresponding categories in D column.
Repeat using different icons for each crime.
Creating Google fusion table from the cleaned data:

Open Google Docs in gmail.
Click “Create” button and “Table”
Upload .csv file, hit next (2x)
Table name: write month of crimes.
Attribute Data: write “Alhambra Police Department” and finish.
Next page will be the data, location should be in yellow if it is geocoded, if it
  isn’t. click “edit” “location” and make sure type says “location”.
Go to Visualize and select Map.
Click “Configure info window” and unclick “icon”.
Click “Configure map styles” and select Column, and in drop menu select
   “icon”.
Go to Share, and select “Public”.
Click “Get embeddable link”. Change zoom to “z=13”.
Copy the link. Now ready to embed finished Google Fusion table!!!!
Added reference
http://kh-samples.googlecode.com/svn/trunk/talks/ona2011/fusion_tables.html#1


http://www.alhambrasource.org/

Fusion tables presentation

  • 1.
  • 2.
  • 3.
    Alhambra food secretsrevealed http://www.alhambrasource.org/news/whats-your-alhambra-food-secret
  • 4.
  • 5.
    Google map markeror Icon names http://www.google.com/fusiontables/DataSource?dsrcid=308519
  • 6.
    Creating a crimemap from raw data: Cleaning the data: Delete columns E (Disposition) and F (inc-no). Rename column C “Type of call”. Double click to expand columns C and D. Click Column C, go to Data, and sort A-Z. (Make sure that my list has header row is clicked) Keep the following categories: Auto Burglary, DUI, Fraud, Grand Theft Auto, Garage Burglary, Hit and Run, Homicide, Residential Burglary, Robbery, Shots Fired, Vandalism. Delete the rest.
  • 7.
    Making it workfor Fusion Tables (This is where it gets a bit confusing …) In E2 paste in: =D2&" Alhambra, CA" (Note: Make sure there is a space in front of Alhambra) Cell should now read location with Alhambra, CA. Drag to bottom of column. Select entire column E and copy. Go to edit and click “paste special” and choose value. Paste in the same column. Delete D column. On Column D (Location) Do find Find “/” and replace ALL with “&”. (Note: this is necessary for Google maps to read intersections.) Create new E column, titled “Icon”. (Note: The order of columns should now read: A= Date, B=Time, C=Location, D=Type of Call, E=Icon)
  • 8.
    There are twoways to fill in the info needed for the icon column. Depending on how much data there is, using a single code might be easier. Copy in the following code to E column and then drag to bottom: =IF(D2="AUTO BURG RPT","blu_blank",IF(D2="GRAND THEFT RPT","orange_blank",IF(D2="HIT AND RUN","purple_blank",IF(D2="RESID BURG RPT","wht_blank",IF(D2="RESIDENTIAL BUR","wht_blank",IF(D2="VANDALISM","ylw_blank",IF(D2="VANDALISM RPT","ylw_blank",IF(D2="FRAUD","grn_blank",IF(D2="GARAGE BURG RPT","wht_blank",IF(D2="ROBBERY","ltblu_blank",IF(D2="ROBBERY RPT","ltblu_blank",IF(D2="SHOTS FIRED","pink_blank",IF(D2="HOMICIDE","placement_circle_highlight",)))))))) ))) To select your own icons, Google “google fusion tables icons”. Select first link, click Visualize, then Map. Select desired icons, copy code for icon or icon name. Paste the code into the Icon column. Drag down to cover all corresponding categories in D column. Repeat using different icons for each crime.
  • 9.
    Creating Google fusiontable from the cleaned data: Open Google Docs in gmail. Click “Create” button and “Table” Upload .csv file, hit next (2x) Table name: write month of crimes. Attribute Data: write “Alhambra Police Department” and finish. Next page will be the data, location should be in yellow if it is geocoded, if it isn’t. click “edit” “location” and make sure type says “location”. Go to Visualize and select Map. Click “Configure info window” and unclick “icon”. Click “Configure map styles” and select Column, and in drop menu select “icon”. Go to Share, and select “Public”. Click “Get embeddable link”. Change zoom to “z=13”. Copy the link. Now ready to embed finished Google Fusion table!!!!
  • 10.