STOCK ANALYSIS:
FUNDAMENTALAND
TECHNICALAPPROACHES
Dr. Amr Hamed
1. Fundamental Analysis
■ Fundamental analysis focuses on evaluating a stock’s intrinsic
value based on underlying factors such as the company’s
financial health, industry position, and macroeconomic
conditions.
Key Components of Fundamental
Analysis:
1. Quantitative Analysis:
■ Financial Statements:
■ Income Statement: Revenue, profit margins, and net income.
■ Balance Sheet: Assets, liabilities, and equity to assess the company’s financial stability.
■ Cash Flow Statement: Operating cash flows, free cash flow to understand liquidity.
■ Financial Ratios:
■ P/E Ratio: Price-to-earnings ratio indicates how much investors are paying for $1 of
earnings.
■ P/B Ratio: Price-to-book value shows whether the stock is over or undervalued.
■ ROE, ROA: Return on equity and assets measure profitability.
2. Qualitative Analysis:
■ Management Quality: Leadership and strategic direction.
■ Competitive Advantage: Brand strength, patents, or market
position.
■ Industry Trends: Is the industry expanding, mature, or
declining?
3. Macroeconomic Factors:
■ Interest rates, inflation, and economic growth rates.
■ Regulatory environment and global economic conditions.
Goal of Fundamental Analysis:
■ To determine a stock’s true value (intrinsic value) and compare
it to the current market price.
■ If the intrinsic value > market price → the stock is undervalued
(buy opportunity).
■ If the intrinsic value < market price → the stock is overvalued
(sell or avoid).
2. Technical Analysis
■ Technical analysis focuses on analyzing price movements,
trends, and patterns in stock charts to predict future price
movements.
Key Tools and Concepts in Technical
Analysis:
1. Price Charts:
■ Candlestick Charts: Show opening, closing, high, and low
prices.
■ Line and Bar Charts: Simplify trends and historical data.
2. Indicators and Oscillators:
■ Moving Averages (SMA, EMA): Smooth out price fluctuations
to identify trends.
■ RSI (Relative Strength Index): Measures momentum, showing
if a stock is overbought or oversold.
■ MACD (Moving Average Convergence Divergence): Tracks
momentum and trend strength.
■ Bollinger Bands: Measure volatility.
3. Patterns:
■ Trends: Uptrends, downtrends, or sideways movements.
■ Support and Resistance Levels: Price levels where stocks tend
to bounce or reverse.
■ Chart Patterns: Head and shoulders, double tops/bottoms,
triangles, etc.
4. Volume Analysis:
■ Increasing volume supports the validity of a price movement.
■ Divergence between volume and price might indicate reversals.
Goal of Technical Analysis:
■ To identify entry and exit points for trades based on price
trends and patterns.
Key Differences Between Fundamental
and Technical Analysis:
Which One to Use?
■ Investors (long-term): Often prioritize fundamental analysis to find
quality stocks to hold for years.
■ Traders (short-term): Rely heavily on technical analysis to profit from
market fluctuations.
■ Blended Approach: Some combine both methods. For example, use
fundamental analysis to pick strong companies and technical analysis to
decide the best time to enter or exit.
Both approaches have their strengths and limitations, and using them
together can provide a well-rounded perspective.

Fundamental and Technical Approaches.pptx

  • 1.
  • 2.
    1. Fundamental Analysis ■Fundamental analysis focuses on evaluating a stock’s intrinsic value based on underlying factors such as the company’s financial health, industry position, and macroeconomic conditions.
  • 3.
    Key Components ofFundamental Analysis: 1. Quantitative Analysis: ■ Financial Statements: ■ Income Statement: Revenue, profit margins, and net income. ■ Balance Sheet: Assets, liabilities, and equity to assess the company’s financial stability. ■ Cash Flow Statement: Operating cash flows, free cash flow to understand liquidity. ■ Financial Ratios: ■ P/E Ratio: Price-to-earnings ratio indicates how much investors are paying for $1 of earnings. ■ P/B Ratio: Price-to-book value shows whether the stock is over or undervalued. ■ ROE, ROA: Return on equity and assets measure profitability.
  • 4.
    2. Qualitative Analysis: ■Management Quality: Leadership and strategic direction. ■ Competitive Advantage: Brand strength, patents, or market position. ■ Industry Trends: Is the industry expanding, mature, or declining?
  • 5.
    3. Macroeconomic Factors: ■Interest rates, inflation, and economic growth rates. ■ Regulatory environment and global economic conditions.
  • 6.
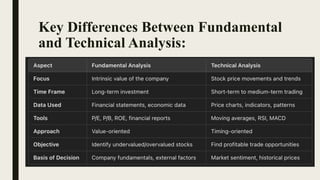
    Goal of FundamentalAnalysis: ■ To determine a stock’s true value (intrinsic value) and compare it to the current market price. ■ If the intrinsic value > market price → the stock is undervalued (buy opportunity). ■ If the intrinsic value < market price → the stock is overvalued (sell or avoid).
  • 7.
    2. Technical Analysis ■Technical analysis focuses on analyzing price movements, trends, and patterns in stock charts to predict future price movements.
  • 8.
    Key Tools andConcepts in Technical Analysis: 1. Price Charts: ■ Candlestick Charts: Show opening, closing, high, and low prices. ■ Line and Bar Charts: Simplify trends and historical data.
  • 9.
    2. Indicators andOscillators: ■ Moving Averages (SMA, EMA): Smooth out price fluctuations to identify trends. ■ RSI (Relative Strength Index): Measures momentum, showing if a stock is overbought or oversold. ■ MACD (Moving Average Convergence Divergence): Tracks momentum and trend strength. ■ Bollinger Bands: Measure volatility.
  • 10.
    3. Patterns: ■ Trends:Uptrends, downtrends, or sideways movements. ■ Support and Resistance Levels: Price levels where stocks tend to bounce or reverse. ■ Chart Patterns: Head and shoulders, double tops/bottoms, triangles, etc.
  • 11.
    4. Volume Analysis: ■Increasing volume supports the validity of a price movement. ■ Divergence between volume and price might indicate reversals.
  • 12.
    Goal of TechnicalAnalysis: ■ To identify entry and exit points for trades based on price trends and patterns.
  • 13.
    Key Differences BetweenFundamental and Technical Analysis:
  • 14.
    Which One toUse? ■ Investors (long-term): Often prioritize fundamental analysis to find quality stocks to hold for years. ■ Traders (short-term): Rely heavily on technical analysis to profit from market fluctuations. ■ Blended Approach: Some combine both methods. For example, use fundamental analysis to pick strong companies and technical analysis to decide the best time to enter or exit. Both approaches have their strengths and limitations, and using them together can provide a well-rounded perspective.