This document discusses using the pandas library in Python to analyze and manipulate data, as an alternative to SQL. It provides examples of how common SQL queries like SELECT, WHERE, ORDER BY, GROUP BY, aggregate functions can be performed using pandas DataFrames and Series. Specific pandas functions and methods are mapped to each SQL equivalent, like using df[condition] instead of WHERE, df.groupby() instead of GROUP BY, and df['col'].pct_change() to calculate percentage change between rows. The document aims to demonstrate how pandas allows expressing data analysis tasks in a more Pythonic way compared to SQL.


![Attribution-NonCommercial-ShareAlike
4.0 International(CC BY-NC-SA 4.0)
Walter Gentile
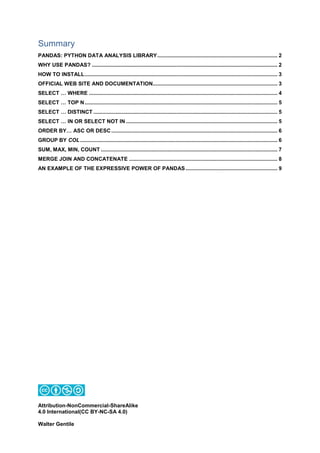
In order to describe our examples, we define a general purpose
Dataframe:
import pandas as pd
df = pd.dataframe(columns=[‘col1’,’col2’,…,’colN’])
SELECT … WHERE
SELECT * FROM TABLE WHERE col = ’val’
selected = df[ df[‘col]==’val’ ]
SELECT col1,col2,…,colN FROM TABLE WHERE colX = 'val'
selected = df[df[‘colX’]==’val’][[‘col1’,’col2’,…,’colN’]]
SELECT * FROM TABLE WHERE col1 = 'v_1' AND col2 = 'v_2'
codition_1 = df[‘col1’] == ‘v_1’
condition_2 = df[‘col2’]==’v_2’]
selected_values = df[condition_1 & conditionn_2]
SELECT * FROM TABLE WHERE col1 = 'v_1' OR col2 = 'v_2'
codition_1 = df[‘col1’] == ‘v_1’
condition_2 = df[‘col2’]==’v_2’]
selected_values = df[ condition_1| condition_2]](https://image.slidesharecdn.com/fromsqltopandas-190920144921/85/From-SQL-to-Pandas-5-320.jpg)
![Attribution-NonCommercial-ShareAlike
4.0 International(CC BY-NC-SA 4.0)
Walter Gentile
SELECT … TOP N
SELECT TOP N * FROM TABLE
selected_values = df.head(N)
SELECT TOP N col1, col2,…, colN FROM TABLE
selected_values = df[[‘col1’,col2,…,’colX’]].head(N)
SELECT … DISTINCT
SELECT DISTINCT(col) FROM TABLE WHERE condition
distinct_values = df[condition].col.unique() OR
distinct_values = df[‘col’].unique()
SELECT … IN or SELECT NOT IN
SELECT * FROM TABLE WHERE col IN (‘v_1’,’v _2’,…’v _N’)
in_val = df[ df[‘col’].isin([‘v_1’,’v_2’,…,’v_N’])]
SELECT * FROM TABLE WHERE col NOT IN (‘v_1’,’v _2’,…’v _N’)
not_in_val = df[~ df[‘col’].isin([‘v_1’,’v_2’,…,’v_N’]) ]](https://image.slidesharecdn.com/fromsqltopandas-190920144921/85/From-SQL-to-Pandas-6-320.jpg)
![Attribution-NonCommercial-ShareAlike
4.0 International(CC BY-NC-SA 4.0)
Walter Gentile
ORDER BY… ASC or DESC
SELECT * FROM TABLE ORDER BY col ASC
asc_ordered = df.sort_values(['col'], ascending = True)
SELECT * FROM TABLE ORDER BY col DESC
desc_ordered = df.sort_values(['col'], ascending = False)
GROUP BY col
SELECT col1,… ,colX FROM TABLE GROUP BY col1,…,colX
grouped = df.groupby(['col1',…,'colX'])](https://image.slidesharecdn.com/fromsqltopandas-190920144921/85/From-SQL-to-Pandas-7-320.jpg)
![Attribution-NonCommercial-ShareAlike
4.0 International(CC BY-NC-SA 4.0)
Walter Gentile
SUM, MAX, MIN, COUNT
SELECT SUM(col1) FROM TABLE
sum = df[['col1']].sum()
SELECT MAX(col1) FROM TABLE
max = df[['col1']].max()
SELECT MIN(col1) FROM TABLE
min = df[['col1']].min()
SELECT COUNT(*) FROM TABLE WHERE col = ‘val’
count = df[df['col']==’val’][‘col’].count()](https://image.slidesharecdn.com/fromsqltopandas-190920144921/85/From-SQL-to-Pandas-8-320.jpg)


![Attribution-NonCommercial-ShareAlike
4.0 International(CC BY-NC-SA 4.0)
Walter Gentile
𝑅𝑒𝑡𝑢𝑟𝑛 =
𝑉𝑎𝑙𝑢𝑒(𝐷𝑎𝑡𝑒_2) − 𝑉𝑎𝑙𝑢𝑒(𝐷𝑎𝑡𝑒_1)
𝑉𝑎𝑙𝑢𝑒(𝐷𝑎𝑡𝑒_1)
𝑤𝑖𝑡ℎ 𝐷𝑎𝑡𝑒_2 > 𝐷𝑎𝑡𝑒_1
SQL Server Solution
A possible solution, certainly not the only one, to this problem, using T-
SQL in Microsoft Sql Server environment are this (suppose to store data
into T_DATA table):
WITH T2 AS (
SELECT ID = ROW_NUMBER() OVER (ORDER BY [Date] DESC),
[Date], [Value]
FROM T_DATA
)
,T3 AS (
SELECT T1.[Date], T1.[Value],
[Return] =(ISNULL(T1.[Value], 0) - T2.[Value])/T2.[Value]
FROM
(
SELECT ID_1 = ROW_NUMBER() OVER (ORDER BY [Date] DESC), *
FROM T_DATA) T1
LEFT JOIN T2 ON T1.ID_1 + 1 = T2.ID
)
UPDATE TD
SET TD.[Return] = T3. [Return]
FROM T_DATA AS TD
INNER JOIN T3 ON TD.[Date] = T3.[Date]
PANDAS Solution
Once the data has been loaded into a dataframe called for example df
we can update the Return column with this single line of code.
df[‘Return’] = df[‘Value].pct_change()
Unbelievable! 😊](https://image.slidesharecdn.com/fromsqltopandas-190920144921/85/From-SQL-to-Pandas-11-320.jpg)