Download as PDF, PPTX


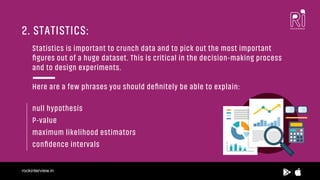

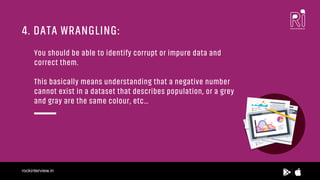


The document serves as a guide for freshers preparing for big data interviews, highlighting essential skills such as programming languages (R or Python with SQL), statistics, machine learning concepts, data wrangling, data visualisation, software engineering principles, and understanding product management metrics. It emphasizes the importance of practical knowledge and familiarity with tools and techniques fundamental to data science. Additionally, it encourages taking mock interviews to further prepare for real-world scenarios.