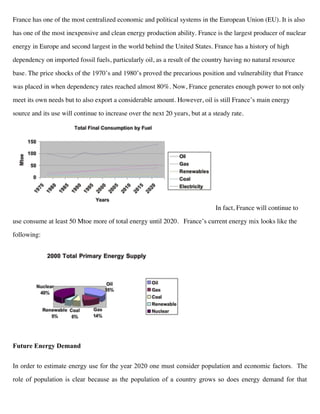
France has one of the most centralized economic and political systems in the EU. It generates enough power from nuclear energy to meet domestic needs and export excess. However, France will continue increasing oil consumption by 50 Mtoe until 2020. Population is projected to grow 1.02% annually to 63.5 million by 2020. GDP is projected to reach $2,225 billion by 2020 based on past growth trends. Combining population and GDP projections, energy demand is estimated to reach 328 Mtoe by 2020. Coal use will drop to 4% of the energy supply by 2020 while oil accounts for 60% and gas 22%. Nuclear power currently supplies 75% of France's electricity but will decline to 9% by 2020 as renew
The annual Energy Outlook reflects our best effort to describe a “most likely” trajectory of the global energy system, based on our views of likely economic and population growth, as well as developments in policy and technology
This 2015 edition updates our view of the likely path of global energy markets to 2035. We make assumptions on changes in policy, technology and the economy, based on extensive internal and external consultations, using a range of analytical tools to build a single “most likely” view.
The Outlook highlights the continuous change in the energy system – the changing fuel mix, the changing patterns of trade – as it adapts to meet the world’s growing energy needs. It also highlights the challenge of delivering energy supplies which are sustainable, secure and affordable. The Outlook emphasizes the role of competition and market forces in driving technology and innovation to help us meet that challenge.
The BP Energy Outlook outlines the “most likely” path for the global energy landscape - supply and demand - over the next 20 years. Read the full report here
The BP Energy Outlook 2035 is our 2014 projection for the world's energy future.
This year's outlook reveals that global energy demand continues to grow but that growth is slowing and will mainly be driven by emerging economies - led by China and India.
Shares of the major fossil fuels are converging, with oil, natural gas and coal each expected to make up around 27 per cent of the total mix by 2035 and the remaining share coming from nuclear, hydroelectricity and renewables.
Watch the video to see what else 2035 could bring for the energy industry. To find out more about the BP Energy Outlook 2035, visit http://www.bp.com/energyoutlook
The annual Energy Outlook reflects our best effort to describe a “most likely” trajectory of the global energy system, based on our views of likely economic and population growth, as well as developments in policy and technology
This 2015 edition updates our view of the likely path of global energy markets to 2035. We make assumptions on changes in policy, technology and the economy, based on extensive internal and external consultations, using a range of analytical tools to build a single “most likely” view.
The Outlook highlights the continuous change in the energy system – the changing fuel mix, the changing patterns of trade – as it adapts to meet the world’s growing energy needs. It also highlights the challenge of delivering energy supplies which are sustainable, secure and affordable. The Outlook emphasizes the role of competition and market forces in driving technology and innovation to help us meet that challenge.
The Energy Outlook sets out a base case which outlines the 'most likely' path for global energy markets until 2035, based on assumptions and judgments about future changes in policy, technology and the economy. The Outlook also develops alternative cases to explore key uncertainties
The annual Energy Outlook reflects our best effort to describe a “most likely” trajectory of the global energy system, based on our views of likely economic and population growth, as well as developments in policy and technology
This 2015 edition updates our view of the likely path of global energy markets to 2035. We make assumptions on changes in policy, technology and the economy, based on extensive internal and external consultations, using a range of analytical tools to build a single “most likely” view.
The Outlook highlights the continuous change in the energy system – the changing fuel mix, the changing patterns of trade – as it adapts to meet the world’s growing energy needs. It also highlights the challenge of delivering energy supplies which are sustainable, secure and affordable. The Outlook emphasizes the role of competition and market forces in driving technology and innovation to help us meet that challenge.
The BP Energy Outlook outlines the “most likely” path for the global energy landscape - supply and demand - over the next 20 years. Read the full report here
The BP Energy Outlook 2035 is our 2014 projection for the world's energy future.
This year's outlook reveals that global energy demand continues to grow but that growth is slowing and will mainly be driven by emerging economies - led by China and India.
Shares of the major fossil fuels are converging, with oil, natural gas and coal each expected to make up around 27 per cent of the total mix by 2035 and the remaining share coming from nuclear, hydroelectricity and renewables.
Watch the video to see what else 2035 could bring for the energy industry. To find out more about the BP Energy Outlook 2035, visit http://www.bp.com/energyoutlook
The annual Energy Outlook reflects our best effort to describe a “most likely” trajectory of the global energy system, based on our views of likely economic and population growth, as well as developments in policy and technology
This 2015 edition updates our view of the likely path of global energy markets to 2035. We make assumptions on changes in policy, technology and the economy, based on extensive internal and external consultations, using a range of analytical tools to build a single “most likely” view.
The Outlook highlights the continuous change in the energy system – the changing fuel mix, the changing patterns of trade – as it adapts to meet the world’s growing energy needs. It also highlights the challenge of delivering energy supplies which are sustainable, secure and affordable. The Outlook emphasizes the role of competition and market forces in driving technology and innovation to help us meet that challenge.
The Energy Outlook sets out a base case which outlines the 'most likely' path for global energy markets until 2035, based on assumptions and judgments about future changes in policy, technology and the economy. The Outlook also develops alternative cases to explore key uncertainties
A new global energy landscape is emerging, resetting long-held expectations for our energy future. Bringing together the latest data and policy developments, the World Energy Outlook 2013 presents up to date, projections of energy trends through to 2035, fuel by fuel, sector by sector, region by region and scenario by scenario. Oil is analysed in-depth: resources, production, demand, refining and international trade. Energy efficiency is treated in much the same way as conventional fuels: Its prospects and contribution are presented in a dedicated chapter. The report examines the outlook for Brazil's energy sector and provides updates on three key areas of critical importance to energy and climate trends: (i) achieving universal energy access; (ii) developments in subsidies to fossil fuels and renewables; and (iii) the impact of energy use on climate change. Oil supply, demand and trade: a fresh look at the economics and decline rates of different types of oil production around the world, the prospects for light tight oil inside and outside North America, along with new analysis of oil products and the refining sector. By Fatih Birol, Chief Economist, International Energy Agency
The world is moving towards a crucial climate change meeting in Paris in December 2015 (COP21). The negotiations there will be based on national pledges, formally known as Intended Nationally Determined Contributions, with the goal of setting the world on a sustainable path. As energy production and use is responsible for two-thirds of greenhouse-gas emissions, the IEA feels an obligation to make a contribution to COP21 – a contribution which reconciles climate and energy needs.
Executive Summary for the IEA's annual World Energy Outlook, the 2016 edition. The Outlook predicts natural gas use will continue to rise, while coal will continue to fall. "We see clear winners for the next 25 years, natural gas, but especially wind and solar, replacing the champion of the previous 25 years, coal," said Fatih Birol, IEA's executive director.
Large differences in regional energy prices are set to affect industrial competitiveness, influencing investment decisions and company strategies. The extraordinary rise of light tight oil in the United States will play a major role in meeting global demand growth over the next decade, but the Middle East – the only large source of low-cost oil – will remain at the centre of the longer-term oil outlook. India is set to overtake China in the 2020s as the principal source of growth in global energy demand. These are just some of the key findings from the IEA in the latest edition of its World Energy Outlook.
The 2015 edition of the BP Statistical Review of World Energy, launched today, highlights how significant changes in global energy production and consumption have had profound implications for prices, for the global fuel mix, and for global carbon dioxide emissions. The 64th annual edition of the Statistical Review highlights the continuing importance of the US shale revolution, with the US overtaking Saudi Arabia as the world’s biggest oil producer and surpassing Russia as the world’s largest producer of oil and gas.
Session by Paul Simons, Deputy Executive Director, International Energy Agency, 4 February 2016
Signs of change in global energy have multiplied in the 12 months. Oil prices fell sharply, with the prices of other fuels moving in tandem in many parts of the world. Amid turmoil in parts of the Middle East, a clear pathway opened up for the return of Iran, one of the world’s largest hydrocarbon resource-holders, to oil markets. China’s role in driving global trends continues to change as it enters a much less energy-intensive phase in its development. Renewables contributed almost half of the world’s new power generation while the coverage of mandatory energy efficiency regulation expanded to more than a quarter of global consumption. And the Paris Agreement reached at COP21 has provided a catalyst to accelerate investments in cleaner technologies and energy efficiency. The session addressed these and other developments, the associated risks and opportunities that might lie ahead – and what can be done to put the energy system on a more secure and sustainable footing.
This presentation was presented by Norberto Pignatti during the annual SITE Development Day 2021 conference at Stockholm School of Economics via Zoom.
Disclaimer: SITE has the permission from Norberto Pignatti to upload this presentation slide.
People's Insights Monthly Briefs: April & May 2014MSL
Our fourth issue of the People’s Insights monthly briefs features a rich diversity of initiatives that broadly fall under three themes:
- evolution of content
- spectrum of millennials
- paths to going viral
Europe's Changing Energy Future - MSLGROUP Energy Report July 2014MSL
A few years ago, who would have imagined a world where shale is rewriting geopolitics, where solar and wind are supplanting coal in Germany, or where there are serious concerns over the lights starting to go out in the UK. One thing is clear – the European Energy landscape is changing at a pace that has never been seen before. In our fifth report, we bring you in-depth commentary from energy experts in Brussels, France, Italy, Germany, Poland, Sweden, the Netherlands and the UK. Connect with us to seek advice on attracting the best talent, investor communication; crisis preparedness and corporate reputation management. http://www.mslgroup.com
To find out more about MSLGROUP’s services, please contact Nick Bastin on nick.bastin@capitalmsl.com | Share your feedback with us on twitter @msl_group.
Let's peek into WeChat, Line, KakaoTalk and other fast growing mobile social platforms. We show you how consumers are using them and how brands can leverage these mobile messengers.
India's Union Budget 2014 - Expectations and ChallengesMSL
On July 10, the Narendra Modi government will present its maiden Union Budget. Expectations are high from a team that is considered industry-friendly and pro-reform.
However, the circumstances are far from comfortable.
Adding to the slowing growth and a burgeoning fiscal deficit in India are skyrocketing prices of essentials and the prospect of a weak monsoon. Several sectors of the economy – such as manufacturing – require special attention, while critical decisions such as foreign investment in defense and tax rationalisation are pending. Can Finance Minister Arun Jaitley deliver?
MSLGROUP has put together an analysis of what to expect in the Budget and the challenges before Modi and Jaitley. It spans the gamut from fiscal prudence to disinvestment and tax reforms to subsidies.
China: Growth through Innovation | Highlights from World Economic Forum's New...MSL
MSLGROUP China Chairman Johan Björkstén attended the World Economic Forum's 'New Champions' meeting earlier this month where he gained firsthand knowledge on issues like Chinese reforms, innovative business developments, and the renewed sense of urgency around climate change.
Björkstén met with senior executives, officials, and economists to gauge their opinions and understand their priorities and concerns about the future. The following document captures some of those discussions and provides the context to understand the changes in China. It also uncovers interesting opportunities and challenges for Chinese businesses and multinational companies operating in China.
We hope you enjoy reading this thought piece and look forward to your feedback.
Connect with our team on twitter: @MSLGROUPAsia
In this year’s Salterbaxter MSLGROUP Directions Report, we are getting under the surface of the most significant movements, models and philosophies in sustainable business.
Joined by thought-leaders at the very cutting edge of their adoption and popularisation, we explore the context in which the movements has sprung up, from consumer pressure to the UN’s sustainable development goals.
Join the conversation on Twitter with the hashtag #SBDirections
Good is Great: People's Insights for June & JulyMSL
Good is Great - our latest issue of People’s Insights monthly brief features eight initiatives that have some elements of corporate and brand citizenship. Three of the eight campaigns we featured are winners from Cannes.
They broadly fall under the following themes:
Creative Citizenship = Tech + Good
Brand citizenship – Proactive measures to tackle today’s challenges
Bonus! What’s hot around the World Cup and
the latest in the online privacy debate.
This issue features:
• Becoming Sweetie
• Message Barter
• Coca-Cola Happy ID
• Cadbury Caps Calories
• Spent: Looking for Change
• Starbucks College Achievement Plan
• adidas brazuca babies
• Right to be Forgotten
We hope you enjoy reading it and invite you to share your feedback and tips with us @PeoplesLab.
You can also reach out to us on Twitter @msl_group.
Over the last 50 years, while energy consumption grew substantially, the world undertook a transition in its usage of fossil fuels, from solids (coal) to liquids (oil) to gases (natural gas).
In 1980, the world energy consumption was equivalent to 289 x 10 18 Joules. This was a total of 580 exajoules in 2020. This year, we are crossing the 349,847,500 terajoules mark on August 08th, 2022 (11:25 pm CST), the time this report was written.
In this report, we examine world energy trends over the past 170 years and forecast the next 30, and prove beyond reasonable doubt they are connected to Climate Change, CO2 emissions and other GHG, GDP and Demographic Growth.
The evolution of the GDP with a scarcity of the natural resourcesEfraim Chababe
The 21st century being marked by the transition to green energies and to the 2020 and 2050 milestones set by global meetings on climate changes, our current transition pace is far too low when taking into account the expected progression of the GDP, and
countries' carbon footprint instead of their carbon emission.
ELECTRIC AND THERMAL ENERGY PRODUCTION AND STORAGE SYSTEM BY PINECONE WASTEAEIJjournal2
Rural ecosystems are the main source of biomass used in the production of renewable energy in Portugal.
However, it is based on pruning residues are most of the raw material for biomass leaving other
opportunities aside. This paper highlights the role of pinecone waste without pinion for the energy sector.
The present paper studies different solutions to enhance the use of the pinecones for energy proposes. The
present paper also presents the different principal technologies.
ELECTRIC AND THERMAL ENERGY PRODUCTION AND STORAGE SYSTEM BY PINECONE WASTEaeijjournal
Rural ecosystems are the main source of biomass used in the production of renewable energy in Portugal.
However, it is based on pruning residues are most of the raw material for biomass leaving other
opportunities aside. This paper highlights the role of pinecone waste without pinion for the energy sector.
The present paper studies different solutions to enhance the use of the pinecones for energy proposes. The
present paper also presents the different principal technologies.
It is possible to conclude that the use of residual biomass is a way to reduce the national dependence on
energy imports (fossil specialties), decreases transport losses (by allowing local production and
consumption locally) and encourages the management of forest areas (fixing people in rural areas and
lowers the risk of fire).
ELECTRIC AND THERMAL ENERGY PRODUCTION AND STORAGE SYSTEM BY PINECONE WASTEAEIJjournal2
Rural ecosystems are the main source of biomass used in the production of renewable energy in Portugal.
However, it is based on pruning residues are most of the raw material for biomass leaving other
opportunities aside. This paper highlights the role of pinecone waste without pinion for the energy sector.
The present paper studies different solutions to enhance the use of the pinecones for energy proposes. The
present paper also presents the different principal technologies.
It is possible to conclude that the use of residual biomass is a way to reduce the national dependence on
energy imports (fossil specialties), decreases transport losses (by allowing local production and
consumption locally) and encourages the management of forest areas (fixing people in rural areas and
lowers the risk of fire).
Statistical Review of World Energy 2021 Full report - BPAbdelmounimTOUILEB
The COVID-19 pandemic had a dramatic impact
on energy markets, with both primary energy
and carbon emissions falling at their fastest rates
since the Second World War. Nevertheless,
renewable energy continued to grow, with solar
power recording its largest ever increase.
Entre el 30 de junio y el 2 de julio de 2014 organizamos en la Fundación Ramón Areces (C/ Vitruvio, 5, en Madrid) un curso de verano en colaboración con la Universidad Complutense de Madrid sobre los retos energéticos de Europa ante el cambio climático. En estas jornadas, diferentes expertos analizaron la transición energética en Europa para cumplir las exigencias de los compromisos internacionales en materia de emisiones de CO2.
the European energy policy for 2020 is at a cross road. Do the existing three objectives for 2020 go ahead to a final success or not? Are they completing or contradicting each other? Energy efficiency, renewables and Green House Gas mitigation are not the various faces of the same kind...
New IEA report sees global energy-related CO2 emissions rising by 1.5 billion tonnes in 2021, driven by a strong rebound in demand for coal in electricity generation
Impacto del COVID-19 en las emisiones de GEI del
Sistema Eléctrico Interconectado Peruano
La pandemia COVID-19 ha tenido un impacto en la economía, la industria, la salud y sectores clave en casi todos los países del mundo. La generación eléctrica ha sido uno de los sectores más impactados por las medidas nacionales tomadas debido a la pandemia.
En Perú se decretó una cuarentena social obligatoria que impactó fuertemente la demanda y generación de energía eléctrica en el país.
Diana Kool discusses the potential impact of climate change on the global economy and financial markets, focusing on energy sources and the growth of renewable forms
"" is an initiative undertaken by the members of the French Nuclear Energy Society (SFEN), the American Nuclear Society (ANS) and the European Nuclear Society (ENS). It brings together nuclear scientists from all parts of the globe, through the representation of 60 regional and national nuclear associations.
Roadmap for moving to a low-carbon economy by 2050Leonardo ENERGY
If global warming is to be held below 2°C compared to pre-industrial times, then all major economies will need to make deep emissions reductions. By 2050, the European Union could cut most of its greenhouse gas emissions. The European Commission has looked at cost-efficient ways to make the European economy more climate-friendly and less energy-consuming. With its Roadmap for moving to a competitive low-carbon economy in 2050, the European Commission has looked beyond short-term objectives and set out a cost-effective pathway for achieving much deeper emission cuts by the middle of the century.
The Roadmap is the main long-term policy initiative put forward to move the EU towards using resources in a sustainable way. It states that, by 2050, the EU should cut its emissions to 80% below 1990 levels through domestic reductions alone. It sets out milestones which form a cost-effective pathway to this goal - reductions of 40% by 2030 and 60% by 2040. It also shows how the main sectors responsible for Europe's emissions - power generation, industry, transport, buildings and construction, as well as agriculture - can make the transition to a low-carbon economy most cost-effectively.
This paper reflects my personal emotions with the closing of the Centre for African Studies at UCT. Please note that the grade I received is equivalent to an A+
UiPath Test Automation using UiPath Test Suite series, part 4DianaGray10
Welcome to UiPath Test Automation using UiPath Test Suite series part 4. In this session, we will cover Test Manager overview along with SAP heatmap.
The UiPath Test Manager overview with SAP heatmap webinar offers a concise yet comprehensive exploration of the role of a Test Manager within SAP environments, coupled with the utilization of heatmaps for effective testing strategies.
Participants will gain insights into the responsibilities, challenges, and best practices associated with test management in SAP projects. Additionally, the webinar delves into the significance of heatmaps as a visual aid for identifying testing priorities, areas of risk, and resource allocation within SAP landscapes. Through this session, attendees can expect to enhance their understanding of test management principles while learning practical approaches to optimize testing processes in SAP environments using heatmap visualization techniques
What will you get from this session?
1. Insights into SAP testing best practices
2. Heatmap utilization for testing
3. Optimization of testing processes
4. Demo
Topics covered:
Execution from the test manager
Orchestrator execution result
Defect reporting
SAP heatmap example with demo
Speaker:
Deepak Rai, Automation Practice Lead, Boundaryless Group and UiPath MVP
Connector Corner: Automate dynamic content and events by pushing a buttonDianaGray10
Here is something new! In our next Connector Corner webinar, we will demonstrate how you can use a single workflow to:
Create a campaign using Mailchimp with merge tags/fields
Send an interactive Slack channel message (using buttons)
Have the message received by managers and peers along with a test email for review
But there’s more:
In a second workflow supporting the same use case, you’ll see:
Your campaign sent to target colleagues for approval
If the “Approve” button is clicked, a Jira/Zendesk ticket is created for the marketing design team
But—if the “Reject” button is pushed, colleagues will be alerted via Slack message
Join us to learn more about this new, human-in-the-loop capability, brought to you by Integration Service connectors.
And...
Speakers:
Akshay Agnihotri, Product Manager
Charlie Greenberg, Host
Kubernetes & AI - Beauty and the Beast !?! @KCD Istanbul 2024Tobias Schneck
As AI technology is pushing into IT I was wondering myself, as an “infrastructure container kubernetes guy”, how get this fancy AI technology get managed from an infrastructure operational view? Is it possible to apply our lovely cloud native principals as well? What benefit’s both technologies could bring to each other?
Let me take this questions and provide you a short journey through existing deployment models and use cases for AI software. On practical examples, we discuss what cloud/on-premise strategy we may need for applying it to our own infrastructure to get it to work from an enterprise perspective. I want to give an overview about infrastructure requirements and technologies, what could be beneficial or limiting your AI use cases in an enterprise environment. An interactive Demo will give you some insides, what approaches I got already working for real.
Transcript: Selling digital books in 2024: Insights from industry leaders - T...BookNet Canada
The publishing industry has been selling digital audiobooks and ebooks for over a decade and has found its groove. What’s changed? What has stayed the same? Where do we go from here? Join a group of leading sales peers from across the industry for a conversation about the lessons learned since the popularization of digital books, best practices, digital book supply chain management, and more.
Link to video recording: https://bnctechforum.ca/sessions/selling-digital-books-in-2024-insights-from-industry-leaders/
Presented by BookNet Canada on May 28, 2024, with support from the Department of Canadian Heritage.
Builder.ai Founder Sachin Dev Duggal's Strategic Approach to Create an Innova...Ramesh Iyer
In today's fast-changing business world, Companies that adapt and embrace new ideas often need help to keep up with the competition. However, fostering a culture of innovation takes much work. It takes vision, leadership and willingness to take risks in the right proportion. Sachin Dev Duggal, co-founder of Builder.ai, has perfected the art of this balance, creating a company culture where creativity and growth are nurtured at each stage.
DevOps and Testing slides at DASA ConnectKari Kakkonen
My and Rik Marselis slides at 30.5.2024 DASA Connect conference. We discuss about what is testing, then what is agile testing and finally what is Testing in DevOps. Finally we had lovely workshop with the participants trying to find out different ways to think about quality and testing in different parts of the DevOps infinity loop.
GDG Cloud Southlake #33: Boule & Rebala: Effective AppSec in SDLC using Deplo...James Anderson
Effective Application Security in Software Delivery lifecycle using Deployment Firewall and DBOM
The modern software delivery process (or the CI/CD process) includes many tools, distributed teams, open-source code, and cloud platforms. Constant focus on speed to release software to market, along with the traditional slow and manual security checks has caused gaps in continuous security as an important piece in the software supply chain. Today organizations feel more susceptible to external and internal cyber threats due to the vast attack surface in their applications supply chain and the lack of end-to-end governance and risk management.
The software team must secure its software delivery process to avoid vulnerability and security breaches. This needs to be achieved with existing tool chains and without extensive rework of the delivery processes. This talk will present strategies and techniques for providing visibility into the true risk of the existing vulnerabilities, preventing the introduction of security issues in the software, resolving vulnerabilities in production environments quickly, and capturing the deployment bill of materials (DBOM).
Speakers:
Bob Boule
Robert Boule is a technology enthusiast with PASSION for technology and making things work along with a knack for helping others understand how things work. He comes with around 20 years of solution engineering experience in application security, software continuous delivery, and SaaS platforms. He is known for his dynamic presentations in CI/CD and application security integrated in software delivery lifecycle.
Gopinath Rebala
Gopinath Rebala is the CTO of OpsMx, where he has overall responsibility for the machine learning and data processing architectures for Secure Software Delivery. Gopi also has a strong connection with our customers, leading design and architecture for strategic implementations. Gopi is a frequent speaker and well-known leader in continuous delivery and integrating security into software delivery.
Encryption in Microsoft 365 - ExpertsLive Netherlands 2024Albert Hoitingh
In this session I delve into the encryption technology used in Microsoft 365 and Microsoft Purview. Including the concepts of Customer Key and Double Key Encryption.
Encryption in Microsoft 365 - ExpertsLive Netherlands 2024
France energy profile
1. France has one of the most centralized economic and political systems in the European Union (EU). It is also
has one of the most inexpensive and clean energy production ability. France is the largest producer of nuclear
energy in Europe and second largest in the world behind the United States. France has a history of high
dependency on imported fossil fuels, particularly oil, as a result of the country having no natural resource
base. The price shocks of the 1970’s and 1980’s proved the precarious position and vulnerability that France
was placed in when dependency rates reached almost 80%. Now, France generates enough power to not only
meet its own needs but to also export a considerable amount. However, oil is still France’s main energy
source and its use will continue to increase over the next 20 years, but at a steady rate.
In fact, France will continue to
use consume at least 50 Mtoe more of total energy until 2020. France’s current energy mix looks like the
following:
Future Energy Demand
In order to estimate energy use for the year 2020 one must consider population and economic factors. The
role of population is clear because as the population of a country grows so does energy demand for that
2. country. The main economic statistic to be considered is gross domestic product (GDP). GDP is an indicator
of how well the economy is doing, if the growth rates of GDP are great than the increases in energy demand
will also be great. By examining total population, total GDP, and their respective growth rates one can link
these statistics in order to predict energy use into the year 2020. However, this process possesses many
uncertainties, as one is required to predict economic performance and population growth over the next
seventeen years. Therefore, unforeseen events such as natural disasters and recessions have the potential to
skew the results of these predictions. Despite these uncertainties this prediction will not account for such
occurrences and assume future growth based on the statistics of previous years.
Examination of recent population growth in France reveals that the trends are not perfectly linear.
One can see that the
population growth rates are fluctuating. The following graph demonstrates this:
These changes in the population
growth rate will be incorporated into the predicted population size for the year 2020. France is a developed
nation, therefore it is unlikely to experience any dramatic population swings. Therefore it is assumed that for
the next 17 years the population will grow at a rate roughly around 1.02%. This will result in the population
in 2020 reaching 63.50 million. Alongside population growth one must examine overall GDP and its
associated trends. The following graph demonstrates the growth of total GDP:
3. While this chart captures the
expanding nature of the French economy it fails to demonstrate the variability in the growth rate. The
following graph exhibits this information:
Economic growth rates are
difficult, if not impossible, to predict. However, from the graph of total GDP one can see that the economy is
expanding. By taking the average GDP growth rates one can extrapolate this growth into the future. By the
year 2020 France’s GDP will reach $2225.06 billion in terms of 1990 US dollars.
With these estimates of population and GDP growth in place one can predict future energy demand by
examining past energy demands and combining them with these established forecasts. The following graph
represents past trends in demands for energy:
One can see that energy demands of
the past have increased in proportion to population and GDP growth of the past. Therefore, combining the
likely population and GDP growth rates one can estimate that energy demand by the year 2020 will be 328
4. Mtoe (million tons oil equivalent).
Fossil Fuels
When examining the role that fossil fuels will play in France’s future energy mix the category needs
to be broken down into two sections: coal and oil/gas. These sections need to be viewed separately as the
amount of money allocated to research and development (R&D) by the French government will affect their
share of total final consumption in 2020. The infrastructure of industry, transportation, and residential energy
consumption must also be considered. This will be accomplished by looking at the role fossil fuels have had
over time. Together these factors can be used to determine the likely share of fossil fuels as a source of
energy. The following graph traces the role of coal in France’s energy mix:
This graph illustrates the declining use
of coal in France’s energy mix. This trend will continue because the use of coal is widely unpopular because
its emissions contribute to global warming. In fact, France has set 2005 as the date in which it will complete
the phase out of all domestic coalmines. The following graph shows the role of natural gas and oil in the
energy mix:
This graphs shows the increasing
dependence on natural gas and oil in France. While these fuels lead to greenhouse gas emissions (GHG) they
are much cleaner when compared to coal. In order to predict the future use of these fuels R&D budgets must
be considered. The following represents this information:
5. These budgets indicate
decreasing funds for fossil fuel R&D. Coal’s budget is nonexistent indicating its decreasing prevalence in the
energy mix. Oil and gas’s budget is decreasing but still substantial, indicating a continued reliance on these
fuels. In the year 2020 coal consumption will drop to about 4% of France’s energy supply while oil will
account for 60% and gas 22%.
Nuclear and Electricity
During the 1970’s France invested in Pressurized Water Reactor (PWR) technology, which all their
reactors are today, and shifted their policy toward replacing 100% of fossil fuel technology
with nuclear energy from production by the French reactor type, UNGG (Natural Uranium, Graphite
6. moderated, Gas cooled). Cogema,
a French company, controls 20% of global Uranium production. France uses about 10,500 tones of Uranium
annually, 30% of it being imported from Niger and the rest from Canada, and Australia.
French nuclear reactors have proved to be some of the most economical and environmentally efficient in the
world. Standardization and mass production of nuclear facility parts has “enabled manufacturers and safety
authorities to concentrate their resources, to shorten the plant’s construction time…. Standardization
facilitates training and creates a steep learning curve for operating, servicing and maintenance personnel”[1].
As environmental concerns and the need to decrease energy intensity came into the spotlight, nuclear energy
appeared to be the best option. Unlike coal and other fossil fuel, nuclear energy releases no nitrogen or
sulphur. France has one of the lowest rates of Co2 emissions in the European union at 78grams/kwh. The
Ministry of Industry reports that nuclear Power plants prevent approximately 1.7 million tons of SO2 and
890,000 tons of NOX every year.
Currently, the 58 nuclear power plants produce roughly 75% of the country’s
7. electricity. Its total capacity of 63,000 MWE, which allows the country to not only meet its consumption
needs but to also increase exportation. Exportation neared 63 billion Kw/h in 1999 with a net value of 2.6
billion Euros.
French overall electricity exports 1990-99 (TWO)
95% of the electricity produced by nuclear energy is managed by EDF (Electricite de France), one of the last
state monopolies in Europe and one of the world’s largest electric utilities. It supplies energy to over 31
million people a year. In February 2000, France passed a bill allowing the deregulation of EDF in order to
allow those that consume more than 16Gw/h, eventually lowering the number to 9Gw/h, annually to have fair
access to electricity options and providers. The public sector will not be affected by this decision. [2]
8. The future of Nuclear energy in France is not precisely clear. After Germany announced their regression
away from nuclear energy, growing opposition has formed in France. Most of the Nuclear power plants will
need to be replaced, which will require heavy investment and subsidies from the government. Maintenance
costs account for more than half of the total operating costs of nuclear facilities.
Yet, contradictory to this objective, at the same time the government has announced that nuclear power plants
will not be charged an eco-tax, which will act as an incentive to use cleaner energy production.
Since a majority of the electricity is supplied by nuclear power it is important to note that the future of
nuclear power will heavily weigh on the future of electricity production and consumption. EDF supplies
almost 95% of all electricity but that will soon be decreasing. In addition, EDF’s R&D budget is gradually
decreasing; in 1989 it held at 40.3 million US dollars and 27.9 million dollars in 1999. EDF’s R & D budget
for 1999 was 405 million Franc’s.
The EU has pressured France to take the path of decentralization and liberalization. The EU has issued that
all the EU countries must open their electricity markets by 33% to competition. As of February 2003, France
had opened up 37% of its market. However, there is still criticism. The companies now involved in France’s
electricity market supply minimal amounts compared to EDF. EDF still holds competitive power and as a
result, can outbid and acquire both foreign and domestic electricity suppliers. Therefore the country will still
be heavily dependent upon nuclear energy but nuclear energy production will be on a steady decline and so
9. will its share in the energy mix for 2020, resulting in a 9% contribution. As France continues on its course of
decentralization and the EU insists upon further liberalization requirements, France will have to enter its
energy and electricity market in order to allow competition.
Criticism has been growing regarding the future of nuclear power and there has been a greater emphasis on
renewable energy increase, France must decide the future of its nuclear energy usage. France has two
options; upgrade the nuclear plants that will need to be replaced or to seek other sources of energy
production. Many of the nuclear plants will need to be replaced around 2015-2020. Currently there is no
initiative to begin construction of new plants and there have been talks to stop French production of Uranium
or at least curb the future increase of production.
Renewables
Sources of renewable energy have the potential to become a major component of
France's energy mix. France took a big step in the direction of renewables
towards the end of the year 2000 with its announcement of the National Energy
Efficiency Program (PNAEE). This program sets out ambiguous goals to achieve
diffusion of renewable technologies into the energy market. Subsides and tax
incentives are relied on to achieve these goals. The result will be a
decrease in the prices of renewable energies. Increased reliance on renewables also helps in achieving the
goal of a decentralized energy sector
PNAEE seeks to achieve the goals of sustainable energy by relying on three key measures. First, price
incentives for wind-generated electricity and small-scale hydro electricity, second to utilize bio-energy, and
finally to increase the R&D budget for renewables substantially. By installing price incentives for wind
power PNAEE provides the potential for wind power to reach 21% of the electricity market by 2010. Bio-
energy has the potential to reach over 5% of France's energy mix by the year 2010. This can be achieved by
continuing installments of wood fired boilers, in 2001 there was a 20%
increase in the stock of these boilers. Wood as a fuel is particularly attractive because it does not contribute
to greenhouse gas emissions; therefore it is in line with the goal of sustainable energy practices. The
10. diffusion of these technologies into the market will depend on learning and increased R&D. The PNAEE
program sees an almost 100% increase in ADEME's budget for renewable technologies. The combination of
these forces will result in renewable energies achieving 9% of France's total energy consumption in the year
2020.
Conclusion
France has three stated goals for their energy policy: security, reducing environmental impacts, and
keeping costs low. The goal of security led France in the direction of nuclear after the oil price shocks of the
1970’s and 1980’s and today about 75% of electricity is provided by nuclear power. However, fears of
environmental impacts, economic concerns, and pressures from the EU for decentralization are leading
France to change the mix of their energy sources. This new energy mix is likely to feature an emphasis on
relatively cleaner fossil fuels. Oil and natural gas will be favored or coal as they contribute less to global
climate change. Renewables will continue to diffuse into the market, but a greater pace than previously in
accordance with the new PNAEE. Bio-fuels will constitute a majority of renewable energy with significant
contributions from wind and solar energy. The energy mix of 2020 is likely to look like the following graph:
French Energy Forecast