Recommended
PPTX
Jenny von Bahr på FORES 12 november 2013
PPS
Climate clubs and the UNFCCC Oscar Widerberg
PPTX
Consumption-based approaches in climate policy - Glen Peters
PPT
Mary Veronica Tovsak Pleterski's power-point presentation
PDF
IPCC:s tredje delrapport, av Thomas Sterner
PDF
REAP Katarina Axelsson (SEI) 14 april 2011
PPTX
Lena Ek på FORES 13 november 2013
PPTX
Andreas Berghs ppt, "Invandring och jobb: har partierna fel lösningar?"
PPT
Konsumera smartare neutral 11 nov 08
PPT
Färdplan 2050 - Emma Lindberg
PPT
PDF
PDF
PDF
PDF
PDF
Session 55 Bengt Erlandsson
PPT
Naturskyddsföreningen, föredrag på transportforum 10 januari 2013
PPT
PDF
Jonas Lodén - Erfarenheter av att ta fram SEAP i Göteborg
PDF
Miljöresultat i Alliansregeringen 2006-2011
PPT
Matsvinn - from field to fork
PDF
PPT
Christina Hood's power-point presentation
PPTX
Grön skatteväxling 2 april final
PPTX
Grön skatteväxling 2 april
PPTX
PPTX
PPT
Max Åhman's power-point presentation
PDF
Presentation moving ahead
PPTX
California dreaming? Zetterberg 2012 10 12
More Related Content
PPTX
Jenny von Bahr på FORES 12 november 2013
PPS
Climate clubs and the UNFCCC Oscar Widerberg
PPTX
Consumption-based approaches in climate policy - Glen Peters
PPT
Mary Veronica Tovsak Pleterski's power-point presentation
PDF
IPCC:s tredje delrapport, av Thomas Sterner
PDF
REAP Katarina Axelsson (SEI) 14 april 2011
PPTX
Lena Ek på FORES 13 november 2013
PPTX
Andreas Berghs ppt, "Invandring och jobb: har partierna fel lösningar?"
Similar to Fores scb aw
PPT
Konsumera smartare neutral 11 nov 08
PPT
Färdplan 2050 - Emma Lindberg
PPT
PDF
PDF
PDF
PDF
PDF
Session 55 Bengt Erlandsson
PPT
Naturskyddsföreningen, föredrag på transportforum 10 januari 2013
PPT
PDF
Jonas Lodén - Erfarenheter av att ta fram SEAP i Göteborg
PDF
Miljöresultat i Alliansregeringen 2006-2011
PPT
Matsvinn - from field to fork
PDF
More from tankesmedjanfores
PPT
Christina Hood's power-point presentation
PPTX
Grön skatteväxling 2 april final
PPTX
Grön skatteväxling 2 april
PPTX
PPTX
PPT
Max Åhman's power-point presentation
PDF
Presentation moving ahead
PPTX
California dreaming? Zetterberg 2012 10 12
PPTX
Sifo - Miljöns betydelse för valet
PPTX
EU, finansoron och de gemensamma utmaningarna
PPTX
Uppdrag välfärd 10 maj 2012
PDF
Tomas Kåberger om förnybar energi i Asien ch Europa.
PPSX
Egyptian election 2011- 12 - Hamdi Hassan
PPTX
Varför går det bra för Sverige?
PPTX
OECD work on fossil fuel subsidies - Simon Upton
PDF
Skiffergas bildspel Anna Nordling på FORES 2013-03-12
PPT
PPT
Gernot Wagner's power-point presentation
PPT
PPTX
YouGov sammanställning om miljöfrågornas betydelse för svenska väljare
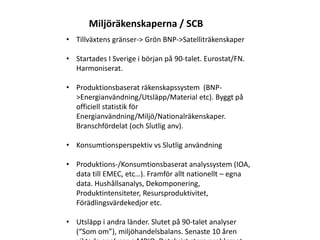
Fores scb aw 1. Miljöräkenskaperna / SCB
• Tillväxtens gränser-> Grön BNP->Satelliträkenskaper
• Startades I Sverige i början på 90-talet. Eurostat/FN.
Harmoniserat.
• Produktionsbaserat räkenskapssystem (BNP-
>Energianvändning/Utsläpp/Material etc). Byggt på
officiell statistik för
Energianvändning/Miljö/Nationalräkenskaper.
Branschfördelat (och Slutlig anv).
• Konsumtionsperspektiv vs Slutlig användning
• Produktions-/Konsumtionsbaserat analyssystem (IOA,
data till EMEC, etc…). Framför allt nationellt – egna
data. Hushållsanalys, Dekomponering,
Produktintensiteter, Resursproduktivitet,
Förädlingsvärdekedjor etc.
• Utsläpp i andra länder. Slutet på 90-talet analyser
(“Som om”), miljöhandelsbalans. Senaste 10 åren
viktade analyser + MRIO. Databrist stora problemet.
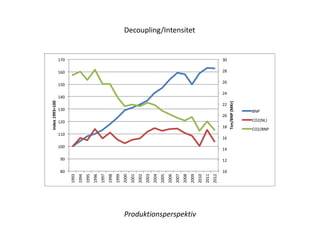
2. Decoupling/Intensitet
30
28
26
24
22
20
18
16
14
12
10
170
160
150
140
130
120
110
100
90
80
1993
1994
1995
1996
1997
1998
1999
2000
2001
2002
2003
2004
2005
2006
2007
2008
2009
2010
2011
2012
Ton/BNP (MKr)
Index 1993=100
BNP
CO2(NL)
CO2/BNP
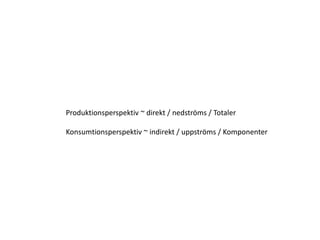
Produktionsperspektiv
3. 0
2
4
6
Tot NL, MTon CO2
8
10
40
12
14
16
60
18
0
10
20
30
50
1990
1991
1992
1993
1994
1995
1996
1997
1998
1999
2000
2001
2002
2003
2004
2005
2006
2007
2008
2008
2009
2010
2011
2012
Tot/Stat FD, Bunkers MTon CO2
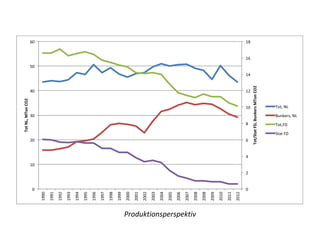
Tot, NL
Bunkers, NL
Tot,FD
Stat FD
Produktionsperspektiv
4. 0
2
4
6
8
10
12
1990
1991
1992
1993
1994
1995
1996
1997
1998
1999
2000
2001
2002
2003
2004
2005
2006
2007
2008
2009
2010
2011
2012
MTon CO2
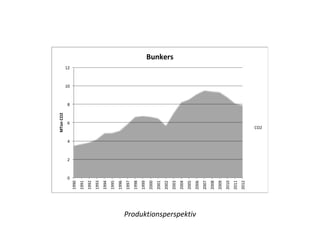
Bunkers
CO2
Produktionsperspektiv
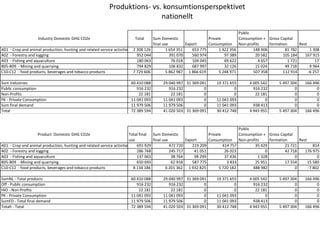
5. 6. Produktions- vs. konsumtionsperspektivet
nationellt
Industry Domestic GHG CO2e Total Sum Domestic
final use Export
Private
Consumption
Public
Consumption +
Non-profits
Gross Capital
formation Rest
A01 - Crop and animal production, hunting and related service activities 2 308 126 1 654 351 653 775 1 422 356 148 906 81 782 1 308
A02 - Forestry and logging 952 044 391 070 560 974 97 389 20 582 105 184 167 915
A03 - Fishing and aquaculture 180 063 76 018 104 045 69 622 4 657 1 721 17
B05-B09 - Mining and quarrying 794 829 106 832 687 997 32 126 15 024 49 718 9 964
C10-C12 - food products, beverages and tobacco products 7 729 606 5 862 987 1 866 619 5 248 971 507 358 112 914 -6 257
Sum industries 60 410 088 29 040 997 31 369 091 19 371 655 4 005 542 5 497 304 166 496
Public consumption 916 232 916 232 0 0 916 232 0 0
Non-Profits 22 181 22 181 0 0 22 181 0 0
PK - Private Consumption 11 041 093 11 041 093 0 11 041 093 0 0 0
Sum final demand 11 979 506 11 979 506 0 11 041 093 938 413 0 0
Total 72 389 594 41 020 503 31 369 091 30 412 748 4 943 955 5 497 304 166 496
Product Domestic GHG CO2e Total final
use
Sum Domestic
final use Export
Private
Consumption
Public
Consumption +
Non-profits
Gross Capital
formation Rest
A01 - Crop and animal production, hunting and related service activities 691 929 472 720 219 209 414 757 35 429 21 721 814
A02 - Forestry and logging 286 768 245 717 41 051 26 023 0 42 718 176 975
A03 - Fishing and aquaculture 137 063 38 764 98 299 37 436 1 328 0 0
B05-B09 - Mining and quarrying 650 693 62 918 587 775 3 833 25 951 17 554 15 580
C10-C12 - food products, beverages and tobacco products 8 134 186 6 201 362 1 932 825 5 720 182 488 982 0 -7 802
SumNL - Total products 60 410 088 29 040 997 31 369 091 19 371 655 4 005 542 5 497 304 166 496
Off - Public consumption 916 232 916 232 0 0 916 232 0 0
HIO - Non-Profits 22 181 22 181 0 0 22 181 0 0
PK - Private Consumption 11 041 093 11 041 093 0 11 041 093 0 0 0
SumFD - Total final demand 11 979 506 11 979 506 0 11 041 093 938 413 0 0
Totalt - Total 72 389 594 41 020 503 31 369 091 30 412 748 4 943 955 5 497 304 166 496
7. 45,000,000
40,000,000
35,000,000
30,000,000
25,000,000
20,000,000
15,000,000
10,000,000
5,000,000
0
45,000,000
40,000,000
35,000,000
30,000,000
25,000,000
20,000,000
15,000,000
10,000,000
5,000,000
0
1993
1994
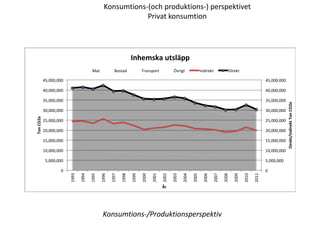
Konsumtions-(och produktions-) perspektivet
Privat konsumtion
Mat Bostad Transport Övrigt Indirekt Direkt
1995
1996
1997
1998
Inhemska utsläpp
1999
2000
2001
2002
2003
2004
2005
2006
2007
2008
2009
2010
2011
Direkt/Indirekt Ton CO2e
Ton CO2e
År
Konsumtions-/Produktionsperspektiv
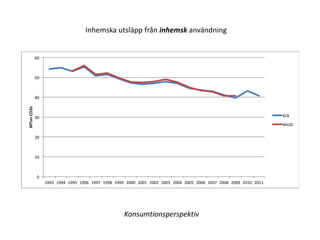
8. 60
50
40
30
20
10
0
1993 1994 1995 1996 1997 1998 1999 2000 2001 2002 2003 2004 2005 2006 2007 2008 2009 2010 2011
MTon CO2e
SCB
WIOD
Inhemska utsläpp från inhemsk användning
Konsumtionsperspektiv
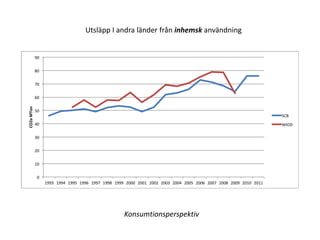
9. Utsläpp I andra länder från inhemsk användning
90
80
70
60
50
40
30
20
10
0
1993 1994 1995 1996 1997 1998 1999 2000 2001 2002 2003 2004 2005 2006 2007 2008 2009 2010 2011
CO2e MTon
SCB
WIOD
Konsumtionsperspektiv