How to create a radial tab polygon chart in Tableau. A presentation for VizConnect. Supplemental workbook can be downloaded here (https://public.tableau.com/views/HowtoCreateaRadialTabPolygonChart-VizConnectPresentation/VitruvianMan?:display_count=y&:origin=viz_share_link) to follow along.
Presentation at Transportation Techies, August 20, 2015, at Walk Hack Night on the work of the Kaiser Permanente Center for Total Health to install and analyze data from multiple population sensors, including ones using infrared and computed video technology.
Population sensors have great promise to promote physical activity compared to wearable devices, which can be expensive, impact privacy, and have low uptake and use.
A New Information Architecture for NHS.UK - UX Scotland 2018Sophie Dennis
Described as the most important transformation challenge in the public sector today the NHS website, nhs.uk, is one of the UK’s largest, most important websites, with over 50 million visits a month, tens of thousands of pages, and a target audience that is, quite literally, everyone.
What will it take for the NHS website to become people’s preferred first port of call to understand, manage and take control of their health? Among other things, a new information architecture focused on how patients understand their health, not a clinical view of conditions, or a publishers view of content formats. One that, done right, should provide a solid platform for all patient-facing digital health services for the next decade.
This slide deck from a presentation at UX Scotland 2018 covers our insights from starting to tackle this massive, multi-year challenge. It introduces the new information seeking modes/personas we developed to describe how people really look for information about their health, the new navigation patterns we've introduced, and why some traditional IA approaches present particular dangers when applied to health information.
Adjusting primitives for graph : SHORT REPORT / NOTESSubhajit Sahu
Graph algorithms, like PageRank Compressed Sparse Row (CSR) is an adjacency-list based graph representation that is
Multiply with different modes (map)
1. Performance of sequential execution based vs OpenMP based vector multiply.
2. Comparing various launch configs for CUDA based vector multiply.
Sum with different storage types (reduce)
1. Performance of vector element sum using float vs bfloat16 as the storage type.
Sum with different modes (reduce)
1. Performance of sequential execution based vs OpenMP based vector element sum.
2. Performance of memcpy vs in-place based CUDA based vector element sum.
3. Comparing various launch configs for CUDA based vector element sum (memcpy).
4. Comparing various launch configs for CUDA based vector element sum (in-place).
Sum with in-place strategies of CUDA mode (reduce)
1. Comparing various launch configs for CUDA based vector element sum (in-place).
Chatty Kathy - UNC Bootcamp Final Project Presentation - Final Version - 5.23...John Andrews
SlideShare Description for "Chatty Kathy - UNC Bootcamp Final Project Presentation"
Title: Chatty Kathy: Enhancing Physical Activity Among Older Adults
Description:
Discover how Chatty Kathy, an innovative project developed at the UNC Bootcamp, aims to tackle the challenge of low physical activity among older adults. Our AI-driven solution uses peer interaction to boost and sustain exercise levels, significantly improving health outcomes. This presentation covers our problem statement, the rationale behind Chatty Kathy, synthetic data and persona creation, model performance metrics, a visual demonstration of the project, and potential future developments. Join us for an insightful Q&A session to explore the potential of this groundbreaking project.
Project Team: Jay Requarth, Jana Avery, John Andrews, Dr. Dick Davis II, Nee Buntoum, Nam Yeongjin & Mat Nicholas
Explore our comprehensive data analysis project presentation on predicting product ad campaign performance. Learn how data-driven insights can optimize your marketing strategies and enhance campaign effectiveness. Perfect for professionals and students looking to understand the power of data analysis in advertising. for more details visit: https://bostoninstituteofanalytics.org/data-science-and-artificial-intelligence/
Opendatabay - Open Data Marketplace.pptxOpendatabay
Opendatabay.com unlocks the power of data for everyone. Open Data Marketplace fosters a collaborative hub for data enthusiasts to explore, share, and contribute to a vast collection of datasets.
First ever open hub for data enthusiasts to collaborate and innovate. A platform to explore, share, and contribute to a vast collection of datasets. Through robust quality control and innovative technologies like blockchain verification, opendatabay ensures the authenticity and reliability of datasets, empowering users to make data-driven decisions with confidence. Leverage cutting-edge AI technologies to enhance the data exploration, analysis, and discovery experience.
From intelligent search and recommendations to automated data productisation and quotation, Opendatabay AI-driven features streamline the data workflow. Finding the data you need shouldn't be a complex. Opendatabay simplifies the data acquisition process with an intuitive interface and robust search tools. Effortlessly explore, discover, and access the data you need, allowing you to focus on extracting valuable insights. Opendatabay breaks new ground with a dedicated, AI-generated, synthetic datasets.
Leverage these privacy-preserving datasets for training and testing AI models without compromising sensitive information. Opendatabay prioritizes transparency by providing detailed metadata, provenance information, and usage guidelines for each dataset, ensuring users have a comprehensive understanding of the data they're working with. By leveraging a powerful combination of distributed ledger technology and rigorous third-party audits Opendatabay ensures the authenticity and reliability of every dataset. Security is at the core of Opendatabay. Marketplace implements stringent security measures, including encryption, access controls, and regular vulnerability assessments, to safeguard your data and protect your privacy.
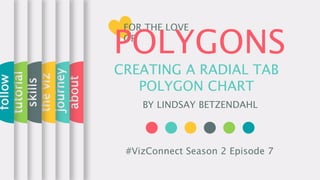
For the Love of Polygons: Creating a Radial Tab Polygon Chart
1. CREATING A RADIAL TAB
POLYGON CHART
BY LINDSAY BETZENDAHL
about
journey
theviz
skills
tutorial
follow
#VizConnect Season 2 Episode 7
FOR THE LOVE
OF
POLYGONS
5. about
journey
theviz
skills
tutorial
follow
01 02 03
THE DATA
PROSTATE
CANCERIncidence and
mortality rates by
state for multiple
years
THE IDEA
VITRUVIAN MAN
A drawing by
Leonardo DaVinci
representing the ideal
human body
proportions
THE VIZ
JUXTAPOSITION
Combining info
about surgery side-
effects, rates, and
shame with the
perfection of art
6. about
journey
theviz
skills
tutorial
follow
DUPLICATING 4x
In order to calculate
all four points of each
polygon
DENSIFICATION
RADIALS
Using trig to calculate
the points along
radials from a center
point
TRIGANOMETRY
X and Y
Plotting the
coordinates and
setting the dimension
detail
COORDINATES
7. about
journey
theviz
skills
tutorial
follow
Duplicate your
dataBring in your sheet 4 times into
the data source pane. Tableau
will create a field called ”Table
Name”.
Path Order
FieldUsing Table Name, we will
create a calc to identify each of
the four points – one data set
per point.
Parameter
FieldsUsing polygons means we can
have a lot of flexibility over our
viz. Create 3 parameters to
allow for adjustments.
Building the
VizX to rows, Y to columns,
dimension to detail, mark to
polygon, table name on path,
change X/Y compute using the
dimension.
Customizin
gAdjust the inner and outer
radius and the spacing
between the “tabs” by using the
3 parameters.
Coordinate
CalcsSeven calcs are needed here to
build the radial points: index,
angle, degrees, radians, radius,
X and Y.