A STUDY ON
FOREIGNEXCHANGE RISK MANAGEMENT
AT
SUNSHARE INVESTMENTS PVT LTD
6.
TABLE OF CONTENTS
CHAPTERNO CHAPTERS
PAGE
NO
ABSTRACT
LIST OF TABLES
LIST OF FIGURES
I 1.1 INTRODUCTION 1
1.2 COMPANY PROFILE 7
1.3 INDUSTRY PROFILE 15
1.4 NEED FOR THE STUDY 18
1.5 SCOPE OF THE STUDY 18
1.6 OBJECTIVES 19
1.7 LIMITATIONS 19
II REVIEW OF LITERATURE 20
III RESEARCH METHODOLOGY 35
3.1 RESEARCH DESIGN 35
3.2 SAMPLE SIZE 35
3.3 DATA SOURCES 35
3.4 SAMPLING 36
3.5 CONVENIENCE SAMPLING 36
3.6 SAMPLE FRAME 36
3.7 SAMPLE DESIGN 36
3.8 ANALYTICAL TOOLS 36
IV
DATA ANALYSIS AND INTERPRETATION
38
V 5.1 FINDINGS 60
5.2 SUGGESTIONS 61
5.3 CONCLUSION 62
ANNEXURE
BIBILIOGRAPHY 63
QUESTIONNAIRE 64
7.
ABSTRACT
Foreign currency exchangerisk is the additional riskiness or variance of a firm’s cash
flows that may be attributed to currency fluctuations. Normally, foreign currency risk exists
in three forms; translation, transaction and economic exposures. Foreign currency risk
management involves taking decisions which aim at minimizing or eliminating the negative
effects of currency fluctuations on balance sheet and income statement values, a firm's
receipts and payments arising out of current transactions, and on long term future cash flows
of a firm.
Sunshare Investments Pvt Ltd came into existence at the very start of Commodity
Exchanges in India. With nationwide presence, it enables the retail & corporate investors to
diversify their portfolio and enjoy the benefits of commodity trading in MCX, NCDEX, and
NSEL. Our highly appreciated research team guides the investors to make wise investment
decisions for Bullion, Base-Metals, Energy and agro-commodity. This project provides a
number of recommendations and best practices to help them develop a plan to manage the
foreign exchange risk the company faces.
The major objective of this study is to assess the foreign risk management with regard to
Sunshare Investments Pvt Ltd in Chennai. Convenience sampling method has used in the
research work. Multiple choice questions have been chosen to collect the responses from 123
respondents. The data collected has been analyzed through various statistical tools like Karl
Pearson’s Correlation, Chi- square test and One-way Anova test. Numerous new findings has
been derived from this research has helped to provide few suggestions to improve the foreign
exchange risk management at Sunshare Investments Pvt Ltd in Chennai.
8.
TABL
E NO.
TITLE
PAGE
NO
1 SOURCEOF FOREIGN CURRENCY 38
2 EXPOSURE OF FOREIGN CURRENCY PER ANNUM
39
3 RISK IN FOREIGN CURRENCY
40
4 IF YES LEVEL OF PERCEPTION OF RISK 41
5 LOSS ON FOREIGN CURRENCY EXCHANGE 42
6 HOW OFTEN FIRM MANAGE TRANSACTION EXPOSURE
43
7
METHODS USE TO FORECAST FIRM’S LIKELY FUTURE FOREIGN
EXCHANGE EXPOSURES 44
8 HOW OFTEN FIRM MANAGE ECONOMIC EXPOSURE 45
9
THE MAJOR TYPES OF EXPOSURE IDENTIFIED BY FIRM
46
10 FIRM’S POLICY ON TRANSACTION EXPOSURE
47
11 FIRM’S POLICY ON ECONOMIC EXPOSURE 48
12
LEVEL OF PERCENTAGE THE FIRM’S TRANSACTION EXPOSURE IS
COVERED 49
13 LEVEL OF FIRM’S ECONOMIC EXPOSURE IS COVERED 50
14
FACTORS TYPICALLY DRIVING FIRM’S FOREIGN EXCHANGE
EXPOSURE MANAGEMENT 51
15
THE MAJOR OBJECTIVE OF FIRM’S FOREIGN EXCHANGE EXPOSURE
MANAGEMENT
52
16
FREQUENTLY REVISE FIRM’S FOREIGN EXCHANGE RISK
MANAGEMENT POLICY 53
17
THE PRIMARY SOURCE OF FIRM’S FOREIGN EXCHANGE RATE
FORECAST 54
18 MANAGE THE RISK IN FOREIGN CURRENCY EXCHANGE 55
19
FACTORS DETERMINES TO GIVE IMPORTANT IN SELECTING A
TECHNIQUE 56
20 MENTION IN PERCENTAGE (%) OF USAGE OF TECHNIQUES 57
9.
LIST OF TABLES
LISTOF FIGURES
TABLE
NO.
TITLE
PAG
E NO
1 SOURCE OF FOREIGN CURRENCY 38
2 EXPOSURE OF FOREIGN CURRENCY PER ANNUM 39
3 RISK IN FOREIGN CURRENCY
40
4 IF YES LEVEL OF PERCEPTION OF RISK 41
5 LOSS ON FOREIGN CURRENCY EXCHANGE 42
6 HOW OFTEN FIRM MANAGE TRANSACTION EXPOSURE
43
7
METHODS USE TO FORECAST FIRM’S LIKELY FUTURE FOREIGN
EXCHANGE EXPOSURES 44
8 HOW OFTEN FIRM MANAGE ECONOMIC EXPOSURE 45
9 THE MAJOR TYPES OF EXPOSURE IDENTIFIED BY FIRM
46
10 FIRM’S POLICY ON TRANSACTION EXPOSURE
47
11 FIRM’S POLICY ON ECONOMIC EXPOSURE 48
12
LEVEL OF PERCENTAGE THE FIRM’S TRANSACTION EXPOSURE IS
COVERED 49
13 LEVEL OF FIRM’S ECONOMIC EXPOSURE IS COVERED 50
14
FACTORS TYPICALLY DRIVING FIRM’S FOREIGN EXCHANGE EXPOSURE
MANAGEMENT 51
15
THE MAJOR OBJECTIVE OF FIRM’S FOREIGN EXCHANGE EXPOSURE
MANAGEMENT
52
16
FREQUENTLY REVISE FIRM’S FOREIGN EXCHANGE RISK MANAGEMENT
POLICY 53
17 THE PRIMARY SOURCE OF FIRM’S FOREIGN EXCHANGE RATE FORECAST 54
10.
18 MANAGE THERISK IN FOREIGN CURRENCY EXCHANGE 55
19
FACTORS DETERMINES TO GIVE IMPORTANT IN SELECTING A
TECHNIQUE 56
20 MENTION IN PERCENTAGE (%) OF USAGE OF TECHNIQUES 57
11.
1
CHAPTER 1
1.1 INTRODUCTION
Sincemid-1970's fixed foreign currency exchange regimes have been disbanded in many
countries. Countries with diverse economic and financial structures have adopted market -
determined foreign exchange rate systems. In an environment of floating foreign exchange
rates, unimpeded capital flow is envisaged. During the era of fixed foreign exchange regimes,
firms faced little exchange risk as exchange rates were determined by some central authority
and moved within very narrow bands. Liberalized currency markets have changed that; firms
now are exposed to exchange risks arising from exchange rate fluctuations. At time it has
seemed too much business that they have been helpless in the fight to control the associated
risks, which arise when exporting, profitability, competitiveness and the ability to service
debt can all be impacted by foreign exchange volatility when paying or receiving foreign
currency. All business trading overseas will have some exposure to exchange rate movements
either directly or indirectly. Whilst exposure to exchange rate movements may be an
inevitable part of everyday activity, the risk arising from such exposure can be controlled.
While the currency volatility can’t be controlled, you can take steps to protect the business
throughout the year.
Foreign exchange risk management
Foreign currency exchange risk is the additional riskiness or variance of a firm’s cash flows
that may be attributed to currency fluctuations (Giddy, 1977, Brigham and Ehrhardt, 2005).
Normally, foreign currency risk exists in three forms: translation, transaction and economic
exposures.
Foreign currency risk management involves taking decisions which aim at minimizing or
eliminating the negative effects of currency fluctuations on balance sheet and income
statement values, a firm's receipts and payments arising out of current transactions, and on
long term future cash flows of a firm.
12.
2
Herewith are somedata collected with respect to Foreign Exchange.
● The below picture gives an idea of the foreign exchange reserves used worldwide.
● The below picture shows the effect of USD on currencies.
13.
3
● The belowpicture shows the effect of Foreign Exchange regional wise
Early research in this area focused on determining if the companies’ value is influenced by
foreign exchange rate fluctuations. Being one of the first, Jorion (1990) examined the
relationship between stock returns and exchange rates, by performing an empirical analysis
among US multinational companies. He presented evidence showing that the relationship
between stock returns (value) and exchange rates differs systematically across multinational
companies. The degree of foreign exchange rate exposure on firm value was found to be
positively related to the percentage of foreign involvement. More specifically; the empirical
evidence suggests that exchange rate fluctuations do affect firm value. Research by
Bodnar & Gentry (1993) and Choi & Prasad (1995) also supports this.
In a study conducted by Shin and Soenen (1998), they investigated whether US
multinational corporations are exposed to foreign exchange risk or not. They also
investigated whether there is difference in the foreign exchange rate exposure for large
and small firms, and if industry characteristics are a significant determinant. According
to their results, there is empirical evidence that the value of US multinational firms is
significantly correlated with contemporaneous changes in the value of the US dollar. The
foreign exchange exposure was stable over the sample period from 1983 to 1994. Another
interesting finding is the fact that small firms especially have a positive significant foreign
14.
4
exchange rate exposure.This is supportive of the view that hedging is more common in large
firms, despite the good availability of hedging instruments. They also found that the foreign
exchange rate exposure is largely attributable to a few industries (e.g. electrical equipment
and primary metal).
Some research has also been executed to find out if the firms are aware of their currency
risk. In a study published in the Journal of Empirical Finance by Loderer and Pichler (2000),
they explored the currency risk management practices among Swiss industrial companies by
distributing a survey. The purpose of their study was to examine whether industrial firms
quantify their risk profile and to what extent they hedge against currency fluctuations. Their
main conclusion is that the companies have very little active evaluation of the foreign
exchange rate exposure. Generally, they find that the firms fail to properly understand why
currency risk reduces firm value and some even manage risk even when it is unnecessary.
Adler and Dumas (1985) demonstrate how to measure the economic exposure of firms‟
market prices to exchange-rate changes. They argue that the exposure may be captured by
the regression coefficient when an asset’s price is regressed on exchange rates. Also, Jorion
(1990) and Allayannis and Ofek (1998) estimate the exchange-rate exposure from a
regression model that includes market returns and exchange-rate returns to explain the
variability of firms stock returns. Existing literatures mostly use similar methodology to
‟
measure firms exchange-rate exposures (e.g., Bodnar and Gentry (1993), He and Ng (1998),
‟
Bodnar, Dumas and Marston (2002), Kolari, Moorman and Sorescu (2008), and Aggarwal
and Harper (2010)). We also use the method suggested by Allayannis and Ofek (1998) along
with the Fama-MacBeth regression to measure firms‟ stock return sensitivity to
exchange-rate return.
Allayannis, Brown, and Klapper (2003) examine a firm’s choice between local and foreign
currency debt using a data set of East Asian firms surrounding 1998 financial crisis.
They find that the interest rate differentials between local currency and foreign currency are
important determinants for debt use.
Exchange rate risk management is an integral part in every firm’s decisions about
foreign
currency exposure (Allayannis, Ihrig, and Weston, 2001). Currency risk hedging strategies
entail eliminating or reducing this risk, and require understanding of both the ways that the
exchange rate risk could affect the operations of economic agents and techniques to deal with
15.
5
the consequent riskimplications (Barton, Shenkir, and Walker, 2002). The need for currency
risk management started to arise after the break down of the Bretton Woods system and the
end of the U.S. dollar peg to gold.
“Exchange rate exposure puzzle” (Bartram and Bodnar, 2007). Their paper is the first to
examine the relationship between exchange rate and stock return fluctuations. For the period
around the breakdown of the Bretton Woods regime in 1973, they find a significant positive
relationship between exchange rate variability and stock return volatility as well as market
risk for U.S. multinational firms. This result is also documented for the Asian financial crisis.
since 1997 by Chen and So (2002). Verschoor and Muller (2007) confirm the evidence for
this event. However, they extend the methodology by directly controlling movements in
exchange rates following the “traditional approach” proposed by Jorion (1990, 1991). In a
follow-up study, the authors more comprehensively confirm the main theoretical concept on
which this type of study is based by considering several major financial crises in the last
decade (Muller and Verschoor, 2009). Bartram and Karolyi (2006) focus on the impact of the
introduction of the Euro for a large international sample of non-financial firms.
Foreign Exchange Risk Management (FERM) and Financial Performance
Firms should identify and quantify their exposure to currency risk, which is a basis for a
suitable currency risk management strategy (Shapiro, 2003). According to Brain (2000) there
is a variety of currency risk management strategies namely currency risk transfer, currency
risk reduction and control or currency risk retention. The financial performance of export
ventures can be examined based on profitability and sales growth (Lages&Mantgomery,
2004, Eatwell, 1971). Allayannis (2001), revealed a relationship between FERM and
financial performance by noting that exporting firms that carry out Foreign Exchange Risk
management have been attaining higher returns than other firms.
16.
6
Risk Management
According tointernational standards organization (ISO) 31000 risks is defined as the
uncertainty on objectives whether positive or negative. Risk management is considered as the
identification, assessment and prioritization of risks followed by a coordinated and
economical application of resources to minimize monitor and control the probability and
impact of unfortunate events.
Risk Management Model
17.
7
According to JohnAlzak (2007) risk management is the identifying of risks, assessing the
impact on the business of a security incident that occurs and making the right financial
decision about how to deal with the result of the assessment. Risk management is an ongoing
process which involves several stages.
1.2. COMPANY PROFILE
Sun share investments are one of growing financial institutions, offering complete financial
solutions that encompass every sphere of life. From stock broking to mutual funds, to life
insurance, to investment banking, the group caters to the financial needs of individuals and
corporates. The group has employs around 50 employees across its various businesses,
servicing around 340 customer accounts through a distribution network of 2 branches. Their 5
years of existence offering investment products across asset classes with varying risk
18.
8
parameters that caterto needs of various customer segments, have enabled us to garner trust
of over 340 investors.
SUNSHARE is committed to provide its customer with best innovative stock trading system
at the affordable price, they believe in quality service, accuracy of their software for their
Successful trading in the present competitive market.
They strongly believe in applying Knowledge of technical analysis with use of technology.
Drives them to unlimited success 90% of the traders strongly follow their instincts and lose
their harden money giving their Money to someone.
Tracking your Portfolio: -
Just investing money is not enough, you have to monitor your portfolio to ensure you money
works as hard as you to build a robust financial portfolio. You can use our portfolio tracker
to monitor your entire financial portfolio, which encompasses various asset classes. You can
also make a watchlist of stocks and enrol for SMS alerts, which will help you track the
markets closer to make a timely investment decision.
Transparency: -
We empower you to take the right decisions and handle your own portfolio. Backed by our
trusted pedigree, it is our constant endeavour to provide services in a transparent manner. We
believe in offering high quality investment services in a cost-effective manner to achieve your
financial goals.
VISION:
Their vision is to be a responsible player in the Indian mutual fund space. The company strive
hard to deliver consistent performance over the benchmark across all their products, thereby
creating customer satisfaction.
CODE OF CONDUCT
◻ Will act fairly with all stakeholders.
◻ Comply with all applicable laws, rules and regulations.
19.
9
◻ Act ingood faith, responsibly, with due care, competence and diligence, without
allowing their independent judgment to be subordinated.
◻ Not use company’s property, or position for personal gain.
◻ Disclose potential conflicts of interest that they may have regarding any matters that
may come before the board and abstain from discussion and voting on any matter in
which the director has or may have a conflict of interest.
◻ Respect the confidentiality of information relating to the affairs of the company
acquired in the course of their service as directors, senior management personnel
except when authorized or legally required to disclose such information.
◻ Not use confidential information acquired in the course of their service as directors,
senior management personnel for their personal advantage or in their role as directors
or any other role in any other company outside the group.
◻ Help create and maintain a culture of high ethical standards and commitment to
compliance.
VIOLATIONS OF THE CODE
The Company will take appropriate action against any Director or Senior Management Personnel
whose actions are found to violate the Code or any other policy of the Company. Where the
Company has suffered a loss, it may pursue its remedies against the individuals or entities
responsible. Where laws have been violated, the Company will cooperate fully with the
appropriate authorities.
CORPORATE PHILOSOPHY:
We have always believed that your success is our success. It's the only truth of every
business. And we have built our foundation around this philosophy. Every endeavor at
SUNSHARE is to ensure success - success of its clients, employees, partners, investors and
of society at large. And we have been doing this since 2008
We consider ourselves as a Services & Solutions company and not a financial product disseminator.
We understand that needs differ, and hence, no one size fits all. Our ultimate
20.
10
aim is todelight the people, whose lives we touch and every fraction of our existence works
towards achieving this, every single second.
CORPORATE STRUTURE
PRODUCTS AND SERVICES:
1. Online share trading
2. Real Estate Advisor
3. Asset Management
4. Insurance
5. Wealth Management
6. Investment Banking
7. National Products Distribution
PRODUCTS:
ONLINE SHARE TRADING:
The online trading website provides the customers a seamless internet trading experience
through its various useful features such as streaming stock quotes, online payment gateways,
portfolio tracker, extensive research reports, online IPO, live market news & real time market
statistics. The customers can find all their relevant account and trading details online and
make a more informed decision for profitable trading.
21.
11
Tips to Investors
PickingStocks
Picking stocks is all about finding opportunities. This is where most inexperienced traders fail
because they go and look for stocks of well-known companies that they think they should
trade. The reality is that big name stocks like Apple or Google or IBM offer very little
opportunity to the individual trader (although it could under certain circumstances). A good
opportunity is a stock that has big potential for growth. Often these are companies in whole
new industries – companies that you’ve never even heard of before.
Knowing When To Buy
Once you’ve found a good stock pick, you need to know when to enter the trade. It’s simple:
you need to buy the share at the lowest possible price to maximize your profit. If you enter
the trade too soon you might pay too much. If you enter the trade too late it might be too
expensive. Great traders are very skilled at reading stock signals and evaluating when to buy
a stock.
Knowing When to Sell
Knowing when to sell is probably the most important part of being successful at trading
shares online. If you sell too soon you will miss out on potential profits. If you sell too late
you might lose money. One of the biggest mistakes I see novice traders make is that they hold
on to a stock “hoping” that it will go back up so they can recoup their losses. Not only does
this lock up your trading capital but it is sure to give you some sleepless nights. With the
advent of so-called “artificial intelligence” trading software, this process has been automated
to a large extent. To make informed decisions on whether a stock is a good opportunity and
deciding when to buy and when to sell requires a lot of research and interpreting a lot of
graphs and data.
Artificial intelligence software like Stock Assault can interpret a lot of data for you and make
a much more informed decision that you will ever be able to make through “manual” work.
Off course you cannot afford to hand over your money to a trading robot, but it sure does give
you a big helping hand in making good trading decisions.
MUTUAL FUND:
Investment in mutual funds offers the following advantages: -
22.
12
◻ Diversification ofportfolio: Since mutual funds invest in a bouquet of instruments,
they offer an effective means of diversification for the investor.
◻ Professional management: Mutual funds are an excellent means of investment for
people who do not have the time or the expertise to study the markets in depth before
making investment decisions. The funds are generally managed by well-qualified
fund managers, and it is always prudent to check the fund manager’s background
before investing in a fund.
◻ Low cost: A mutual fund unit is much less expensive than the individual stocks in
which the fund has invested. Thus, with a given amount of money, an investor can
buy more number of units of mutual funds than individual stocks.
◻ Tax Benefits: Investment in mutual funds offers several tax benefits. For example,
dividends received through mutual funds are exempt from tax, while investment in
certain types of mutual funds is deductible from the taxable income to reduce the tax
liability. Thus, mutual funds can be used as effective tools fortax planning.
COMMODITY
SUNSHARE Commotrade equips you with reliable research, based on a technical and
fundamental study of all major commodities. It also continuously works towards
recommending various trading strategies which you can use to enhance your commodities
trading experience.
When you choose to trade through SUNSHARE Commotrade, you not only receive
personalized service but enjoy the benefit of a delivery mechanism made easy! SUNSHARE
Commotrade is your veritable guide and gateway into the world of commodities trading.
Commodities' trading offers the following benefits: -
◻ Diversification of portfolio: Commodity trading offers a means for diversification of
portfolio for the investors, by offering exposure to an asset class different from stock
markets instruments such as equities, mutual funds and bonds.
◻ Predictability: Commodities pricing is largely based on the demand and supply
fundamentals for the commodity, and hence, becomes relatively easier to predict.
23.
13
◻ Leverage: Tradingin commodities futures involves use of leverage through margin
which is maintained with the broker. Hence, large transactions can be executed with
lesser amount of cash in hand.
◻ Liquidity: Futures contracts in commonly traded commodities such as gold, silver,
crude oil and grains offer a high level of liquidity in the market.
DERIVATIVES:
Derivatives have traditionally been used by businesses to hedge against different types of risks
and have been in existence for decades. With well-planned strategies based on a thorough
study of the markets, individual investors and traders can earn handsome returns through
derivatives trading.
Investment in derivatives has the following advantages: -
◻ Hedging against risk: Derivatives are used for hedging against risk in price
fluctuations of the underlying asset. Since the buy (or sell) price at delivery is
specified in advance, the buyer/seller can protect his investment from deviation in
price trend.
◻ Lower costs: The investor needs to pay only for the contract, which is usually much
less than the price of the underlying asset, thus offering a benefit of lower costs.
◻ Leverage: Trading in derivatives involves use of leverage through margin that is
maintained with the broker. Hence, less cash is required to be paid at the time of trade.
SERVICES:
FINANCIAL PLANNING:
Financial Planning is the process of planning a person's investments and assets to enable the person
to attain his or her financial goals, keeping in mind the risk profile of the person.
24.
14
WEALTH MANAGEMENT
SUNSHARE helpsyou to systematically plan and execute financial strategies based on an
in-depth understanding of your needs, your appetite for risk and the products that are
available in the market.
We follow a three-step process for managing your wealth.
Step 1 - Understanding your needs and goals
Different individuals have diverse needs and goals in life. The practice of wealth
management tries to ensure that your finances support these goals at every stage of your life.
So, our first step to developing your customized investment portfolio is analyzing your needs
and goals.
Step 2 - Executing investments
While channeling your finances towards achieving your goals, we take into account aspects
like your cash flow requirements and your risk appetite. A right balance is struck between
investing in liquid assets and in medium- and long-term investments. We suggest investment
across various asset classes such as stocks (equities), mutual funds, debt assets etc. in varying
proportions, depending on your profile. This helps in optimizing returns and ensuring risk
mitigation through a diversified portfolio.
Step 3 - Reviewing portfolio at regular intervals
With constant changes in the business and economic environment it is important to review
the portfolio from time to time and make necessary alterations whenever necessary. This
helps in aligning the portfolio to the investment objective.
INVESTMENT BANKING:
SUNSHARE focuses on middle market entrepreneurs and provides them with a complete
range of solutions from strategic advisory services to capital raising, to assist them in
implementing their growth plans. We aim to spend adequate time with the entrepreneurs and
25.
15
their team tounderstand their motivations, businesses and strategy. SUNSHARE believes in a
strong, relationship driven, long term approach with all its clients, as corporates need time to
execute their business plans and it is imperative that in turbulent times the banker becomes a
trusted advisor and remains with them through the various phases of the business cycles and
is able to advise them on the best strategies at each appropriate stage in their growth cycle.
To enable us to do this, we have put together an experienced team of professionals who come
with very strong relationships across the regulatory and investor space and also have a deep
understanding of the issues facing the mid market corporates in these times, as they aim to
become the large caps of tomorrow. We have strong relationships across the spectrum of
investors ranging from marquee private equity funds, mutual funds, overseas institutional
investors, hedge funds, very high net worth investors as well as bankers.
INSURANCE:
Services And Value Proposition
Being an insurance broker, we cater to all the insurance needs of our clients and provide
technical expertise and value enhancement to our clients. Our list of services includes:
□ Life and non-life insurance:
□ Risk management:
□ Claim settlement:
□ Policy reviewing:
1.2 INDUSTRY PROFILE
26.
16
The integration ofthe domestic economy through the twin channels of trade and capital flows has
accelerated in the past two decades which in turn led to the Indian economy growing from
Rs 32 trillion (US$ 500 billion) in 2004 to about Rs 129.57 trillion (US$ 2.01 trillion) by
2015. Simultaneously, the per capita income also nearly trebled during these 11 years. India’s
trade and external sector had a significant impact on the GDP growth as well as expansion in
per capita income.
Recently, India overtook Italy, Germany and Bangladesh to emerge as the world's second largest
textile exporter, as per the data released by Apparel Export Promotion Council (AEPC).
According to The Cotton Textiles Export Promotion Council (Texprocil), India’s textile and
clothing exports stood at US$ 41.4 billion in 2015 as compared to US$ 39.3 billion in
2014, growing by 5.34 per cent over the previous year.
According to Ms Nirmala Sitharaman, Minister of State (Independent Charge), Ministry of
Commerce and Industry, the Government of India is keen to grow exports and provide more
jobs for the young, talented, well-educated and even semi-skilled and unskilled workforce of
India.
Capital Inflows
According to data released by the Reserve Bank of India (RBI), India's foreign exchange reserves
were US$ 354.40 billion in the week up to March 11, 2016, an increase of US$ 2.54 billion over
the past week.
Foreign Direct Investments (FDI)
During April 2000–December2015, India received total foreign investment (including equity
inflows, re-invested earnings and other capital) worth US$ 408.68 billion. The country was
one of the top destinations for FDI inflows from Asian countries, with Mauritius contributing
33.7 per cent, Singapore 15.53 per cent and the UK contributing 8.17 per cent of the total foreign
inflows.
Foreign Institutional Investors (FIIs)
FIIs net investments in Indian equities and debt touched record high in last financial year (2014-
15), on the back of factors such as expectations of recovering economy, falling interest rates
and improving earnings outlook. FIIs invested net US$ 43.5 billion in FY 2014-15 which
was their highest investment in any fiscal year so far. Of the total investment, US$
26.3 billion was invested in debt while the rest US$ 17.2 billion was invested in equities.
27.
17
External Sector
India hasexpressed interest in signing a preferential trade agreement with Iran once
international sanctions on the Persian Gulf nation are lifted which would make it India's first
trade agreement with a country in West Asia.
The Government of India plans to build five new railway links with Nepal, which will boost
India's economic links with its neighbouring country and promote growth, employment and
prosperity in the region.
The Union Cabinet has approved a proposal to provide US$ 150 million credit from Export
Import Bank of India (EXIM Bank) for the development of Chabahar Port in Iran.
India and China plan to undertake a joint study on the impact of regional trade agreements, to
be conducted by India’s NITI Aayog and China's Development Research Centre (DRC).
India and South Africa are considering prospect of setting up a joint venture (JV) for mining
and owning coal blocks in South Africa.
India and the United Arab Emirates (UAE) will set up a joint working group to forge stronger
linkages in the hydrocarbon, chemicals and fertiliser sectors.
India is looking to develop the Chabahar port project in Iran by signing an international
transit corridor agreement with Iran and Afghanistan.
India and Belarus set a trade target of US$ 1 billion by 2018 during the Seventh Session of
the India-Belarus Intergovernmental Commission on Trade, Economic, Scientific,
Technological and Cultural Cooperation.
Arab-India Economic Forum (AIEF), to be held in November 2015, would help open up new
opportunities for trade and commerce between India and the Middle East.
The US has restored its program for concessional duty treatment to Indian products, called
‘Generalised System of Preferences’, till 2017.
India and Japan are expected to sign a pact of cooperation in the field of intellectual property.
The pact will aim to enhance efforts to support innovation in both the countries and will be
renewed automatically every four years.
According to Mr Andrew Robb, Australia's Trade and Investment Minister, Australia's top
trade priority is to conclude the Comprehensive Economic Cooperation Agreement (CECA)
with India by 2015 which has major focus on services and investment.
At the fourth session of the bilateral Joint commission on Economic cooperation held in
Warsaw, India and Poland have set an ambitious target to increase bilateral trade from US$
2.3 billion in 2014 to US$ 5 billion by 2018. India was praised by several members of the
28.
18
World Trade Organisation(WTO) for following liberal and open macroeconomic policies
while increasing its global presence at the same time.
During the visit of Mr Vladimir Putin, President of Russia, to India, the two countries signed
several agreements, in areas spanning civil nuclear cooperation, defense and energy.
Foreign Trade Policy
All export and import-related activities are governed by the Foreign Trade Policy (FTP),
which is aimed at enhancing the country's exports and use trade expansion as an effective
instrument of economic growth and employment generation.
The Department of Commerce has announced increased support for export of various
products and included some additional items under the Merchandise Exports from India
Scheme (MEIS) in order to help exporters to overcome the challenges faced by them.
The Central Board of Excise and Customs (CBEC) has developed an 'integrated declaration'
process leading to the creation of a single window which will provide the importers and
exporters a single point interface for customs clearance of import and export goods.
As part of the FTP strategy of market expansion, India has signed a Comprehensive
Economic Partnership Agreement with South Korea which will provide enhanced market
access to Indian exports. These trade agreements are in line with India’s Look East Policy. To
upgrade export sector infrastructure, ‘Towns of Export Excellence’ and units located therein
will be granted additional focused support and incentives.
The Reserve Bank of India (RBI) has simplified the rules for credit to exporters, through
which they can now get long-term advance from banks for up to 10 years to service their
contracts. This measure will help exporters get into long-term contracts while aiding the
overall export performance.
The Government of India is expected to announce an interest subsidy scheme for exporters in
order to boost exports and explore new markets.
Road Ahead
India is presently known as one of the most important players in the global economic
landscape. Its trade policies, government reforms and inherent economic strengths have
attributed to its standing as one of the most sought after destinations for foreign investments
in the world. Also, technological and infrastructural developments being carried out
throughout the country augur well for the trade and economic sector in the years to come.
29.
19
Boosted by theforthcoming FTP, India's exports are expected to cross the US$ 350 billion
mark in the year 2015 and reach US$ 750 billion by 2018-2019 according to Federation of
India Export Organisation (FIEO). Also, with the Government of India striking important
deals with the governments of Japan, Australia and China, the external sector is increasing its
contribution to the economic development of the country and growth in the global markets.
Moreover, by implementing the FTP 2014-19, by 2020, India's share in world trade is
expected to double from the present level of three per cent.
1.3 NEED FOR THE STUDY
Sunshare Investments Pvt Ltd, Chennai is a trading company and a provider of foreign
exchange payment services to small-sized businesses and private clients. Share Trading
companies came into existence at the very start of Commodity Exchanges in India. With
nationwide presence, it enables the retail & corporate investors to diversify their portfolio and
enjoy the benefits of commodity trading in MCX, NCDEX, and NSEL. Our highly
appreciated research team guides the investors to make wise investment decisions for
Bullion, Base-Metals, Energy and agro-commodity. This project provides a number of
recommendations and best practices to help them develop a plan to manage the foreign
exchange risk the company faces.
1.4 SCOPE OF THE STUDY
◻ The scope of this study is to find the best risk management techniques for Sunshare
Investments Pvt Ltd
◻ This scope covers the importers and exporters, who are all having foreign currencies.
◻ This is done through the use of a survey(questionnaire) sent out to a sample consisting
of their clients.
◻ This study helps to identify the best techniques in order reduce the foreign exchange
risk. The suggestions given by the customers (respondents) as well as the
recommendations given by the researcher could help the company to improve their
services.
30.
20
1.5 OBJECTIVES
PRIMARY OBJECTIVES:
▪To assess and mitigate Foreign Exchange Risk Management and to minimize
potential currency losses – with respect to Sunshare Investments Pvt Ltd in
Chennai.
SECONDARY OBJECTIVES:
▪ To identify the exposure of the clients in foreign currency.
▪ To make an assessment of the level and variability of risks with respect to
foreign exchange.
▪ To identify the best technique to reduce the foreign exchange risk.
▪ To determine the various factors leading to selection of a technique.
1.6 LIMITATIONS OF THE STUDY:
• More time is required for collecting data from respondent because interviews were
held at the convenience of the informants.
• Accuracy of the data is subjected to the respondent’s statements and views. However,
an attempt is planned to get as much genuine information as possible.
• The non-availability of some respondents could have had its effect on the accuracy of
the data gathered.
• Even though the respondents were available they were not at all willing to respond.
• Unawareness of the respondents created errors, which is the major limitation.
• If risks are improperly assessed and prioritized, time can be wasted in dealing with
risk of losses that are not likely to occur. Spending too much time assessing and
managing unlikely risks can divert resources that could be used more profitably.
Unlikely events do occur, but if the risk is unlikely enough to occur, it may be better
to simply retain the risk, and deal with the result if the loss does in fact occur.
• Prioritizing too highly the Risk management processes itself could potentially keep an
organization from ever completing a project or even getting started. This is especially
true if other work is suspended until the risk management process is considered
complete.
31.
21
CHAPTER 2
REVIEW OFLITERATURE
Yazid and Muda (2006) examines the extent of foreign exchange risk management among
Malaysian multinationals and investigates the purpose of managing foreign exchange risks,
the types of risks managed and the extent of management control and documentation of the
foreign exchange risk management. The study which was based on response from 54 MNCs,
indicate that Malaysian multinationals are involved in foreign exchange risk management
primarily because they sought to minimize the losses on operational cash flows which are
affected by currency volatility. Another finding of the study is that the 25 majority of
multinationals centralized their risk management activities and at the same time imposed
greater control by frequent reporting on derivative activities.
Davies, Eckberg and Marshall (2006) examines foreign exchange hedging by Norwegian exporting
firms to provide empirical evidence on the determinants of the hedging decision. The paper
contributes to prior studies by, first, focusing on exporters to ensure that the companies in the
sample have foreign exchange exposure, thereby allowing a more rigorous test of the
theoretical determinants of hedging, and, secondly, in contrast to most previous studies that
have focused on foreign exchange external hedging instruments, the use of both internal and
external instruments is examined. The firm size, extent of internationalization and
liquidity--are found to be related to the decision to hedge foreign exchange risk. Unlike
empirical studies for other countries the evidence for Norwegian firms does not support the
hypothesis that the avoidance of financial distress and the need to resort to external capital
markets is a significant determinant of the hedging decision.
Salifu, Osei and Adjasi (2007) examined the foreign exchange exposure of listed companies on
the Ghana Stock Exchange over the period January 1999 to December 2004. The study was
based on the secondary data of 20 listed companies. The study found that, all the major
currencies of international transaction of the country are sources of foreign exchange risk to
listed firms on the GSE. The US dollar turned out to be the most dominant source of
exchange rate risk at both the firm and sector levels. Most firms had negative exposure
coefficients and this suggests that, the majority of the listed firms could 26 experience an
32.
22
adverse valuation effectwhen the local currency (cedi) depreciates substantially against other
foreign currencies and benefit when the cedi strengthens in value relative to these currencies.
About 55 per cent of firms in the sample have a statistically significant exposure to the US
dollar while 35 per cent are statistically exposed to the UK pound sterling. Sector specific
exposure results show that the manufacturing and retail sectors are significantly exposed to
the US dollar exchange rate risk. The financial sector did not show any risk exposure to any
of the international currencies.
Faseruk and Mishra (2008) examine the impact of US dollar exchange rate risk on the value
of Canadian non-financial firms. The sample includes all nonfinancial Canadian firms with
sales over $100 million. The study segregates firms into hedging and non-hedging groups and
applies statistical techniques to test if hedging enhances value. A total of 194 firms were
selected for the study which was carried on the basis of secondary data in the form of annual
reports. The paper has two major contributions. First, this is the first study that examines the
US dollar risk management by Canadian firms. Second, it documents that it is important to
hedge US dollar risk for the firms that have US exports. Firms are 27 better off by
implementing both operational and financial hedging of US dollar risk. As expected,
Canadian firms that have higher levels of US sales tend to use derivatives more often and
tend to have higher levels of US$ exposure. However, firms with both US sales and US assets
tend not to use financial hedging as often. The US assets provide some sort of natural
operational hedging for US sales of Canadian firms.
Yazid, Hussain and Razai (2008) reports that majority of Malaysian manufacturers (55%) are
not involved in management of foreign exchange exposure. The study shows that
considerable number of manufacturers totaling to 46% are not involved in managing currency
exposure due to insignificant exposure. On analysis of annual reports of the respondents, it
was found that total of 20% of manufacturers who were not involved in hedging the risk by
using derivative products used natural hedge by borrowing in foreign currency. This study
which was based on annual reports of the companies shows that manufacturers with large
asset base and more employees are more likely to involve in currency exposure management.
Majority of respondents who are managing the currency exposure are making use of Forward
contract as it is simple and easy to understand. They use foreign currency derivatives only for
hedging purpose.
33.
23
Al-Momani and Gharaibeh(2009) studied the foreign exchange risk management practices of
Jordanian firms. The results of the study indicate that the use of foreign exchange risk
management techniques such as financial derivatives is not a common practice by Jordanian
firms. The most common methods used by Jordanian firms to manage foreign exchange risks
are matching, netting, using local currency, and price policy. In addition, this study 28
concludes that there are no relationships between firm size and legal structure and the
management practices toward transaction exposure. Gonzalez, Bua, Lopez and Santomil
(2010) analyzes the factors that determine the use of foreign currency debt to manage
currency exposure for a sample of 96 Spanish non-financial companies. Study found that on
one hand the decision to hedge with foreign debt is positively related to the level of foreign
currency exposure, size. On the other hand, the extent of hedging is related positively to the
foreign currency exposure, size, managerial risk aversion and negatively to the costs of
financial distress.
Aabo, Hog and Kuhn (2010) applies an integrated foreign exchange risk management
approach with a particular focus on the role of import in mediumsized manufacturing firms in
Denmark Study found that a strong, negative relation between import and the use of foreign
exchange derivatives on the aggregate level. Their findings are consistent with the notion that
firms use import to match the foreign exchange exposure created by foreign sales activities.
Kang and Lee (2011) conducted an empirical analysis of the exchange rate exposure of 392
Korean firms by employing not only changes in the exchange rate but also the standard
deviation of exchange rate. The empirical results in the case of using the standard deviation
of exchange rates suggest that: the number of firms showing significant exchange rate
exposure has been relatively increasing; exchange rate exposure is more likely for
export-oriented manufacturing industries than for nonmanufacturing industries; and large
firms using hedging methods are likely to show a low degree of exchange rate exposure
Yadav and Jain (2004) studied the risk management practices relating to international
operations of public sector companies in India. The study included political risk, interest rate
risk and exchange risk. With reference to exchange risk, study found that significant
transaction that causes exchange risk is import activity. Majority of public sector companies
were not found to use forward to cover foreign exchange risk.
34.
24
FICCI (2004) conducteda survey during last quarter of 2004 to analyse the ‘Impact of rupee
appreciation on Indian exporters’. The survey which was conducted in the light of
appreciation of Indian rupee against USD reveals that than 73 percent of the respondents feel
that rupee appreciation is a very serious problem. Survey indicated that 73% respondents use
USD exclusively for conducting exports and exporters who use more than one foreign
currency, the dollar on average accounts for nearly 75% of the total billing portfolio. Majority
of the respondents felt that appreciation is putting pressure on revenue and in turn on
margins, with 86% complaining on the same. In the survey 89 percent exporters prefer Euro
as transaction currency over USD, but they felt that Indian exporters are not in a strong
position in this regard and may find it difficult to move towards another currency.
FICCI (June 2007) to analyses the impact of rupee appreciation and hardening of interest
rates on Indian manufacturing sector. Among various sectors impacted by rupee appreciation,
readymade garments sector seems to be worst hit. Minimum fall in the level of exports is
reported to be 20 percent and maximum is in the range of 40 to 50 percent. Rupee
appreciation has made garment exporters uncompetitive to the tune of 8 percent to 15 percent
in terms of price in the international market. Buyers are increasingly moving towards
neighboring countries like Bangladesh, Pakistan etc. This will have negative impact on the
investments in future. Similarly textile sector has also seen a fall. It was 25 to 40 percent for
many textile exporters in the month of April & May 2007. Export realizations are down by 6
to 6.5 percent in some cases. In terms of price, exports are uncompetitive now to the extent of
8 to 10 percent and exports of cotton yarn adversely affected as buyer are increasingly
sourcing from Pakistan.
ASSOCHAM (2007) conducted a survey of 400 large, medium and small exporters on the
adequacy of the Rs.1400 crore export package announced by government to the rupee
appreciation-hit exporters. An overwhelming majority of 80 percent complained that a 10
percent rise in rupee has rendered the exports proceeds uncompetitive. About 68 percent
expressed anguish citing that delay in implementing service tax exemption as declared by
government was adding to their woes while about 90 percent unanimously held that
government response in identifying and promoting potential export markets for them was
almost `negligible’. 80 percent of the exporters surveyed felt that the margins of SMEs had
been wiped out on account of appreciation; government should facilitate invoicing in rupees
rather than US dollars and other currencies, the relief package will not give much benefit to
35.
25
sustain export growth.Respondents took part in the survey felt that the countries like
Thailand,
FICCI (May 2007) Survey on exports conducted during April May 2007 reveals that while
the adverse movement in the country’s exchange rate is affecting a significantly high 75
percent of the participating companies, just about 30 percent of the participating companies
have put in place or have resorted to a mechanism that provides cover for currency exposure.
Further, 82 percent of the companies reported that in their agreements with their clients they
do not have a clause that allows revision of rates in case of a sizable adverse movement in the
exchange rate. Exporters are also on the lookout for clients and markets where Euro could be
replaced as a medium of exchange for US$. Many exporters are also trying for a complete
shift in the medium of exchange from US dollar to Euro in their existing contracts. Several
companies have already started engaging their international clients and are negotiating an
upward revision in the prices for their products – a task, which they say, is extremely
difficult.
An E&Y (2007) survey on corporate treasury reports that foreign exchange risk management
practices among the corporate are short-sighted with hedging horizon generally being less
than three years. The findings further reveal that corporate hedging exercises were largely
within a 12-month band with 33 percent resorting to ‘opportunistic’ hedging. While forwards
and currency swaps are still the most commonly used instruments, as many as 44 percent of
the corporates have growing exposures to exotic structures. The independent survey, covering
34 large companies across India, found that while around 85 percent of the respondents had a
separate treasury operation, most said that their treasury division was nothing but a cost
centre. The study, which covered companies in several industries, said that except for
regulatory compulsion, the forex risk management practices of most Indian companies are
still short-sighted.
A Mecklai and Business Standard (2007) survey says most Indian companies are still quite
far from having good risk management processes. Some of this may have to do with the fact
that it is only recently -- say, the last four or five years -- that the forex market has started
throwing up surprises in terms of twoway movements. Again, it is only recently that many
companies have come to realise that they are, indeed, on their own in the global market and
need to create systems that will protect them when things get rough. Only 17 companies out
36.
26
of 45 takenpart in the survey identify exposures for risk management on the date of the
contract; in all other cases, it is later - either on the date of invoice or on the date the exposure
is reported to the treasury. This suggests that in the majority of companies, risk is identified
very late in the game.
Jain (2007) in her study relating to Developing MIS For Foreign Exchange Exposure
Management reports that almost 90% of the finance directors who opined that their company
faces foreign exchange risk, had a risk exposure management system in place and 76.9% of
all sample companies and 63.2% of Indian MNC's said that their company had an information
system for management of foreign exchange risk exposure. On the state of information
system for management of foreign exchange risk exposure, 96.7% of respondents said that
their information system was cost effective, 89.7% said that their information system was
regularly reviewed to ensure its cost effectiveness and 93.1% of all respondents had a formal
system for calculation of foreign exchange exposure. Respondent constituting 73.1% of total
sample calculated transaction exposure only followed by 19.2% companies that calculate
transaction and translation exposure. No company calculated economic exposure which only
a very small percentage of companies (7.7%) calculated translation exposure only. Finally the
study which has a sample size of 47 found 33 that company size has a hearing on the type of
exposure formally calculated by the information system i.e. the two are not independent.
Anand and Kaushik (2008) examine what motivates the management to use foreign currency
derivatives in corporate India; they compare the significant differences, if any, in the
motivation of the firms which either use foreign currency derivatives or have a documented
foreign exchange risk management policy in place, with those which do not. They also
examine the motivation behind the use of foreign currency derivatives in a factor-analytic
framework. Most of the respondent firms (70.4 percent) have documented foreign exchange
risk management plan/policy/programme. Transaction exposure as a foreign currency risk is
more critical to the firms (74.5 percent) followed by translation exposure (58.3 percent
manifested a moderate degree of risk) and economic exposure (54.3 percent manifested a low
degree of risk). To reduce the volatility in profit after tax, cash flows and the cost of capital
and thus increase the value of the firm on the one side and to reduce the risks faced by the
management on the other are among the major reasons which motivate the firms to use
foreign currency derivatives in India. Firms with a high debt ratio are more likely to use
foreign currency derivatives. The major objective of using derivatives is hedging the risk
37.
27
(96.1 percent rankedit as the number one objective), arbitrage (55.3 ranked it as number two
objective) and price discovery (36.4 percent assigned it rank two and 33.3 percent assigned it
rank three). Speculative objective is the least preferred option (62.1 percent assigned rank
four).
Dash and Madhava (2008) analyses the impact of INR/USD exchange rate fluctuation on the
Indian IT sector The analysis is performed on a random sample of fifty major IT companies.
This survey was conducted in the light of drastic appreciation of INR against USD during last
part of 2007. The results of the study showed that foreign exchange exposure was especially
alarming for a small fraction of small-cap IT companies. The mid-cap and large-cap IT
companies had relatively low/moderate exposure levels. The majority of large-cap companies
34 had already hedged their foreign exchange risk, and were not significantly affected by
their respective foreign exchange exposures.
Sivakumar and Sarkar (2008) attempt to evaluate the various alternatives available to the
Indian corporates for hedging currency exposure. The study was based on 2006-07 annual
report of 8 listed companies. By studying the use of hedging instruments by Indian firms
from different sectors, the paper concludes that most Indian firms use forwards and options to
hedge their foreign currency exposure. This implies that these firms chose short-term
measures to hedge as opposed to foreign debt. This preference is possibly a consequence of
their costs being in rupees, the absence of a Rupee futures exchange in India and curbs on
foreign debt. It also follows that most of these firms behave like net exporters and are
adversely affected by appreciation of the local currency.
Jain, Yadav, and Rastogi (2009) examines and compares the policies of foreign exchange risk
and interest rate risk management followed by public Sector, private sector business houses
and foreign controlled firms in India. The study reveals that Indian firms are aware of their
foreign exchange and Interest rate risk. However, all the risks are not managed and the type
of ownership control significantly influences the usage of the techniques to manage exchange
rate risk and interest rate risk. 'Exposures are not large enough' is the most widespread and
prominent reason for not managing risks. Ownership has been observed to be a significant
determinant of firms' strategy towards risk management.
FICCI (2010) survey on exports states that the Indian exporters are still apprehensive of the
appreciating rupee and the aggressive Chinese moves to push exports. Exporters have also
38.
28
indicated in theSurvey that the stimulus measures provided them with reasonable cushion
and support to compete with the exporters from other countries.
Milan (1996) provides empirical evidence on the determinants of corporate hedging
decisions. In his paper he examines the evidence in the light of mandated financial reporting
requirements in general and constraints placed on anticipatory hedging in particular. Data on
hedging is obtained from the 1992 annual reports for a sample of 3022 US firms. Out of 771
firms classified as hedgers, 543 firms disclose information in their annual reports on their
hedging activities; the remaining 228 firms report use of derivates but no information on
hedging activities is provided. Study finds robust evidence that larger firms are more likely to
hedge.
Grant and Marshall (1997) conducted a survey of large UK companies to ascertain their
usage of derivatives. They examined the extent of derivatives usage, the reasons behind their
usage, the perceived risk associated with derivatives, the control mechanism to monitor the
derivatives used and the reporting practices which governed the usage of derivatives. The
results of the survey indicated widespread usage of derivatives like swaps, forwards and
options. The primary reason for their use was to manage interest rate and currency risks.
There was a rather limited but growing use of derivatives to manage commodity and equity
risks. Treasurers of the sampling firms reported that they were somewhat cautious about more
exotic types of derivatives, primarily because of concern over the illiquidity of the underlying
market for these derivatives. Interestingly, they revealed that they viewed control and the
nature of their counterparty as the main risk in using derivatives. Finally, the use of
derivatives was accompanied by significant control mechanism within the 16 companies and
treasurers were using sophisticated methods to quantify their exposure to derivatives before
they were reported at board level.
Berkman, Bradbury and Magan (1997) presents the result of survey of derivatives use by 79
New Zealand firms and compare the use of derivatives between non-financial firms in New
Zealand and the United States. Although New Zealand is a small open economy with an
under-developed financial market compared to US, across all firm sizes, relatively more NZ
firms use derivatives. This greater use of derivatives despite higher transaction costs reflects
the relatively high exposure of NZ firms. The study finds that 68.6% derivative users felt that
39.
29
USD was themain currency to which the firm was exposed and 29% felt it was Australian
Dollar. 62% of respondents mentioned reducing the fluctuations in earnings is the major
objective behind the usage of derivatives. Study also find that NZ firms report more
frequently on their derivative positions to their boards of directors than US firms.
Makar and Huffman (1997) examined how foreign exchange derivatives (FXDs) were used
by 64 U.S. multinationals facing potentially significant economic exposure, to manage
currency risk. The results indicated that FXD use was positively associated with foreign
currency exposure. Moreover, there was evidence that these results were not sensitive to
industry membership or other differences across firms and reporting years.
Bodnar, Martson and Hayt’s (1998) conducted a Wharton survey of financial risk
management by 399 US non-financial firms. The results show that foreign currency
derivatives are the most commonly used class of derivatives with 83 percent of
derivatives-using firms utilizing them. They asked firms to indicate their percentage of total
revenues and costs in foreign currency. A reasonable percentage of firms reported neither
foreign currency revenue nor foreign currency costs. On the other hand, 40 percent of the
firms reported foreign 17 currency revenues of 20 percent or more of total revenues, while 36
percent of the firms reported foreign currency expenses of 20 percent or more of total
expenses. So, many firms in the survey had significant foreign currency exposure. The survey
showed that the most frequently cited motivation for transacting in foreign currency
derivatives markets was for hedging near-term, directly observable exposures. The most
hedged exposures were onbalance-sheet commitments (89 percent hedged frequently or
sometimes), transactions anticipated within one year (85 percent hedged frequently or
sometimes), and foreign repatriations (78 percent hedged frequently or sometimes). Partial
hedging appeared to be a normal practice of these firms. Results reveal that the majority of
firms hedge less than 25 percent of their perceived exposure. This suggests that reducing the
exposure is preferred over eliminating them. Study reveals that options are less frequently
used than forwards. Furthermore they find that options are mainly used in long-term
exposures. Firms avoid using options either because of the cost they incur in order to get the
options or because they find another instrument that is better suited for the given exposure.
Howton and Perfect (1998) examined use of derivatives in samples of 451 Fortune 500 / S&P
500 (FSP) firms and 461 randomly selected firms operating in USA. The study was based
40.
30
purely on thesecondary data available in the company’s annual report. They found that over
61 percent of the FSP firms and 36 percent of the random firms used derivatives. In the two
samples, forwards and futures were the most-often used currency contracts. The results are
consistent with the argument that fewer firms in the random sample are using currency
derivatives as compared to FSP firms and for those random sample firms, the main
consideration is exposure to currency movements. For the FSP sample derivatives use is
directly related to financial distress and external financing costs, tax considerations, and
currency-risk exposure, and inversely related to hedging substitutes. The results for the
random sample differed considerably from previous studies. Derivatives use in the random
sample is unrelated to most of the proxies for the theoretical hedging determinants.
Marshall (1999) conducted a simultaneously survey of the foreign exchange risk management
practices of large UK, USA and Asia Pacific multinational companies (MNCs). He
investigated whether foreign exchange risk management practices vary internationally. From
179 (30%) usable responses it is shown that there are statistically significant regional
differences in the importance and objectives of foreign exchange risk management, the
emphasis on translation and economic exposures, the internal/external techniques used in
managing foreign exchange risk and the policies in dealing with economic exposures. In
general, UK and USA MNCs have similar policies, with a few notable exceptions; however,
Asia Pacific MNCs display significant differences. To control for regional variations in the
characteristics of respondents the results are also compared by size, percentage of overseas
business and industry sector. It was found that either the size of the respondent or the industry
sector could also explain the emphasis on translation and economic exposure and use of
external hedging instruments.
Kedia and Mozumdar (1999) examine the role of foreign currency denominated debt in firms'
risk management activities. In a sample of large US firms, they found a strong relationship
between the aggregate foreign exchange exposure and foreign currency denominated debt.
This relationship between exposure and foreign currency denominated debt also holds at the
individual currency level. Firms' choice of denominating debt in Australian Dollar, Canadian
Dollar, French Franc, German Mark, Italian Lira and British Pound is related to their
exposure in these currencies. However, firms' choice of denominating debt in Swiss Franc
and Japanese Yen is influenced not by exposure in these currencies, but by the high liquidity
offered by the debt markets in these currencies. The evidence also suggests that creditors’
41.
31
rights and informationasymmetries influence the choice of the currency of debt. However,
the authors find no evidence in favour of tax arbitrage-induced currency preferences in the
denomination of debt.
Lodder and Pichler (2000) conducted a survey of risk management practices of Swiss
Industrial corporations. Study analysed whether Swiss firms are conscious of their currency
exposure. They found that less than 40 percent of the firms are able to quantify their risk.
They are able to come out with two major reasons to explain why firms do not measure their
foreign currency exposure - it is difficult to measure the risk and firms believe their exposure
is small. Study reveals that guaranteeing cash flows, reducing financing cost, simplifying
planning, preventing losses and reducing taxes are the main reasons for managing currency
risk. They found that most often transaction exposure is hedged by Swiss companies.
Translation and economic exposures appear to be less important from their perspective. It is
observed that firms often manage economic exposure by lending and borrowing in foreign
currencies. They cite the following reason for not hedging economic exposure: firms are
unable to anticipate the size and the currency of future cash flows with confidence; the firms
already hedge transaction exposure and hence believe that in the long term currency
fluctuations offset each other. Surprisingly, the cost of hedging economic exposure is not
regarded as an obstacle.
Glaum (2000) conducted a survey of foreign exchange risk management by 74 large German
non-financial corporations. The study concludes that the majority of the firms are concerned
about managing their transaction exposure. Most firms adopted a selective hedging strategy
based on exchange rate forecasts. Only a small minority of firms did not hedge foreign
exchange risk at all, and only few companies hedge their transaction exposure completely.
Looking in more detail at the management of the firms' exposure to the US-dollar, the survey
found that only 16% of the firms were fully edged. The majority of firms had realized hedge
ratios between 50 and 99%. There were numerous German non financial firms which were
concerned about managing their accounting exposure and some firms are actively managing
it. This is in contrast to the exposure concept supported by academic literature which holds
that economic exposure is of little importance in practice. The most interesting finding from
an academic point of view, however, is the widespread use of exchange rate forecasts and of
42.
32
20 exchange riskmanagement strategies based on forecasts (selective hedging). By adopting
such strategies, the managers indicate that they do not believe that the foreign exchange
markets are information efficient and they are able to beat the market with their own
forecasts.
Baba and Fukao (2000) explore a new aspect of currency exposure of Japanese firms with
overseas operations. For the purpose of the study authors chose the firms classified in electric
and precision machinery listed on the Tokyo Stock Exchange. This was because they are
generally highly dependent on international operations such as exports, imports of primary
materials, and overseas production. The number of the sample firms turned out to be 84, of
which 74 firms belong to the electric machinery industry and the remaining 10 firms belong
to the precision machinery industry. Empirical results show that in response to JPY’s
depreciation (appreciation), the values of the firms that are dependent on overseas production
declined (rose) after controlling for the effects via the dependency on exports and imported
primary materials. The result is consistent with the prediction of the static version of currency
risk exposure model.
Christie and Marshall (2001) explore the impact of the introduction of Euro on foreign
exchange risk management of UK’s multinational companies. The study was based on
primary and secondary data of 49 large UK Multinational companies. The study has shown
that Euro will undoubtedly affects the foreign exchange risk management in many UK
MNCs, despite the U K governments’ decision not participate in EMU. The survey reveals
that 55 percent of respondents believe that Euro has decreased their exposure to foreign
exchange risk. Theoretically, it could be expected that the reduction in the currency risk
results in reduced hedging, but survey indicates that majority of respondent’s hedging
remains unchanged. Only 39 percent of the respondents replied that they would alter their
foreign exchange risk management policy and hedge less 21 as a result of the Euro. It was
found that the methods of internal and external hedging unchanged by Euro.
Carter, Pantzalis and Simkins (2001) investigates the impact of firm wide risk management
practices on the currency exposure of 208 U.S. multinational corporations (MNC) based on
various source of secondary data over the period 1994 to 1998. Firm wide risk management is
referred to as the coordinated use of both financial hedges, such as currency derivatives, and
operational hedges, described by the structure of a firm’s MNC foreign subsidiary network.
43.
33
Study found thatthe use of currency derivatives, particularly forward contracts, is associated
with reduced levels of foreign-exchange exposure. To conclude, the survey results strongly
support the view that MNCs hedging in a coordinated manner can significantly reduce
exposure to currency risk. These results strongly suggest that operational and financial
hedges are complementary risk management strategies.
Popov and Stutzmann (2003) investigate how two Swiss companies, Kudulski and Logitech
manage their foreign exchange risk. They find that transaction exposure is the most managed
foreign exchange exposure, but translation and economic exposures are not well identified
and managed mainly because firms believe it is unnecessary or too complex. Study also
reports that whenever possible netting is used by both the companies as it has no cost.
Forward is the main external hedging instrument, as options are expensive tool to manage
foreign exchange risk, both Kudulski and Logitech use it rarely. Finally, firms hedge their
exposure but never fully due to the high cost of hedging.
Jonuska and Samenaite (2003) based on the response of 18 companies, studies the state of
currency exposure management in Lithuanian companies. The study focuses on the
characteristics of currency exposure management in exporting companies and the problem
encountered while using currency derivatives. Most of the companies in Lithuanian are aware
of the currency exposure they face especially after pegging their home currency Litas to
Euro. Most of the companies try to manage currency exposure by employing internal 22
methods of hedging. Study show that currency derivatives are not popular with Lithuanian
companies. The hindrance in usage of derivatives is the relatively high cost, lack of
managers’ knowledge, mistrust in bank and complicated accounting procedure. Those
respondent companies who use derivatives, mostly dependent on forward contract. Majority
of derivative user felt that they are not willing to pay option premium, since they consider
this derivative to be more complex to apply in risk management. Dairy, oil and chemical
industries are among the most highly exposed to US dollar fluctuations, yet the specifics of
those industries and financial markets make hedging non-beneficial. Survey results reveal
that the cost of hedging indeed exceeds the benefit.
44.
34
Alkeback, Pramborg andHagelin (2003) analyse Swedish non-financial firms' use of
derivatives in 2003 and compare the results with results from an earlier study which
investigated Swedish firms in 1996. The results show, among other things, that: 59 percent of
the Swedish firms used derivatives in 2003 compared to 52 percent in 1996; the use of
derivatives for hedging the balance sheet among Swedish firms in 2003 is higher than that for
other countries but lower than that for Swedish firms in 1996 suggesting that Swedish firms
conform to international practice; and the issue of greatest concern to Swedish firms in 1996,
viz., lack of knowledge about derivatives within the firm, no longer exists in 2003.
Pramborg (2004) compares the hedging practices of Swedish and Korean nonfinancial firms.
Analysis is based upon the response from 163 companies which includes 60 from Korea and
103 from Sweden. The findings suggest similarities between firms in the two countries, with
notable exceptions. The aim of hedging activity differed between the countries, Korean firms
being more likely to focus on minimizing fluctuations of cash flows, while Swedish firms
favored minimizing fluctuations of earnings or protecting the appearance of the balance
sheet. The proportion of firms that used derivatives was significantly lower in the Korean
than in the Swedish sample. This could not be captured by firm characteristics such as foreign
exchange exposure, size, liquidity, or leverage. This may be due 23 to the higher fixed costs
incurred by Korean firms initiating derivatives programs. These higher costs could result
from the relative immaturity of Korean derivatives markets, and, perhaps more importantly,
from Korean authorities’ heavy regulation of OTC derivatives use. Korean firms relied to a
larger extent on alternative hedging methods, suggesting that the decision to hedge was not
country specific but rather driven by firm-specific variables, such as the level of foreign
exchange exposure and firm size. It was further argued that Korean firms were less rigorous
in monitoring their risk positions than Swedish firms. Finally, a large proportion of firms in
both countries used a profit-based approach to evaluate the risk management function
Hegelin and Pramborg (2005) investigate Swedish firms' use of financial hedges against
foreign exchange exposure. Their survey data lets them distinguish between hedging
translation exposure and transaction exposure. Survey responses indicate that over 50 percent
of the sample firms employ financial hedges and that transaction exposure is more frequently
hedged than translation exposure. The likelihood of using financial hedges increases with
firm size and exposure. Importantly, the existence of loan covenants accounts for translation
45.
35
exposure hedging, suggestingthat firms hedge translation exposure to avoid violating loan
covenants.
Schena (2005) explores the sensitivity of firm-level Chinese stock returns to changes in a
trade-weighted index of the RMB, as well as against the currencies of China’s major trading
partners, over the five-year period from 1999 to 2003. In assessing the exposure and
management of foreign exchange risk by Chineselisted companies, the analysis suggests that
despite the currency peg, internationally oriented Chinese firms have experienced significant
foreign exchange exposure. Study finds that approximately 34% of sample displays a
significant exposure to changes in the value of one or more of the currencies of China’s major
trading partners against which the RMB is not pegged.
Chan-Lau (2005) assesses foreign exchange exposure in the corporate sector in Chile and
opines that foreign exchange exposure in Chile is lower than other countries in the region and
similar to that observed in small industrialized countries. The most exposed sector is the
financial sector. However, this is not a major source of systemic risk since a recent
assessment of financial sector in Chile suggests that banks can withstand severe exchange
and interest rate shocks successfully. Managing currency exchange risk has been facilitated
by a well-functioning forward market in Chile.
Abor (2005) reports on the foreign exchange risk management practices among Ghanaian
firms involved in international trade. The results indicate that close to one-half of the firms do
not have any well-functioning risk-management system. The study found that among
Ghanaian firms foreign exchange risk is mainly managed by adjusting prices to reflect
changes in import prices resulting from currency fluctuation and also by buying and saving
foreign currency in advance. The main problems the firms face are the frequent appreciation
of foreign currencies against the local currency and the difficulty in retaining local customers
because of the high cost of imported inputs, which tend to affect the prices of the final
products sold locally. The results also show that Ghana’s firms involved in international trade
exhibit a low level use of hedging techniques.
46.
36
CHAPTER 3
RESEARCH METHODOLOGY
TheResearch design used in the study is descriptive research design
3.1 RESEARCH DESIGN
Descriptive research design is also called explanatory design. This is the one that
simply describes something such as demographic characteristics. The descriptive study is
typically concerned with determining frequency with which something occurs or how two
variables vary together.
3.2 SAMPLE SIZE
It refers to the number of elements of the population to sample. The sample size
chosen for the survey is 123.
3.3 DATA SOURCES
After identifying and defining the research problem and determining specific
information required to solve the problem, the researcher`s task is to look the type and
sources of data which may yield the desired results. Data sources are of two types through
which data is collected.
Data sources may be classified as
47.
37
1. Primary data
2.Secondary data
PRIMARY DATA
Primary data is the original data collected by the researcher firsthand. It is collected
for the first time through field survey. These are those that are gathered specifically for the
problem at hand. The various sources for collecting primary data are questionnaires,
observation, interview etc. The primary source used for the study is questionnaire.
3.4 SAMPLING
Collecting data about each and every unit of the population is called census method.
The approach, where only a few units of population under study are considered for analysis is
called sampling method. There are two main categories under which various sampling
method can be put.
The two categories are
1. Probability sampling
2. Non-probability sampling
The sampling method adopted for the study is convenience sampling under non-probability
sampling.
3.5 CONVENIENCE SAMPLING:
In this method, the sample units are chosen primarily on the basis of the convenience
to the investigator. The units selected may be each person who comes across the investigator.
3.6 SAMPLE FRAME:
A Sample frame may be defined as the listing of the general components of the
individual units that comprise the defined population.
3.7 SAMPLE DESIGN
Sample design is the theoretical basis and the practice means by generalizing from
characteristics of relatively few of the comprising population. It is the method by which the
sample is chosen.
48.
38
3.8ANALYTICAL TOOLS
ANALYSIS USINGKARL PEARSON’S CORRELATION:
Correlation analysis is the statistical tool used to measure the degree to which two
variables are linearly related to each other. Correlation measures the degree of association
between two variables. The Pearson product-moment correlation coefficient is a measure of
the strength and direction of association that exists between two variables measured on at
least an interval scale. It is denoted by the symbol r.
𝑟 =
𝑁∑𝑋𝑌−∑𝑋∑𝑌
CHI- SQUARE TEST I – (Ψ2
)
A chi-squared test, also referred to as chi-square test or χ2 test, is any statistical hypothesis
test in which the sampling distribution of the test statistic is a chi-squared distribution when
the null hypothesis is true, or any in which this is asymptotically true, meaning that the
sampling distribution (if the null hypothesis is true) can be made to approximate a chi-
squared distribution as closely as desired by making the sample size large enough.
The χ2 test was first used by Karl Pearson in the year 1980. The quantity χ2 describes the
magnitude of the discrepancy between theory and observation.
It is calculated using:
χ² = Σ [( 𝑂 − 𝐸 )
2
/ 𝐸 ]with (n - 1) degrees of freedom.
𝑖 𝑖 𝑖
Where, 𝑂 refers to the observed frequency &
𝐸
𝑖
𝑖
to the expected frequencies.
χ² was used as a test of independence and goodness of fit.
2 2
𝑁∑𝑋 −(∑𝑋)² 𝑁∑𝑌 −
(∑𝑌)²
49.
39
CHAPTER 4
DATA ANALYSISAND INTERPRETATION
Particulars
No. of
Respondents % of Respondents
Import & Export 65 53%
Only Import 30 24%
Only Export 28 23%
Total 123 100%
TABLE 1: SOURCE OF FOREIGN CURRENCY
CHART 1
50.
40
INFERENCE:
53% of therespondents prefer Import & Export as a source of foreign currency and 24% of
the respondents prefer only Import as a source of foreign currency. Therefore most of the
respondents prefer Import & Export as a source of foreign currency.
TABLE 2: EXPOSURE OF FOREIGN CURRENCY PER ANNUM
Particulars
No. of
Respondents % of Respondents
< 1 L 30 24%
1 L - 25 L 31 25%
25 L - 50 L 27 22%
> 50 L 35 29%
Total 123 100%
CHART 2
51.
41
INFERENCE:
29% of therespondents say per annum > 50 L is the exposure of foreign currency, 25% say
per annum 1 L - 25 L is the exposure of foreign currency.Therefore most of the respondents
say per annum > 50 L is the exposure of foreign currency.
TABLE 3: RISK IN FOREIGN CURRENCY
Particulars No. of Respondents % of Respondents
Yes 79 64%
No 44 36%
Total 123 100%
CHART 3
52.
42
INFERENCE:
64% of therespondents say that there is a risk in foreign currency, 36% of the respondents
say there is no risk in foreign currency. Therefore most of the respondents say that there is a
risk in foreign currency.
TABLE 4: IF YES LEVEL OF PERCEPTION OF RISK
Particulars
No. of Respondents % of Respondents
Very high 32 26%
High 24 20%
53.
43
Moderate 39 32%
Low18 14%
Very low 10 8%
Total 123 100%
CHART 4
INFERENCE:
32% of the respondents say perception of risk is moderate in level, 26% of the respondents
say perception of risk is Very high in level. Therefore most of the respondents say perception
of risk is moderate in level.
TABLE 5: LOSS ON FOREIGN CURRENCY EXCHANGE
Particulars
No. of
Respondents % of Respondents
Yes 81 66%
No 42 34%
Total 123 100%
54.
44
CHART 5
INFERENCE:
66% ofthe respondents say loss on foreign currency exchange, 34% of the respondents didn’t
say loss on foreign currency exchange. Therefore most of the respondents say loss on foreign
currency exchange.
TABLE 6: HOW OFTEN FIRM MANAGE TRANSACTION EXPOSURE
Particulars
No. of Respondents % of Respondents
All the times 73 59%
Sometimes 50 41%
Never 0 0
Total 123 100%
55.
45
CHART 6
INFERENCE:
59% ofthe respondents say that all the time the firm manages transaction exposure and 41%
of the respondents say that sometime the firm manages transaction exposure. Therefore most
of the respondents say that all the time the firm manages transaction exposure.
56.
46
TABLE 7: METHODSUSE TO FORECAST FIRM’S LIKELY FUTURE FOREIGN
EXCHANGE EXPOSURES
Particulars
No. of
Respondents % of Respondents
Forecast using the
contracts
28 23%
Forecast using Orders
35 29%
Cash forecast by currency
26 21%
Balance sheet/Income forecast
20 16%
Informal method
14 11%
Total 123 100%
CHART 7
57.
47
INFERENCE:
29% of therespondents say forecast using orders method which is firm’s likely future foreign
exchange exposures, 23% of the respondents say Forecast using the contracts method which
is firm’s likely future foreign exchange exposures. Therefore most of the respondents say
forecast using orders method which is firm’s likely future foreign exchange exposures.
TABLE 8: HOW OFTEN FIRM MANAGE ECONOMIC EXPOSURE
Particulars No. of Respondents % of Respondents
All the times 79 64%
Sometimes 41 34%
Never 3 2%
Total 123 100%
CHART 8
58.
48
INFERENCE:
64% of therespondents say that the firm manages the economic exposure all the time, 34% of
the respondents say that the firm manages the economic exposure only on sometimes.
Therefore most of the respondents say that the firm manages the economic exposure all the
time.
TABLE 9: THE MAJOR TYPES OF EXPOSURE IDENTIFIED BY FIRM
Particulars No. of Respondents % of Respondents
Translation 39 32%
Transaction 43 35%
Economic exposure 41 33%
Total 123 100%
59.
49
CHART 9
INFERENCE:
35% ofthe respondents mentioned that transaction is the major exposure identified by firm,
33% of the respondents mentioned that translation is the major exposure identified by firm.
Therefore most of the respondents mentioned that transaction is the major exposure identified
by firm.
Particulars No. of Respondents % of Respondents
Leave transaction exposure
uncovered
26
21%
Cover all transaction exposures
33
27%
Take a view on foreign exchange
rates and cover or leave transaction
41
33%
60.
50
exposure uncovered, dependingon
view
No Particular Policy 23
19%
Total 123 100%
TABLE 10 FIRM’S POLICY ON TRANSACTION EXPOSURE
CHART 10
INFERENCE:
33% of the respondents say that firm’s policy on transaction exposure is done by taking a
view on foreign exchange rates and cover or leave transaction exposure uncovered,
depending on view, 27% of the respondents mention that firm’s policy on transaction
exposure is done by covering all transaction exposures.Therefore most of the respondents say
that firm’s policy on transaction exposure is done by taking a view on foreign exchange rates
and cover or leave transaction exposure uncovered, depending on view.
Particulars No. of Respondents % of Respondents
Leave economic exposure uncovered 25 20%
Cover all economic exposures 35 29%
61.
51
TABLE 11: FIRM’SPOLICY ON ECONOMIC EXPOSURE CHART 11
INFERENCE:
35% of the respondents say that the firm’s policy on economic exposure is done by taking a
view on foreign exchange rates and cover or leave economic exposure uncovered, depending
on view, 29% of the respondents say that the firm’s policy on economic exposure is done by
covering all economic exposures. Therefore, most of the respondents say that the firm’s
policy on economic exposure is done by taking a view on foreign exchange rates and cover or
leave economic exposure uncovered, depending on view.
TABLE 12: LEVEL OF PERCENTAGE THE FIRM’S TRANSACTION EXPOSURE
IS COVERED
Take a view on foreign exchange
rates and cover or leave economic
exposure uncovered, depending on
view
43 35%
No Particular Policy 20 16%
Total 123 100%
62.
52
Particulars No. ofRespondents % of Respondents
Nil 11 9%
Up to 25% 31 25%
Greater than 25% - 50% 43 35%
Greater than 50% - 75% 21 17%
Greater than 75% 17 14%
Total 123 100%
CHART 12
INFERENCE:
35% of the respondents say that greater than 25% - 50% is the level of percentage of the firm
transaction exposure is covered, 25% of the respondents say that up to 25% is the level of
percentage of the firm transaction exposure is covered. Therefore most of the respondents say
that greater than 25% - 50% is the level of percentage of the firm transaction exposure is
covered.
Particulars No. of Respondents % of Respondents
63.
53
Nil
12
10%
Up to 25%
30
24%
Greaterthan 25% - 50%
47
38%
Greater than 50% - 75% 19
16%
Greater than 75% 15
12%
Total 123 100%
TABLE 13: LEVEL OF FIRM’S ECONOMIC EXPOSURE IS COVERED
CHART 13
INFERENCE:
38% of the respondents say that greater than 25% - 50% is the level of percentage the firm
economic exposure is covered, 24% of the respondents say that up to 25% is the level of
percentage the firm economic exposure is covered. Therefore most of the respondents say
that greater than 25% - 50% is the level of percentage the firm economic exposure is covered.
64.
54
TABLE 14: FACTORSTYPICALLY DRIVING FIRM’S FOREIGN EXCHANGE
EXPOSURE MANAGEMENT
Particulars No. of Respondents % of Respondents
Volatility of client’s
domestic currency 73 59%
Pressure from investors 37 30%
Accounting regulations 13 11%
Total 123 100%
CHART 14
INFERENCE:
59% of the respondents prefer Volatility of client’s domestic currency factor which is driving
firm’s foreign exchange exposure management, 30% of the respondents prefer Pressure from
investors factor which is driving firm’s foreign exchange exposure management. Therefore
most of the respondents prefer Volatility of client’s domestic currency factor which is driving
firm’s foreign exchange exposure management.
65.
55
Particulars No. ofRespondents % of Respondents
Minimize foreign exchange losses 33 27%
Avoid Surprises 25 21%
Reduce quarter-on-quarter earnings
fluctuations 51 41%
Increasing the market value of the
firm 9 7%
Reduce bankruptcy and financial
distress costs 5 4%
Total 123 100%
TABLE 15: THE MAJOR OBJECTIVE OF FIRM’S FOREIGN EXCHANGE
EXPOSURE MANAGEMENT
CHART 15
INFERENCE:
41% of the respondents said that objective of firm’s foreign exchange exposure management
prefer Reduce quarter-on-quarter earnings fluctuations, 27% of the respondents said that
objective of firm’s foreign exchange exposure management prefer Minimize foreign
66.
56
exchange losses.Therefore mostof the respondents said that objective of firm’s foreign
exchange exposure management prefer Reduce quarter-on-quarter earnings fluctuations.
TABLE 16: FREQUENTLY REVISE FIRM’S FOREIGN EXCHANGE RISK
MANAGEMENT POLICY
Particulars
No. of
Respondents
% of
Respondents
Monthly 23 19%
Quarterly 43 35%
Annually 57 46%
Total 123 100%
CHART 16
INFERENCE:
46% of the respondents say firm’s foreign exchange risk management policy will be
revising annually, 35% of the respondents say firm’s foreign exchange risk management
policy will be revising quarterly. Therefore most of the respondents say firm’s foreign
exchange risk management policy will be revising annually.
67.
57
TABLE 17: THEPRIMARY SOURCE OF FIRM’S FOREIGN EXCHANGE RATE
FORECAST
Particulars
No. of
Respondents
% of
Respondents
No forecast 47 38%
Firm’s forecast 35 28%
Banks 30 25%
Other financial services 11 9%
Total 123 100%
CHART 17
INFERENCE:
38% of the respondents prefer no forecast primary source of firm’s foreign exchange rate,
28% of the respondents prefer firm’s forecast primary source of firm’s foreign exchange rate.
Therefore most of the respondents prefer no forecast primary source of firm’s foreign
exchange rate.
68.
58
TABLE 18: MANAGETHE RISK IN FOREIGN CURRENCY EXCHANGE
Particular No. of Respondents % of Respondents
Spot 35 28%
EFC A/c 13 11%
Forward Cover 15 12%
Advisory 27 22%
Derivatives 33 27%
Total 123 100%
CHART 18
INFERENCE:
28% of the respondents say manage the risk in foreign currency exchange with the help
of Spot, 25% of the respondents say manage the risk in foreign currency exchange with the
help of Derivatives. Therefore most of the respondents say manage the risk in foreign
currency exchange with the help of Spot.
69.
59
TABLE 19: MENTIONIN PERCENTAGE (%) OF USAGE OF TECHNIQUES
Particulars
No. of
Respondents
% of
Respondents
Spot
36 29%
EFC A/c
22 18%
Forward Cover
12 10%
Advisory
20 16%
Derivatives
33 27%
Total 123 100%
CHART 19
INFERENCE:
29% of the respondents say spot is the usage of technique which is mention in
percentage, 27% of the respondents say derivatives is the usage of technique which is
mention in percentage. Therefore most of the respondents say spot is the usage of technique
which is mention in percentage.
70.
60
TABLE 20: AWAREOF DERIVATIVES
Particulars
No. of
Respondents
% of
Respondents
Yes 90 73%
No 33 27%
Total 123 100%
CHART 22
INFERENCE:
73% of the respondents are aware about derivatives, 27% of the respondents doesn’t aware
about derivatives. Therefore most of the respondents are aware about derivatives.
71.
61
STATISTICAL TOOLS ANDANALYSIS
CHI- SQUARE TEST I – (ψ2
)
Chi-square is the sum of the squared difference observed (o) and the expected (e) data (or the
deviation, d), divided by the expected data in all possible categories.
Null hypothesis (Ho):
There is no relationship between the source of foreign currency and primary
source of your firm’s foreign exchange rate forecast.
Alternate hypothesis (H1):
There is relationship between the source of foreign currency and primary source
of your firm’s foreign exchange rate forecast.
Case Processing Summary
Cases
Valid Missing Total
N Percent N Percent N Percent
source of foreign
currency * primary
source of your firm’s
foreign exchange rate
forecast
123 100.0% 0 0.0% 123 100.0%
Chi-Square Tests
Value Df Asymp.
Sig.
(2-sided
)
Pearson Chi-Square 131.046a
6 .000
Likelihood Ratio 160.906 6 .000
Linear-by-Linear
Association
94.458 1 .000
N of Valid Cases 123
a. 2 cells (16.7%) have expected count less than 5. The
minimum expected count is 2.50.
72.
62
INFERENCE:
Since the calculatedvalue is greater than the tabulated value, we accept the alternate
hypothesis and hence there is a relationship between the source of foreign currency and
primary source of your firm’s foreign exchange rate forecast.
ANALYSIS USING KARL PEARSON’S CORRELATION
Correlation analysis is the statistical tool used to measure the degree to which two variables
are linearly related to each other. Correlation measures the degree of association between two
variables.
Null hypothesis (H0):
There is positive relationship between level of percentage the firm’s transaction exposure is
covered and level of firm’s economic exposure is covered.
Alternate hypothesis (H1):
There is negative relationship between level of percentage the firm’s transaction exposure is
covered and level of firm’s economic exposure is covered.
73.
63
Correlations
level of
percentage
the firm’s
transaction
exposureis
covered
level of
firm’s
economic
exposure is
covered
level of percentage the
Pearson
1 .980**
firm’s transaction
exposure is covered
Correlation
Sig. (2-tailed)
N 123
.000
123
level of firm’s
Pearson
Correlation .980**
1
economic exposure is
covered Sig. (2-tailed) .000
N 123 123
**. Correlation is significant at the 0.01 level (2-tailed).
INFERENCE:
Since r is positive, there is positive relationship between level of percentage the firm’s
transaction exposure is covered and level of firm’s economic exposure is covered.
CHAPTER 5
5.1 FINDINGS:
● Most of the respondents prefer Import & Export as a source of foreign currency.
● Most of the respondents say per annum > 50 L is the exposure of foreign currency.
● Most of the respondents say that there is a risk in foreign currency.
● Most of the respondents say perception of risk is moderate in level.
74.
64
● Most ofthe respondents say loss on foreign currency exchange.
● Most of the respondents say that all the time the firm manages transaction exposure.
● Most of the respondents say forecast using orders method which is firm’s likely future
foreign exchange exposures.
● Most of the respondents say that the firm manages the economic exposure all the
time.
● Most of the respondents mentioned that transaction is the major exposure identified
by firm.
● Most of the respondents say that firm’s policy on transaction exposure is done by
taking a view on foreign exchange rates and cover or leave transaction exposure
uncovered, depending on view.
● Most of the respondents say that the firm’s policy on economic exposure is done by
taking a view on foreign exchange rates and cover or leave economic exposure
uncovered, depending on view.
● Most of the respondents say that greater than 25% - 50% is the level of percentage of
the firm transaction exposure is covered.
● Most of the respondents say that greater than 25% - 50% is the level of percentage the
firm economic exposure is covered.
● Most of the respondents prefer Volatility of client’s domestic currency factor which is
driving firm’s foreign exchange exposure management.
● Most of the respondents said that objective of firm’s foreign exchange exposure
management prefer Reduce quarter-on-quarter earnings fluctuations.
● Most of the respondents say firm’s foreign exchange risk management policy will be
revising annually.
● Most of the respondents prefer no forecast primary source of firm’s foreign exchange
rate.
● Since the calculated value is greater than the tabulated value, we accept the alternate
hypothesis and hence there is a relationship between the source of foreign currency
and primary source of your firm’s foreign exchange rate forecast.
● Since r is positive, there is positive relationship between level of percentage the firm’s
transaction exposure is covered and level of firm’s economic exposure is covered.
66
◻ Management ofSunshare Investments Pvt Ltd can use Spot technique to manage the
risk in currency exchange as it is most preferred by the customers.
◻ Frequent training programmes can be conducted to the foreign exchange trade
customers to create awareness about the current trends and the prediction for the
future in the Forex. This will help them to reduce the Forex risk and have more
transactions.
◻ Develop a foreign exchange policy and review it regularly. It is important that your
policy complies with and works towards overall strategy and objectives. Once agreed,
a policy should be reviewed regularly and be flexible enough to reflect the constantly
changing nature of the markets.
◻ Take information from a variety of sources. As experienced market traders they will
use their expertise to ensure your company receives the best information and guidance
on the markets.
◻ Planning is the first step to managing your Forex risk. Agreeing on a budgeted
exchange rate for the year will guide your transactions. Your budgeted rate should
take into account the volume and timing of your expected transactions as well as a
realistic assumption of current and future rates. An Forex specialist can help to define
this rate by analyzing past trends.
◻ With your policy in place it is time to review the Forex tools that you can use to
manage your exposure. Spot and Forward contracts and market orders can work
individually or together to form a tailored foreign exchange strategy. Depending on
your budgeted rate, your requirements and timing, your Forex Dealer will be able to
suggest a strategy to suit your business.
5.3 CONCLUSION
Many firms are exposed to foreign exchange risk - i.e. their wealth is affected by
movements in exchange rates - and will seek to manage their risk exposure. Exchange
rate risk or foreign exchange (forex) risk is an unavoidable risk of foreign investing, but one
that can be mitigated considerably through the use of hedging techniques. In order to totally
eliminate forex risk, the obvious choice is to avoid investing in overseas assets altogether. But
this may not be the best alternative from the viewpoint of portfolio diversification, since
77.
67
numerous studies haveshown that foreign investing improves portfolio return while reducing
risk.
This study has been undertaken to assess the foreign exchange risk management with
reference to Sunshare Investments Pvt Ltd, Chennai. Numerous new findings has been
derived from this research by collecting the responses to various questions from the
customers. Few valuable suggestions like use Spot technique to manage the risk in currency
exchange, Frequent training programmes, Develop a foreign exchange policy and review it
regularly etc have helped to provided to improve the foreign exchange risk management at
Sunshare Investments Pvt Ltd, Chennai.
BIBLIOGRAPHY
REFERENCE:
◻ Dr. Levi., INTERNATIONAL FINANCE, Tata McGraw Hill., 6th Edition –
2010.
◻ Shapiro.,MULTINATIONAL FINANCIAL MANAGEMENT, Prentice Hall
Of India., 8th Edition 2011.
78.
68
◻ Ian M.Johnstone & Bryden ., MANAGING RISK, England, 1995.
◻ C.R.Kothari., RESEARCH METHOLOGY, Wishva Prakashan, New Delhi,
2011.
◻ FOREIGN EXCHANGE RISK, Edited by Jurgen Hakala and Uwe Wystup
◻ FOREIGN EXCHANGE OPTIONS AND RISK MANAGEMENT, By
Demetri Papacostas
JOURNALS
◻ Management of Foreign Exchange Risk: A Review Article, Laurent L. Jacque,
Journal of International Business Studies, Vol. 12, No. 1, Tenth Anniversary Special
Issue (Spring - Summer, 1981), pp. 81-101
◻ An empirical study of strategic approaches to foreign exchange risk
management used by Danish medium-sized non-financial companies, Author:
Marianna Andryeyeva Hansen.
◻ The Role of Foreign Exchange Risk Management On Performance
Management of Exporting Firms in Developing Countries: A Case Study of Uganda’s
Exporting Firms, Research journali’s Journal of Economics Vol. 2 | No. 3 March |
2014 ISSN 2347-8233, Peter Mbabazi Mbabazize, Twesige Daniel, Isaac Emukule
Ekise.
◻ A Framework for Integrated Risk Management in International Business,
Author(s): Kent D. Miller, Source: Journal of International Business Studies, Vol. 23,
No. 2 (2nd Qtr., 1992), pp. 311-331
◻ A Survey of Foreign Currency Risk Awareness and Management Practices in
Tanzania by Mussa J. ASSAD, University of Dar es Salaam, ICBE-RF Research
Report No. 09/11
ANNEXURE - QUESTIONNAIRE
1. Name: ………………………………….
2) Age:
a) 18 to 21 b) 22 to 30 c) 31 to 45 d) 46 to 56
79.
69
3) Gender
a) Maleb) Female c) Not prefer to say
4. What is your source of foreign currency?
Import & Export [
Only Import [
Only Export [
Others….......................(Specify) [
5. What will be your exposure of your foreign currency per annum?
1 L [
L - 25 L [
25 L - 50 L [
50 L [
6. Do you think there is any risk in foreign currency?
7. If yes, what
Very high [
High [
Moderate [
Low [
Very low [
8. Had you ever incurred any loss on foreign currency exchange?
Yes[ ]
No [ ]
9. How often does your firm manage transaction exposure?
All the times [ ]
Yes
No
[
[
]
]
will be your level of perception of risk?
80.
70
Sometimes [ ]
Never[ ]
10. Which of the following methods do you use to forecast your firm’s likely future foreign
exchange exposures?
11. How often
All the times [ ]
Sometimes [ ]
Never [ ]
12. What are the major types of exposure identified by your firm?
Translation [ ]
Transaction [ ]
Economic exposure [ ]
13. Which of the following statements best represents your firm’s policy on transaction
exposure?
Leave transaction exposure uncovered [ ]
Cover all transaction exposures [ ]
Take a view on foreign exchange rates and cover or leave transaction
exposure uncovered, depending on view [ ]
No Particular Policy [ ]
14. Which of the following statements best represents your firm’s policy on economic
exposure?
Leave economic exposure uncovered [ ]
Cover all economic exposures [ ]
Take a view on foreign exchange rates and cover or leave economic
Forecast using the contracts [ ]
Forecast using Orders [ ]
Cash forecast by currency [ ]
Balance sheet/Income forecast [ ]
Informal method [ ]
does your firm manage economic exposure?
81.
71
exposure uncovered, dependingon view [ ]
No Particular Policy [ ]
15. What percentage of your firm’s transaction exposure is usually covered?
Nil [ ]
Up to 25% [ ]
Greater than 25% - 50% [ ]
Greater than 50% - 75% [ ]
Greater than 75% [ ]
16. What percentage of your firm’s economic exposure is covered?
Nil [ ]
Up to 25% [ ]
Greater than 25% - 50% [ ]
Greater than 50% - 75% [ ]
Greater than 75% [ ]
17. Identify factors typically driving your firm’s Foreign Exchange Exposure Management?
Volatility of client’s domestic currency [ ]
Pressure from investors [ ]
Accounting regulations [ ]
18. What is the major objective of your firm’s Foreign Exchange Exposure Management?
Minimize foreign exchange losses [ ]
Avoid Surprises [ ]
Reduce quarter-on-quarter earnings fluctuations [ ]
Increasing the market value of the firm [ ]
Reduce bankruptcy and financial distress costs [ ]
19. How frequently do you revise your firm’s foreign exchange risk management policy?
Monthly [ ]
Quarterly [ ]
Annually [ ]
82.
72
20. What isthe primary source of your firm’s foreign exchange rate forecast?
No forecast [ ]
Firm’s forecast [ ]
Banks [ ]
Other financial services [ ]
21. How do you manage the risk in foreign currency exchange?
Spot
EFC A/c [
[
]
]
Forward Cover [ ]
Advisory [ ]
Derivatives [ ]
22. Are you aware of Derivatives (optional)?
Yes [ ]
No [ ]
23. If yes, how it is when compare to other techniques?
Excellent [ ]
Very Good [ ]
Good [ ]
Fair [ ]
Poor [ ]


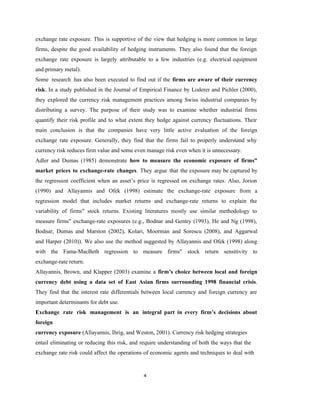
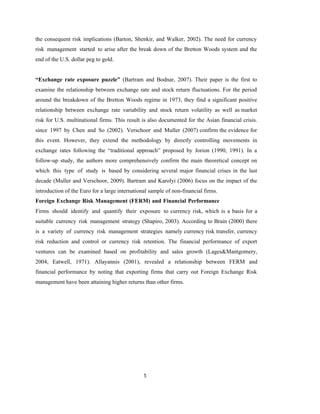

![38
3.8ANALYTICAL TOOLS
ANALYSIS USING KARL PEARSON’S CORRELATION:
Correlation analysis is the statistical tool used to measure the degree to which two
variables are linearly related to each other. Correlation measures the degree of association
between two variables. The Pearson product-moment correlation coefficient is a measure of
the strength and direction of association that exists between two variables measured on at
least an interval scale. It is denoted by the symbol r.
𝑟 =
𝑁∑𝑋𝑌−∑𝑋∑𝑌
CHI- SQUARE TEST I – (Ψ2
)
A chi-squared test, also referred to as chi-square test or χ2 test, is any statistical hypothesis
test in which the sampling distribution of the test statistic is a chi-squared distribution when
the null hypothesis is true, or any in which this is asymptotically true, meaning that the
sampling distribution (if the null hypothesis is true) can be made to approximate a chi-
squared distribution as closely as desired by making the sample size large enough.
The χ2 test was first used by Karl Pearson in the year 1980. The quantity χ2 describes the
magnitude of the discrepancy between theory and observation.
It is calculated using:
χ² = Σ [( 𝑂 − 𝐸 )
2
/ 𝐸 ]with (n - 1) degrees of freedom.
𝑖 𝑖 𝑖
Where, 𝑂 refers to the observed frequency &
𝐸
𝑖
𝑖
to the expected frequencies.
χ² was used as a test of independence and goodness of fit.
2 2
𝑁∑𝑋 −(∑𝑋)² 𝑁∑𝑌 −
(∑𝑌)²](https://image.slidesharecdn.com/foeignexchangerm-250424151058-e9f551d9/85/Foeign-exchange-RM-docx-Mba-Project-pdf-48-320.jpg)
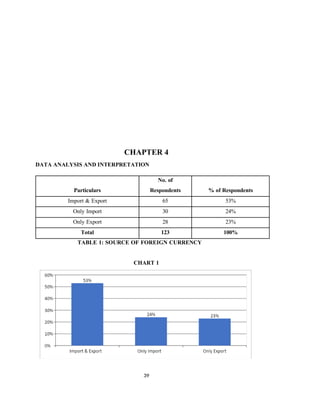
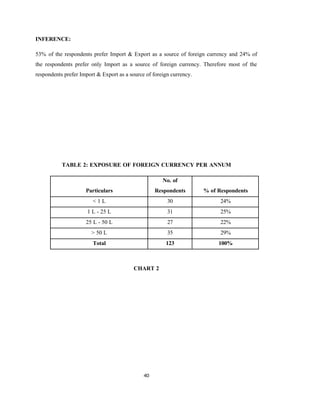
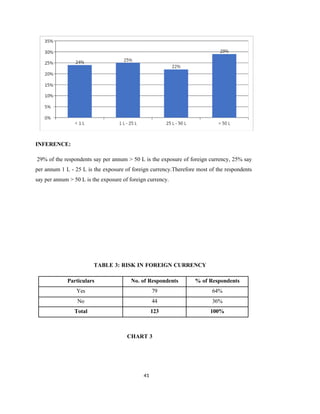
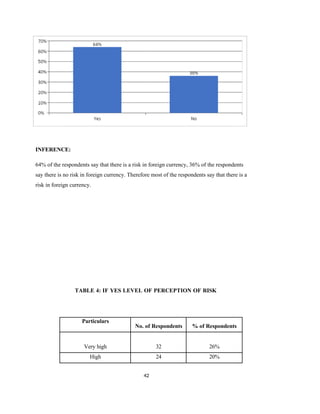
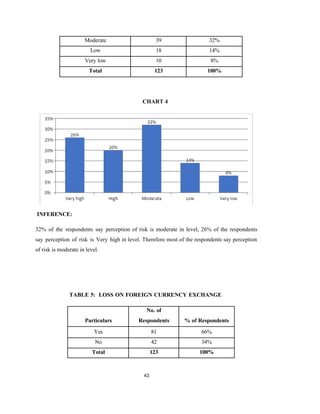
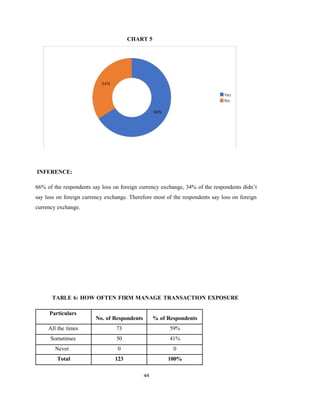
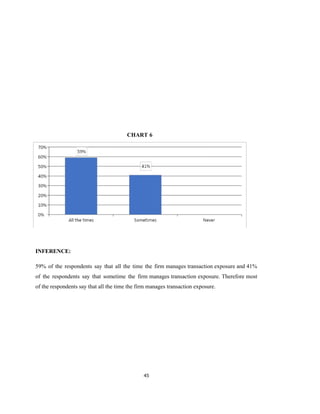
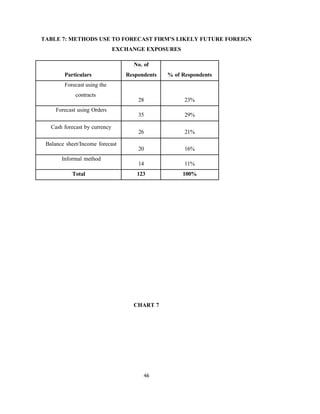
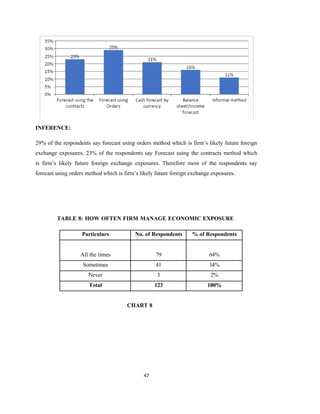
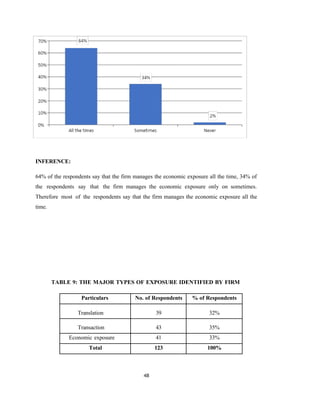
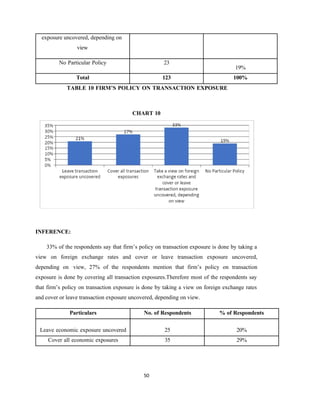
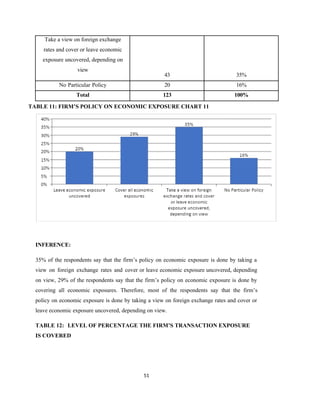
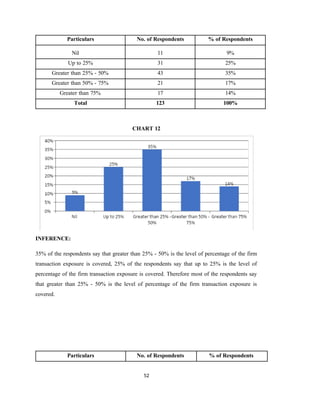
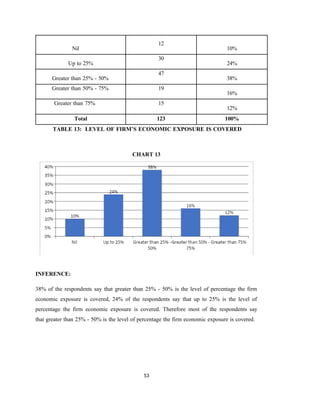
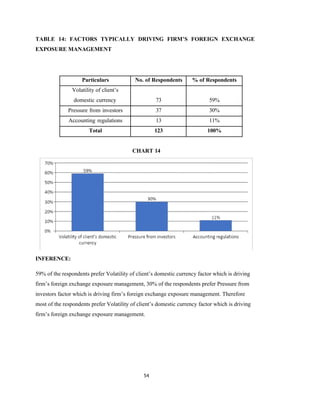
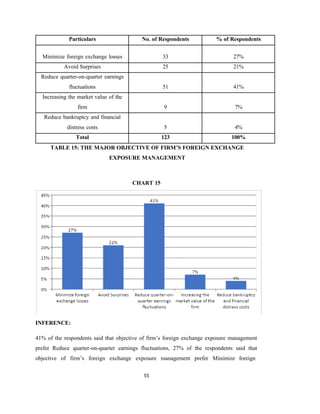
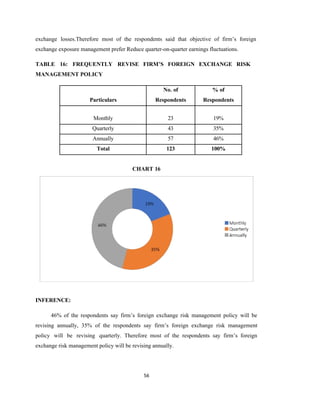
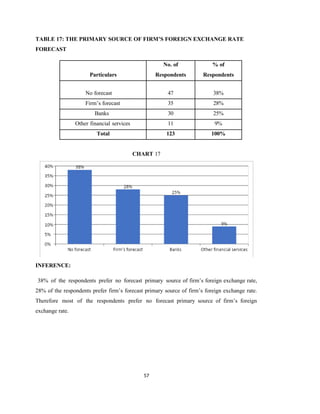
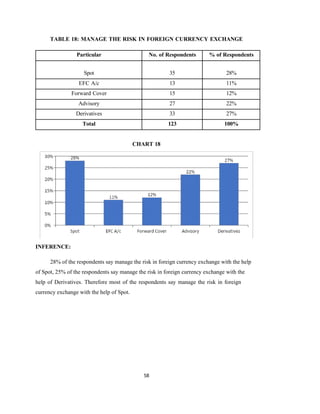
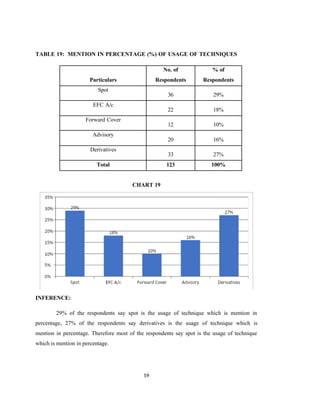
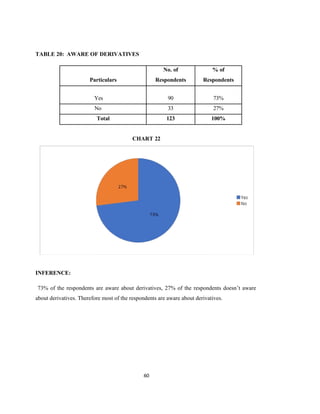
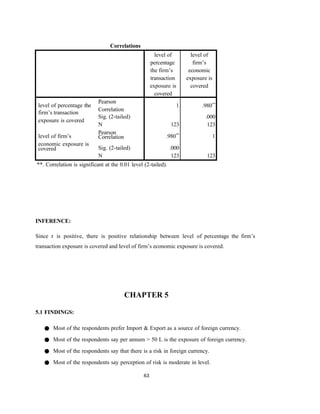

![69
3) Gender
a) Male b) Female c) Not prefer to say
4. What is your source of foreign currency?
Import & Export [
Only Import [
Only Export [
Others….......................(Specify) [
5. What will be your exposure of your foreign currency per annum?
1 L [
L - 25 L [
25 L - 50 L [
50 L [
6. Do you think there is any risk in foreign currency?
7. If yes, what
Very high [
High [
Moderate [
Low [
Very low [
8. Had you ever incurred any loss on foreign currency exchange?
Yes[ ]
No [ ]
9. How often does your firm manage transaction exposure?
All the times [ ]
Yes
No
[
[
]
]
will be your level of perception of risk?](https://image.slidesharecdn.com/foeignexchangerm-250424151058-e9f551d9/85/Foeign-exchange-RM-docx-Mba-Project-pdf-79-320.jpg)
![70
Sometimes [ ]
Never [ ]
10. Which of the following methods do you use to forecast your firm’s likely future foreign
exchange exposures?
11. How often
All the times [ ]
Sometimes [ ]
Never [ ]
12. What are the major types of exposure identified by your firm?
Translation [ ]
Transaction [ ]
Economic exposure [ ]
13. Which of the following statements best represents your firm’s policy on transaction
exposure?
Leave transaction exposure uncovered [ ]
Cover all transaction exposures [ ]
Take a view on foreign exchange rates and cover or leave transaction
exposure uncovered, depending on view [ ]
No Particular Policy [ ]
14. Which of the following statements best represents your firm’s policy on economic
exposure?
Leave economic exposure uncovered [ ]
Cover all economic exposures [ ]
Take a view on foreign exchange rates and cover or leave economic
Forecast using the contracts [ ]
Forecast using Orders [ ]
Cash forecast by currency [ ]
Balance sheet/Income forecast [ ]
Informal method [ ]
does your firm manage economic exposure?](https://image.slidesharecdn.com/foeignexchangerm-250424151058-e9f551d9/85/Foeign-exchange-RM-docx-Mba-Project-pdf-80-320.jpg)
![71
exposure uncovered, depending on view [ ]
No Particular Policy [ ]
15. What percentage of your firm’s transaction exposure is usually covered?
Nil [ ]
Up to 25% [ ]
Greater than 25% - 50% [ ]
Greater than 50% - 75% [ ]
Greater than 75% [ ]
16. What percentage of your firm’s economic exposure is covered?
Nil [ ]
Up to 25% [ ]
Greater than 25% - 50% [ ]
Greater than 50% - 75% [ ]
Greater than 75% [ ]
17. Identify factors typically driving your firm’s Foreign Exchange Exposure Management?
Volatility of client’s domestic currency [ ]
Pressure from investors [ ]
Accounting regulations [ ]
18. What is the major objective of your firm’s Foreign Exchange Exposure Management?
Minimize foreign exchange losses [ ]
Avoid Surprises [ ]
Reduce quarter-on-quarter earnings fluctuations [ ]
Increasing the market value of the firm [ ]
Reduce bankruptcy and financial distress costs [ ]
19. How frequently do you revise your firm’s foreign exchange risk management policy?
Monthly [ ]
Quarterly [ ]
Annually [ ]](https://image.slidesharecdn.com/foeignexchangerm-250424151058-e9f551d9/85/Foeign-exchange-RM-docx-Mba-Project-pdf-81-320.jpg)
![72
20. What is the primary source of your firm’s foreign exchange rate forecast?
No forecast [ ]
Firm’s forecast [ ]
Banks [ ]
Other financial services [ ]
21. How do you manage the risk in foreign currency exchange?
Spot
EFC A/c [
[
]
]
Forward Cover [ ]
Advisory [ ]
Derivatives [ ]
22. Are you aware of Derivatives (optional)?
Yes [ ]
No [ ]
23. If yes, how it is when compare to other techniques?
Excellent [ ]
Very Good [ ]
Good [ ]
Fair [ ]
Poor [ ]](https://image.slidesharecdn.com/foeignexchangerm-250424151058-e9f551d9/85/Foeign-exchange-RM-docx-Mba-Project-pdf-82-320.jpg)


