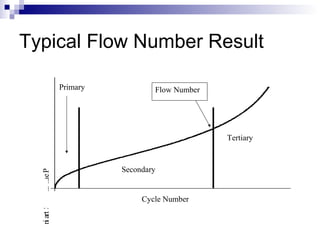
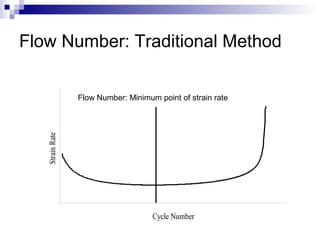
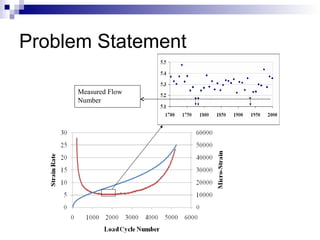
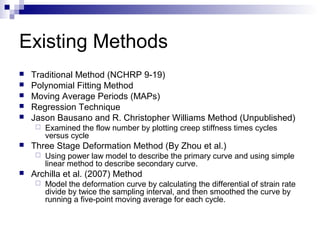
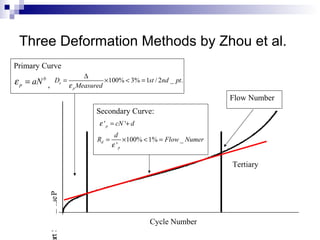
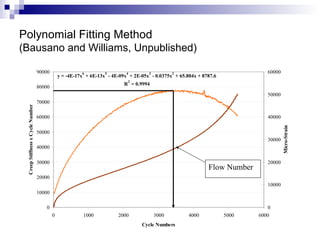
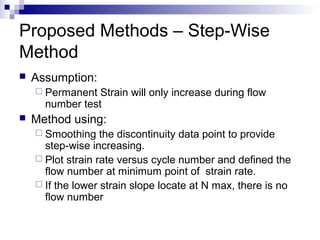
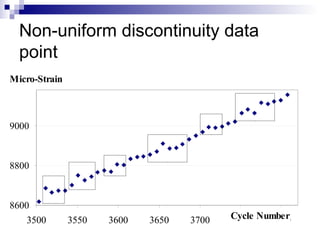
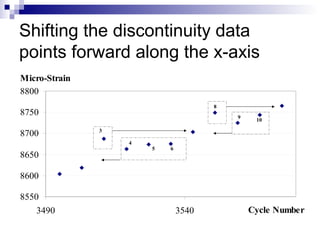
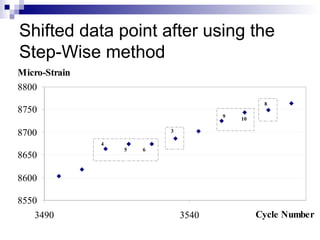
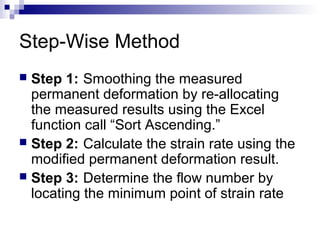
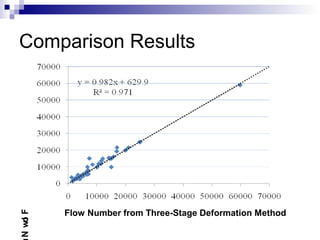
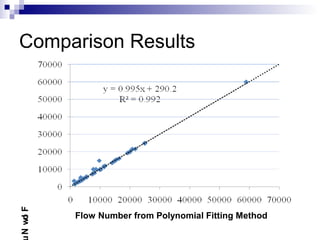
This document discusses flow in parallel pipes and provides examples of calculating flow rates and pressure drops in multi-pipe systems. It includes:
1) An overview of the Bernoulli equation and how it is used to calculate pressure drops and flow rates in pipes.
2) An example problem calculating the flow rate in one pipe and how it changes when adding a second parallel pipe.
3) Additional example problems involving complex pipe networks with multiple branches, calculating flow rates, pressures, and the power required to pump fluid through the system.
This progress report summarizes work on a sewer pipe model using a dynamic wave approach. The model uses the complete dynamic wave method to solve the Saint Venant equations for unsteady flow in open channels. A finite difference scheme with the Preissmann four-point implicit method is used to solve the governing equations numerically. Sensitivity analyses were conducted to analyze the effects of varying the spatial and temporal discretization steps (Δx and Δt) on the model results.
This document provides an overview and examples of seepage analysis through soils. It begins by defining key concepts like Darcy's law, which describes water flow through porous media. It then discusses how to formulate seepage as a boundary value problem by defining geometry, boundary conditions, and the governing equation. The document provides examples of using finite element methods to solve example problems, producing results like flow nets, water pressures, and forces. It also covers topics like anisotropic permeability and comparing isotropic and anisotropic cases.
Determination of co efficient of consolidation methodParth Joshi
This document discusses two methods for determining the coefficient of consolidation (Cv) of soil through consolidation testing: the square root of time fitting method and the logarithm of time fitting method. The square root of time fitting method involves plotting dial readings versus the square root of time to obtain Cv. The logarithm of time fitting method involves plotting dial readings versus the log of time and using the 50% consolidation point to calculate Cv based on drainage path and time.
Maquinaria pesada y movimientos de tierras. Problemas de rendimientoDerekRamos8
The document provides 4 examples calculating the productivity or performance of different construction equipment, including a tractor, excavator, bulldozer, and road grader. It gives the specifications and calculations for each machine, solving for metrics like cycle time and cubic meters or kilometers covered per hour. The goal is to understand the productivity of equipment under different operating conditions and parameters.
1) The document discusses three methods for finding an initial basic feasible solution to transportation problems: the North-West Corner method, Least Cost/Matrix Minimum method, and Vogel's Approximation Method.
2) The North-West Corner method works by sequentially filling cells beginning from the northwest corner based on minimum supply or demand values.
3) The Least Cost method selects the cell with the minimum unit cost and allocates the maximum possible units to it, eliminating satisfied rows and columns until complete.
4) Vogel's Approximation Method identifies row and column penalties based on cost differences and sequentially fills the cell in the row or column with the largest penalty.
This document summarizes the square root of time fitting method for determining the coefficient of consolidation from consolidation test results. The method involves plotting dial readings versus the square root of time, drawing a tangent line to the early portion, extending this line to intersect the 1.15 times line to determine the time for 90% consolidation, and using this to calculate the coefficient of consolidation. One drawback is that the method assumes soil properties remain constant during consolidation when they actually change.
The document summarizes a strength calculation for 4 socket head screws (M4x16 8.8) used to secure a circulator pump. It calculates that with a maximum pressure of 6 bar and surface area of 0.002025 m^2, the maximum force on the bolts would be 11,451 N or 2.863 kN. This force would be divided evenly among the 4 bolts, coming out to around 3-5 kN of tension per bolt, which is within specifications according to tension tables for M4 bolts. Therefore, the document determines that the bolts chosen were suitable for the application.
Cross-validation is a technique used to evaluate machine learning models by reserving a portion of a dataset to test the model trained on the remaining data. There are several common cross-validation methods, including the test set method (reserving 30% of data for testing), leave-one-out cross-validation (training on all data points except one, then testing on the left out point), and k-fold cross-validation (randomly splitting data into k groups, with k-1 used for training and the remaining group for testing). The document provides an example comparing linear regression, quadratic regression, and point-to-point connection on a concrete strength dataset using k-fold cross-validation. SPSS output for the
Incremental Volumetric Remapping Method - Analysis and Error EvaluationAntónio J. Baptista
This document analyzes and evaluates the error of an incremental volumetric remapping method. Two tests are performed: 1) remapping of rotated circular meshes, and 2) remapping between meshes with different discretizations. The incremental volumetric remapping method achieves very low and stable error even with increasing remapping operations, with better accuracy-computation efficiency tradeoff compared to extrapolation-interpolation and moving least squares interpolation methods. The incremental volumetric remapping method is concluded to be reliable and robust for critical remapping situations.
1) The document describes an experiment to test three machining coolants - Quakercool750-TP, Quakercool2776, and QuakercoolSH-720 - by measuring the torsional force during tapping of holes in 4140 steel blocks.
2) Statistical analysis found a significant difference in mean torsional force only between Quakercool2776 and QuakercoolSH-720.
3) Quakercool750-TP showed the strongest linear relationship to tool wear, but overall trends were lacking due to insufficient tool wear over the tests. Allowing taps to wear out fully could provide better analysis of coolant performance.
Study of different flows over typical bodies by FluentRajibul Alam
This document summarizes numerical simulations of inviscid and viscous flows over wedges and flat plates. For inviscid flow over a wedge, the governing equations are presented and solved analytically and numerically for Mach numbers of 3 and 5. Numerical solutions match analytical results closely after mesh refinement. For viscous flow over a flat plate, the boundary layer equations are derived and Blasius' analytical solution is summarized, providing the velocity profile as a function of similarity variable.
This document describes a project to design and build a model that demonstrates kinematics in tangential and normal coordinates. The student aims to apply error calculations, analyze physical variables like position, velocity, and acceleration, and construct the equation that defines the particle's trajectory. Experimental data is collected from the model over 10 trials and calculations are shown to determine values like final position, velocity, and accelerations (normal, centrifugal, tangential, and total). Conclusions state that the model successfully analyzed the tangential and normal components of motion and applied error theory to determine average revolutions. Characteristics distinguishing uniform and accelerated circular motion are also described.
1. The document introduces support vector machines (SVM) and provides a friendly introduction through a series of videos.
2. It explains the SVM algorithm which starts with a line and two parallel lines, picks a learning rate and number of repetitions, then moves the lines to correctly classify points while keeping the margin between the lines as large as possible.
3. Different error functions for SVM are discussed, including classification error, margin error, and focusing on minimizing their sum. The C parameter allows balancing focusing on margin versus classification.
This document provides an overview of vectoring basics for electricity meters. It discusses the key concepts of potential, current, and torque in vector diagrams. It also outlines the steps for vectoring different meter types, including drawing system and meter vectors and applying rules around forward torque and reversed current coils. Specific examples are provided for forming vectors for three-element meters in wye and delta configurations.
This document provides an outline for a course on rheology theory and applications. The course covers basics of rheology including definitions, types of rheometers, instrumentation, geometries, calibration, flow and oscillation tests, and applications. Specific topics include viscosity, linear viscoelasticity, transient testing, polymers, structured fluids, and advanced accessories. Rheology is introduced as the study of stress-deformation relationships in materials. Common geometries like parallel plates, cone and plate, and concentric cylinders are described along with considerations for choosing geometry size.
Missing Parts I don’t think you understood the assignment.docxannandleola
Missing Parts:
I don’t think you understood the assignment. I am looking at it, all I see is where you entered
SAS codes and then that’s it. These SAS codes you inputted, I’d like to see some results, such as
these things I am about to mention:
Part I)
1. (2 pts.) Import the data into your software. Be sure to check that your data looks
exactly like the original data before proceeding! 2. (2 pts.) For BOTH of your
original quantitative variables, create TWO categorized versions based upon cutoffs
of your choice. One binary version and one multi-level version with 3-5 groups. Use
numbers for the new variables to represent the groups. No group should have less
than 10% of the overall sample. Be sure you define your groups so that they do not
overlap and you do not miss any observations. • In SPSS this can be done using
TRANSFORM and RECODE INTO DIFFERENT VARIABLE. • In SAS you need
to use a DATA step with IF-THEN statements to create the new variables. 3. (2 pts.)
Create translations which provide the range of values for the variables created in
Question 3. • In SPSS this is done in the variable view using the “Values” column. •
In SAS you need to create the formats using PROC FORMAT and then assign those
formats to the appropriate variables using a DATA step. 4. (3 pts.) Label all
variables with descriptive titles. • In SPSS this is done in the variable view using the
“Label” column. • In SAS you need to use a DATA step which includes a LABEL
statement.
All the codes I’m looking at, I didn’t need to see them, I expect to see them in a table. I’ve
similar exercises, and that’s not how they look.
PART II)
Part 2: Descriptive Summary of Each Variable 5. (6 pts.) Calculate the sample size, sample
mean, sample median, sample standard deviation, min, max, Q1, Q3, and 95% confidence
interval for the population mean for your two quantitative variables. Provide the software
output containing these results in your solution. 6. (6 pts.) Construct a histogram, boxplot,
and QQ-plot for your two quantitative variables. Provide only the graphs in your solution.
7. (8 pts.) Construct a frequency table for each of the four variables created in Question 3.
8. (6 pts.) Provide a brief discussion of the distribution of your two main variables using as
much of the information in Questions 5-7 as possible (and yet remain as concise as
possible).
Where did you do all these calculations; I didn’t see anything. I did see a histogram, that’s all I
saw. Where’s the box plot, QQ plot, there was no graph. Also, you didn’t provide any discussion.
PART III)
Part 3: Case QQ - Using the two quantitative variables 9. (2 pts.) Construct a scatterplot.
Provide only this plot in your solution. 10. (2 pts.) Regardless of whether it is appropriate,
calculate Pearson’s correlation coefficient. Provide the output containing the estimate and
the p-value. 11. (3 pts.) Regardless of whether it is a ...
SERENE 2014 Workshop: Paper "Verification and Validation of a Pressure Contro...SERENEWorkshop
SERENE 2014 - 6th International Workshop on Software Engineering for Resilient Systems
http://serene.disim.univaq.it/
Session 3: Verification and Validation
Paper 1: Verification and Validation of a Pressure Control Unit for Hydraulic Systems
Pressure research in kriss tilt effect 04122018 ver1.67Gigin Ginanjar
The document discusses tilt effects in high pressure pressure balances up to 500 MPa. It analyzes absolute and relative tilt effects through theoretical approaches, 2D and 3D FEA simulations, and experiments. The theoretical approach shows tilt can cause a change in effective area of around 3 ppm for 500 MPa balances and 1 ppm for 100 MPa balances. FEA simulations in perpendicular and tilted conditions were performed to investigate piston tilt effects on pressure distribution and effective area calculations. Experiments on various pressure balances showed 100 MPa balances follow a cosine behavior with tilt, while 500 MPa balances deviate more from ideal behavior.
WaReS is a code developed by Marine Analytica to calculate loads and responses of floating structures. This memo presents an extract of the verification report.
This document summarizes a post graduate diploma project on an electric vehicle suspension system using magnetorheological (MR) dampers. It describes the components and working of an MR damper, including the MR fluid, solenoid, and controlling solenoid current. It presents a Bouc-Wen mathematical model of the damper and uses a genetic algorithm to determine model parameters. Experimental results at different frequencies and currents are shown and agree with simulations. Tuning the current can make the system behave as underdamped, critically damped or overdamped for vibration control.
This document contains lecture notes on kinematics in one dimension, including key concepts like displacement, velocity, acceleration, and motion with constant acceleration.
The notes begin by discussing reference frames and defining coordinate systems used to describe motion. Displacement, average speed, velocity, and acceleration are then defined. Constant acceleration is explored through derivations of equations for displacement, velocity, and time as functions of acceleration. Graphical analysis of motion graphs velocity as the slope of a position-time graph and acceleration as the slope of a velocity-time graph.
Worked examples are provided to demonstrate applying the kinematic equations, including calculating acceleration from changes in velocity over time and solving for time, displacement, and velocity in falling object problems
Quality is defined as customers' perception of how well a product or service meets their expectations. There are three types of quality: quality of design, quality of performance, and quality of conformance. Statistical quality control uses statistical techniques to control, improve, and maintain quality. Control charts are used to determine if a process is in or out of control by monitoring for random or assignable variation. Process capability indices like Cp and Cpk compare process variability to specification limits to determine if a process is capable of meeting specifications.
This document describes an orifice flow calibration experiment conducted by Jessica Catlin, Dylan Helm, and Yen Nguyen. The objective was to develop a model for air flow rates between 0-0.3 SCFM. Data was collected using various equipment and analyzed to determine constants a=0.0575 and b=0.592 for the model Q = a(i - io)b. Testing of the model found errors within ±15.5% and statistical analysis found the mean residual to be insignificant. Uncertainty analysis calculated average error to be 0.00941 SCFM. The document concludes there may be unknown errors from volume measurements and operating limits.
Webinar: How to design express services on a bus transit networkBRTCoE
The document discusses express service design on bus transit networks. It proposes a methodology involving three steps: 1) optimizing frequencies ignoring capacity constraints, 2) generating express services for each route using corridor-based heuristics, and 3) solving the full network problem with capacity constraints. Testing on sample networks found the approach produced solutions with up to 10.3% lower social costs compared to baseline scenarios. The approach dynamically generates express services and optimizes frequencies to balance operator costs, user costs and capacity limits across the entire network.
This document presents a simplified model predictive control methodology for a three-phase four-leg voltage source inverter (VSI). Compared to traditional three-leg VSIs, four-leg VSIs increase possible switch states from 8 to 16. The proposed method uses a three-dimensional space vector pulse width modulation technique to preselect 5 out of the 16 possible voltage vectors. A discrete-time model of the future reference voltage vector is used to predict future load current movements. The position of this vector is then used to select the 5 preselected vectors at each sampling period. This reduces computational load compared to evaluating all 16 vectors, while maintaining performance. Simulation results demonstrate the effectiveness of the proposed predictive control methodology.
Fundamentals of vibration_measurement_and_analysis_explainedvibratiob
The document discusses fundamentals of vibration measurement and analysis. It begins by explaining how measurement and analysis has been improved by microprocessors but the basic processes remain unchanged. It then covers basics of vibration including relationships between displacement, velocity, acceleration. It discusses measuring vibration using accelerometers and calculating overall values and frequency spectra. Finally it discusses concepts like resonance, damping, and natural frequencies and how understanding these fundamentals is important for vibration analysis and fault diagnosis.
Skymind is a company that provides deep learning tools and services to help enterprises extract value from their data. Their flagship product is Deeplearning4j, an open-source deep learning library for Java and Scala that can be used on distributed systems. Skymind also offers consulting services and training to help companies develop and deploy deep learning models for tasks like computer vision, natural language processing, and fraud detection. Their goal is to make advanced deep learning techniques accessible and useful for businesses.
The document discusses the benefits of exercise for mental health. Regular physical activity can help reduce anxiety and depression and improve mood and cognitive functioning. Exercise causes chemical changes in the brain that may help boost feelings of calmness, happiness and focus.
Warm Mix Asphalt - Paving the Green WayShu Wei Goh
Field Evaluation of Warm Mix Asphalt - A technology that allowed the producers of Hot-Mix Asphalt (HMA) pavement material to lower the temperatures at which the material is mixed and placed on the road.
Unlock the Future of Search with MongoDB Atlas_ Vector Search Unleashed.pdfMalak Abu Hammad
Discover how MongoDB Atlas and vector search technology can revolutionize your application's search capabilities. This comprehensive presentation covers:
* What is Vector Search?
* Importance and benefits of vector search
* Practical use cases across various industries
* Step-by-step implementation guide
* Live demos with code snippets
* Enhancing LLM capabilities with vector search
* Best practices and optimization strategies
Perfect for developers, AI enthusiasts, and tech leaders. Learn how to leverage MongoDB Atlas to deliver highly relevant, context-aware search results, transforming your data retrieval process. Stay ahead in tech innovation and maximize the potential of your applications.
#MongoDB #VectorSearch #AI #SemanticSearch #TechInnovation #DataScience #LLM #MachineLearning #SearchTechnology
Climate Impact of Software Testing at Nordic Testing DaysKari Kakkonen
My slides at Nordic Testing Days 6.6.2024
Climate impact / sustainability of software testing discussed on the talk. ICT and testing must carry their part of global responsibility to help with the climat warming. We can minimize the carbon footprint but we can also have a carbon handprint, a positive impact on the climate. Quality characteristics can be added with sustainability, and then measured continuously. Test environments can be used less, and in smaller scale and on demand. Test techniques can be used in optimizing or minimizing number of tests. Test automation can be used to speed up testing.
Programming Foundation Models with DSPy - Meetup SlidesZilliz
Prompting language models is hard, while programming language models is easy. In this talk, I will discuss the state-of-the-art framework DSPy for programming foundation models with its powerful optimizers and runtime constraint system.
“An Outlook of the Ongoing and Future Relationship between Blockchain Technologies and Process-aware Information Systems.” Invited talk at the joint workshop on Blockchain for Information Systems (BC4IS) and Blockchain for Trusted Data Sharing (B4TDS), co-located with with the 36th International Conference on Advanced Information Systems Engineering (CAiSE), 3 June 2024, Limassol, Cyprus.
In his public lecture, Christian Timmerer provides insights into the fascinating history of video streaming, starting from its humble beginnings before YouTube to the groundbreaking technologies that now dominate platforms like Netflix and ORF ON. Timmerer also presents provocative contributions of his own that have significantly influenced the industry. He concludes by looking at future challenges and invites the audience to join in a discussion.
Unlocking Productivity: Leveraging the Potential of Copilot in Microsoft 365, a presentation by Christoforos Vlachos, Senior Solutions Manager – Modern Workplace, Uni Systems
Cosa hanno in comune un mattoncino Lego e la backdoor XZ?Speck&Tech
ABSTRACT: A prima vista, un mattoncino Lego e la backdoor XZ potrebbero avere in comune il fatto di essere entrambi blocchi di costruzione, o dipendenze di progetti creativi e software. La realtà è che un mattoncino Lego e il caso della backdoor XZ hanno molto di più di tutto ciò in comune.
Partecipate alla presentazione per immergervi in una storia di interoperabilità, standard e formati aperti, per poi discutere del ruolo importante che i contributori hanno in una comunità open source sostenibile.
BIO: Sostenitrice del software libero e dei formati standard e aperti. È stata un membro attivo dei progetti Fedora e openSUSE e ha co-fondato l'Associazione LibreItalia dove è stata coinvolta in diversi eventi, migrazioni e formazione relativi a LibreOffice. In precedenza ha lavorato a migrazioni e corsi di formazione su LibreOffice per diverse amministrazioni pubbliche e privati. Da gennaio 2020 lavora in SUSE come Software Release Engineer per Uyuni e SUSE Manager e quando non segue la sua passione per i computer e per Geeko coltiva la sua curiosità per l'astronomia (da cui deriva il suo nickname deneb_alpha).
Goodbye Windows 11: Make Way for Nitrux Linux 3.5.0!SOFTTECHHUB
As the digital landscape continually evolves, operating systems play a critical role in shaping user experiences and productivity. The launch of Nitrux Linux 3.5.0 marks a significant milestone, offering a robust alternative to traditional systems such as Windows 11. This article delves into the essence of Nitrux Linux 3.5.0, exploring its unique features, advantages, and how it stands as a compelling choice for both casual users and tech enthusiasts.
Communications Mining Series - Zero to Hero - Session 1DianaGray10
This session provides introduction to UiPath Communication Mining, importance and platform overview. You will acquire a good understand of the phases in Communication Mining as we go over the platform with you. Topics covered:
• Communication Mining Overview
• Why is it important?
• How can it help today’s business and the benefits
• Phases in Communication Mining
• Demo on Platform overview
• Q/A
In the rapidly evolving landscape of technologies, XML continues to play a vital role in structuring, storing, and transporting data across diverse systems. The recent advancements in artificial intelligence (AI) present new methodologies for enhancing XML development workflows, introducing efficiency, automation, and intelligent capabilities. This presentation will outline the scope and perspective of utilizing AI in XML development. The potential benefits and the possible pitfalls will be highlighted, providing a balanced view of the subject.
We will explore the capabilities of AI in understanding XML markup languages and autonomously creating structured XML content. Additionally, we will examine the capacity of AI to enrich plain text with appropriate XML markup. Practical examples and methodological guidelines will be provided to elucidate how AI can be effectively prompted to interpret and generate accurate XML markup.
Further emphasis will be placed on the role of AI in developing XSLT, or schemas such as XSD and Schematron. We will address the techniques and strategies adopted to create prompts for generating code, explaining code, or refactoring the code, and the results achieved.
The discussion will extend to how AI can be used to transform XML content. In particular, the focus will be on the use of AI XPath extension functions in XSLT, Schematron, Schematron Quick Fixes, or for XML content refactoring.
The presentation aims to deliver a comprehensive overview of AI usage in XML development, providing attendees with the necessary knowledge to make informed decisions. Whether you’re at the early stages of adopting AI or considering integrating it in advanced XML development, this presentation will cover all levels of expertise.
By highlighting the potential advantages and challenges of integrating AI with XML development tools and languages, the presentation seeks to inspire thoughtful conversation around the future of XML development. We’ll not only delve into the technical aspects of AI-powered XML development but also discuss practical implications and possible future directions.
HCL Notes und Domino Lizenzkostenreduzierung in der Welt von DLAUpanagenda
Webinar Recording: https://www.panagenda.com/webinars/hcl-notes-und-domino-lizenzkostenreduzierung-in-der-welt-von-dlau/
DLAU und die Lizenzen nach dem CCB- und CCX-Modell sind für viele in der HCL-Community seit letztem Jahr ein heißes Thema. Als Notes- oder Domino-Kunde haben Sie vielleicht mit unerwartet hohen Benutzerzahlen und Lizenzgebühren zu kämpfen. Sie fragen sich vielleicht, wie diese neue Art der Lizenzierung funktioniert und welchen Nutzen sie Ihnen bringt. Vor allem wollen Sie sicherlich Ihr Budget einhalten und Kosten sparen, wo immer möglich. Das verstehen wir und wir möchten Ihnen dabei helfen!
Wir erklären Ihnen, wie Sie häufige Konfigurationsprobleme lösen können, die dazu führen können, dass mehr Benutzer gezählt werden als nötig, und wie Sie überflüssige oder ungenutzte Konten identifizieren und entfernen können, um Geld zu sparen. Es gibt auch einige Ansätze, die zu unnötigen Ausgaben führen können, z. B. wenn ein Personendokument anstelle eines Mail-Ins für geteilte Mailboxen verwendet wird. Wir zeigen Ihnen solche Fälle und deren Lösungen. Und natürlich erklären wir Ihnen das neue Lizenzmodell.
Nehmen Sie an diesem Webinar teil, bei dem HCL-Ambassador Marc Thomas und Gastredner Franz Walder Ihnen diese neue Welt näherbringen. Es vermittelt Ihnen die Tools und das Know-how, um den Überblick zu bewahren. Sie werden in der Lage sein, Ihre Kosten durch eine optimierte Domino-Konfiguration zu reduzieren und auch in Zukunft gering zu halten.
Diese Themen werden behandelt
- Reduzierung der Lizenzkosten durch Auffinden und Beheben von Fehlkonfigurationen und überflüssigen Konten
- Wie funktionieren CCB- und CCX-Lizenzen wirklich?
- Verstehen des DLAU-Tools und wie man es am besten nutzt
- Tipps für häufige Problembereiche, wie z. B. Team-Postfächer, Funktions-/Testbenutzer usw.
- Praxisbeispiele und Best Practices zum sofortigen Umsetzen
Building Production Ready Search Pipelines with Spark and MilvusZilliz
Spark is the widely used ETL tool for processing, indexing and ingesting data to serving stack for search. Milvus is the production-ready open-source vector database. In this talk we will show how to use Spark to process unstructured data to extract vector representations, and push the vectors to Milvus vector database for search serving.
Let's Integrate MuleSoft RPA, COMPOSER, APM with AWS IDP along with Slackshyamraj55
Discover the seamless integration of RPA (Robotic Process Automation), COMPOSER, and APM with AWS IDP enhanced with Slack notifications. Explore how these technologies converge to streamline workflows, optimize performance, and ensure secure access, all while leveraging the power of AWS IDP and real-time communication via Slack notifications.
Full-RAG: A modern architecture for hyper-personalizationZilliz
Mike Del Balso, CEO & Co-Founder at Tecton, presents "Full RAG," a novel approach to AI recommendation systems, aiming to push beyond the limitations of traditional models through a deep integration of contextual insights and real-time data, leveraging the Retrieval-Augmented Generation architecture. This talk will outline Full RAG's potential to significantly enhance personalization, address engineering challenges such as data management and model training, and introduce data enrichment with reranking as a key solution. Attendees will gain crucial insights into the importance of hyperpersonalization in AI, the capabilities of Full RAG for advanced personalization, and strategies for managing complex data integrations for deploying cutting-edge AI solutions.
How to Get CNIC Information System with Paksim Ga.pptxdanishmna97
Pakdata Cf is a groundbreaking system designed to streamline and facilitate access to CNIC information. This innovative platform leverages advanced technology to provide users with efficient and secure access to their CNIC details.
How to Get CNIC Information System with Paksim Ga.pptx
Fn methods em08
1. A Simple Method to Determine
the Tertiary Flow in Repeated
Load Test: Step-Wise Method
By:
Shu Wei Goh
Zhanping You, P.E.
2. Overview
Introduction of Flow Number
Problem Statement
Existing Methods
Proposed Method
Comparison Results
Conclusions
3. Introduction
What is Flow Number?
The point where the asphalt mixture begin
to deform significantly and the individual
aggregates that make up the skeleton of
the matrix start to “flow” –aggregate slide
through each other
4. Flow Number Test
Typically called flow number test, dynamic creep
test, and repeated load test
0.1s loading
Time (Second)
Stress(kPa)
0.9s dwell
5. Typical Flow Number Result
Primary
Secondary
Tertiary
PermanentStrain
Cycle Number
Flow Number
6. Flow Number: Traditional Method
0
0 Cycle Number
StrainRate
Flow Number: Minimum point of strain rate
8. Existing Methods
Traditional Method (NCHRP 9-19)
Polynomial Fitting Method
Moving Average Periods (MAPs)
Regression Technique
Jason Bausano and R. Christopher Williams Method (Unpublished)
Examined the flow number by plotting creep stiffness times cycles
versus cycle
Three Stage Deformation Method (By Zhou et al.)
Using power law model to describe the primary curve and using simple
linear method to describe secondary curve.
Archilla et al. (2007) Method
Model the deformation curve by calculating the differential of strain rate
divide by twice the sampling interval, and then smoothed the curve by
running a five-point moving average for each cycle.
9. Three Deformation Methods by Zhou et al.
Tertiary
PermanentStr
Cycle Number
Flow Number
Primary Curve
,
b
p aNε = 100% 3% 1 / 2 _ .e
p
D st nd pt
Measuredε
∆
= × < =
Secondary Curve:
' 'p cN dε = +
100% 1% _
'
d
p
d
R Flow Numer
ε
= × < =
11. Proposed Methods – Step-Wise
Method
Assumption:
Permanent Strain will only increase during flow
number test
Method using:
Smoothing the discontinuity data point to provide
step-wise increasing.
Plot strain rate versus cycle number and defined the
flow number at minimum point of strain rate.
If the lower strain slope locate at N max, there is no
flow number
13. Shifting the discontinuity data
points forward along the x-axis
8550
8600
8650
8700
8750
8800
3490 3540 Cycle Number
Micro-Strain
3
4
5 6
8
9
10
14. Shifted data point after using the
Step-Wise method
8550
8600
8650
8700
8750
8800
3490 3540 Cycle Number
Micro-Strain
3
4
5 6
8
9
10
15. Step-Wise Method
Step 1: Smoothing the measured
permanent deformation by re-allocating
the measured results using the Excel
function call “Sort Ascending.”
Step 2: Calculate the strain rate using the
modified permanent deformation result.
Step 3: Determine the flow number by
locating the minimum point of strain rate
18. Conclusions
The proposed approach provides a practical and
consistent method to determine the initiation of tertiary
flow.
The entire non-uniform discontinuity data point can be
easily smoothed using the excel function called “Sort
Ascending.”
The R-square value of 0.971 and 0.992 respectively
were found from the comparison and this indicated that
these methods have showed a good correlation with the
proposed Step-Wise method.