Download as PDF, PPTX
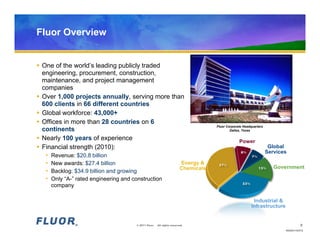
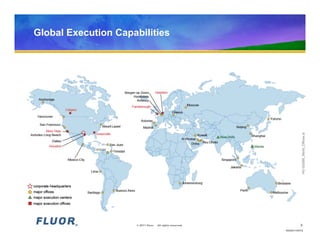
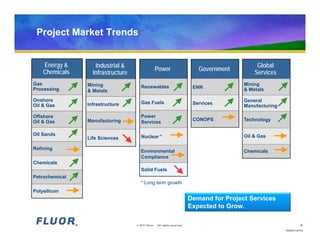
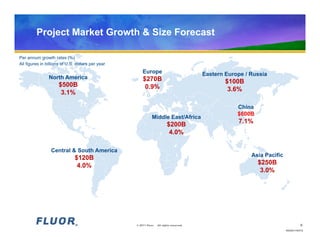

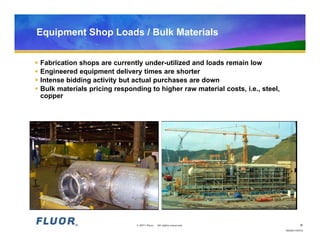
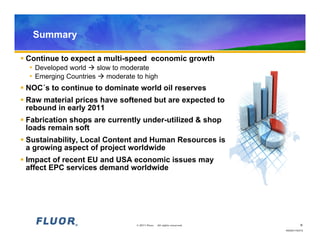

Fluor Corporation is a global engineering and construction firm with over 43,000 employees working on over 1,000 projects annually in 66 countries. The document discusses trends in Fluor's key markets of energy, chemicals, power, and infrastructure. It finds that demand for project services is expected to grow fastest in Asia, the Middle East, and Central and South America at rates of 3-7% annually. While raw material prices have softened in recent months, they are expected to rebound. Fabrication shops currently have spare capacity as project activity remains low.


![Key Banc Conference Final[1]](https://cdn.slidesharecdn.com/ss_thumbnails/keybancconferencefinal1-13422990347422-phpapp02-120714155053-phpapp02-thumbnail.jpg?width=640&height=640&fit=bounds)


