The document outlines the implementation and features of Fluentd, covering its architecture, installation, and testing for MySQL slow query logging and process list logging. It includes detailed instructions on setting up Fluentd and configuring it for specific logging tasks, along with example commands and code snippets. Additionally, it discusses the integration of various plugins to enhance functionality and reliability in log collection.


![Install 18
1. Install
> curl -L https://td-toolbelt.herokuapp.com/sh/install-redhat-td-agent2.sh | sh
2. Start demon
> service td-agent start
Starting td-agent: [ OK ]
> service td-agent status
td-agent (pid 2567) is running
> service td-agent restart
> service td-agent stop
> td-agent --version
td-agent 0.12.12
3. Transfer Sample Log
> curl -X POST -d 'json={"json":"message"}' http://localhost:8888/debug.test.test
> tail -n 1 /var/log/td-agent/td-agent.log
2015-09-10 00:26:31 +0900 debug.test.test: {"json":"message"}](https://image.slidesharecdn.com/fluentd20150918nodemopublic-190322024550/75/Fluentd-20150918-no_demo_public-18-2048.jpg)
![Test 20
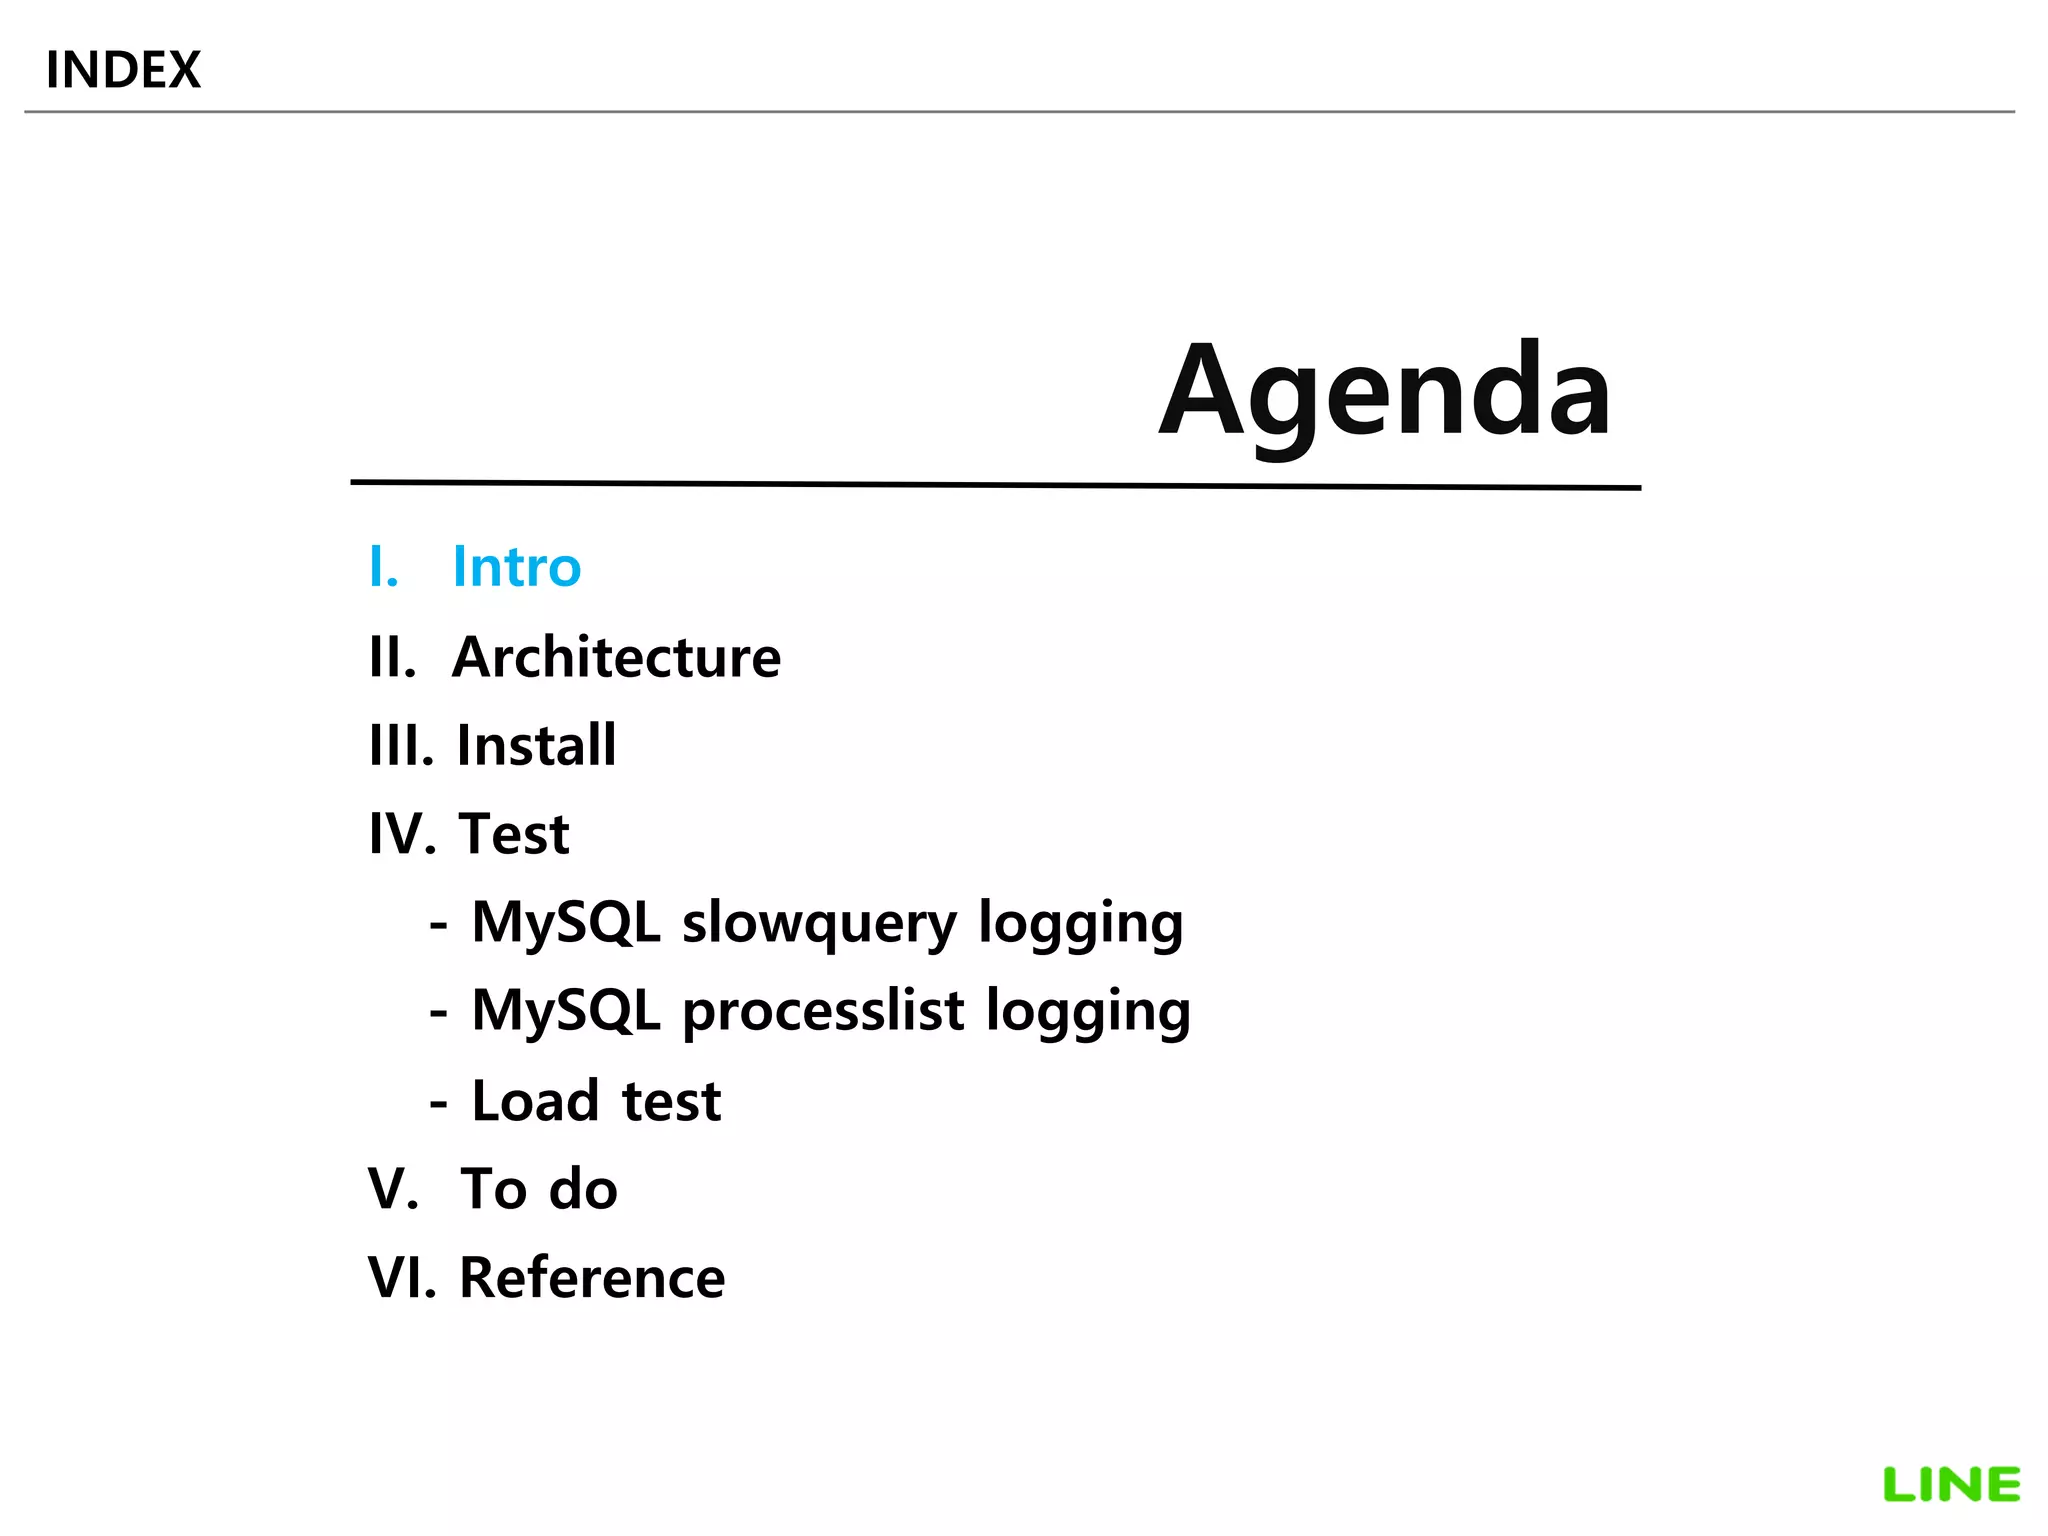
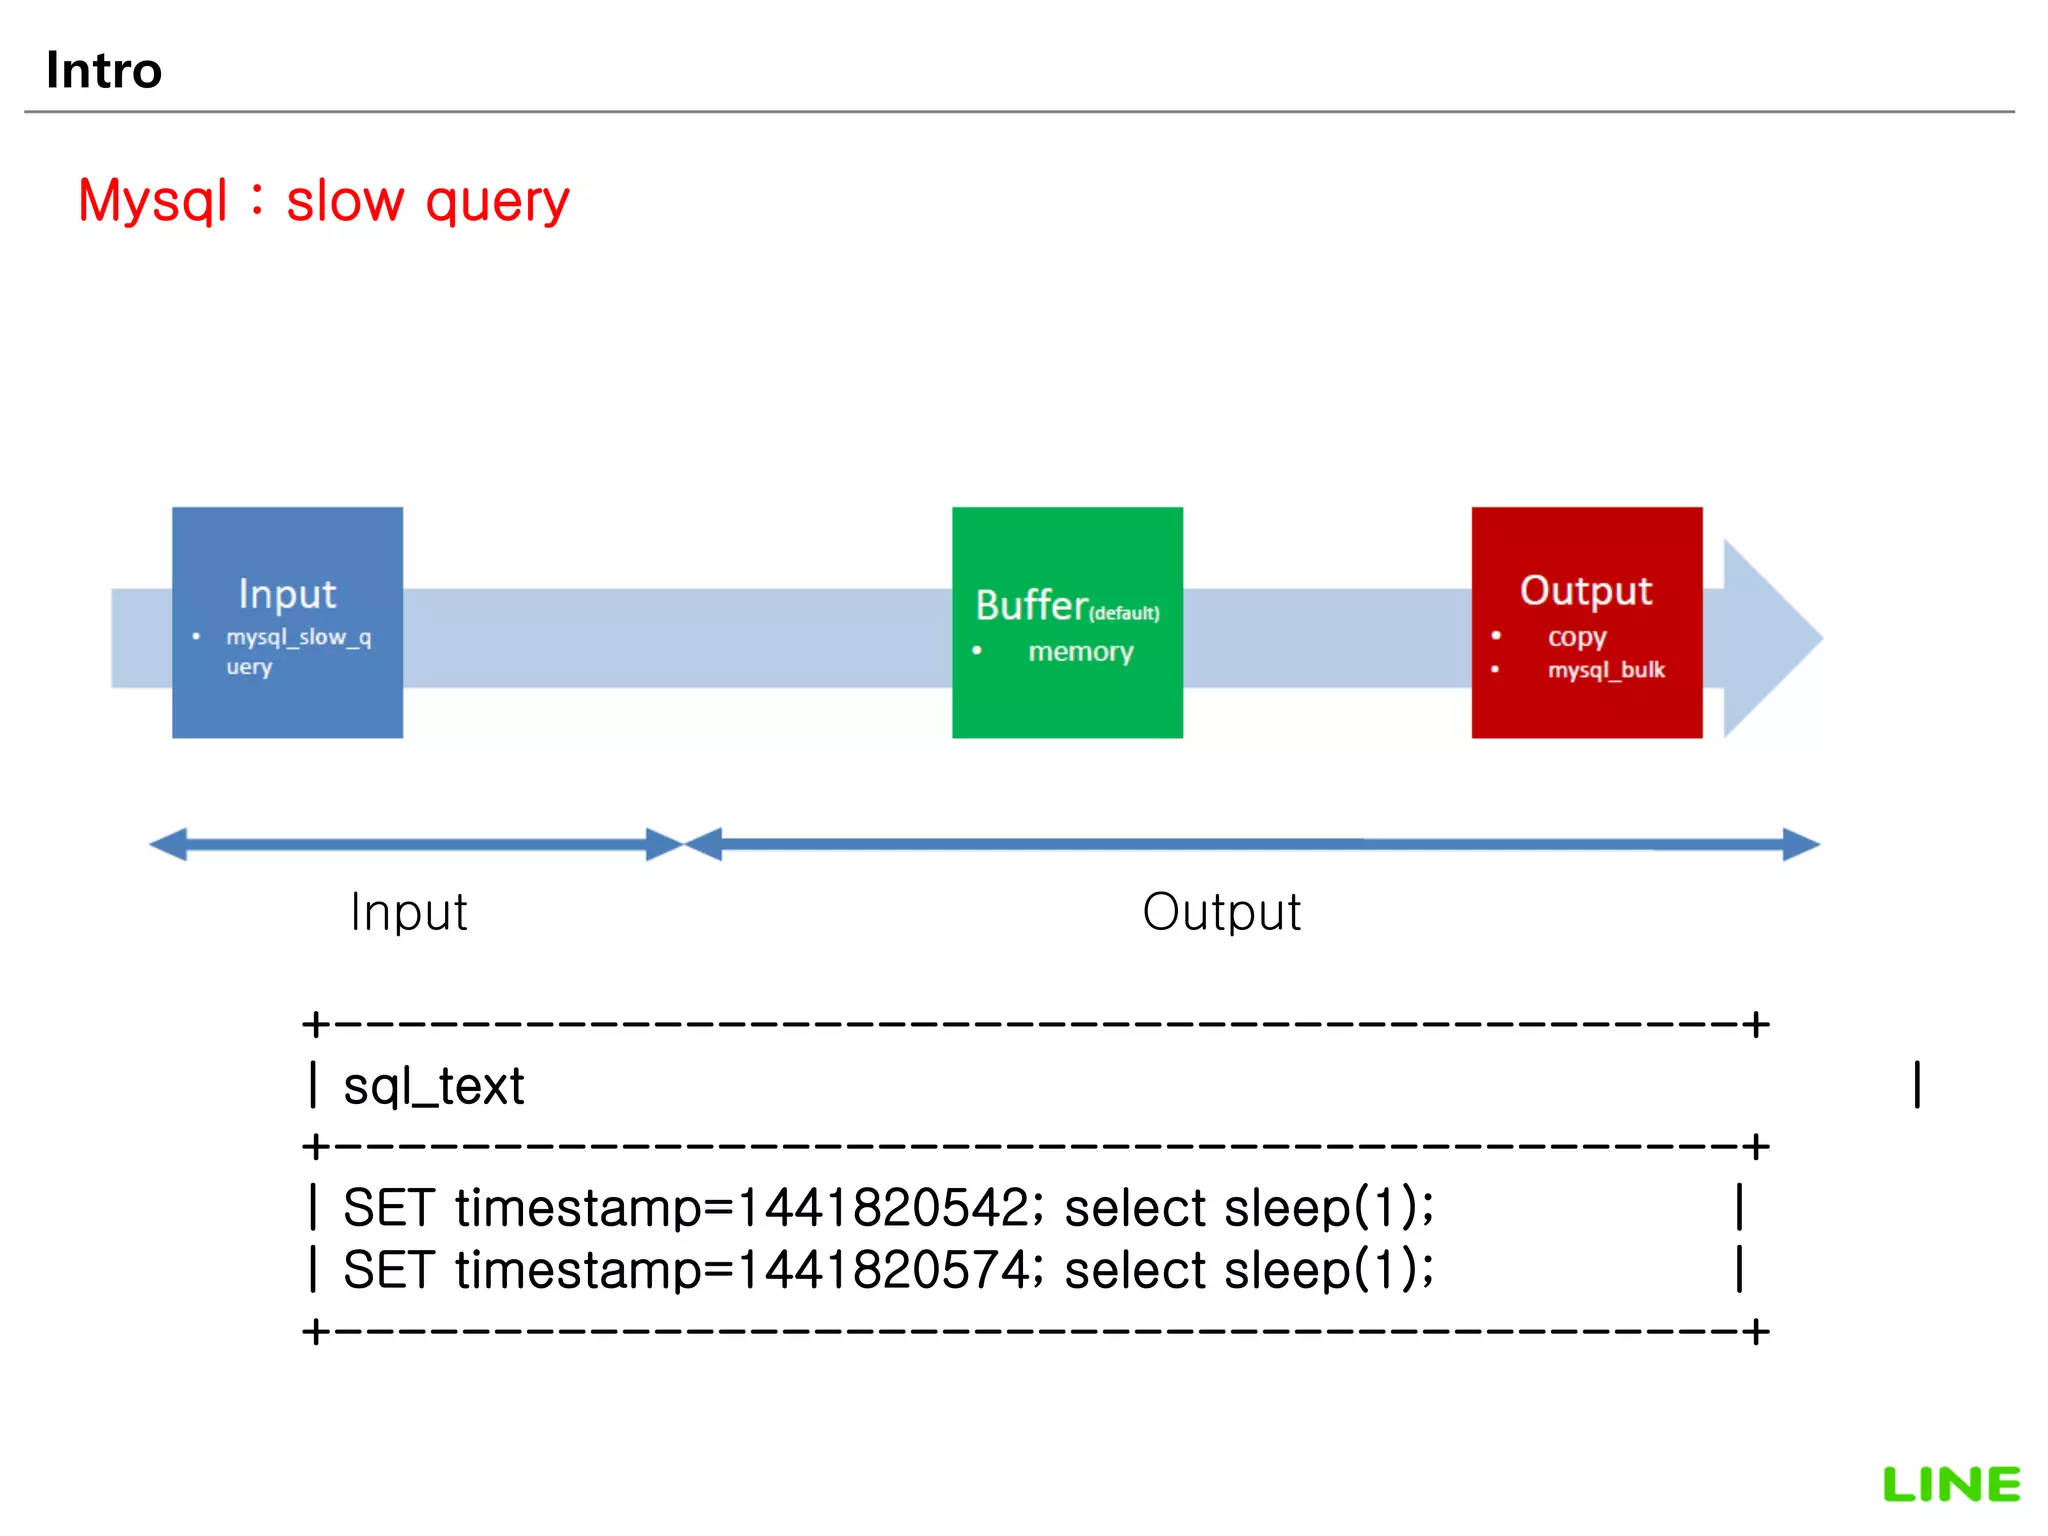
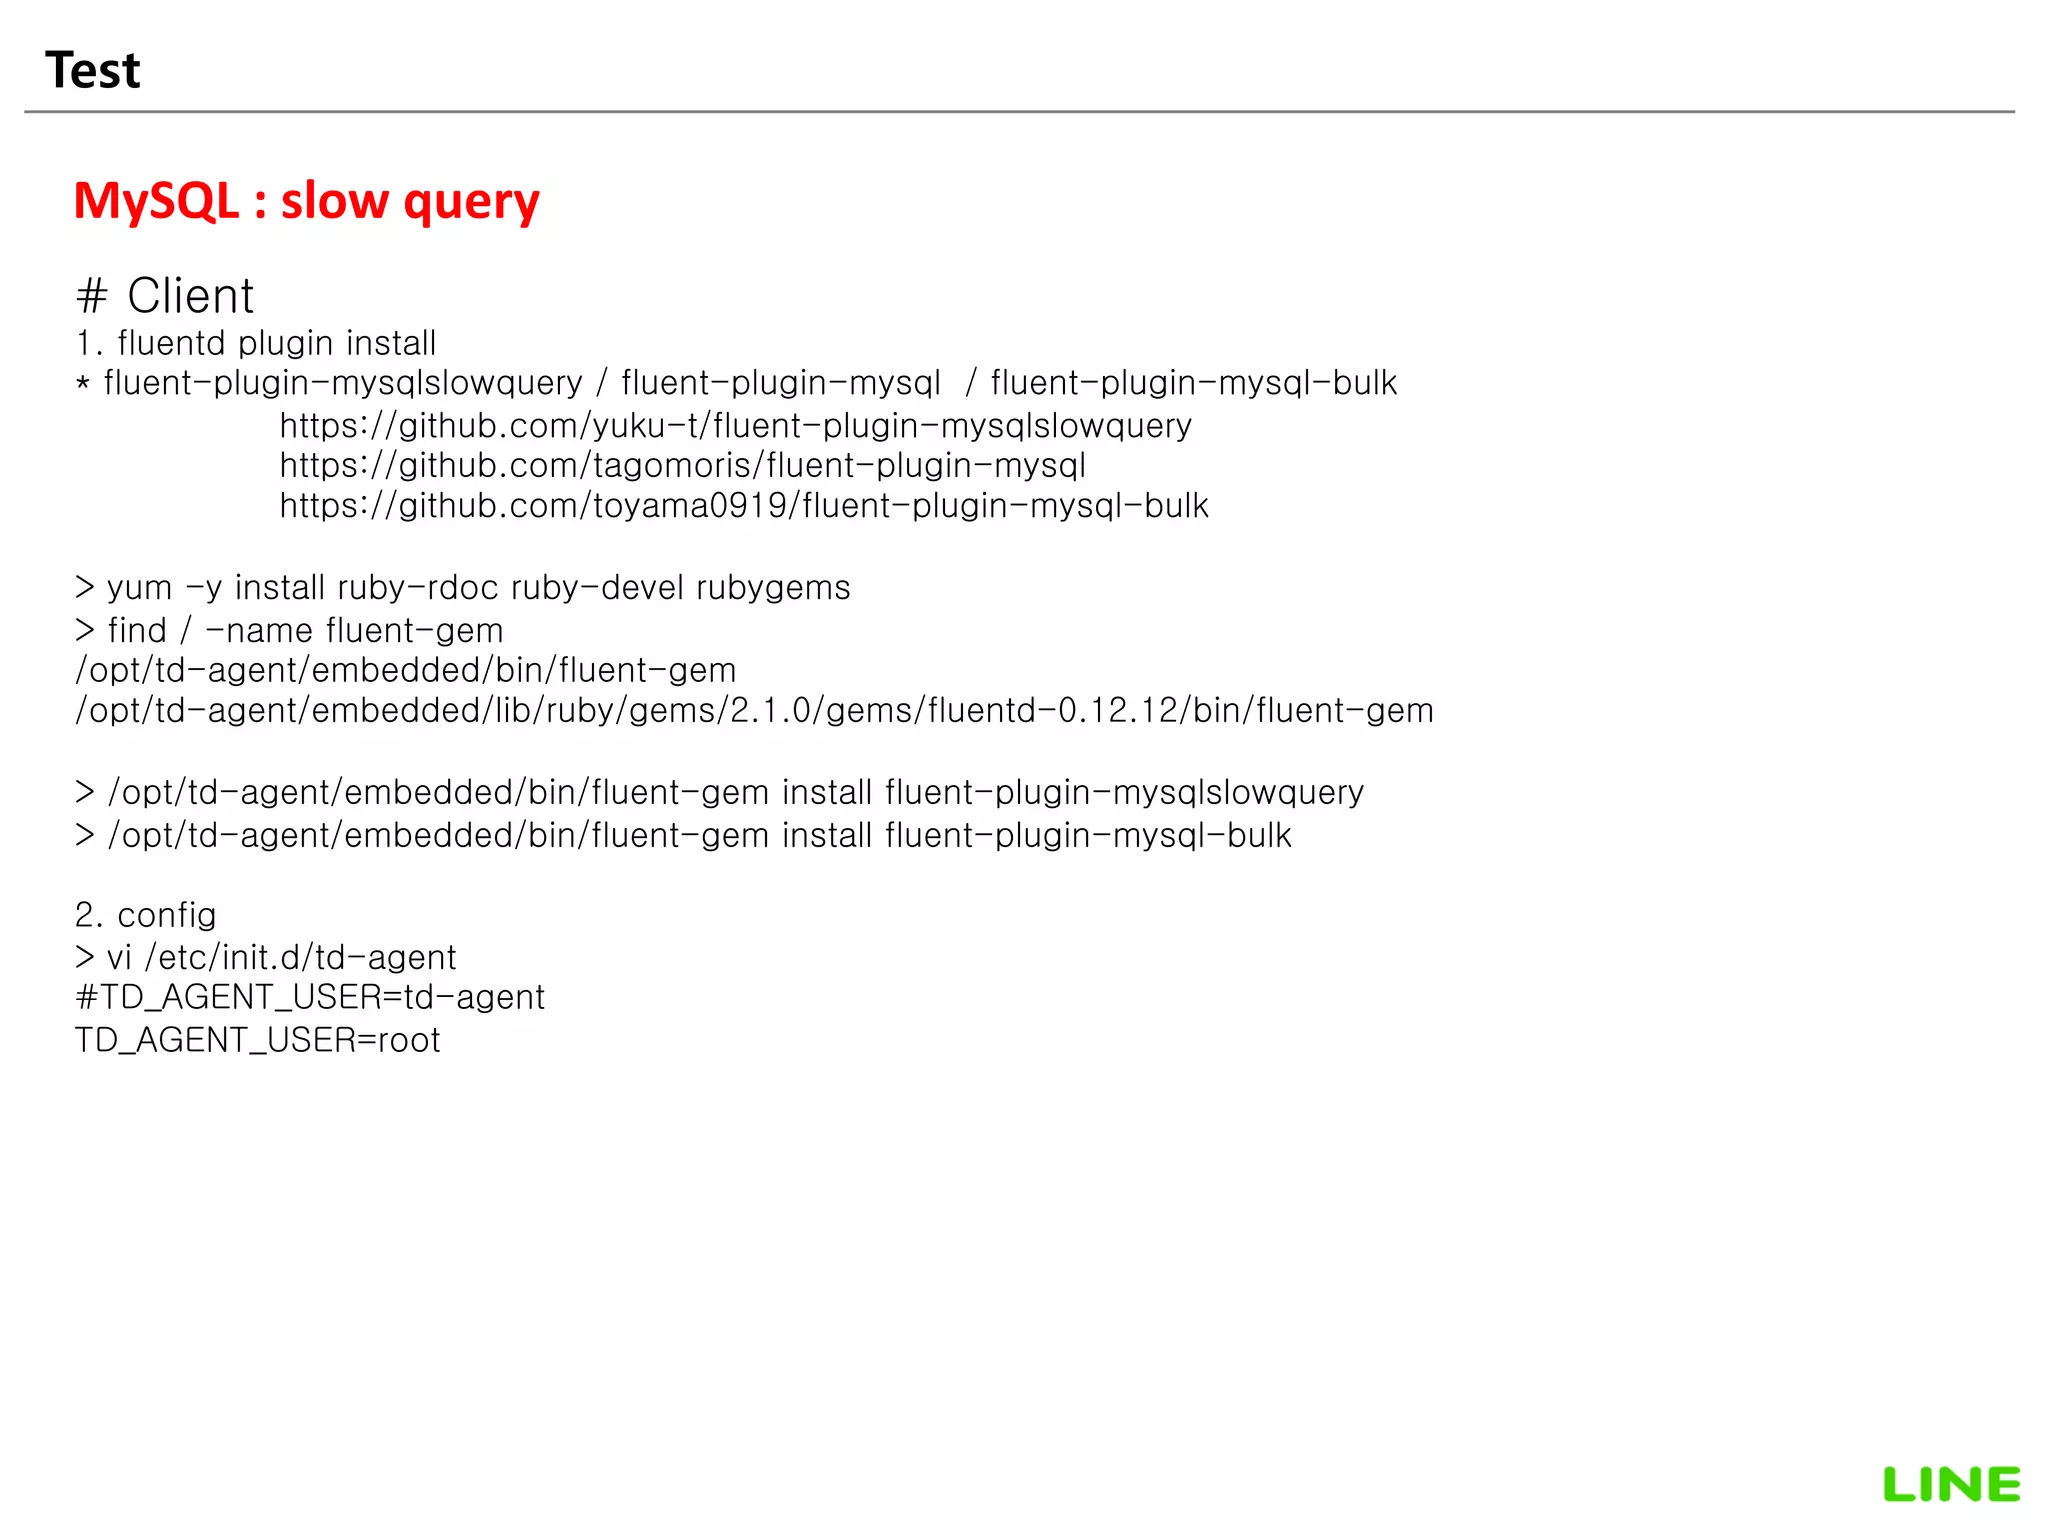
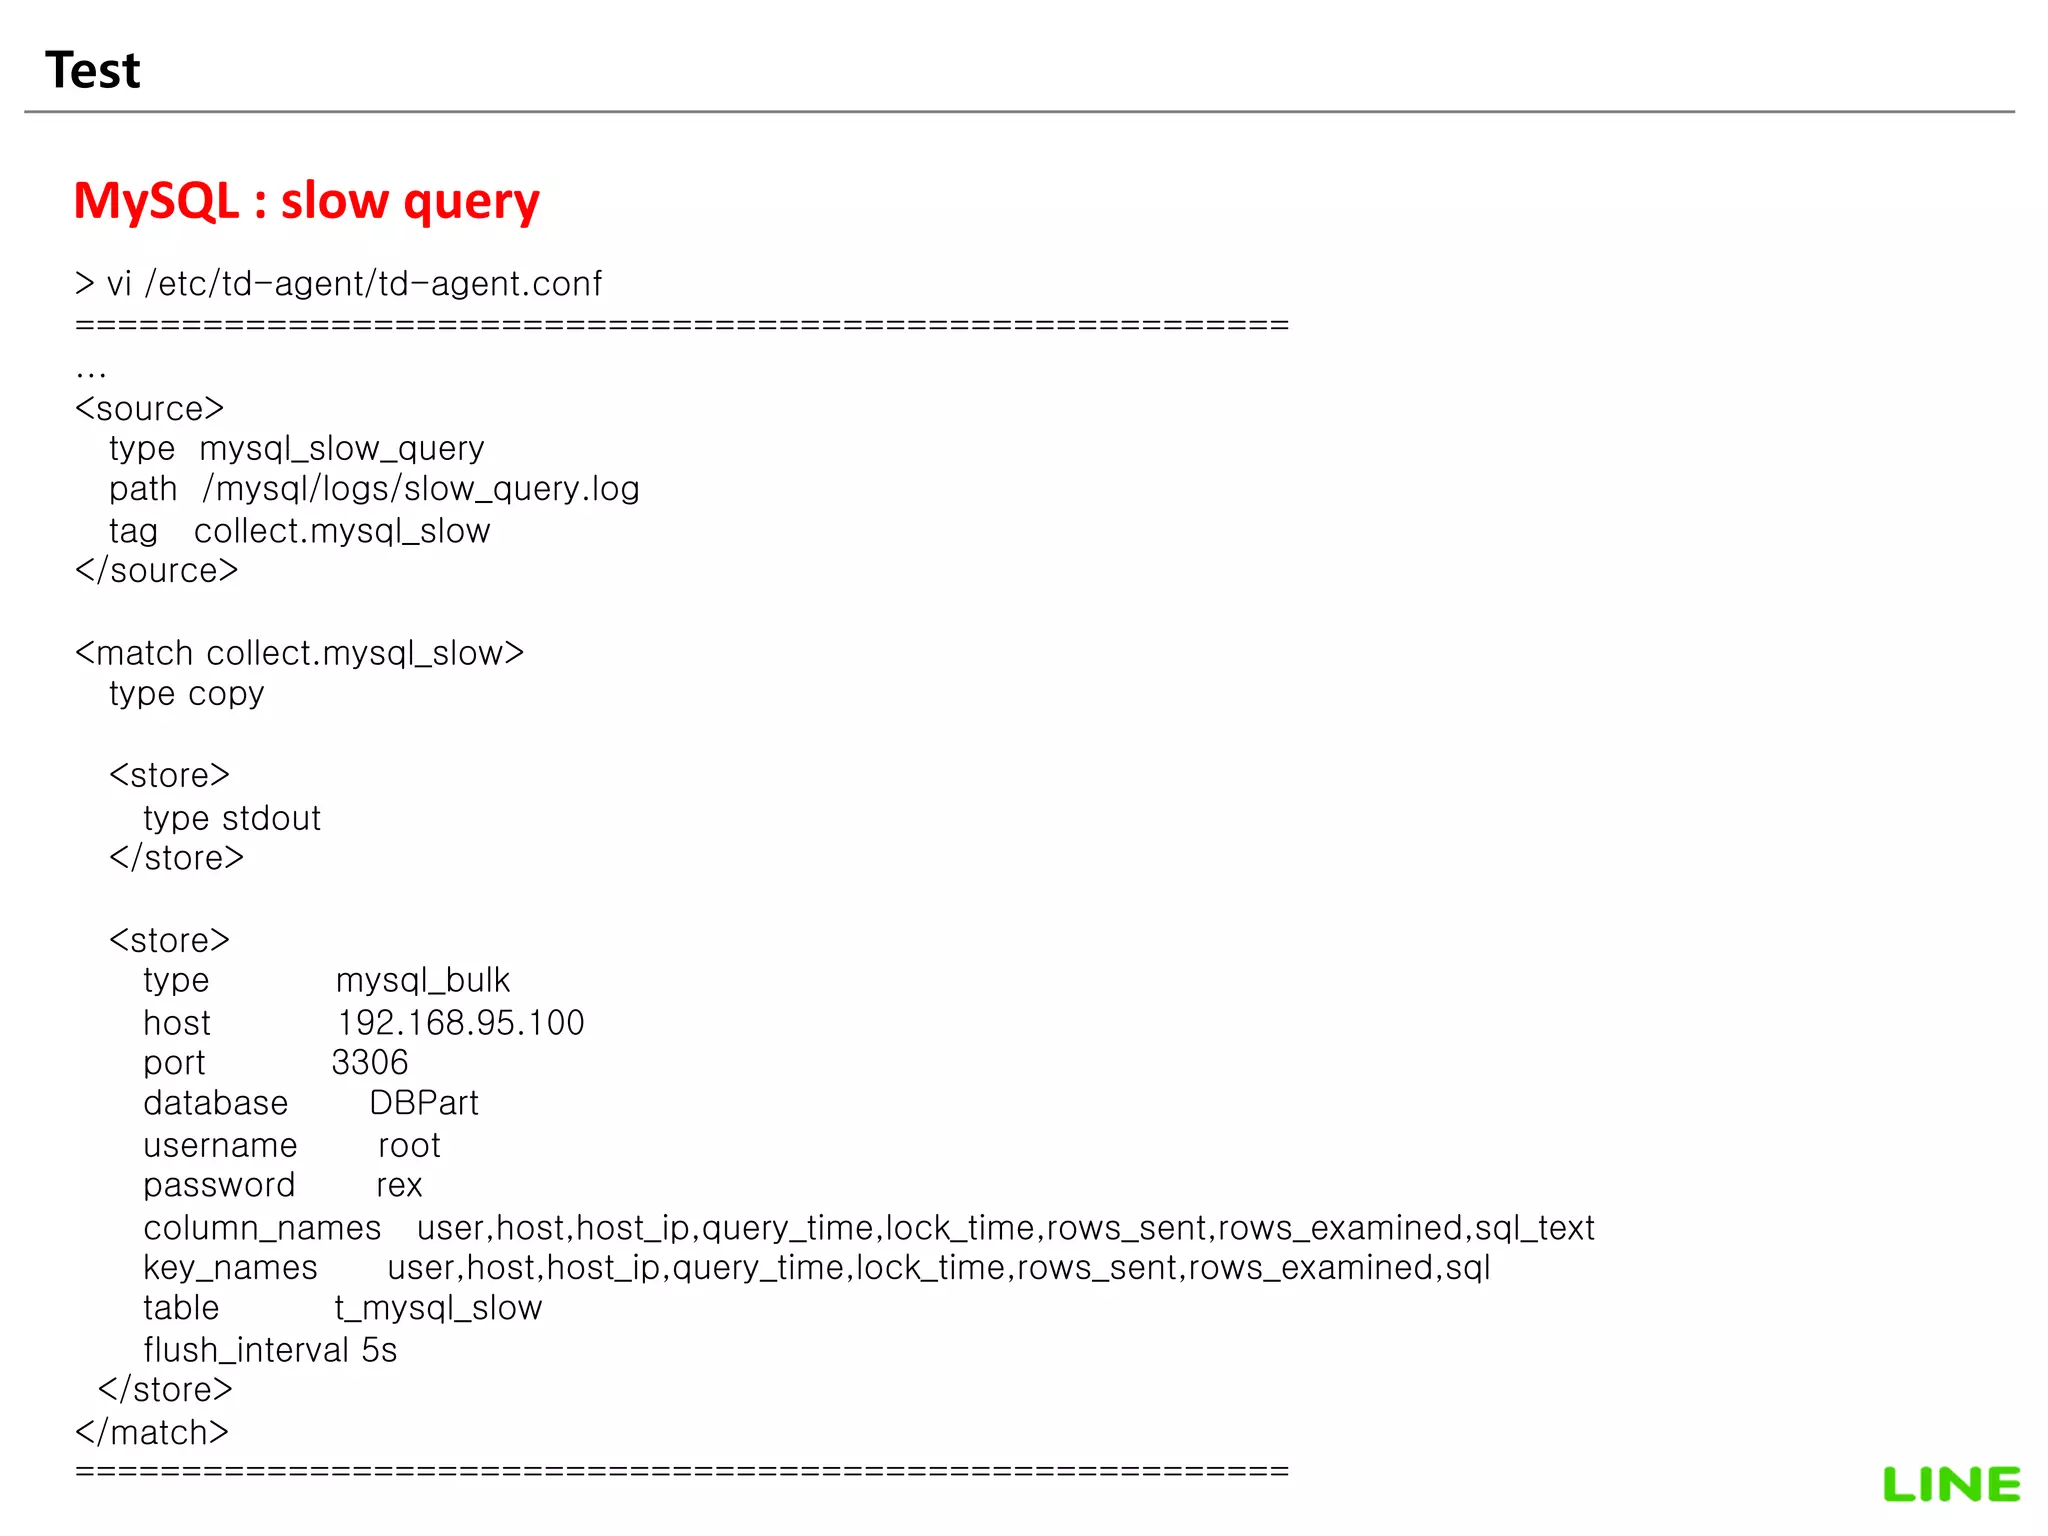
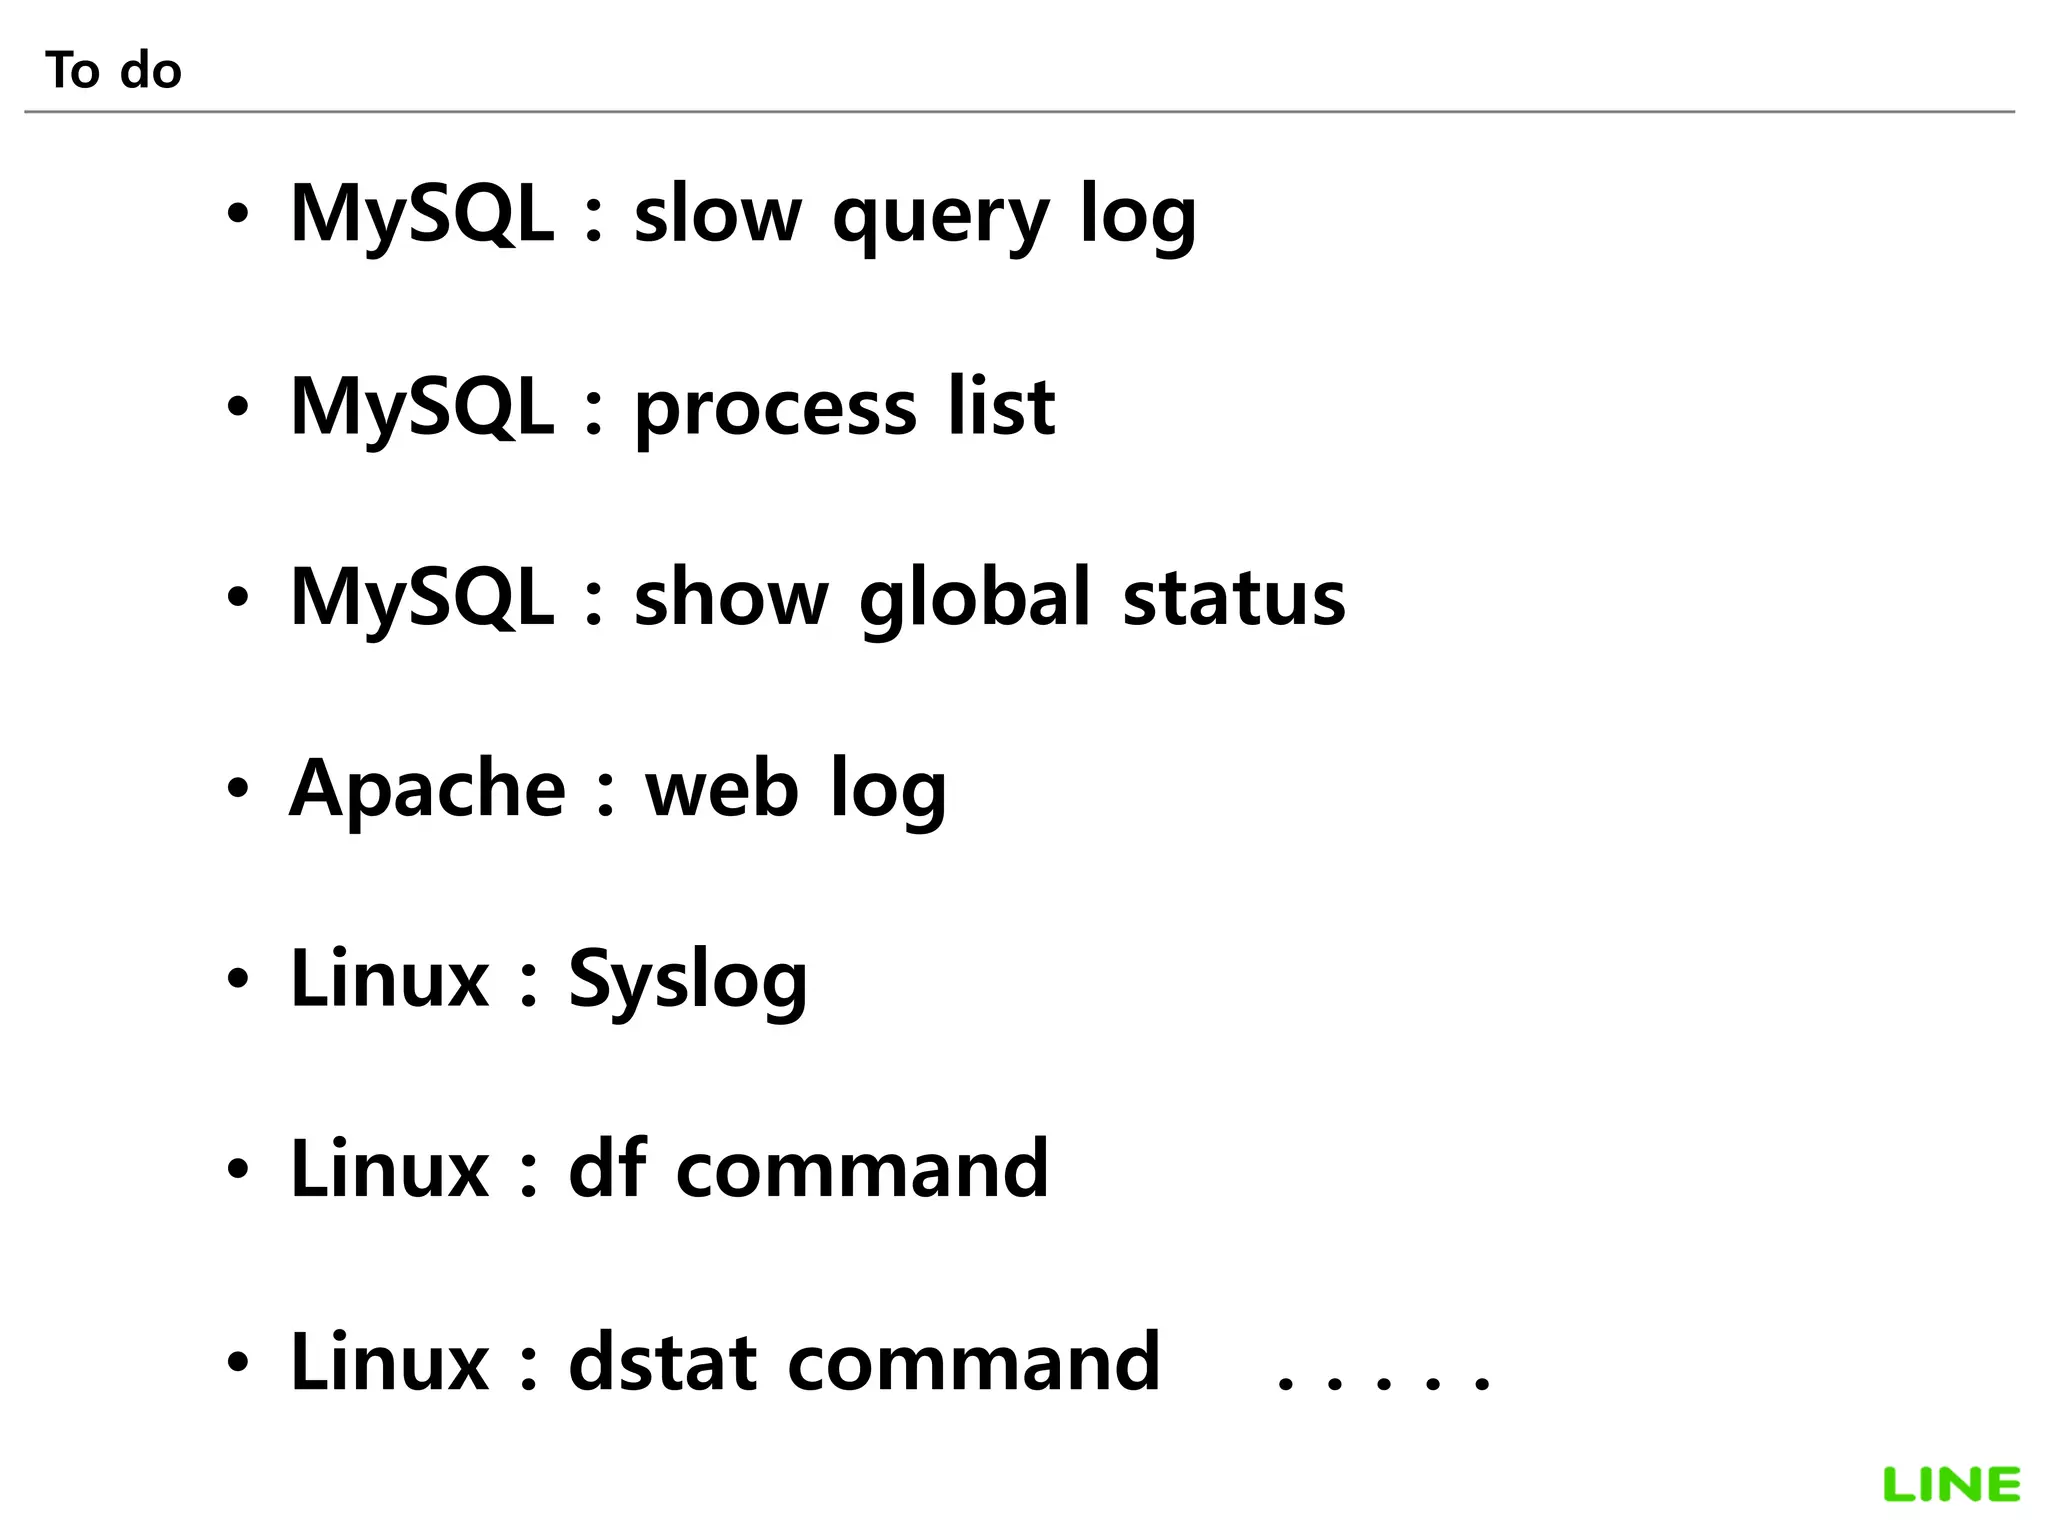
MySQL : slow query
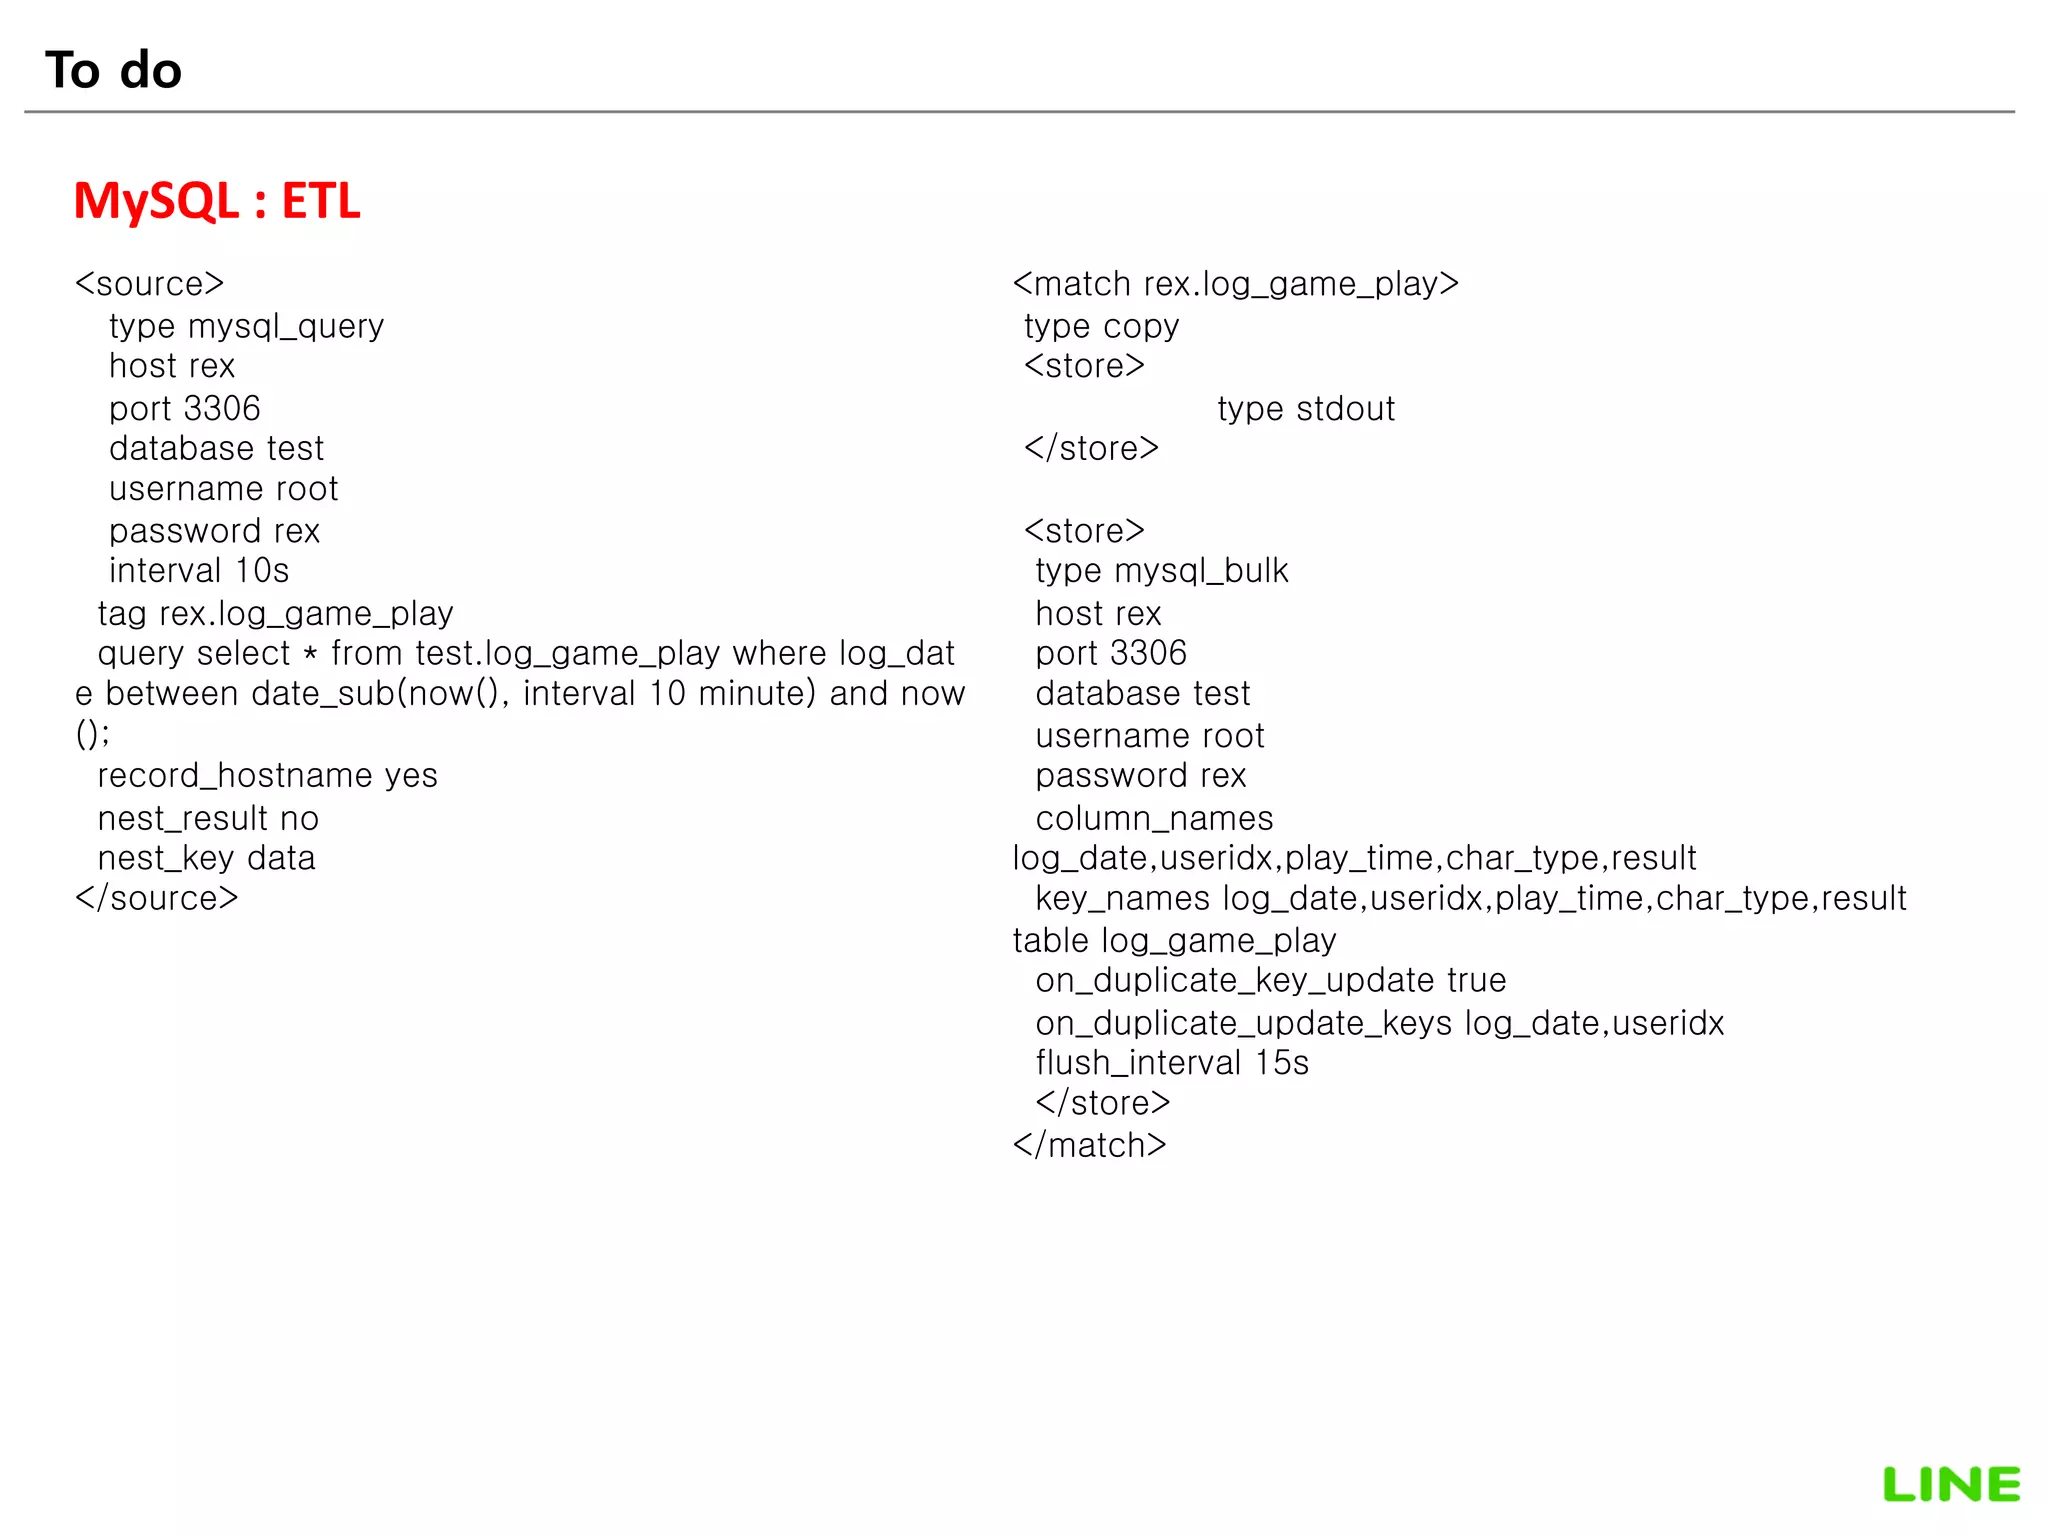
<source>
type mysql_slow_query
path /mysql/logs/slow_query.log
pos_file /mysql/logs/slow_query.pos
tag raw.collect.mysql_slow
</source>
<match raw.collect.mysql_slow>
type parser
remove_prefix raw
format /^SET timestamp=(?<time_stamp>[^;]*); (?<sql>[^;]*);$/
time_format %d/%b/%Y:%H:%M:%S %z
key_name sql
reserve_data yes
</match>
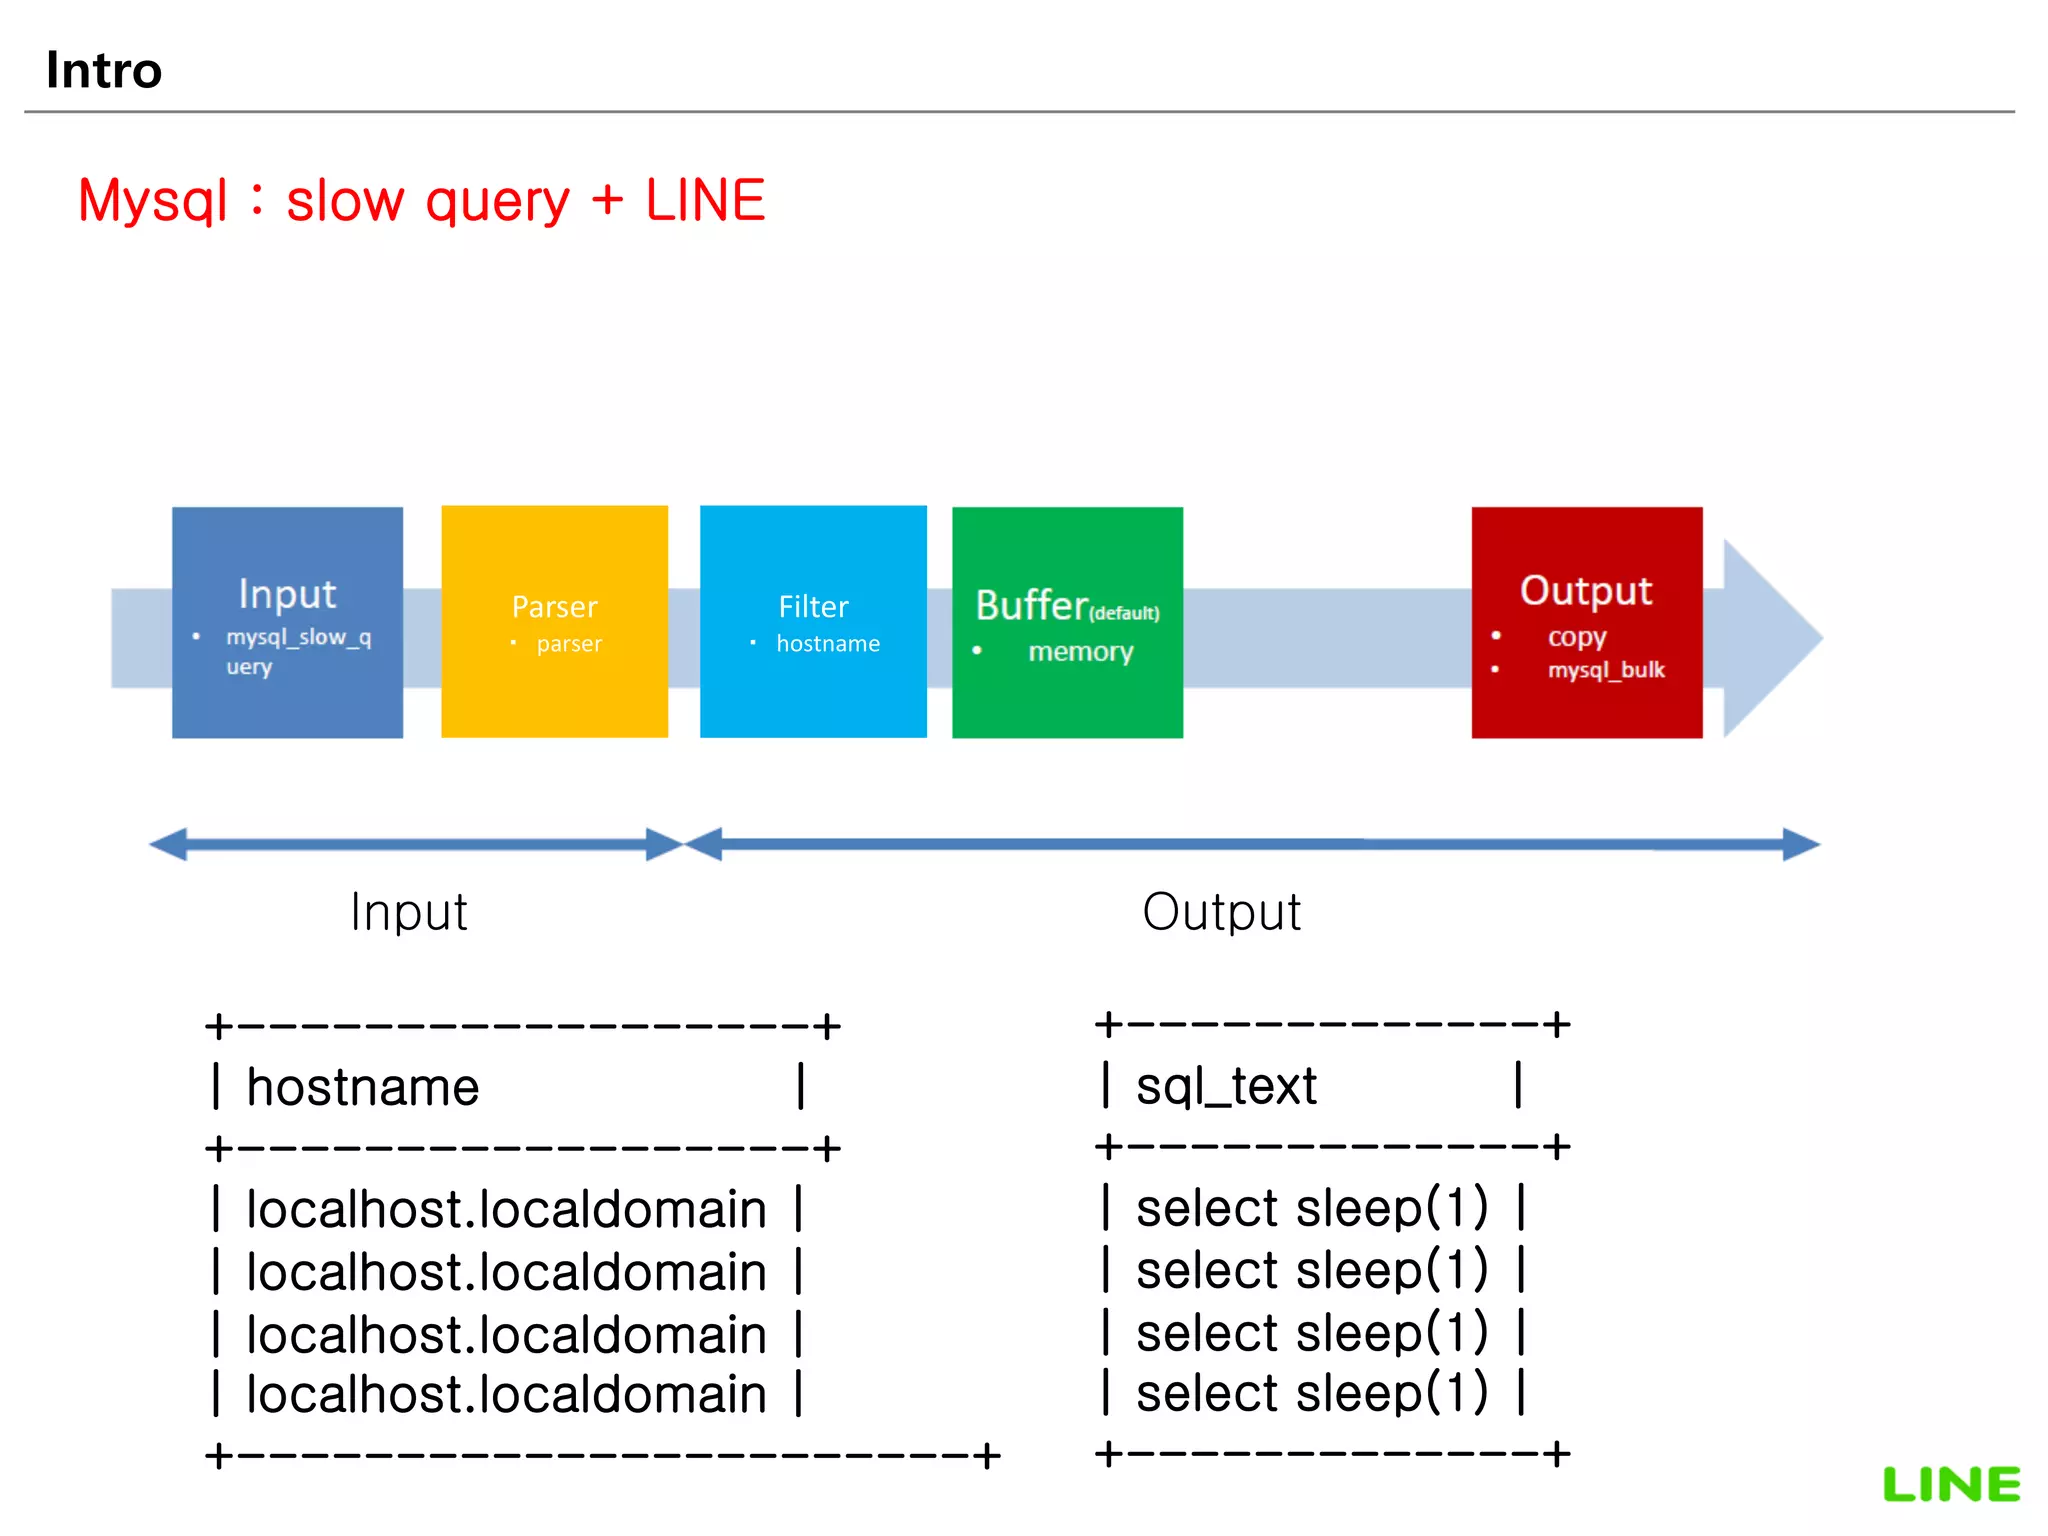
<match collect.mysql_slow>
type hostname
key_name hostname
add_prefix filtered
</match>
<match filtered.collect.mysql_slow>
type copy
<store>
type stdout
</store>
<store>
type mysql_bulk
host 192.168.95.57
port 3306
database DBPart
username root
password rex
column_names
hostname,user,host,db,query_time,lock_time,rows_sent,rows_examined,ti
me_stamp,sql_text
key_names
hostname,user,host,db,query_time,lock_time,rows_sent,rows_examined,ti
me_stamp,sql
table t_mysql_slow
flush_interval 5s
</store>
</match>](https://image.slidesharecdn.com/fluentd20150918nodemopublic-190322024550/75/Fluentd-20150918-no_demo_public-20-2048.jpg)
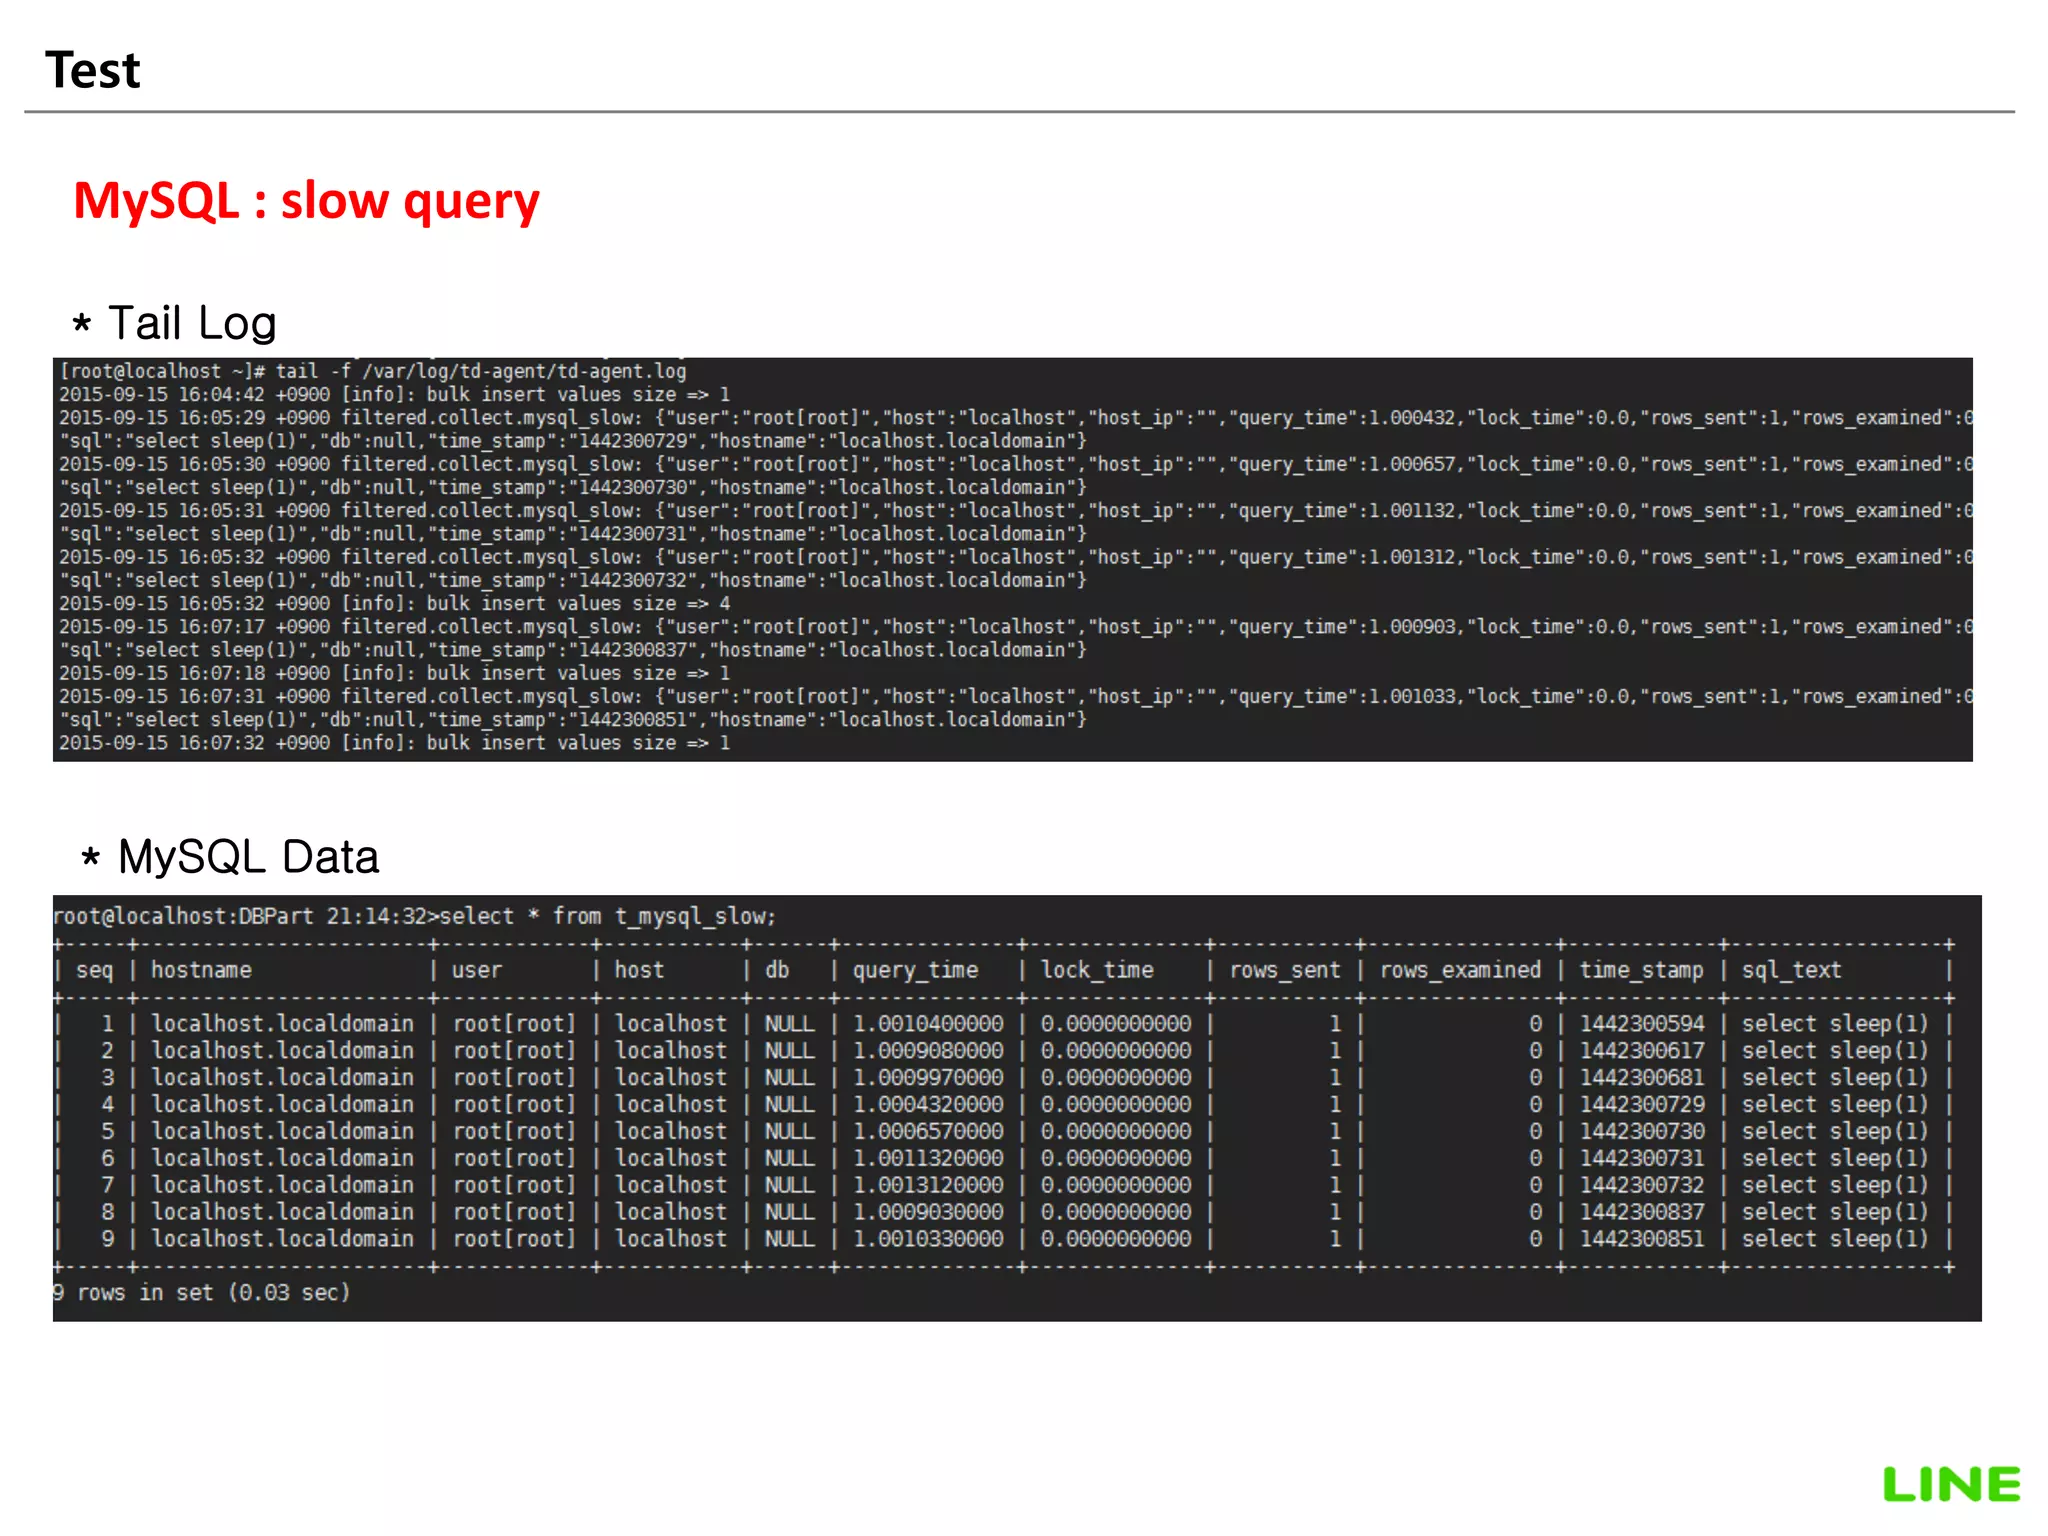
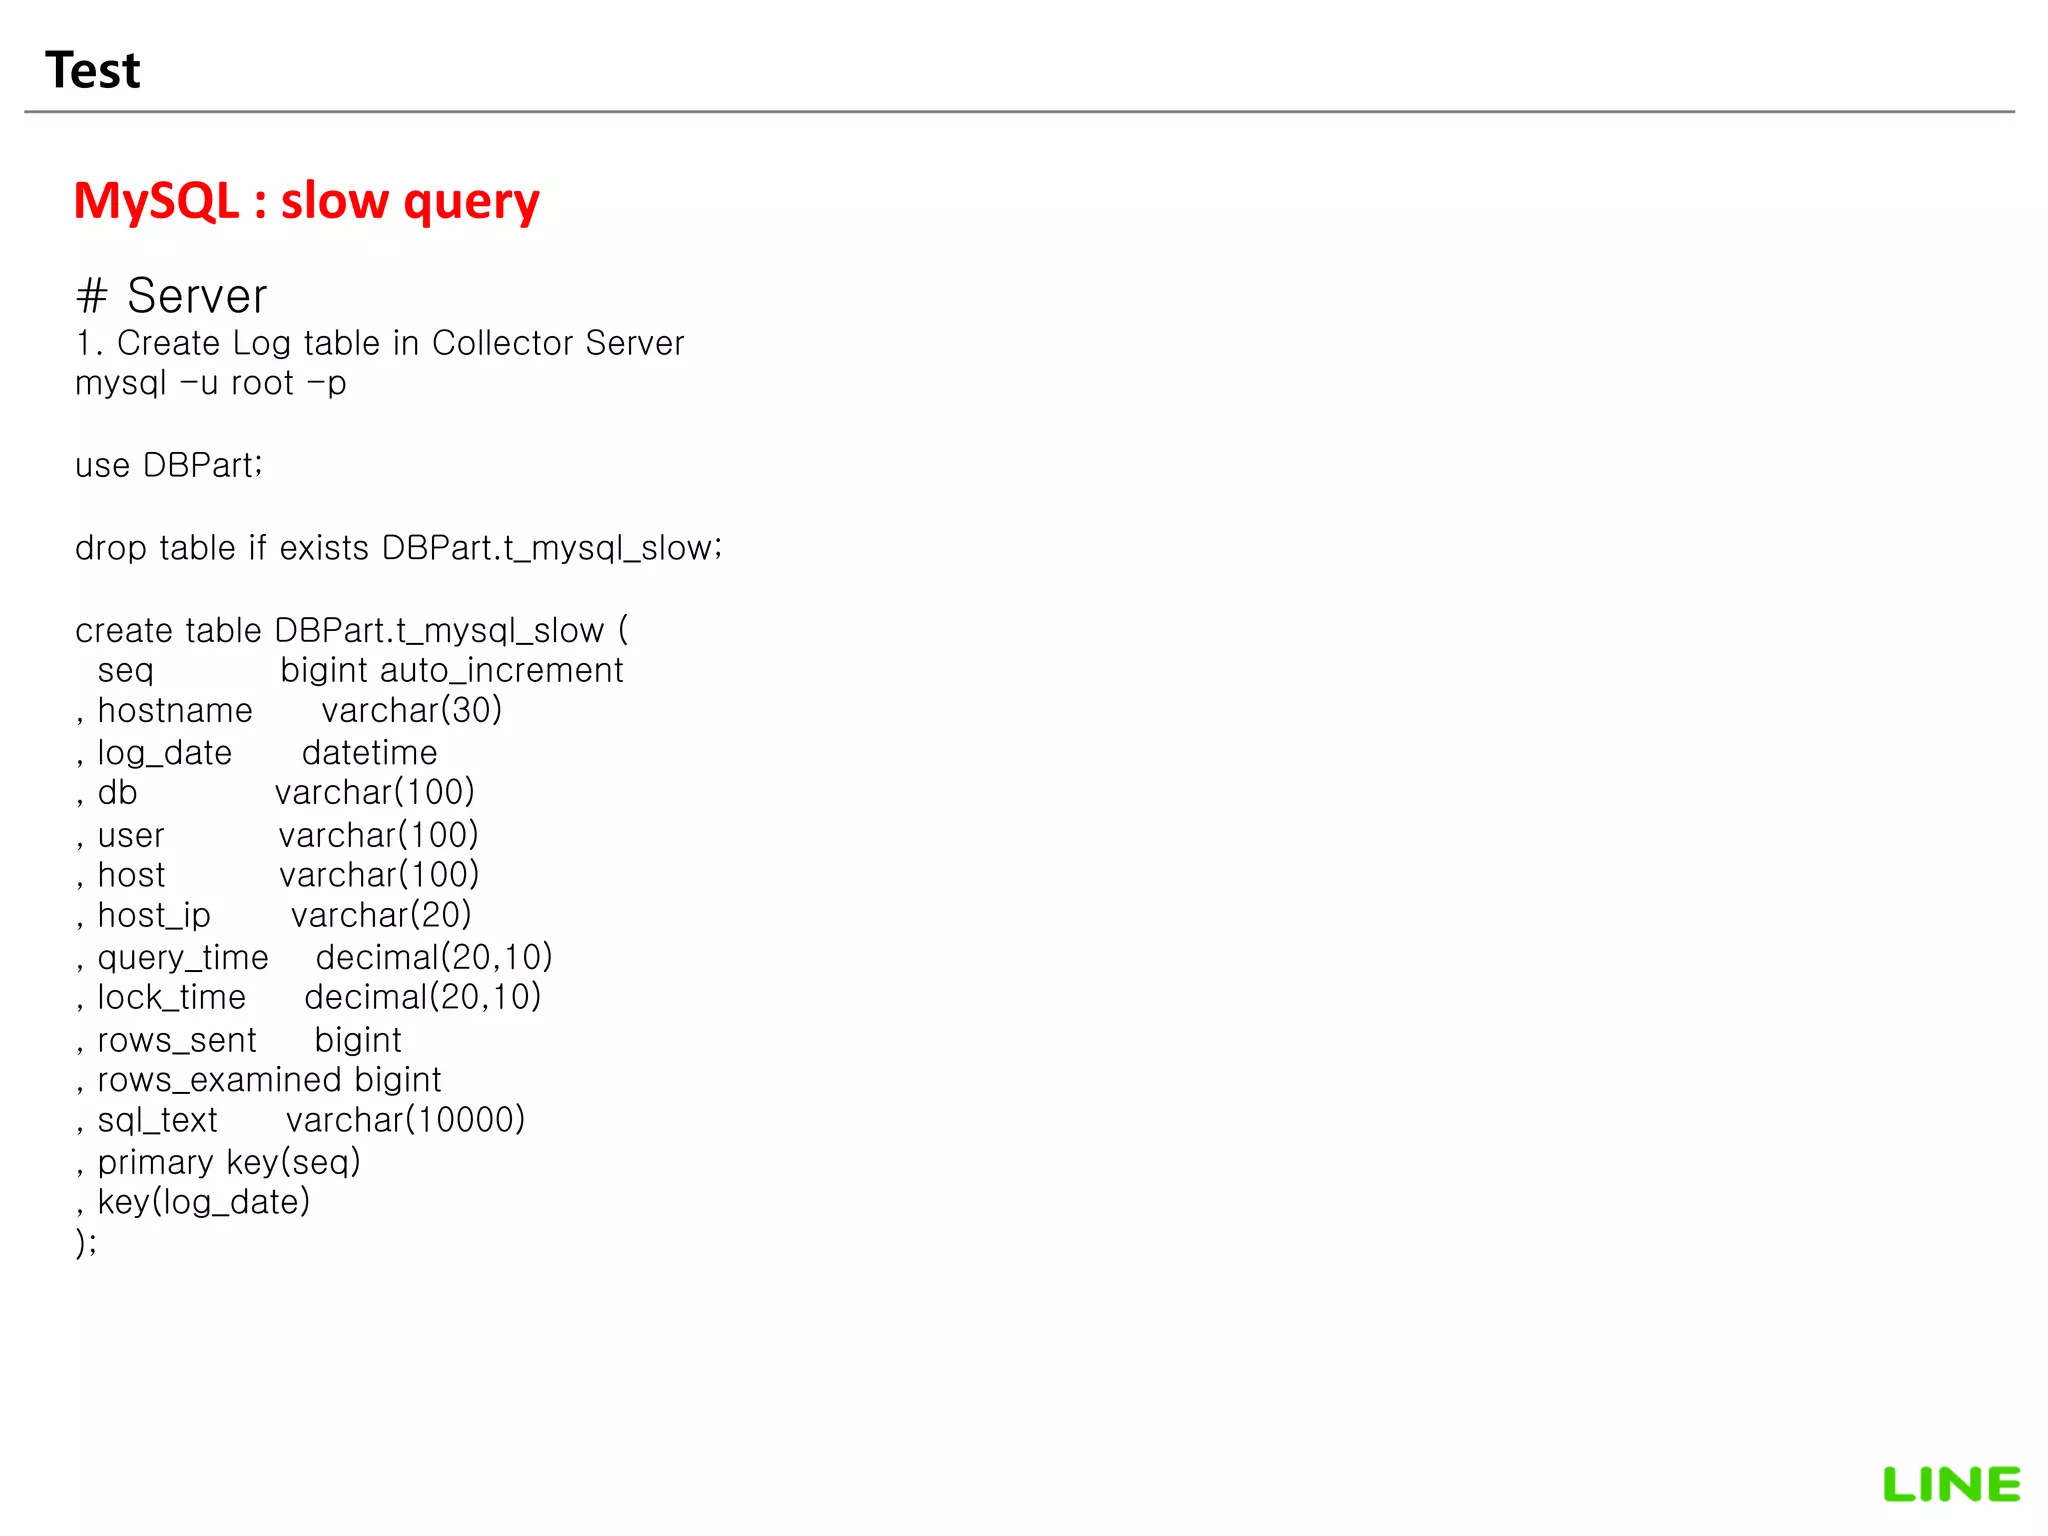
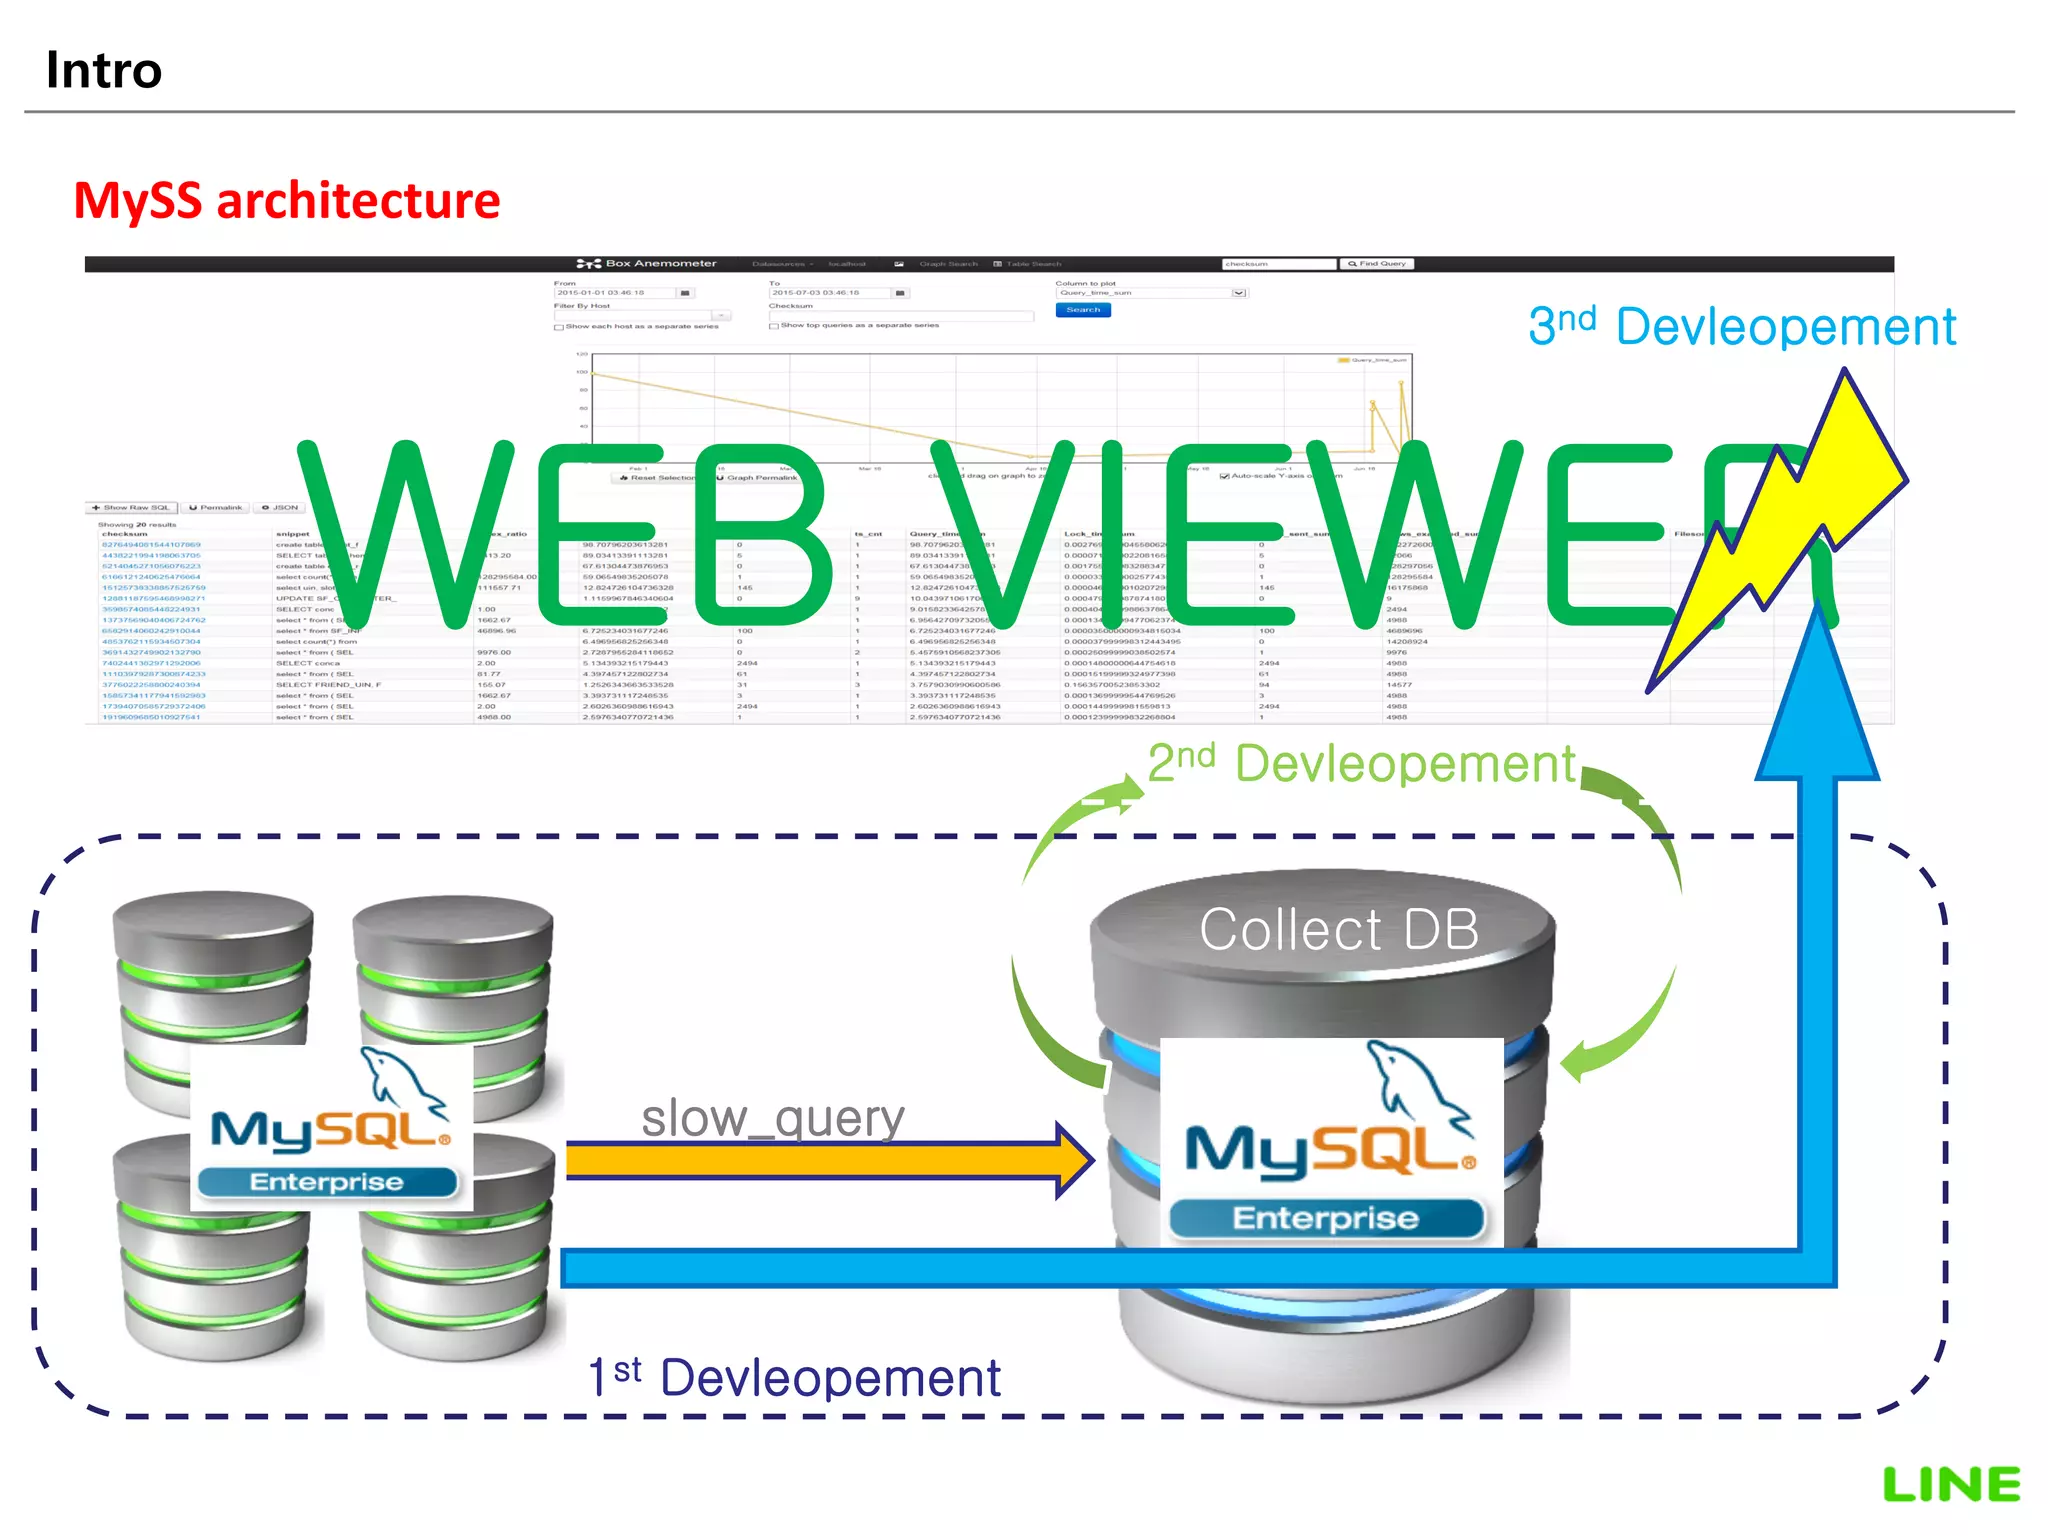
![Test 25
MySQL : slow query
3. td-agent restart
service td-agent stop
Shutting down td-agent: [ OK ]
service td-agent start
Starting td-agent: [ OK ]
4. press slow query
mysql -u root -p
use mysql;
select sleep(1);
select sleep(1);
[root@localhost ~]# tail -f /var/log/td-agent/td-agent.log
2015-09-10 12:06:31 +0900 collect.mysql_slow:
{"user":"root[root]","host":"localhost","host_ip":"","query_time":1.000855,"lock_time":0.0,"rows_sent":1,"rows_examine
d":0,"sql":"SET timestamp=1441854391; select sleep(1);","db":"mysql"}
2015-09-10 12:06:33 +0900 collect.mysql_slow:
{"user":"root[root]","host":"localhost","host_ip":"","query_time":1.000862,"lock_time":0.0,"rows_sent":1,"rows_examine
d":0,"sql":"SET timestamp=1441854393; select sleep(1);","db":"mysql"}
2015-09-10 12:24:16 +0900 [info]: bulk insert values size => 2
* SERVER
mysql> select * from t_mysql_slow;
+---------------------+------------+-----------+---------+--------------+--------------+-----------+---------------+--------------------------------------------+----------+
| log_date | user | host | host_ip | query_time | lock_time | rows_sent | rows_examined | sql_text | hostname |
+---------------------+------------+-----------+---------+--------------+--------------+-----------+---------------+--------------------------------------------+----------+
| 2015-09-10 07:03:45 | root[root] | localhost | | 1.0008600000 | 0.0000000000 | 1 | 0 | SET timestamp=1441820542; select sleep(1); | NULL |
| 2015-09-10 07:04:15 | root[root] | localhost | | 1.0010030000 | 0.0000000000 | 1 | 0 | SET timestamp=1441820574; select sleep(1); | NULL |
+---------------------+------------+-----------+---------+--------------+--------------+-----------+---------------+--------------------------------------------+----------+
8 rows in set (0.00 sec)](https://image.slidesharecdn.com/fluentd20150918nodemopublic-190322024550/75/Fluentd-20150918-no_demo_public-25-2048.jpg)
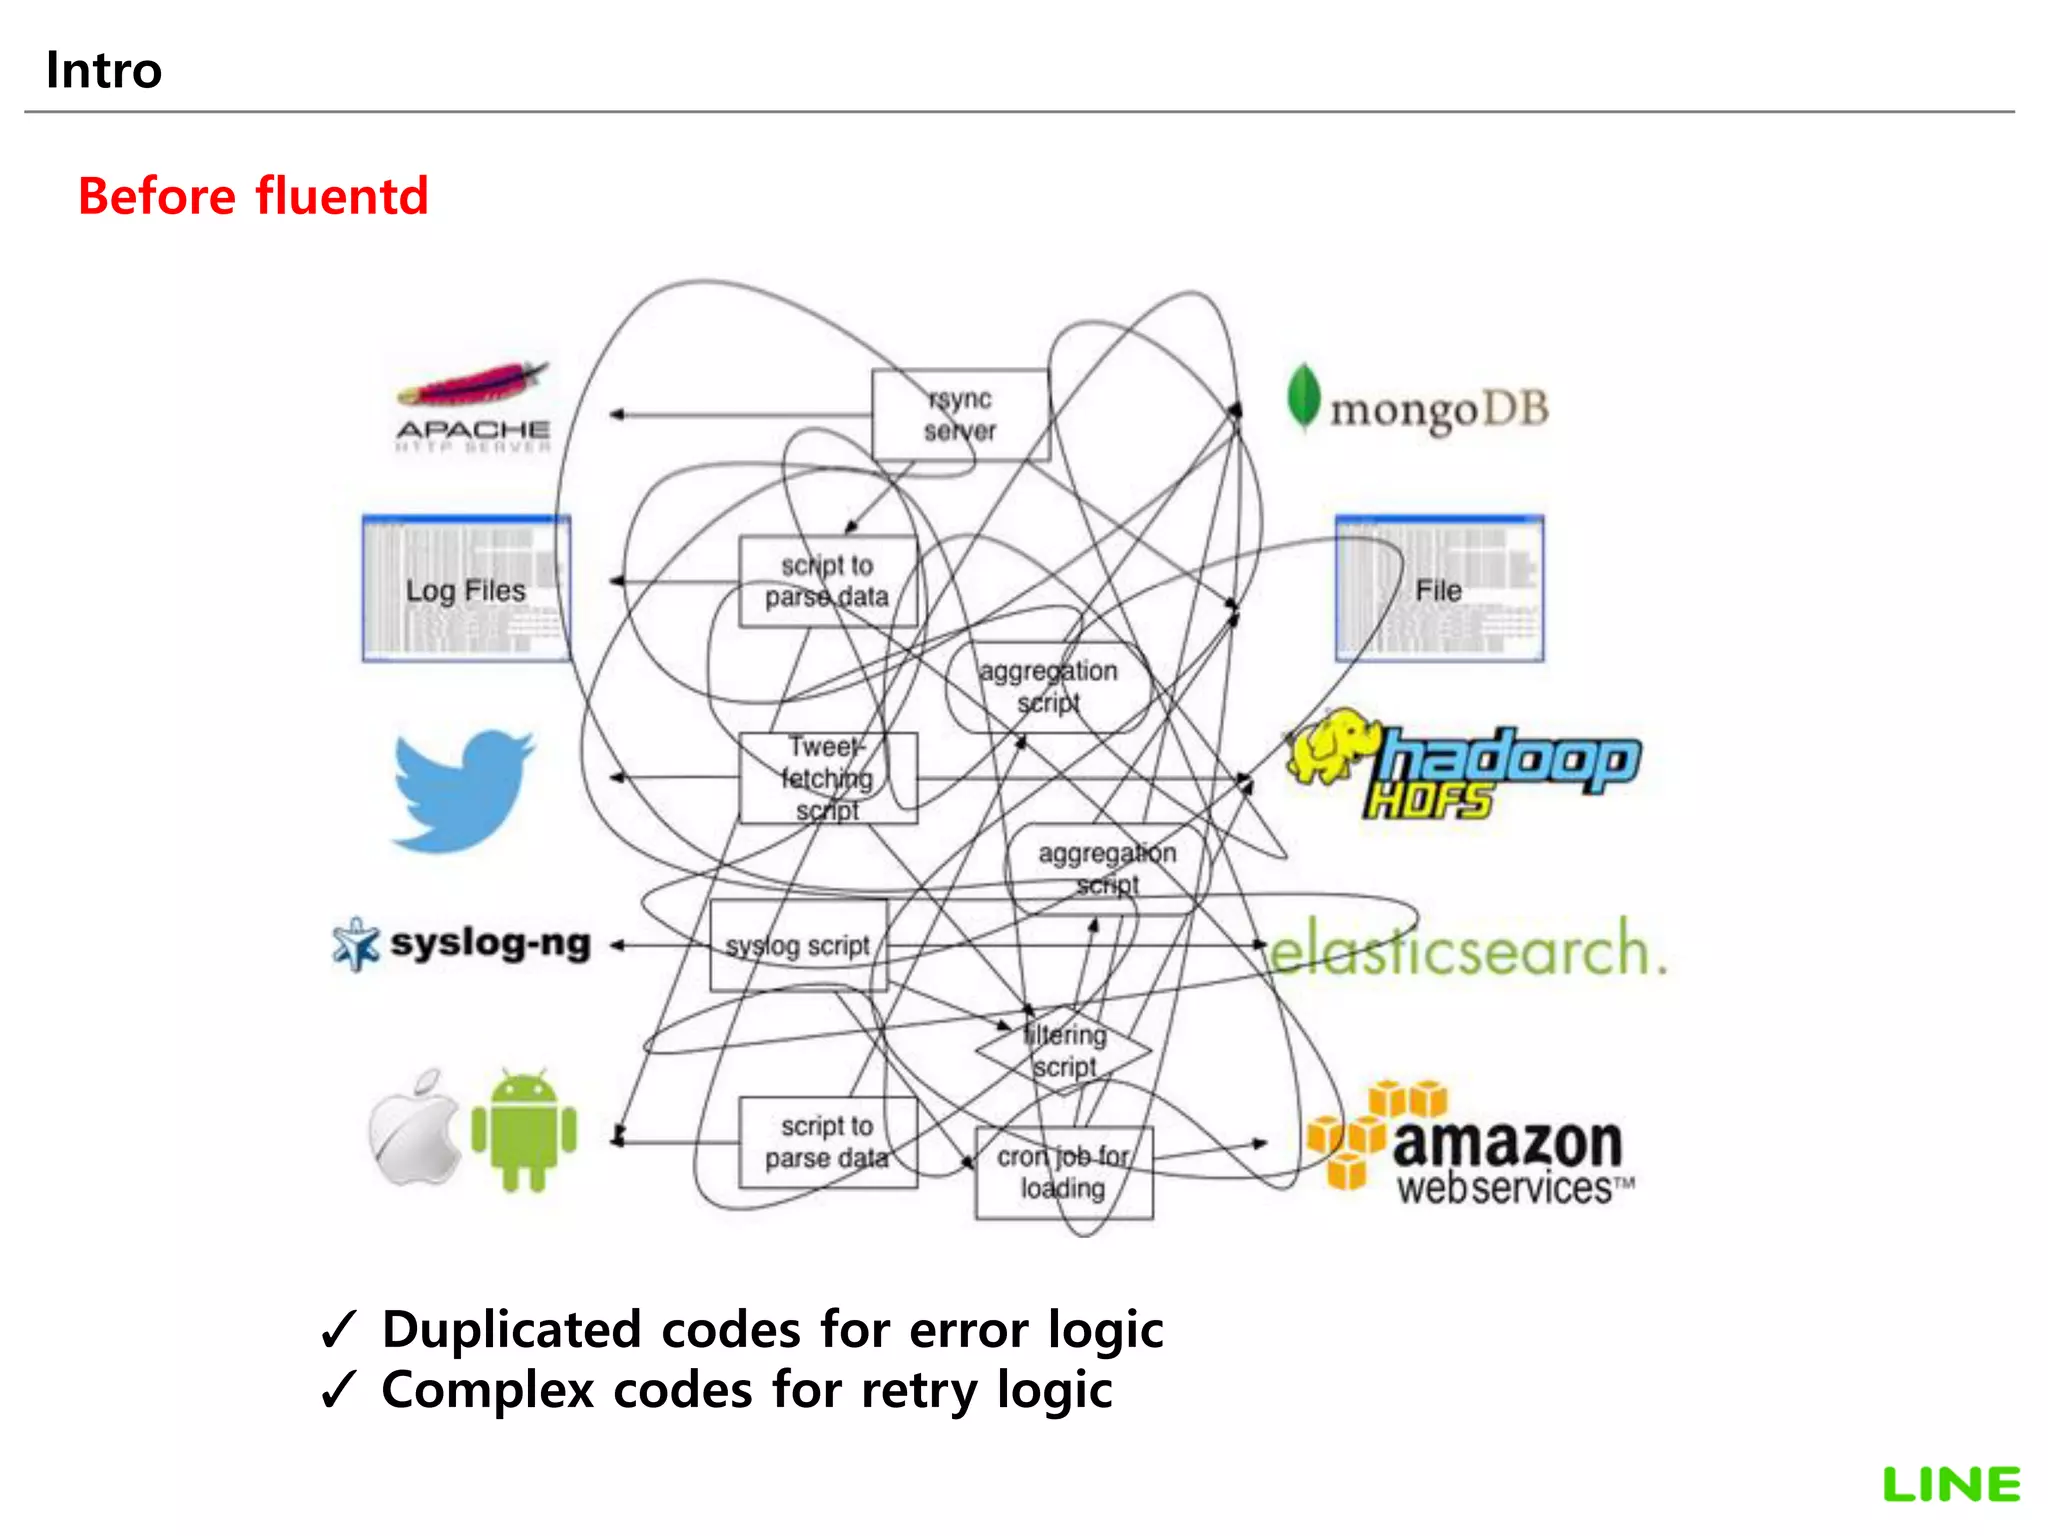
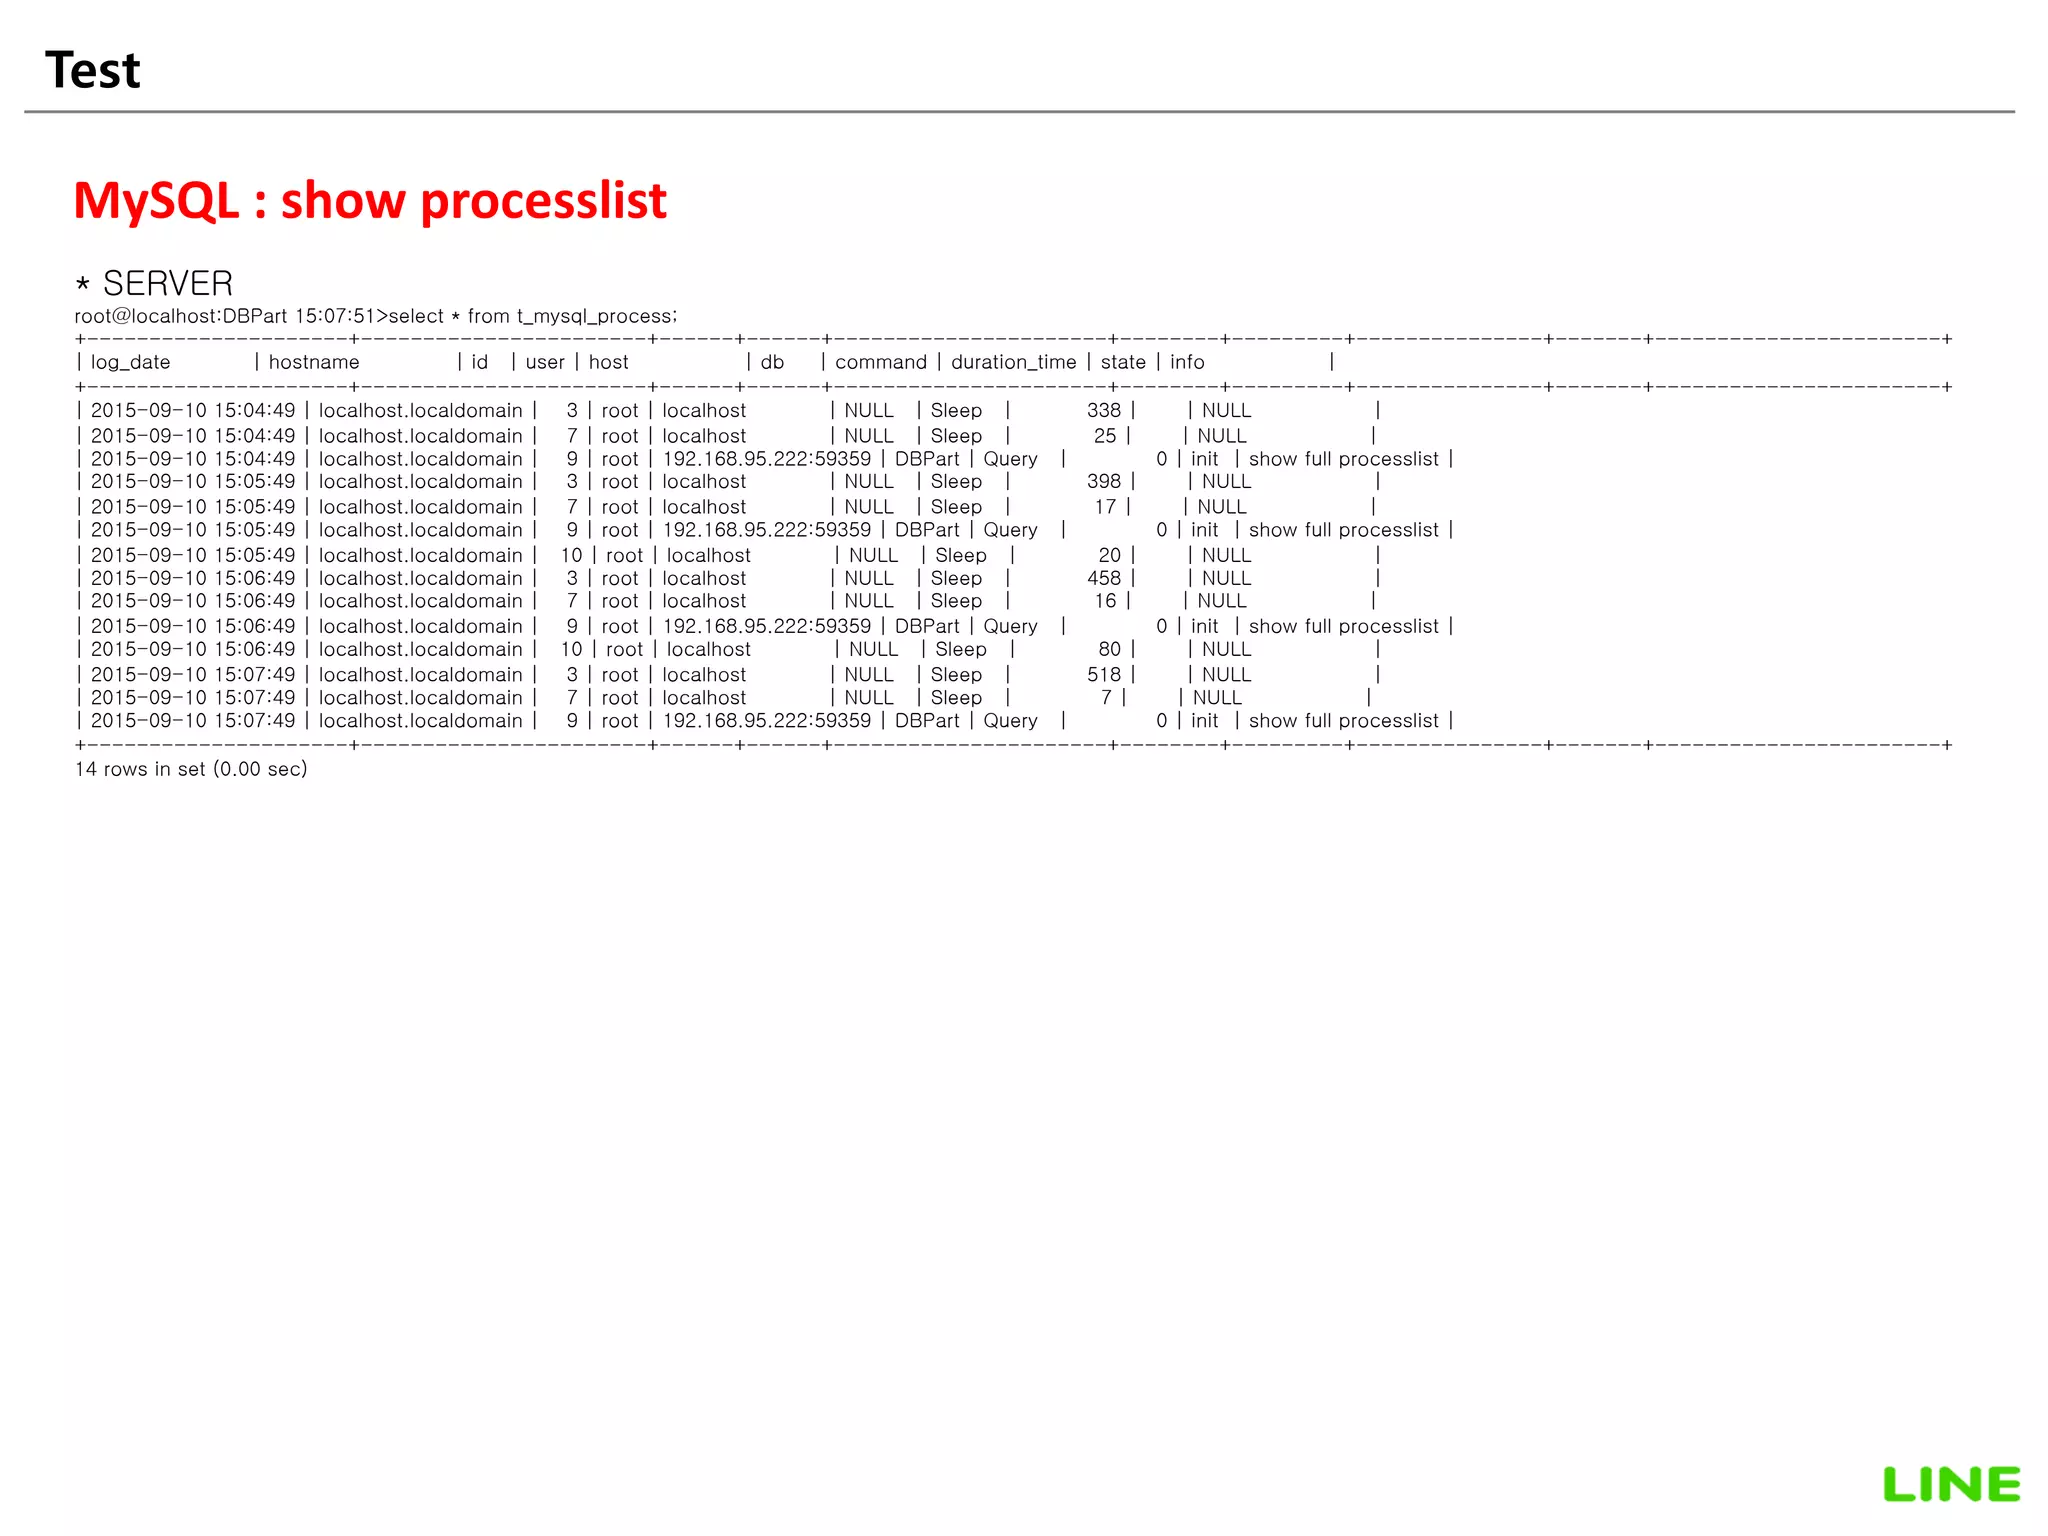
![Test 32
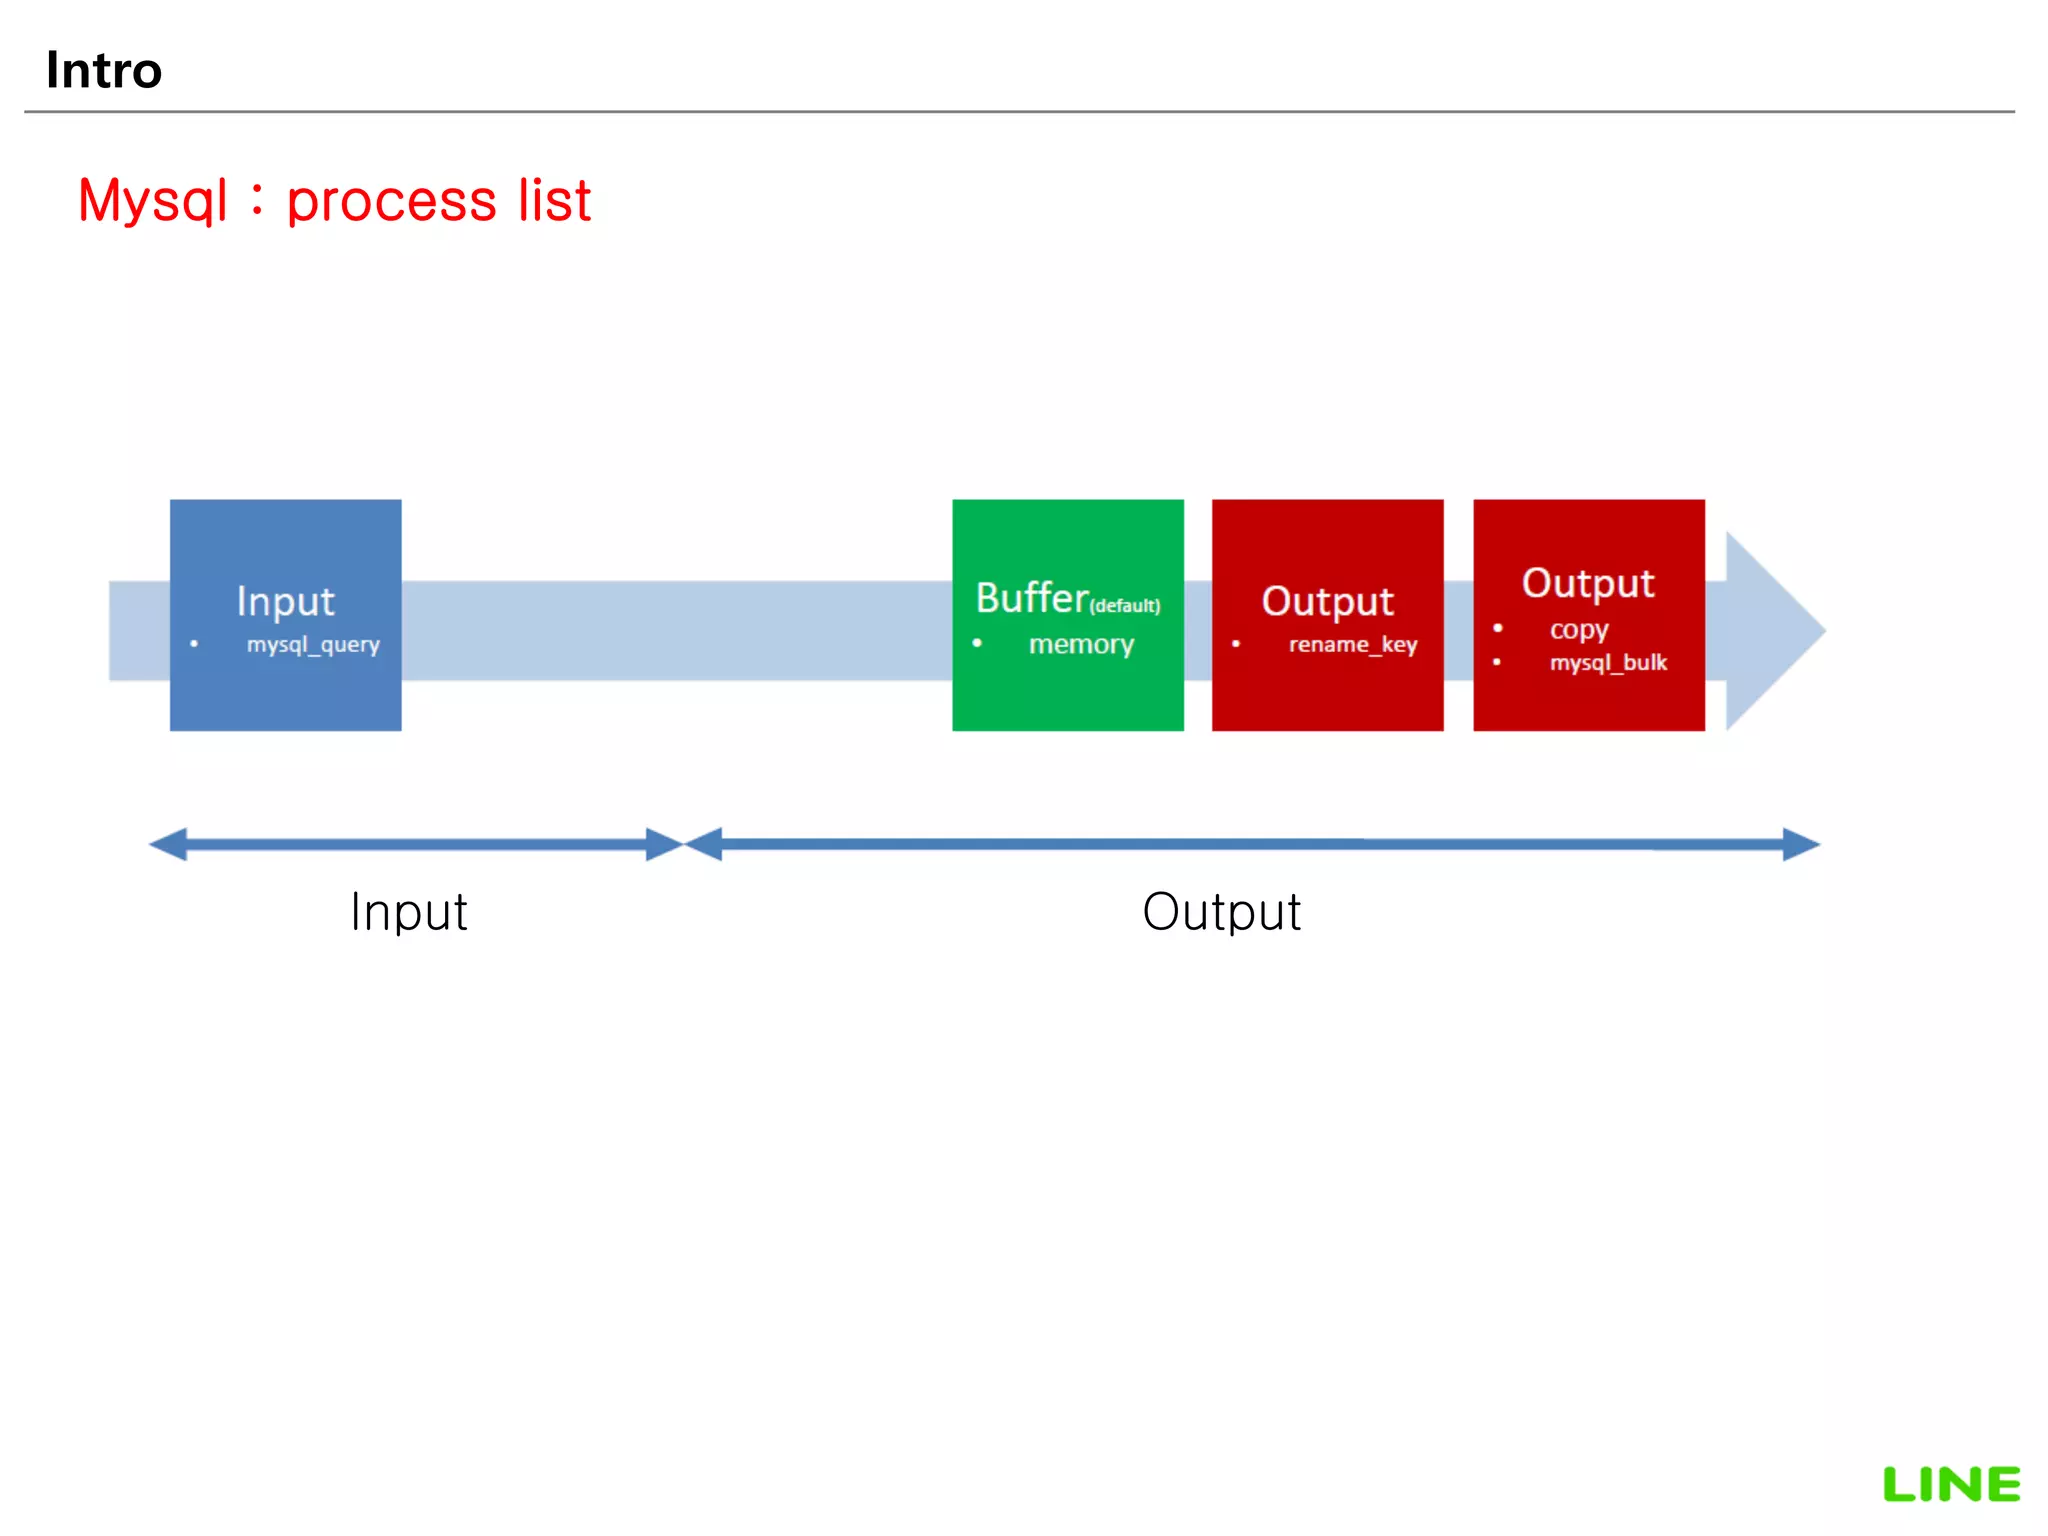
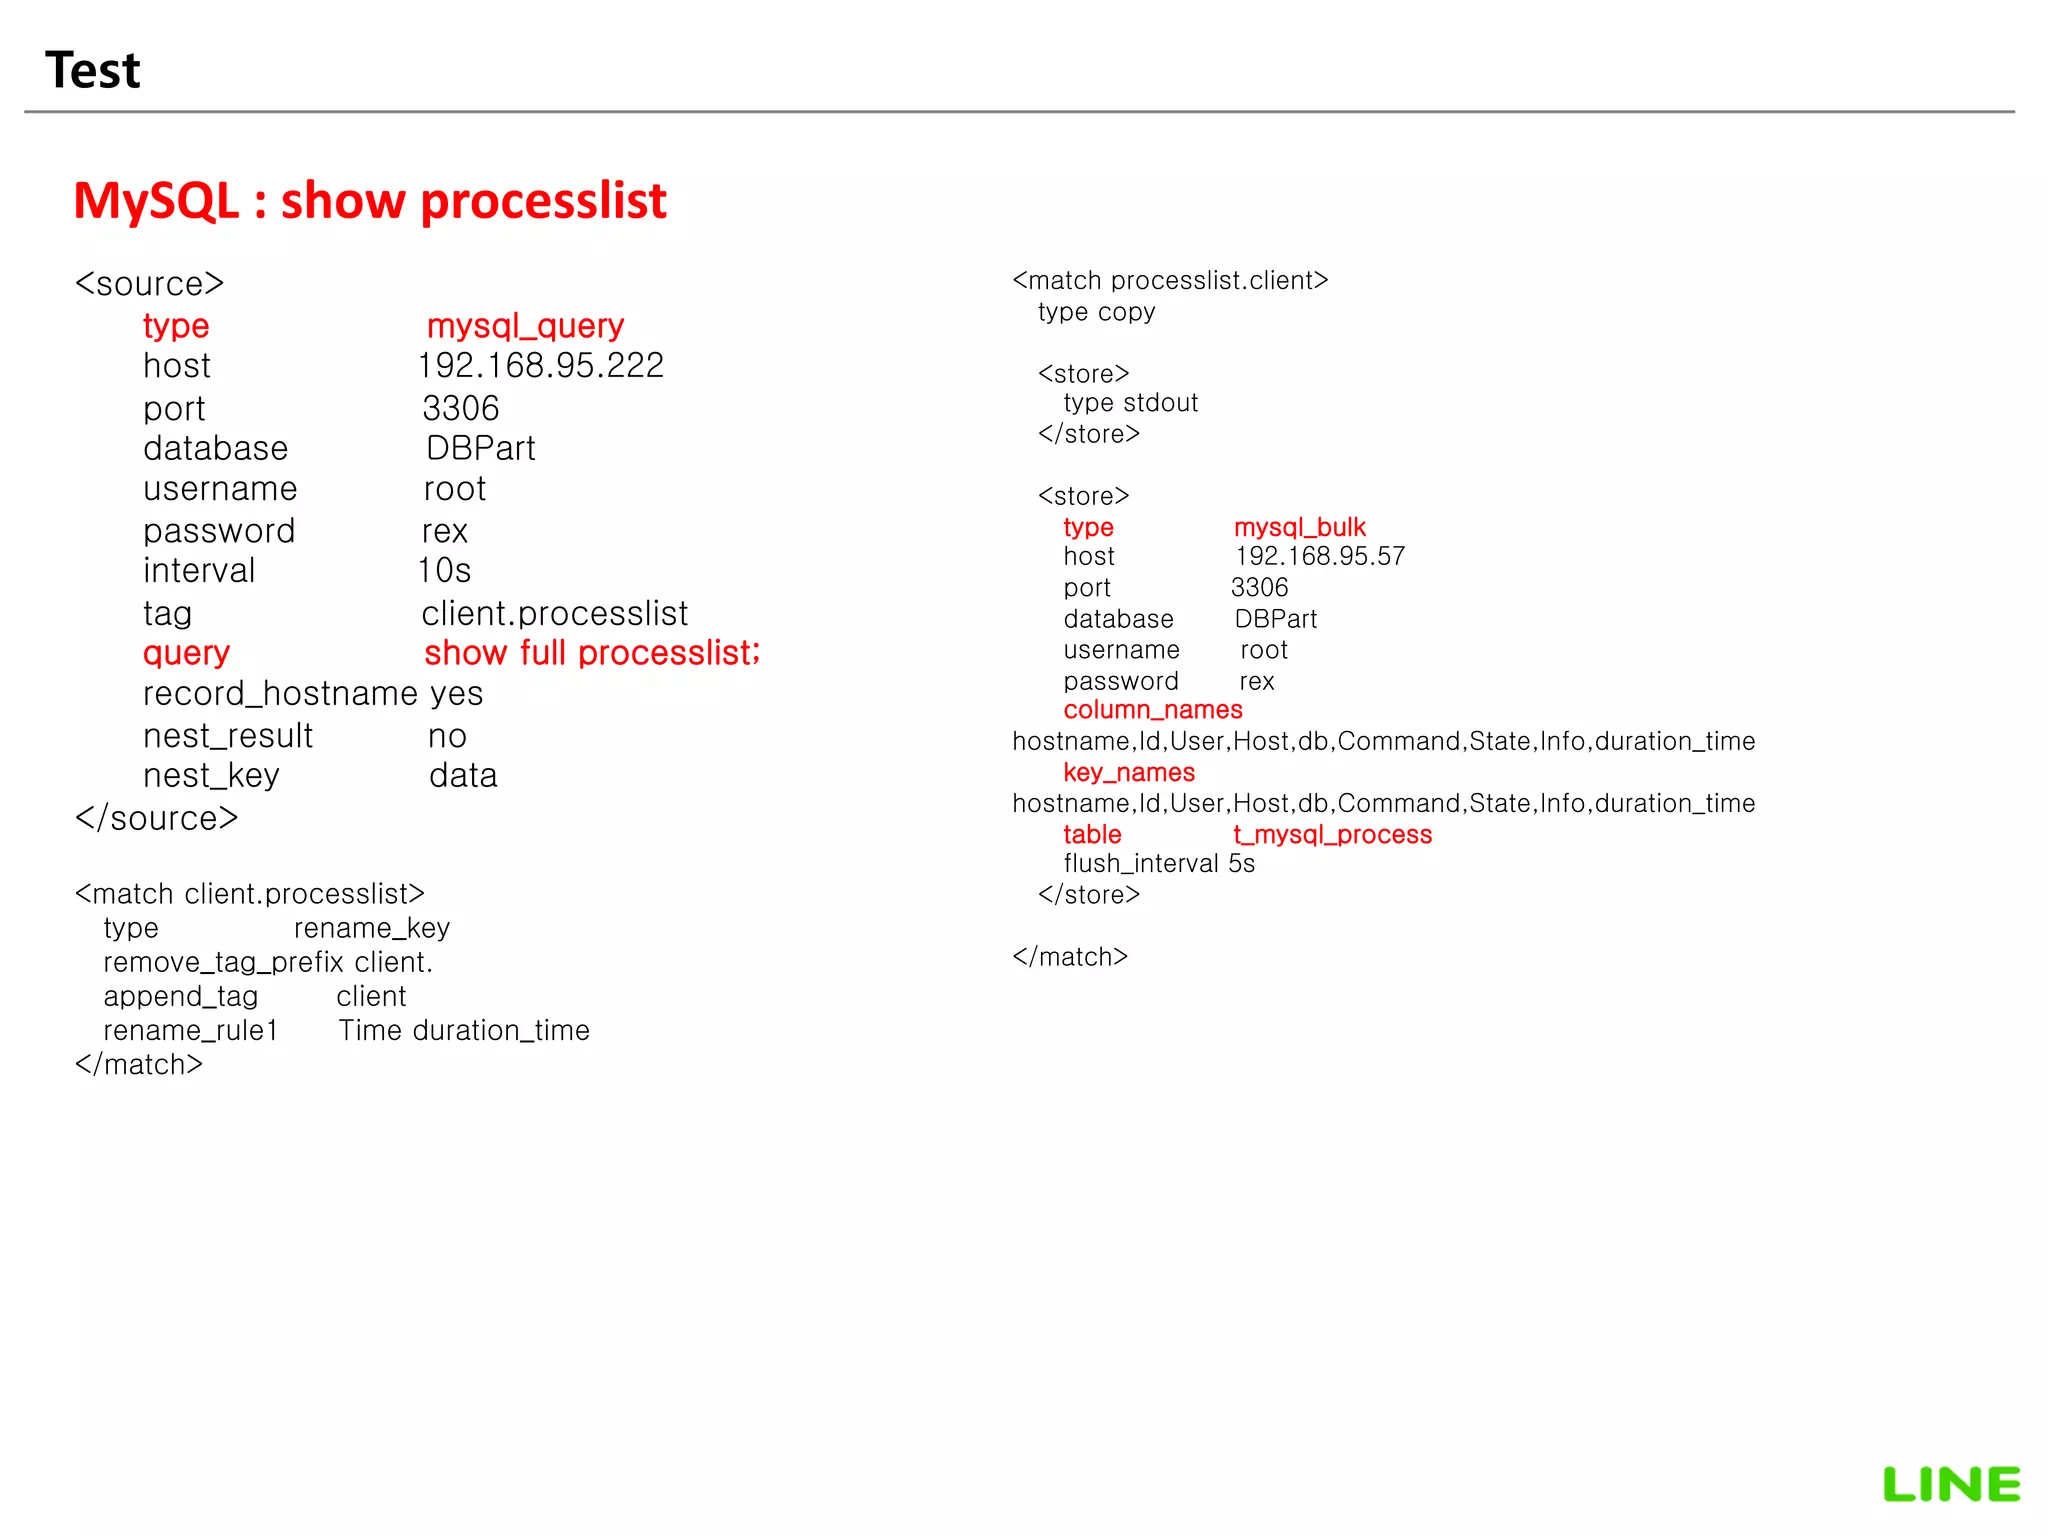
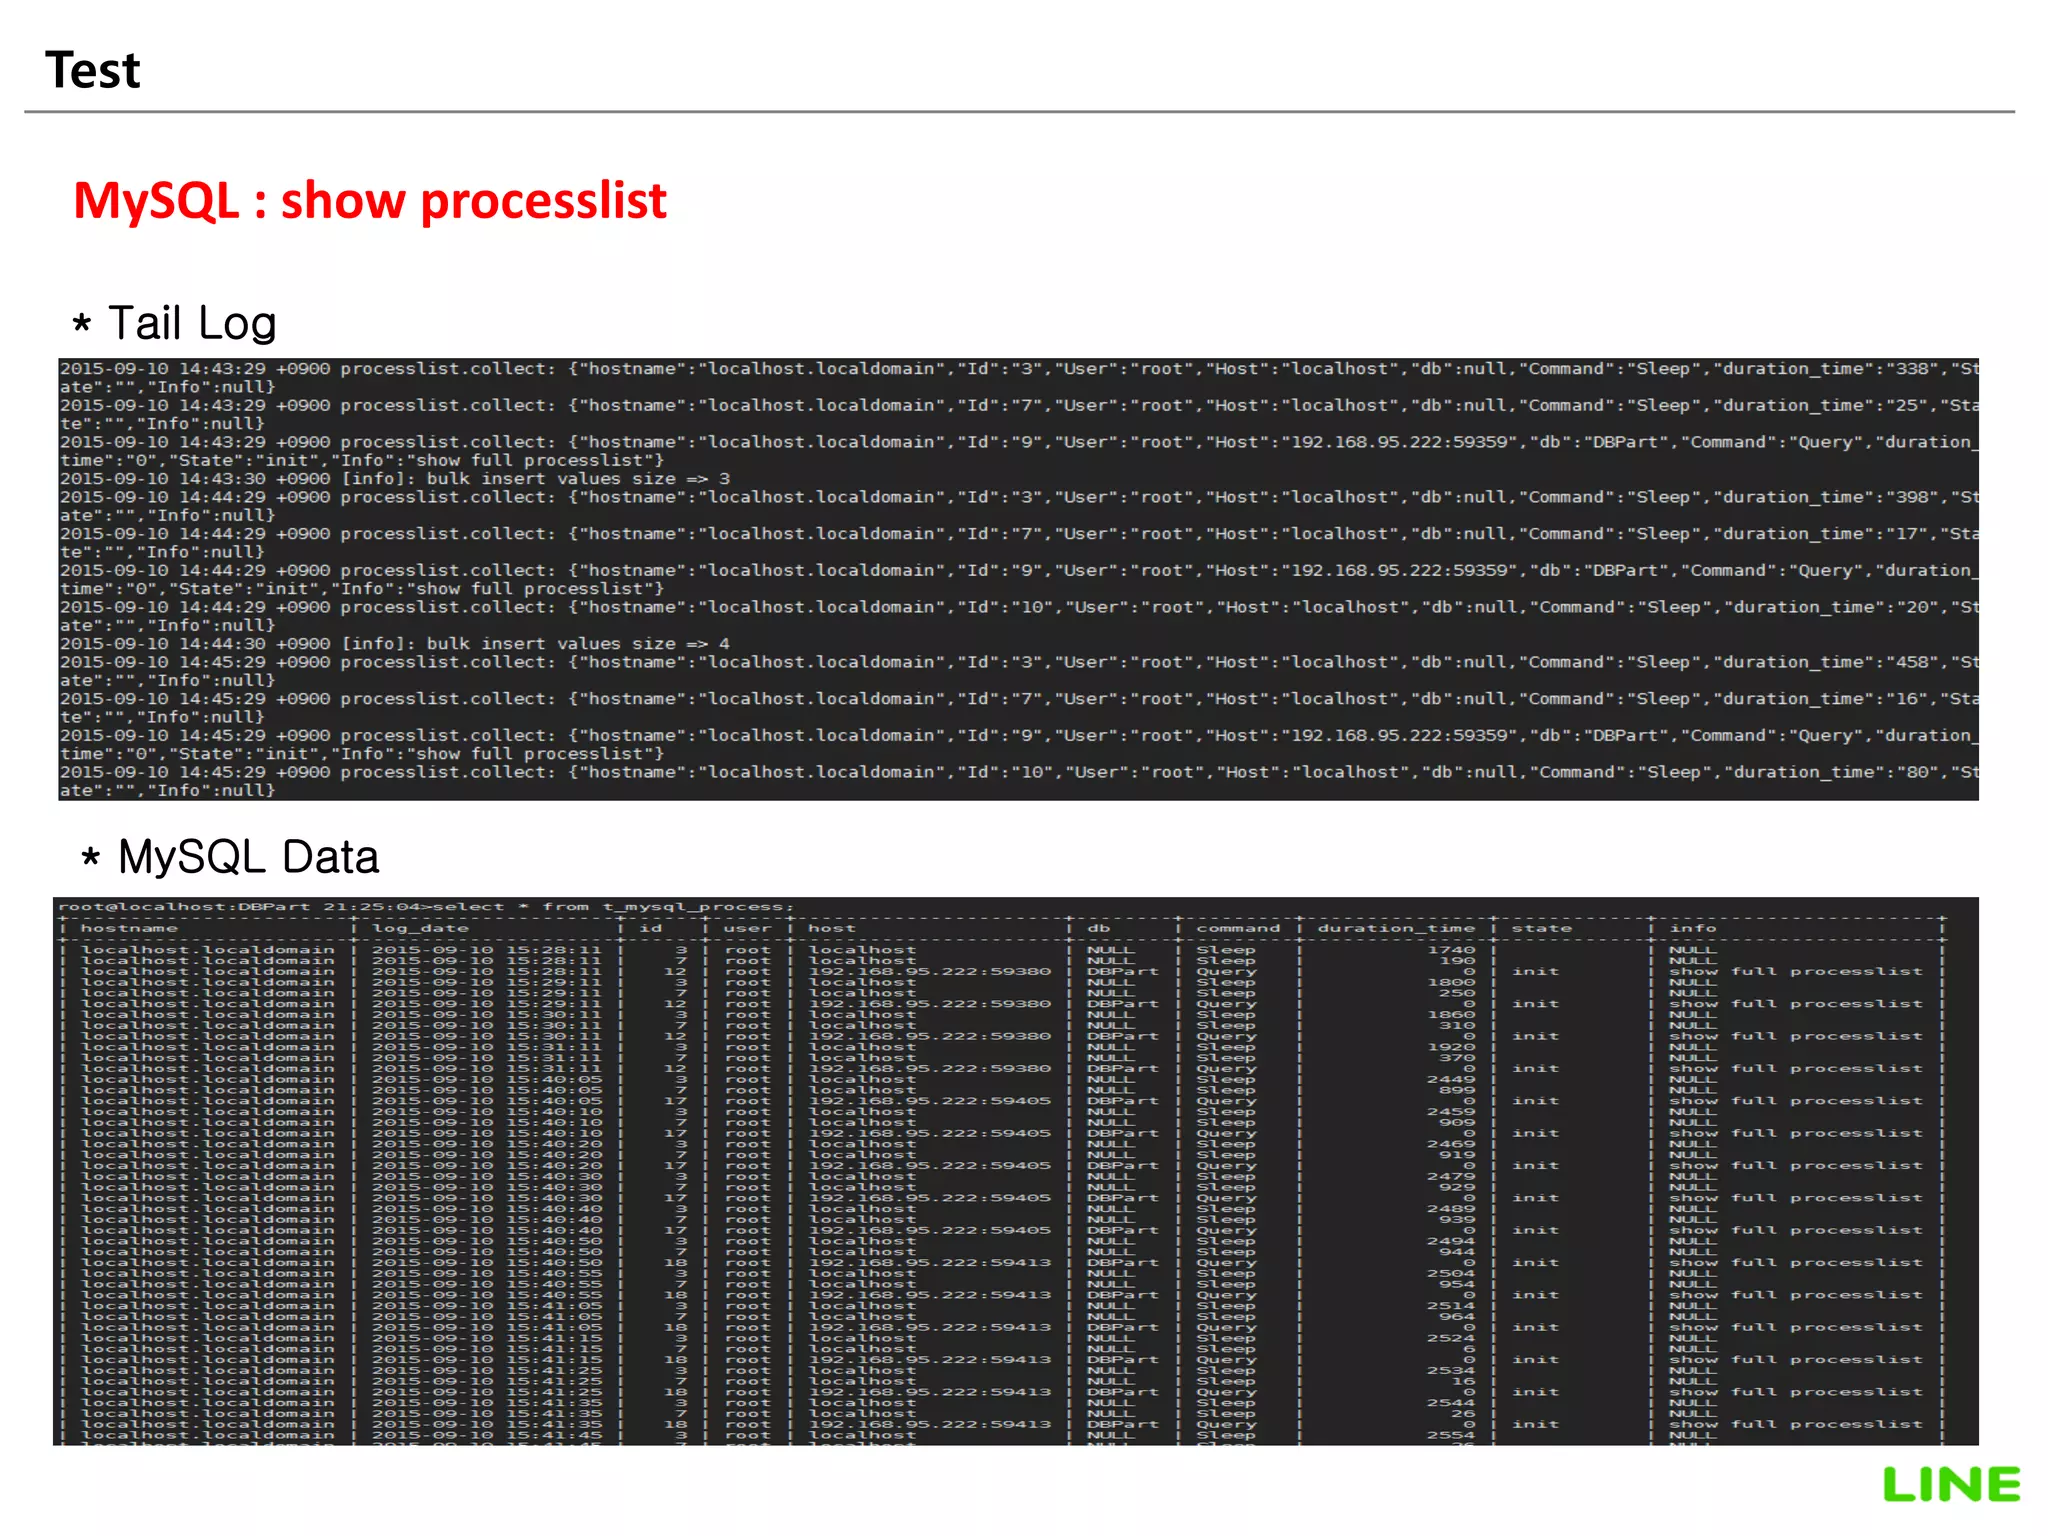
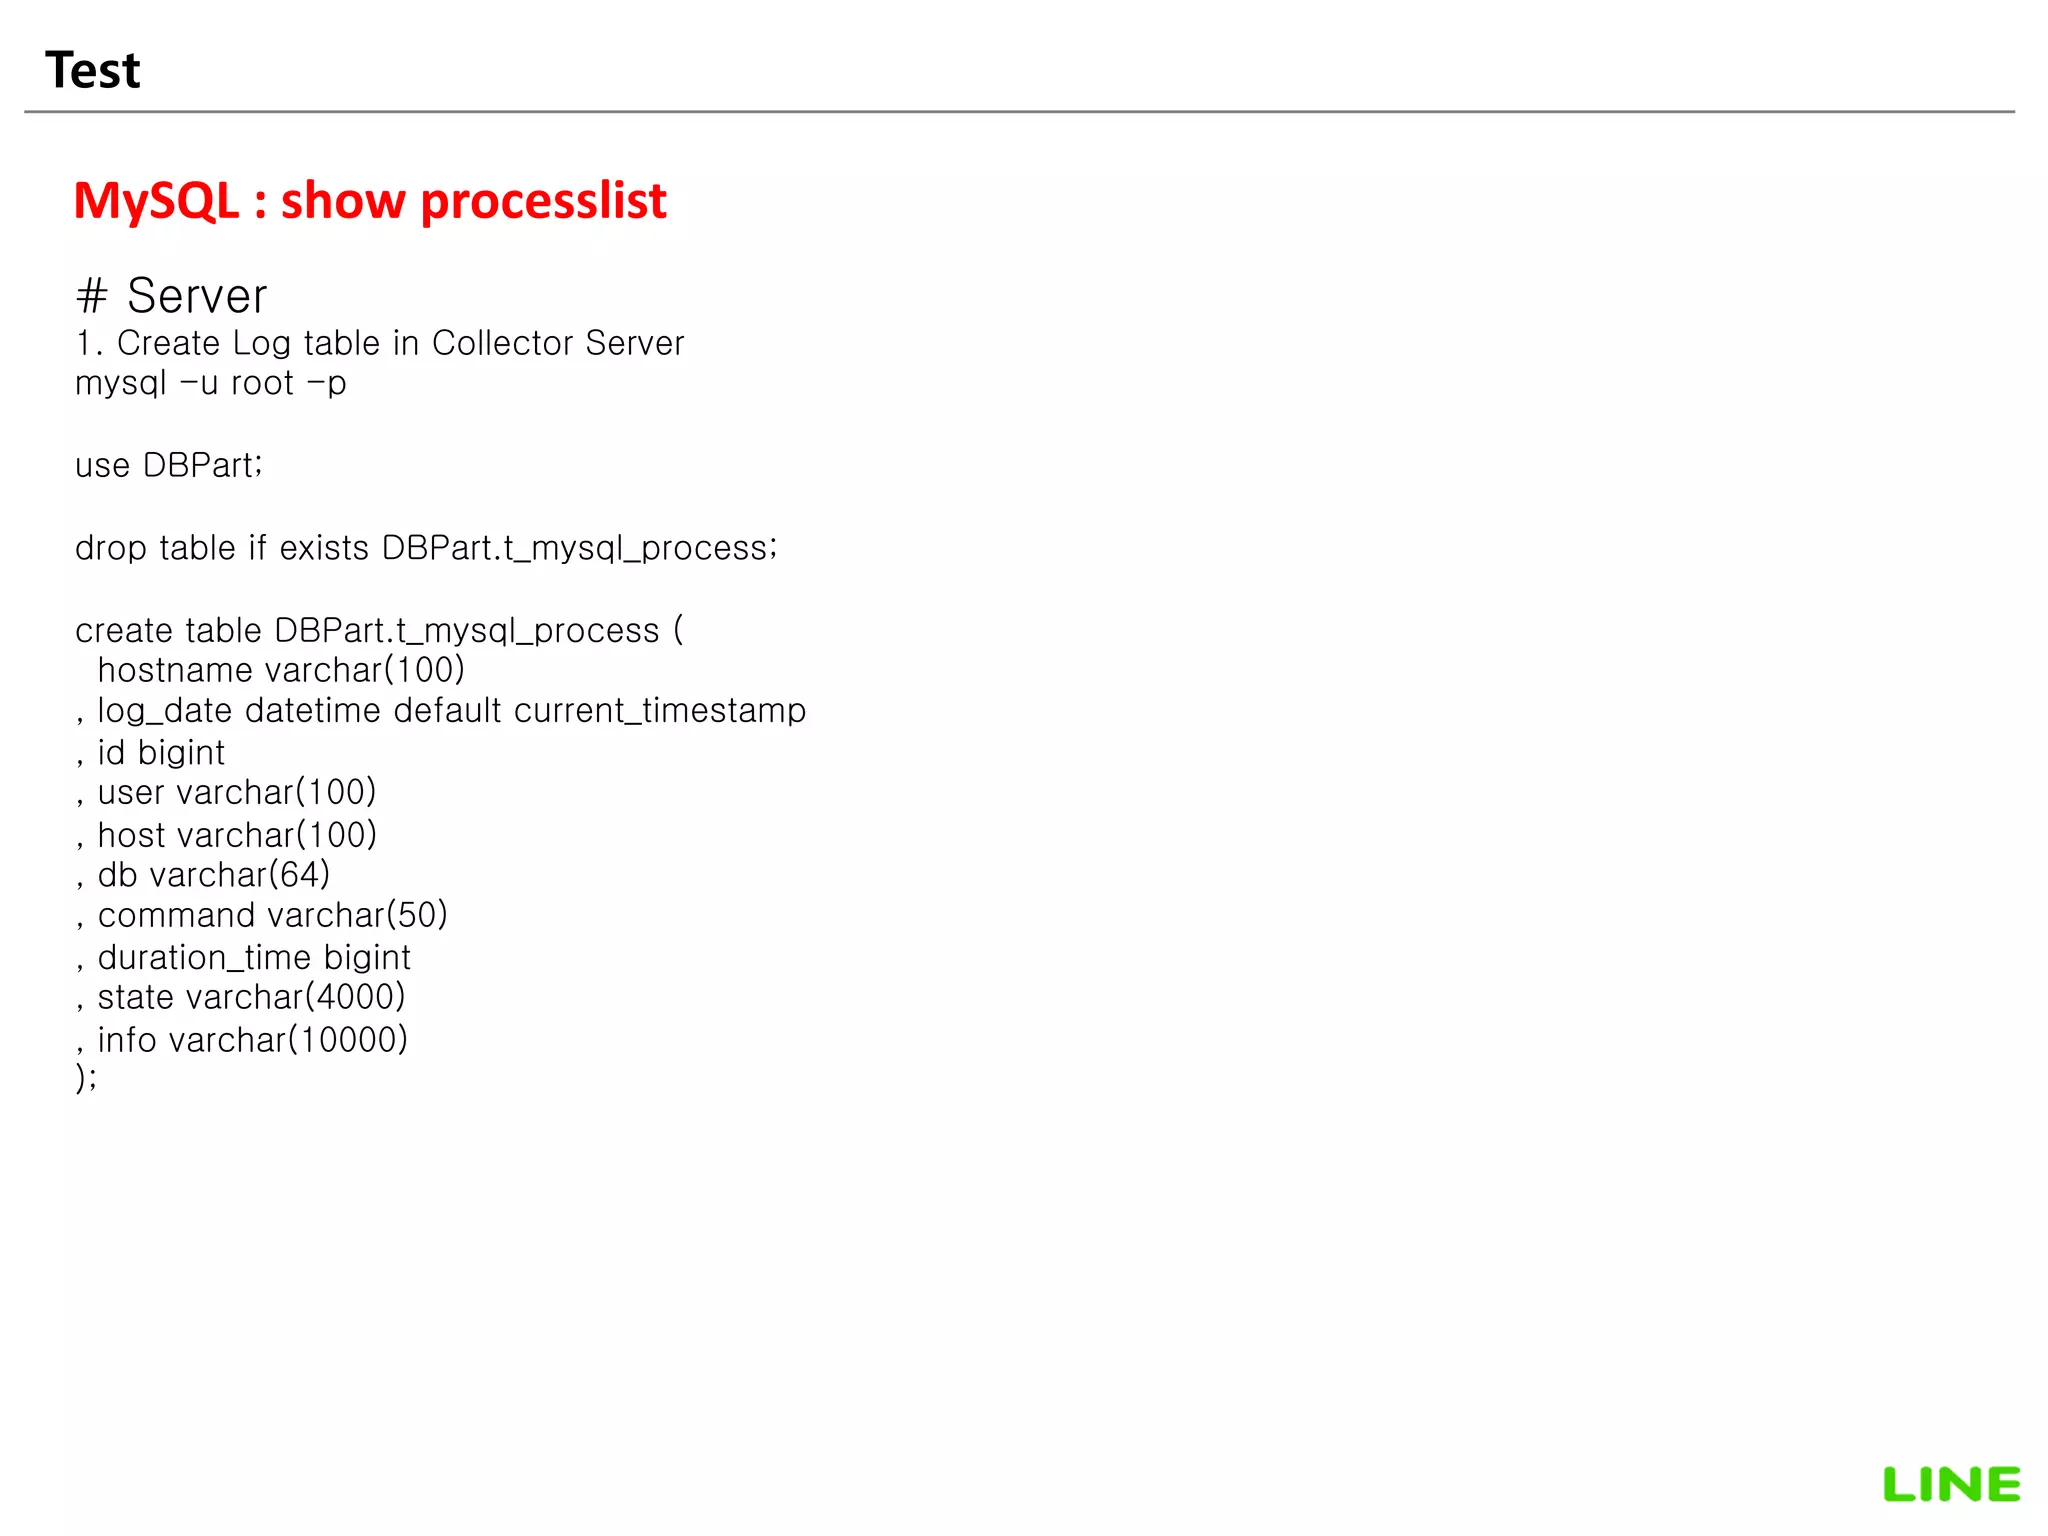
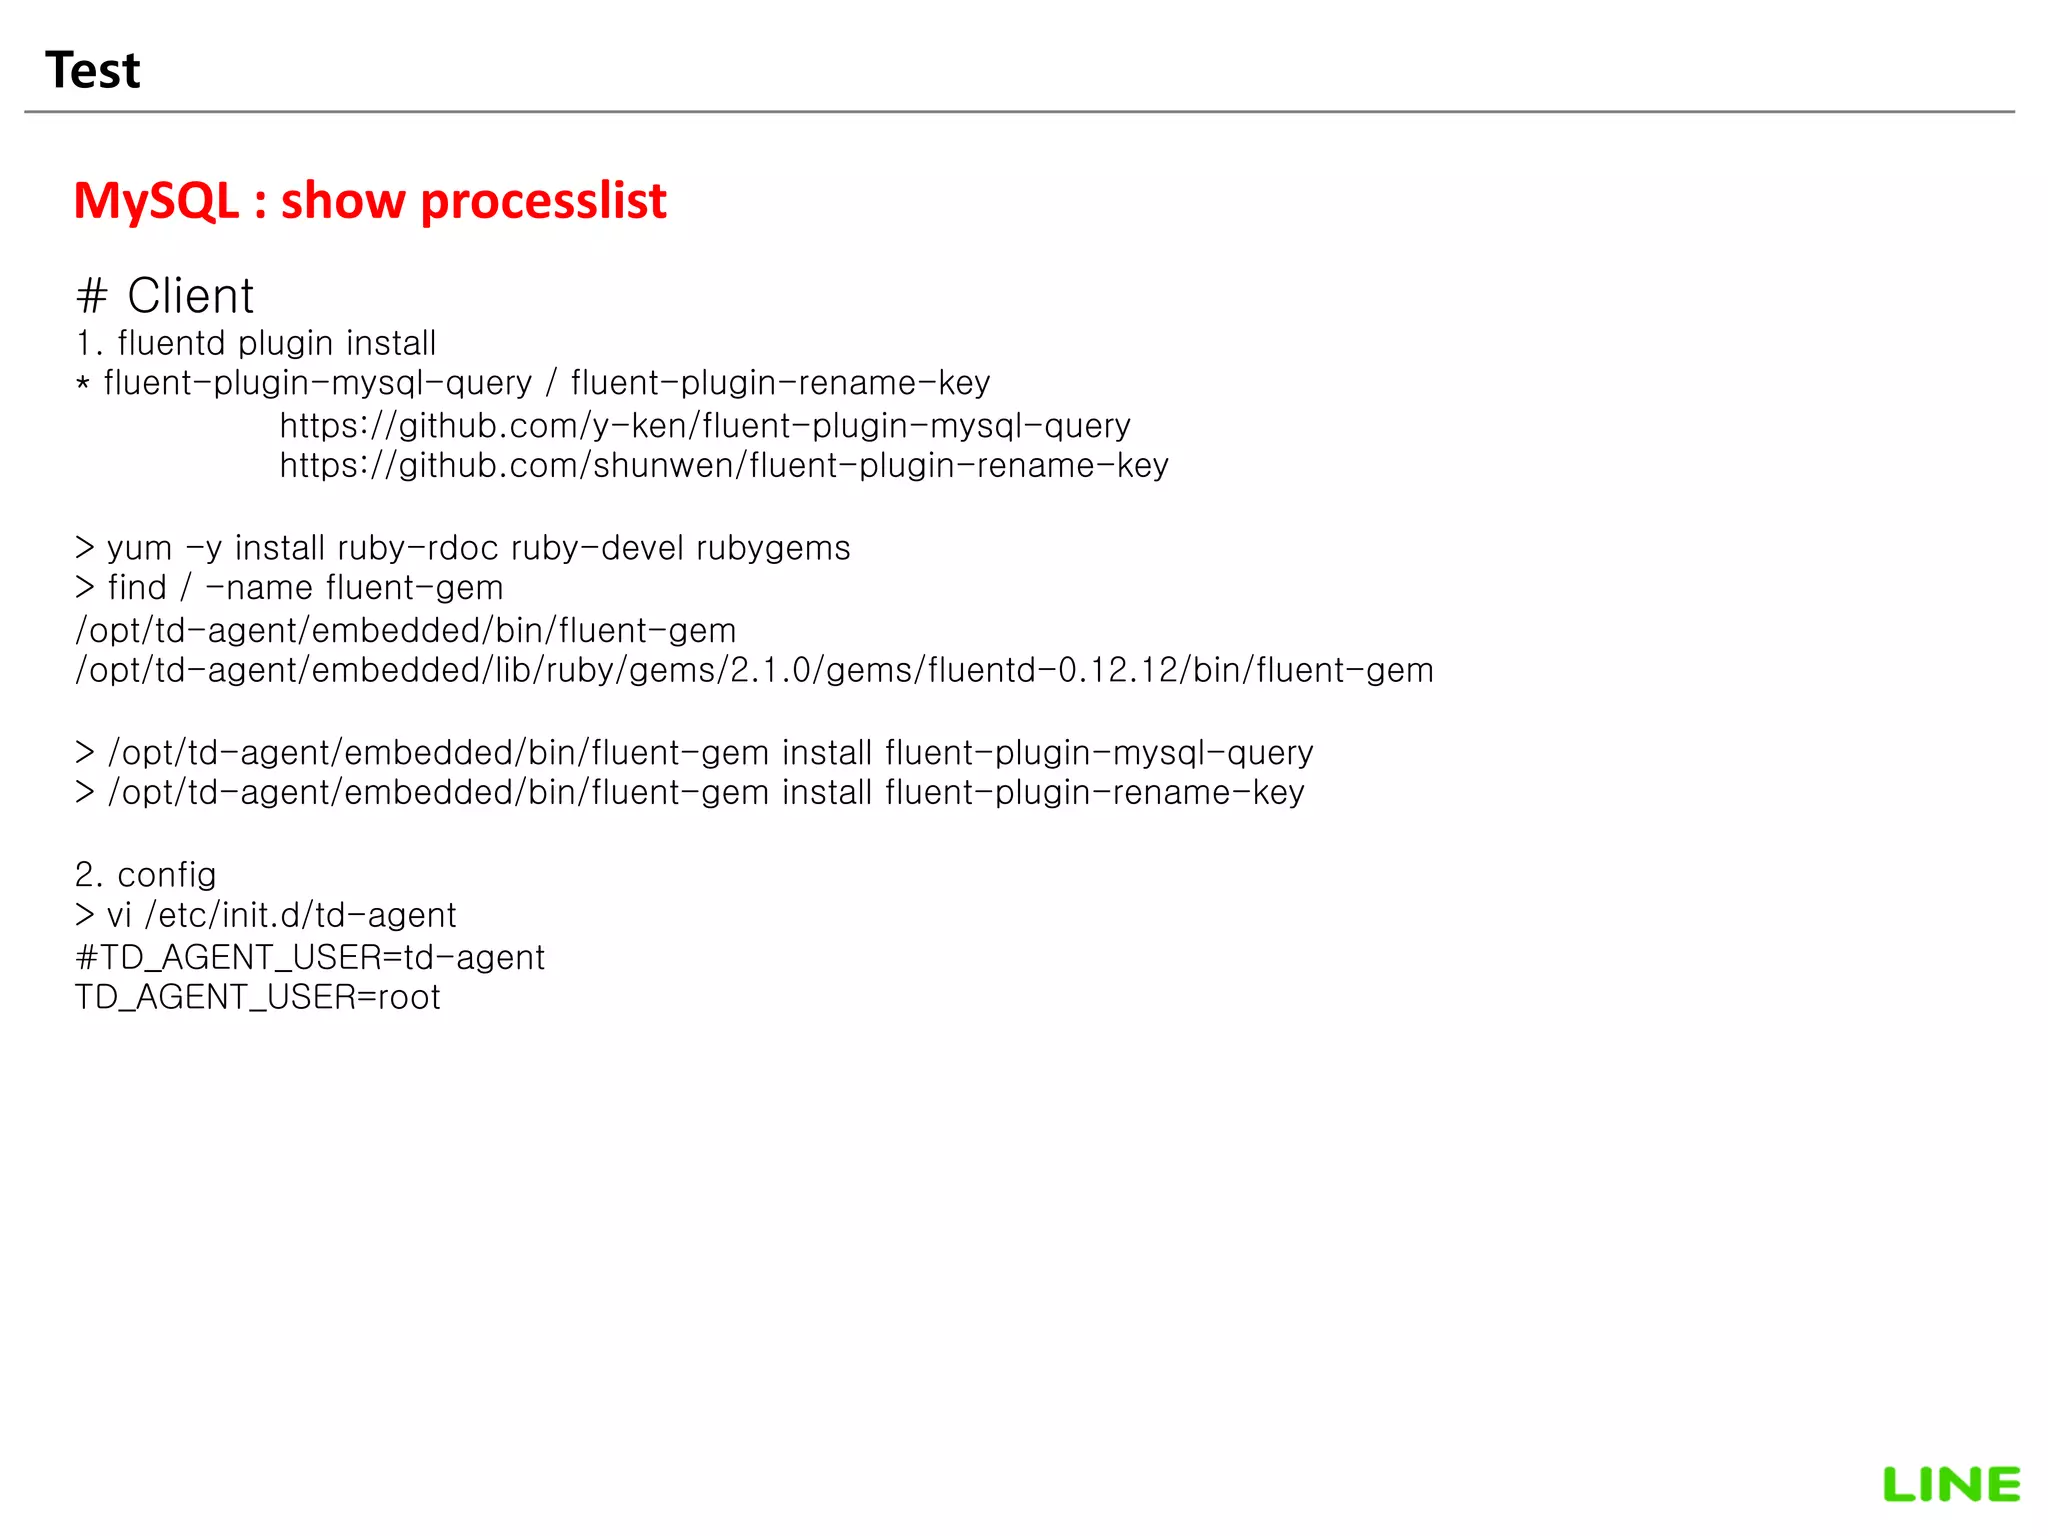
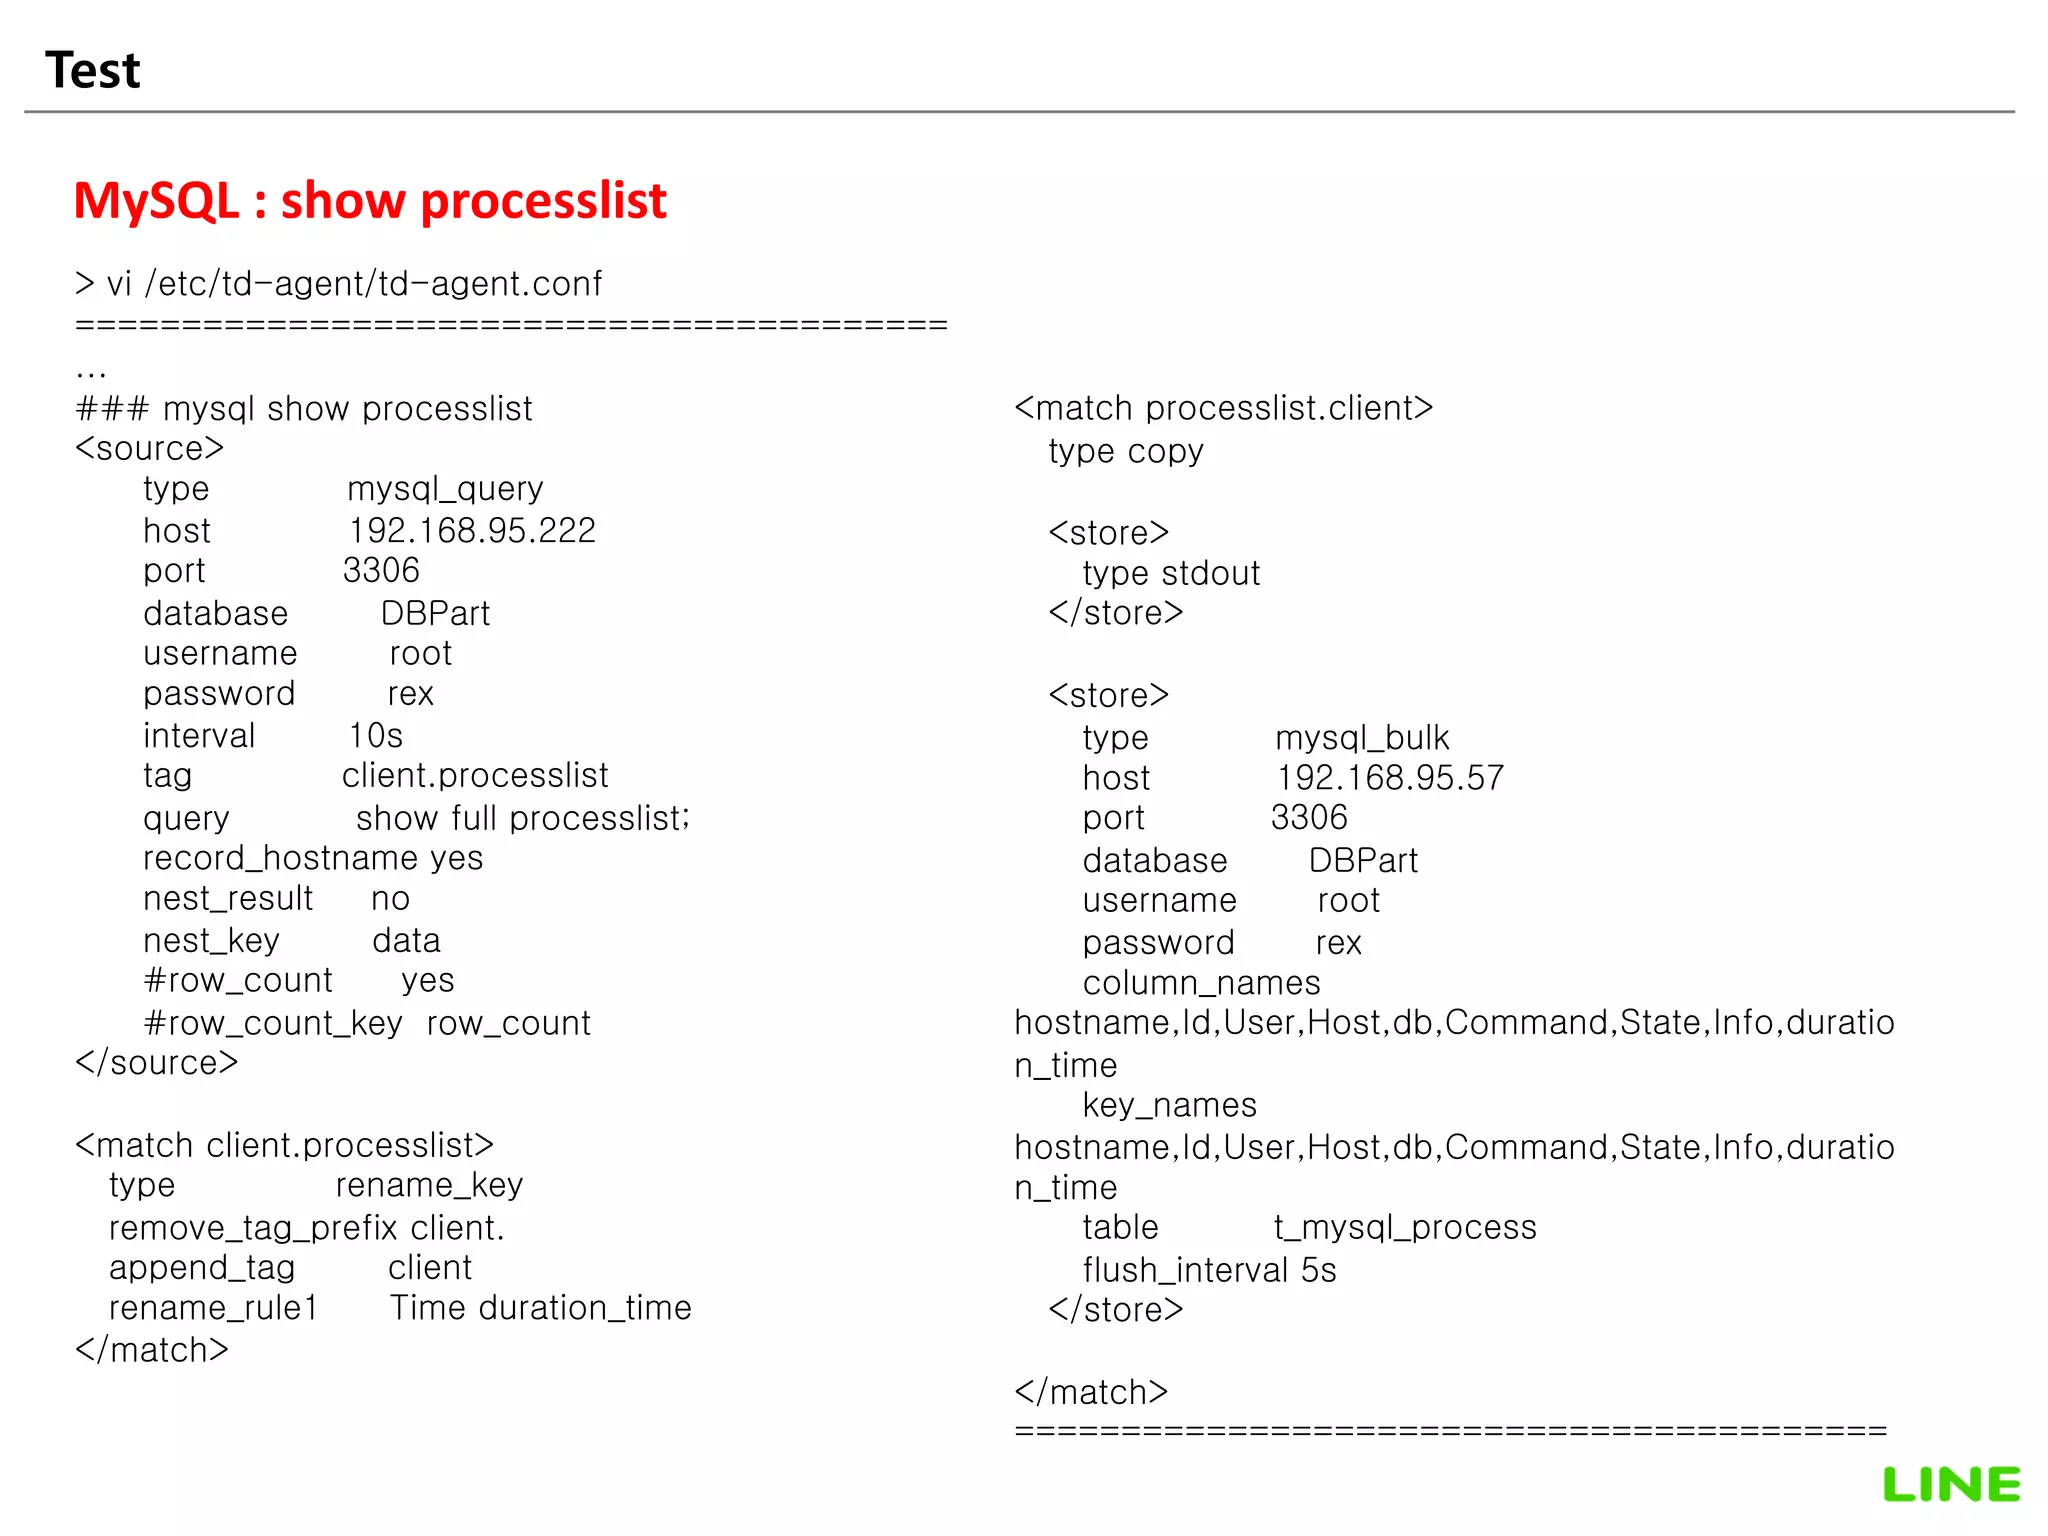
MySQL : show processlist
3. td-agent restart
service td-agent stop
Shutting down td-agent: [ OK ]
service td-agent start
Starting td-agent: [ OK ]
4. show processlist;
* client
mysql -u root -p
root@localhost:(none) 14:43:47>show processlist;
+----+------+----------------------+--------+---------+------+-------+------------------+
| Id | User | Host | db | Command | Time | State | Info |
+----+------+----------------------+--------+---------+------+-------+------------------+
| 3 | root | localhost | NULL | Sleep | 381 | | NULL |
| 7 | root | localhost | NULL | Query | 0 | init | show processlist |
| 9 | root | 192.168.95.222:59359 | DBPart | Sleep | 43 | | NULL |
| 10 | root | localhost | NULL | Sleep | 3 | | NULL |
+----+------+----------------------+--------+---------+------+-------+------------------+
4 rows in set (0.00 sec)
[root@localhost ~]# tail -f /var/log/td-agent/td-agent.log
…
2015-09-10 14:47:29 +0900 processlist.collect: {"hostname":"localhost.localdomain","Id":"3","User":"root","Host":"localhost","db":null,"Command":"Sleep","duration_time":"578","State":"","Info":null}
2015-09-10 14:47:29 +0900 processlist.collect: {"hostname":"localhost.localdomain","Id":"7","User":"root","Host":"localhost","db":null,"Command":"Sleep","duration_time":"60","State":"","Info":null}
2015-09-10 14:47:29 +0900 processlist.collect:
{"hostname":"localhost.localdomain","Id":"9","User":"root","Host":"192.168.95.222:59359","db":"DBPart","Command":"Query","duration_time":"0","State":"init","Info":"show full processlist"}
2015-09-10 14:47:30 +0900 [info]: bulk insert values size => 3
--> Send every 1 minutes](https://image.slidesharecdn.com/fluentd20150918nodemopublic-190322024550/75/Fluentd-20150918-no_demo_public-32-2048.jpg)


![Test 38
Error Test
Case. MySQL server down Error
* client
use mysql;
select sleep(1);
select sleep(1);
select sleep(1);
select sleep(1);
select sleep(1);
select sleep(1);
select sleep(1);
select sleep(1);
select sleep(1);
select sleep(1);
select sleep(1); <-- mysql server stop
select sleep(1);
select sleep(1);
select sleep(1);
select sleep(1);
select sleep(1);
select sleep(1);
select sleep(1);
select sleep(1);
select sleep(1);
<-- mysql server start
* server
> select * from t_mysql_slow;
+-----+----------+----------+-------+------------+-----------+---------+--------------+--------------+-----------+------------
---+--------------------------------------------+
| seq | hostname | log_date | db | user | host | host_ip | query_time | lock_time | rows_sent | rows_examined | sql_text |
+-----+----------+----------+-------+------------+-----------+---------+--------------+--------------+-----------+------------
---+--------------------------------------------+
| 1 | NULL | NULL | mysql | root[root] | localhost | | 1.0015090000 | 0.0000000000 | 1 | 0 | SET timestamp=1441862020; select sleep(1);
|
| 2 | NULL | NULL | mysql | root[root] | localhost | | 1.0004050000 | 0.0000000000 | 1 | 0 | SET timestamp=1441862021; select sleep(1);
|
| 3 | NULL | NULL | mysql | root[root] | localhost | | 1.0004840000 | 0.0000000000 | 1 | 0 | SET timestamp=1441862022; select sleep(1);
|
| 4 | NULL | NULL | mysql | root[root] | localhost | | 1.0004360000 | 0.0000000000 | 1 | 0 | SET timestamp=1441862023; select sleep(1);
|
| 5 | NULL | NULL | mysql | root[root] | localhost | | 1.0011230000 | 0.0000000000 | 1 | 0 | SET timestamp=1441862024; select sleep(1);
|
| 6 | NULL | NULL | mysql | root[root] | localhost | | 1.0007080000 | 0.0000000000 | 1 | 0 | SET timestamp=1441862025; select sleep(1);
|
| 7 | NULL | NULL | mysql | root[root] | localhost | | 1.0012720000 | 0.0000000000 | 1 | 0 | SET timestamp=1441862026; select sleep(1);
|
| 8 | NULL | NULL | mysql | root[root] | localhost | | 1.0004110000 | 0.0000000000 | 1 | 0 | SET timestamp=1441862027; select sleep(1);
|
| 9 | NULL | NULL | mysql | root[root] | localhost | | 1.0003540000 | 0.0000000000 | 1 | 0 | SET timestamp=1441862028; select sleep(1);
|
| 10 | NULL | NULL | mysql | root[root] | localhost | | 1.0003870000 | 0.0000000000 | 1 | 0 | SET timestamp=1441862029; select sleep(1);
|
| 11 | NULL | NULL | mysql | root[root] | localhost | | 1.0005050000 | 0.0000000000 | 1 | 0 | SET timestamp=1441862030; select sleep(1);
|
| 12 | NULL | NULL | mysql | root[root] | localhost | | 1.0005450000 | 0.0000000000 | 1 | 0 | SET timestamp=1441862031; select sleep(1);
|
| 13 | NULL | NULL | mysql | root[root] | localhost | | 1.0002890000 | 0.0000000000 | 1 | 0 | SET timestamp=1441862032; select sleep(1);
|
| 14 | NULL | NULL | mysql | root[root] | localhost | | 1.0011930000 | 0.0000000000 | 1 | 0 | SET timestamp=1441862033; select sleep(1);
|
| 15 | NULL | NULL | mysql | root[root] | localhost | | 1.0010970000 | 0.0000000000 | 1 | 0 | SET timestamp=1441862034; select sleep(1);
|
| 16 | NULL | NULL | mysql | root[root] | localhost | | 1.0012100000 | 0.0000000000 | 1 | 0 | SET timestamp=1441862035; select sleep(1);
|
| 17 | NULL | NULL | mysql | root[root] | localhost | | 1.0012670000 | 0.0000000000 | 1 | 0 | SET timestamp=1441862036; select sleep(1);
|
| 18 | NULL | NULL | mysql | root[root] | localhost | | 1.0007300000 | 0.0000000000 | 1 | 0 | SET timestamp=1441862037; select sleep(1);
|
| 19 | NULL | NULL | mysql | root[root] | localhost | | 1.0007950000 | 0.0000000000 | 1 | 0 | SET timestamp=1441862038; select sleep(1);
|
| 20 | NULL | NULL | mysql | root[root] | localhost | | 1.0010920000 | 0.0000000000 | 1 | 0 | SET timestamp=1441862039; select sleep(1);
|
+-----+----------+----------+-------+------------+-----------+---------+--------------+--------------+-----------+------------
---+--------------------------------------------+
20 rows in set (0.00 sec)](https://image.slidesharecdn.com/fluentd20150918nodemopublic-190322024550/75/Fluentd-20150918-no_demo_public-38-2048.jpg)

![Test 40
Load Test
# press bash shell script
> vi slow_log_sleep.sh
------------------------------------------------------------------------------------
#!/bin/bash
i=0
x=120
while [ $i -ne $x ]
do
/mysql/bin/mysql -u root -p'rex' -e"select sleep(1);"
i=$(( $i + 1 ))
done
------------------------------------------------------------------------------------](https://image.slidesharecdn.com/fluentd20150918nodemopublic-190322024550/75/Fluentd-20150918-no_demo_public-40-2048.jpg)
![Test 41
Load Test
Case1. press slow query
* Before press status
- cpu : idle 99~100%
- mem : used 737M
- I/O : read 0K, write 0K
[root@localhost ~]# dstat -c -d -n -p -s -m
----total-cpu-usage---- -dsk/total- -net/total- ---procs--- ----swap--- ------memory-usage-----
usr sys idl wai hiq siq| read writ| recv send|run blk new| used free| used buff cach free
0 0 99 1 0 0| 34k 99k| 0 0 | 0 0 0.3|1118M 930M| 737M 7304k 92.7M 152M
0 0 99 0 0 1| 0 0 | 60B 1082B| 0 0 0|1118M 930M| 737M 7304k 92.7M 152M
0 0 100 0 0 0| 0 0 | 300B 592B| 0 0 0|1118M 930M| 737M 7304k 92.7M 152M
0 0 100 0 0 0| 0 0 | 60B 442B| 0 0 0|1118M 930M| 737M 7304k 92.7M 152M
0 0 100 0 0 0| 0 0 | 150B 496B| 0 0 0|1118M 930M| 737M 7304k 92.7M 152M
0 1 99 0 0 0| 0 0 | 150B 496B| 0 0 0|1118M 930M| 737M 7304k 92.7M 152M
0 0 100 0 0 0| 0 0 | 332B 1086B| 0 0 1.0|1118M 930M| 737M 7304k 92.7M 152M
0 1 99 0 0 0| 0 0 | 332B 1032B| 0 0 1.0|1118M 930M| 737M 7304k 92.7M 152M
1 0 99 0 0 0| 0 0 | 60B 442B| 0 0 0|1118M 930M| 737M 7304k 92.7M 152M
0 0 100 0 0 0| 0 0 | 60B 442B| 0 0 0|1118M 930M| 737M 7304k 92.7M 152M
0 0 99 0 0 1| 0 0 | 60B 442B| 0 0 0|1118M 930M| 737M 7304k 92.7M 152M
0 1 99 0 0 0| 0 0 | 60B 442B| 0 0 0|1118M 930M| 737M 7304k 92.7M 152M
0 0 100 0 0 0| 0 0 | 60B 442B| 0 0 0|1118M 930M| 737M 7304k 92.7M 152M](https://image.slidesharecdn.com/fluentd20150918nodemopublic-190322024550/75/Fluentd-20150918-no_demo_public-41-2048.jpg)
![Test 42
Load Test
Case1. press slow query
* Pressing status
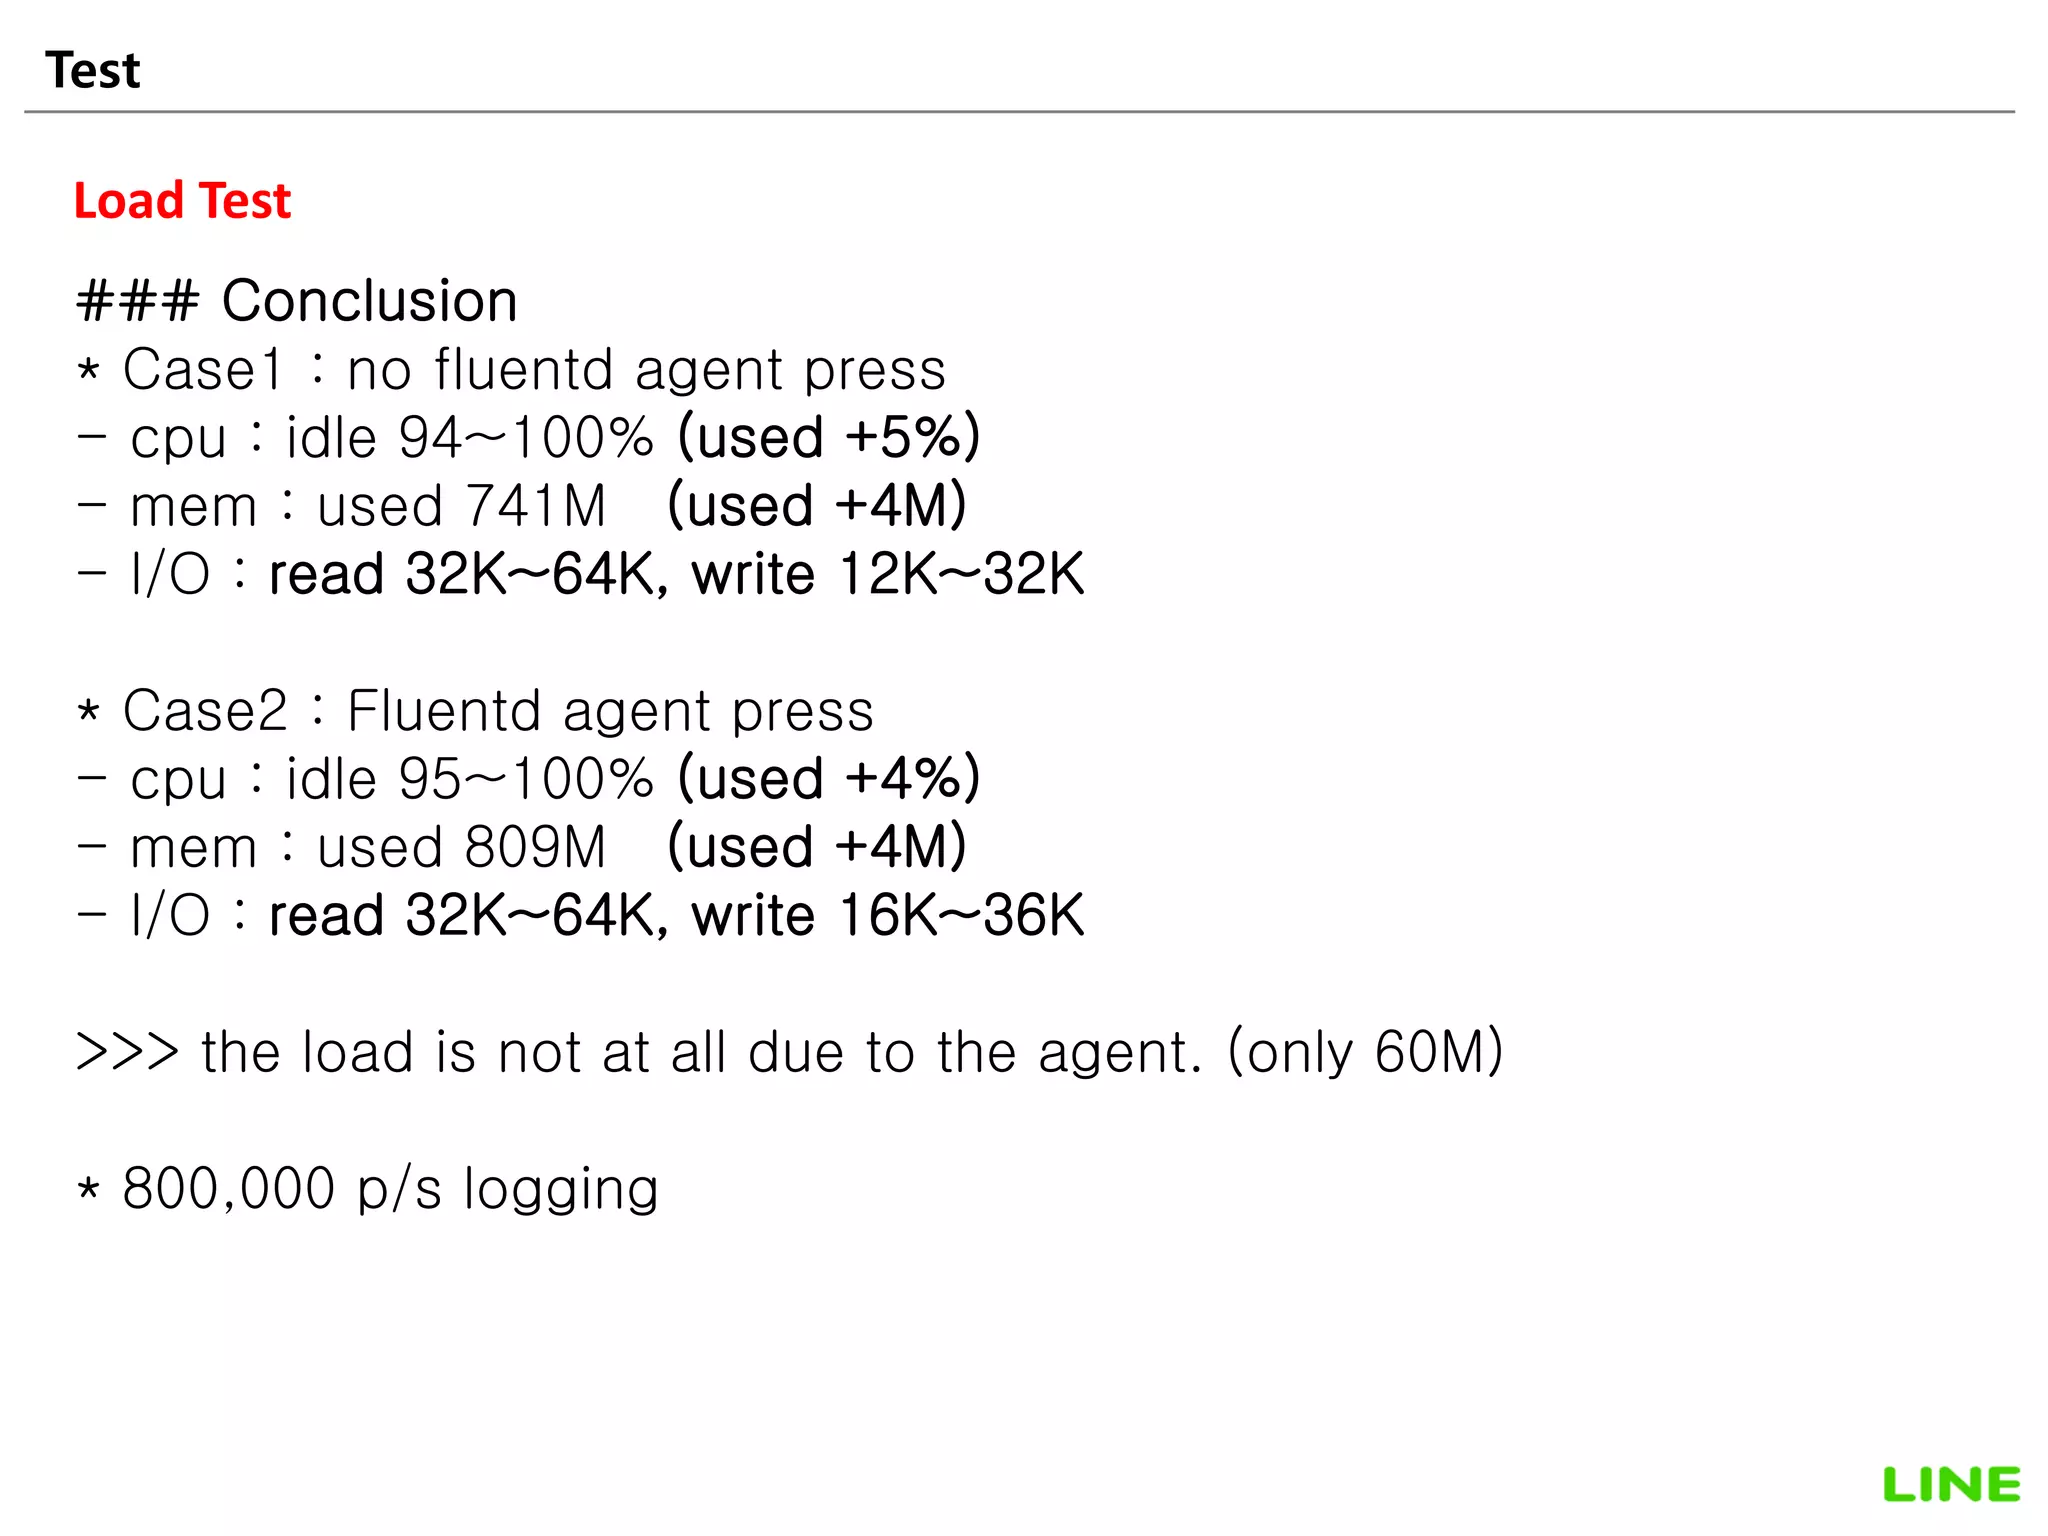
- cpu : idle 94~100% (used +5%)
- mem : used 741M (used +4M)
- I/O : read 32K~64K, write 12K~32K
[root@localhost ~]# dstat -c -d -n -p -s -m
----total-cpu-usage---- -dsk/total- -net/total- ---procs--- ----swap--- ------memory-usage-----
usr sys idl wai hiq siq| read writ| recv send|run blk new| used free| used buff cach free
1 0 99 0 0 0| 32k 0 | 120B 782B|1.0 0 2.0|1114M 934M| 741M 7392k 92.7M 148M
0 1 99 0 0 0| 32k 28k| 120B 1438B| 0 0 2.0|1114M 934M| 741M 7400k 92.7M 148M
0 1 99 0 0 0| 64k 0 | 120B 798B| 0 0 2.0|1114M 934M| 741M 7400k 92.7M 148M
1 1 97 0 1 0| 64k 0 | 120B 782B| 0 0 2.0|1114M 934M| 741M 7400k 92.7M 148M
0 1 99 0 0 0| 32k 0 | 120B 782B| 0 0 2.0|1114M 934M| 741M 7400k 92.7M 148M
1 0 99 0 0 0| 96k 0 | 120B 782B| 0 0 2.0|1114M 934M| 741M 7400k 92.7M 148M
0 1 99 0 0 0| 32k 16k| 120B 782B| 0 0 2.0|1114M 934M| 741M 7408k 92.7M 148M
1 0 99 0 0 0| 64k 0 | 120B 798B| 0 0 2.0|1114M 934M| 741M 7408k 92.7M 148M
1 1 98 0 0 0| 64k 0 | 120B 782B| 0 0 2.0|1114M 934M| 742M 7408k 92.7M 147M
0 0 100 0 0 0| 32k 0 | 120B 782B| 0 0 2.0|1114M 934M| 742M 7408k 92.7M 147M
1 1 97 0 0 1| 64k 0 | 120B 782B|4.0 0 2.0|1114M 934M| 742M 7408k 92.7M 147M
0 1 96 3 0 0| 32k 16k| 120B 782B| 0 0 2.0|1114M 934M| 742M 7416k 92.7M 147M
0 1 99 0 0 0| 64k 12k| 210B 852B| 0 0 2.0|1114M 934M| 742M 7416k 92.7M 147M
1 1 96 2 0 0| 64k 0 | 210B 852B| 0 0 2.0|1114M 934M| 742M 7416k 92.7M 147M
0 0 100 0 0 0| 64k 0 | 120B 782B| 0 0 2.0|1114M 934M| 742M 7416k 92.7M 147M
1 1 98 0 0 0| 32k 0 | 210B 836B| 0 0 2.0|1114M 934M| 742M 7416k 92.7M 147M
0 1 99 0 0 0| 32k 16k| 210B 836B| 0 0 2.0|1113M 935M| 742M 7424k 92.7M 147M
0 0 100 0 0 0| 32k 0 | 120B 798B| 0 0 2.0|1113M 935M| 742M 7424k 92.7M 147M
1 1 93 5 0 0| 64k 0 | 180B 824B| 0 0 2.0|1113M 935M| 742M 7424k 92.7M 147M
0 1 94 5 0 0| 96k 0 | 120B 782B| 0 0 2.0|1113M 935M| 742M 7424k 92.7M 147M](https://image.slidesharecdn.com/fluentd20150918nodemopublic-190322024550/75/Fluentd-20150918-no_demo_public-42-2048.jpg)
![Test 43
Load Test
Case2. press fluentd & slow query
* Before press status
- cpu : idle 99~100%
- mem : used 737M
- I/O : read 0K, write 0K
[root@localhost ~]# dstat -c -d -n -p -s -m
----total-cpu-usage---- -dsk/total- -net/total- ---procs--- ----swap--- ------memory-usage-----
usr sys idl wai hiq siq| read writ| recv send|run blk new| used free| used buff cach free
0 0 100 0 0 0| 0 0 | 242B 496B| 0 0 0|1112M 936M| 743M 7652k 93.2M 145M
0 0 100 0 0 0| 0 0 | 242B 1242B| 0 0 0|1112M 936M| 743M 7652k 93.2M 145M
0 0 100 0 0 0| 0 0 | 244B 442B| 0 0 0|1112M 936M| 743M 7652k 93.2M 145M
0 1 99 0 0 0| 0 0 | 152B 442B| 0 0 0|1112M 936M| 743M 7652k 93.2M 145M
0 0 100 0 0 0| 0 0 | 152B 442B| 0 0 0|1112M 936M| 743M 7652k 93.2M 145M
0 0 100 0 0 0| 0 0 | 244B 442B| 0 0 0|1112M 936M| 743M 7652k 93.2M 145M
0 0 100 0 0 0| 0 0 | 152B 442B| 0 0 0|1112M 936M| 743M 7652k 93.2M 145M
0 0 100 0 0 0| 0 0 | 152B 442B| 0 0 0|1112M 936M| 743M 7652k 93.2M 145M
0 0 100 0 0 0| 0 0 | 244B 442B| 0 0 0|1112M 936M| 743M 7652k 93.2M 145M
1 1 98 0 0 0| 0 0 | 152B 442B| 0 0 0|1112M 936M| 743M 7652k 93.2M 145M
0 0 100 0 0 0| 0 0 | 152B 442B| 0 0 0|1112M 936M| 743M 7652k 93.2M 145M
0 0 100 0 0 0| 0 0 | 152B 442B| 0 0 0|1112M 936M| 743M 7652k 93.2M 145M
0 0 100 0 0 0| 0 0 | 244B 442B| 0 0 0|1112M 936M| 743M 7652k 93.2M 145M
0 0 100 0 0 0| 0 0 | 152B 442B| 0 0 0|1112M 936M| 743M 7652k 93.2M 145M
0 0 100 0 0 0| 0 0 | 212B 484B| 0 0 0|1112M 936M| 743M 7652k 93.2M 145M
0 0 100 0 0 0| 0 0 | 244B 442B| 0 0 0|1112M 936M| 743M 7652k 93.2M 145M
0 1 99 0 0 0| 0 0 | 152B 442B| 0 0 0|1112M 936M| 743M 7652k 93.2M 145M
0 0 100 0 0 0| 0 0 | 242B 496B| 0 0 0|1112M 936M| 743M 7652k 93.2M 145M
0 0 100 0 0 0| 0 0 | 244B 442B| 0 0 0|1112M 936M| 743M 7652k 93.2M 145M
0 0 100 0 0 0| 0 0 | 152B 442B| 0 0 0|1112M 936M| 743M 7652k 93.2M 145M](https://image.slidesharecdn.com/fluentd20150918nodemopublic-190322024550/75/Fluentd-20150918-no_demo_public-43-2048.jpg)
![Test 44
Load Test
Case2. press fluentd & slow query
* service td-agent start
- cpu : idle 99~100%
- mem : used 804M (60M used)
- I/O : read 0K, write 0K
[root@localhost ~]# dstat -c -d -n -p -s -m
----total-cpu-usage---- -dsk/total- -net/total- ---procs--- ----swap--- ------memory-usage-----
usr sys idl wai hiq siq| read writ| recv send|run blk new| used free| used buff cach free
0 0 99 1 0 0| 32k 95k| 0 0 | 0 0 0.3|1112M 936M| 743M 7652k 93.2M 145M
0 0 100 0 0 0| 0 0 | 60B 1082B| 0 0 0|1112M 936M| 743M 7652k 93.2M 145M
0 0 100 0 0 0| 0 0 | 60B 442B| 0 0 0|1112M 936M| 743M 7652k 93.2M 145M
0 0 100 0 0 0| 0 0 | 60B 442B| 0 0 0|1112M 936M| 743M 7652k 93.2M 145M
1 0 99 0 0 0| 0 0 | 60B 442B| 0 0 0|1112M 936M| 743M 7652k 93.2M 145M
12 24 4 56 2 1|2692k 0 | 226B 670B| 0 1.0 24|1112M 936M| 766M 8004k 95.5M 120M <-- agent start
19 23 0 57 0 1|3444k 0 | 60B 628B|1.0 0 0|1112M 936M| 776M 8856k 98.0M 106M
7 54 0 36 1 1| 872k 6532k| 180B 2072B|1.0 0 9.0|1118M 930M| 827M 6988k 90.6M 64.6M
11 14 51 24 0 0|2448k 48k|1921B 5230B| 0 0 9.0|1118M 930M| 804M 7244k 84.8M 93.2M
0 0 100 0 0 0| 0 0 | 60B 458B| 0 0 0|1118M 930M| 804M 7244k 84.8M 93.2M
0 0 100 0 0 0| 0 0 | 60B 442B| 0 0 0|1118M 930M| 804M 7244k 84.8M 93.2M
0 0 100 0 0 0| 0 0 | 60B 442B| 0 0 0|1118M 930M| 804M 7244k 84.8M 93.2M
0 0 100 0 0 0| 0 0 | 60B 442B| 0 0 0|1118M 930M| 804M 7244k 84.8M 93.2M
0 0 100 0 0 0| 0 0 | 150B 496B| 0 0 0|1118M 930M| 804M 7252k 84.8M 93.2M
0 0 100 0 0 0| 0 0 | 60B 442B| 0 0 0|1118M 930M| 804M 7252k 84.8M 93.2M
0 0 100 0 0 0| 0 0 | 240B 550B| 0 0 0|1118M 930M| 804M 7252k 84.8M 93.2M
0 0 100 0 0 0| 0 0 | 60B 442B| 0 0 0|1118M 930M| 804M 7252k 84.8M 93.2M
0 0 100 0 0 0| 0 0 | 60B 442B| 0 0 0|1118M 930M| 804M 7252k 84.8M 93.2M
0 0 100 0 0 0| 0 0 | 60B 442B| 0 0 0|1118M 930M| 804M 7252k 84.8M 93.2M
0 0 100 0 0 0| 0 0 | 60B 442B| 0 0 0|1118M 930M| 804M 7252k 84.8M 93.2M
0 0 100 0 0 0| 0 0 | 60B 442B| 0 0 0|1118M 930M| 804M 7252k 84.8M 93.2M](https://image.slidesharecdn.com/fluentd20150918nodemopublic-190322024550/75/Fluentd-20150918-no_demo_public-44-2048.jpg)
![Test 45
Load Test
Case2. press fluentd & slow query
* Pressing status
- cpu : idle 95~100% (used +4%)
- mem : used 809M (used +4M)
- I/O : read 32K~64K, write 16K~36K
[root@localhost ~]# dstat -c -d -n -p -s -m
----total-cpu-usage---- -dsk/total- -net/total- ---procs--- ----swap--- ------memory-usage-----
usr sys idl wai hiq siq| read writ| recv send|run blk new| used free| used buff cach free
1 0 98 1 0 0| 32k 24k| 180B 1112B|1.0 0 2.0|1115M 933M| 807M 7360k 84.9M 89.8M
0 1 97 2 0 0| 64k 24k| 240B 1810B| 0 0 2.0|1115M 933M| 807M 7360k 84.9M 89.6M
1 1 97 1 0 0| 64k 0 | 818B 2602B| 0 0 2.0|1115M 933M| 807M 7360k 84.9M 89.7M
1 1 95 3 0 0| 64k 0 | 180B 1112B| 0 0 2.0|1115M 933M| 807M 7360k 84.9M 89.4M
0 0 100 0 0 0| 64k 0 | 180B 1218B| 0 0 2.0|1115M 933M| 807M 7360k 84.9M 89.6M
1 1 96 2 0 0| 32k 16k| 180B 1112B| 0 0 2.0|1115M 933M| 807M 7368k 84.9M 89.4M
0 0 100 0 0 0| 32k 0 | 180B 1128B| 0 0 2.0|1115M 933M| 807M 7368k 84.9M 89.4M
1 1 98 0 0 0| 64k 0 | 818B 2587B| 0 0 2.0|1115M 933M| 808M 7368k 84.9M 89.3M
0 1 99 0 0 0| 32k 0 | 180B 1112B| 0 0 2.0|1115M 933M| 808M 7368k 84.9M 89.2M
1 1 98 0 0 0| 64k 0 | 180B 1112B|1.0 0 2.0|1115M 933M| 808M 7368k 84.9M 89.3M
0 0 99 1 0 0| 64k 16k| 180B 1112B| 0 0 2.0|1115M 933M| 808M 7376k 84.9M 89.1M
1 1 96 2 0 0| 64k 4096B| 180B 1128B| 0 0 2.0|1115M 933M| 808M 7376k 84.9M 89.1M
0 1 93 6 0 0| 64k 0 | 818B 2602B| 0 0 2.0|1115M 933M| 808M 7376k 84.9M 89.1M
1 0 98 1 0 0| 32k 0 | 180B 1112B| 0 0 2.0|1115M 933M| 808M 7376k 84.9M 89.0M
1 1 95 3 0 0| 64k 0 | 180B 1112B| 0 0 2.0|1115M 933M| 808M 7376k 84.9M 89.0M
0 1 96 3 0 0| 64k 32k| 180B 1112B| 0 0 2.0|1115M 933M| 808M 7384k 84.9M 88.8M
1 1 96 2 0 0| 64k 8192B| 360B 1236B| 0 0 2.0|1114M 934M| 808M 7384k 84.9M 88.8M
0 1 95 2 1 1| 64k 0 | 818B 2603B| 0 0 2.0|1114M 934M| 808M 7384k 84.9M 88.7M
1 0 99 0 0 0| 0 0 | 210B 1166B| 0 0 2.0|1114M 934M| 808M 7384k 84.9M 88.7M
0 1 99 0 0 0| 32k 0 | 270B 1166B| 0 0 2.0|1114M 934M| 808M 7384k 84.9M 88.7M](https://image.slidesharecdn.com/fluentd20150918nodemopublic-190322024550/75/Fluentd-20150918-no_demo_public-45-2048.jpg)


![[오픈소스컨설팅] Linux Network Troubleshooting](https://cdn.slidesharecdn.com/ss_thumbnails/opensourceconsultingnetworktroubleshootingyjlee20210412-210413014206-thumbnail.jpg?width=640&height=640&fit=bounds)