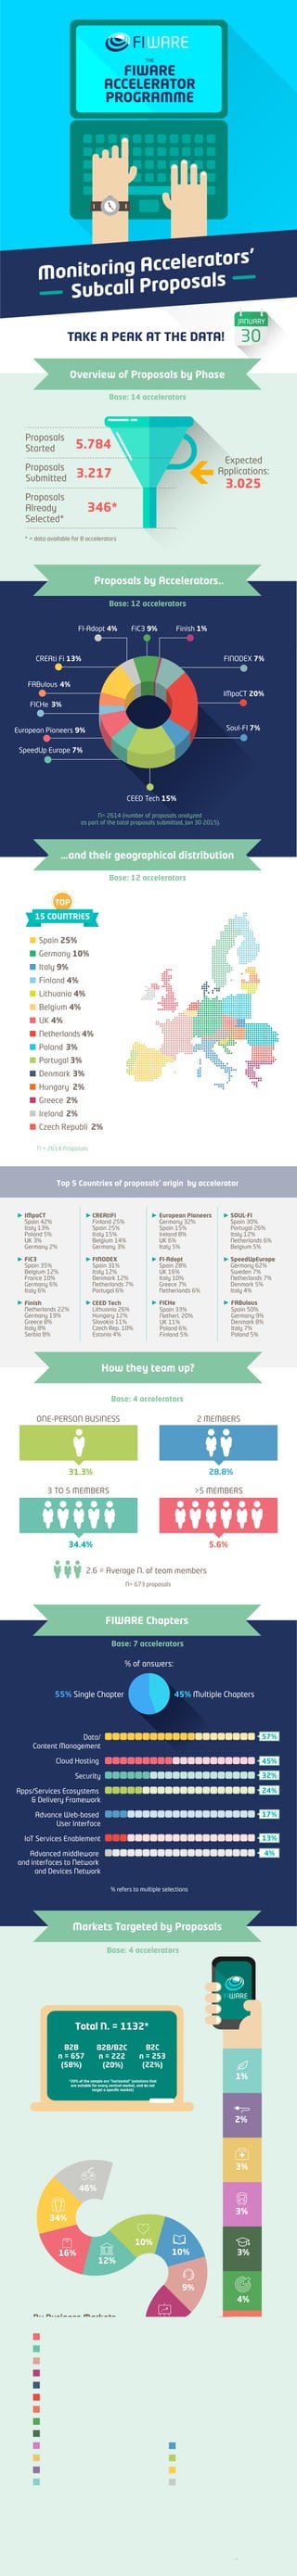
TAKE A PEAK AT THE DATA!
Monitoring Accelerators’
Subcall Proposals
Overview of Proposals by Phase
Base: 14 accelerators
5.784
3.217
346*
Proposals
Already
Selected*
Proposals
Started
* = data available for 8 accelerators
FIWARE Chapters
Base: 7 accelerators
Proposals by Accelerators..
Base: 12 accelerators
How they team up?
Top 5 Countries of proposals' origin by accelerator
Base: 4 accelerators
2.6 = Average N. of team members
ONE-PERSON BUSINESS 2 MEMBERS
3 TO 5 MEMBERS >5 MEMBERS
N= 673 proposals
N= 2614 (number of proposals analyzed
as part of the total proposals submitted, Jan 30 2015).
N = 2614 Proposals
% refers to multiple selections
…and their geographical distribution
Base: 12 accelerators
Spain 25%
Germany 10%
Italy 9%
Finland 4%
Lithuania 4%
Belgium 4%
UK 4%
Netherlands 4%
Poland 3%
Portugal 3%
Denmark 3%
Proposals
Submitted
3.025
Expected
Applications:
FI-Adopt 4%
CREAti Fi 13%
SpeedUp Europe 7%
European Pioneers 9%
FABulous
3%FICHe
4%
FiC3 9% Finish 1%
CEED Tech 15%
FINODEX 7%
IMpaCT 20%
Soul-FI 7%
31.3% 28.8%
34.4% 5.6%
15 COUNTRIES
TOP
European Pioneers
Germany 32%
Spain 15%
Ireland 8%
UK 6%
Italy 5%
FI-Adopt
Spain 28%
UK 16%
Italy 10%
Greece 7%
Netherlands 6%
SOUL-FI
Spain 30%
Portugal 26%
Italy 12%
Netherlands 6%
Belgium 5%
SpeedUpEurope
Germany 62%
Sweden 7%
Netherlands 7%
Denmark 5%
Italy 4%
IMpaCT
Spain 42%
Italy 13%
Poland 5%
UK 3%
Germany 2%
FiC3
Spain 35%
Belgium 12%
France 10%
Germany 6%
Italy 6%
Finish
Netherlands 22%
Germany 19%
Greece 8%
Italy 8%
Serbia 8%
CREAtiFi
Finland 25%
Spain 25%
Italy 15%
Belgium 14%
Germany 3%
FINODEX
Spain 31%
Italy 12%
Denmark 12%
Netherlands 7%
Portugal 6%
CEED Tech
Lithuania 26%
Hungary 12%
Slovakia 11%
Czech Rep. 10%
Estonia 4%
Markets Targeted by Proposals
Multiple Answers, N =1132 Proposals
Source: FI-IMPACT, January 30 2015
Base: 4 accelerators
Education Culture
Health Wellness
Other
Leisure Gaming
Manufacuring
Government
Telecom Media
Business Service
Retail
Art Entertainment
Accomodation Food Service
Marketing
Education
Transport
Healthcare
Utilities
Agriculture
Data/
Content Management
Cloud Hosting
Security
Apps/Services Ecosystems
& Delivery Framework
Advance Web-based
User Interface
IoT Services Enablement
Advanced middleware
and interfaces to Network
and Devices Network
57%
45%
32%
24%
17%
13%
4%
55% Single Chapter 45% Multiple Chapters
% of answers:
FIWARE
ACCELERATOR
PROGRAMME
THE
30
Hungary 2%
Greece 2%
Ireland 2%
Czech Republi 2%
Spain 33%
Netherl. 20%
UK 11%
Poland 6%
Finland 5%
FICHe
Spain 50%
Germany 9%
Denmark 8%
Italy 7%
Poland 5%
FABulous
10%
10%
34%
46%
12%
8%
8%
7%
9%
9%
16%
3%
4%
3%
3%
2%
1%
By Business Markets
Consumer Targeted Sectors
Total N. = 1132*
B2C
n = 253
(22%)
B2B
n = 657
(58%)
B2B/B2C
n = 222
(20%)
*20% of the sample are "horizontal" (solutions that
are suitable for every vertical market, and do not
target a specific market)

FIWARE Accelerator Programme Infographic

  • 1.
    TAKE A PEAKAT THE DATA! Monitoring Accelerators’ Subcall Proposals Overview of Proposals by Phase Base: 14 accelerators 5.784 3.217 346* Proposals Already Selected* Proposals Started * = data available for 8 accelerators FIWARE Chapters Base: 7 accelerators Proposals by Accelerators.. Base: 12 accelerators How they team up? Top 5 Countries of proposals' origin by accelerator Base: 4 accelerators 2.6 = Average N. of team members ONE-PERSON BUSINESS 2 MEMBERS 3 TO 5 MEMBERS >5 MEMBERS N= 673 proposals N= 2614 (number of proposals analyzed as part of the total proposals submitted, Jan 30 2015). N = 2614 Proposals % refers to multiple selections …and their geographical distribution Base: 12 accelerators Spain 25% Germany 10% Italy 9% Finland 4% Lithuania 4% Belgium 4% UK 4% Netherlands 4% Poland 3% Portugal 3% Denmark 3% Proposals Submitted 3.025 Expected Applications: FI-Adopt 4% CREAti Fi 13% SpeedUp Europe 7% European Pioneers 9% FABulous 3%FICHe 4% FiC3 9% Finish 1% CEED Tech 15% FINODEX 7% IMpaCT 20% Soul-FI 7% 31.3% 28.8% 34.4% 5.6% 15 COUNTRIES TOP European Pioneers Germany 32% Spain 15% Ireland 8% UK 6% Italy 5% FI-Adopt Spain 28% UK 16% Italy 10% Greece 7% Netherlands 6% SOUL-FI Spain 30% Portugal 26% Italy 12% Netherlands 6% Belgium 5% SpeedUpEurope Germany 62% Sweden 7% Netherlands 7% Denmark 5% Italy 4% IMpaCT Spain 42% Italy 13% Poland 5% UK 3% Germany 2% FiC3 Spain 35% Belgium 12% France 10% Germany 6% Italy 6% Finish Netherlands 22% Germany 19% Greece 8% Italy 8% Serbia 8% CREAtiFi Finland 25% Spain 25% Italy 15% Belgium 14% Germany 3% FINODEX Spain 31% Italy 12% Denmark 12% Netherlands 7% Portugal 6% CEED Tech Lithuania 26% Hungary 12% Slovakia 11% Czech Rep. 10% Estonia 4% Markets Targeted by Proposals Multiple Answers, N =1132 Proposals Source: FI-IMPACT, January 30 2015 Base: 4 accelerators Education Culture Health Wellness Other Leisure Gaming Manufacuring Government Telecom Media Business Service Retail Art Entertainment Accomodation Food Service Marketing Education Transport Healthcare Utilities Agriculture Data/ Content Management Cloud Hosting Security Apps/Services Ecosystems & Delivery Framework Advance Web-based User Interface IoT Services Enablement Advanced middleware and interfaces to Network and Devices Network 57% 45% 32% 24% 17% 13% 4% 55% Single Chapter 45% Multiple Chapters % of answers: FIWARE ACCELERATOR PROGRAMME THE 30 Hungary 2% Greece 2% Ireland 2% Czech Republi 2% Spain 33% Netherl. 20% UK 11% Poland 6% Finland 5% FICHe Spain 50% Germany 9% Denmark 8% Italy 7% Poland 5% FABulous 10% 10% 34% 46% 12% 8% 8% 7% 9% 9% 16% 3% 4% 3% 3% 2% 1% By Business Markets Consumer Targeted Sectors Total N. = 1132* B2C n = 253 (22%) B2B n = 657 (58%) B2B/B2C n = 222 (20%) *20% of the sample are "horizontal" (solutions that are suitable for every vertical market, and do not target a specific market)