Here are some key things that make statistical information reliable and accurate:
- Clear and consistent scales that have regular intervals and start at zero. This allows easy comparison of quantities.
- Labeling of axes and units so it is clear what is being measured and compared.
- Presenting all relevant data, not just selected portions that support a certain view.
- Avoiding misleading perspectives, sizes, or placements of graphical elements that exaggerate differences.
- Using formats like line graphs or bar graphs that are best suited to clearly show trends or comparisons in the data.
- Citing sources and time periods for any statistics used.
- Limiting or eliminating subjective elements like images or labels that could influence
Using the Internet to Research Private Companies for Competitive IntelligenceAugust Jackson
These slides describe my process and methods for using readily-available resources on the Internet to quickly and inexpensively research private companies.
Using the Internet to Research Private CompaniesAugust Jackson
There is a wealth of information that is available about private companies on the Internet. In this presentation I tell you how you can exploit these sources to gain insights into your privately held competitors.
Social Network Analysis for Competitive IntelligenceAugust Jackson
How can CI teams apply the concepts of social network analysis to gain insight into the capabilities and plans of their competitors? Presented by Jim Richardson and August Jackson in April 2007 at the Society of Competitive Intelligence Professionals annual conference in New York City.
GraphSummit Singapore | The Future of Agility: Supercharging Digital Transfor...Neo4j
Leonard Jayamohan, Partner & Generative AI Lead, Deloitte
This keynote will reveal how Deloitte leverages Neo4j’s graph power for groundbreaking digital twin solutions, achieving a staggering 100x performance boost. Discover the essential role knowledge graphs play in successful generative AI implementations. Plus, get an exclusive look at an innovative Neo4j + Generative AI solution Deloitte is developing in-house.
Why You Should Replace Windows 11 with Nitrux Linux 3.5.0 for enhanced perfor...SOFTTECHHUB
The choice of an operating system plays a pivotal role in shaping our computing experience. For decades, Microsoft's Windows has dominated the market, offering a familiar and widely adopted platform for personal and professional use. However, as technological advancements continue to push the boundaries of innovation, alternative operating systems have emerged, challenging the status quo and offering users a fresh perspective on computing.
One such alternative that has garnered significant attention and acclaim is Nitrux Linux 3.5.0, a sleek, powerful, and user-friendly Linux distribution that promises to redefine the way we interact with our devices. With its focus on performance, security, and customization, Nitrux Linux presents a compelling case for those seeking to break free from the constraints of proprietary software and embrace the freedom and flexibility of open-source computing.
Communications Mining Series - Zero to Hero - Session 1DianaGray10
This session provides introduction to UiPath Communication Mining, importance and platform overview. You will acquire a good understand of the phases in Communication Mining as we go over the platform with you. Topics covered:
• Communication Mining Overview
• Why is it important?
• How can it help today’s business and the benefits
• Phases in Communication Mining
• Demo on Platform overview
• Q/A
Enchancing adoption of Open Source Libraries. A case study on Albumentations.AIVladimir Iglovikov, Ph.D.
Presented by Vladimir Iglovikov:
- https://www.linkedin.com/in/iglovikov/
- https://x.com/viglovikov
- https://www.instagram.com/ternaus/
This presentation delves into the journey of Albumentations.ai, a highly successful open-source library for data augmentation.
Created out of a necessity for superior performance in Kaggle competitions, Albumentations has grown to become a widely used tool among data scientists and machine learning practitioners.
This case study covers various aspects, including:
People: The contributors and community that have supported Albumentations.
Metrics: The success indicators such as downloads, daily active users, GitHub stars, and financial contributions.
Challenges: The hurdles in monetizing open-source projects and measuring user engagement.
Development Practices: Best practices for creating, maintaining, and scaling open-source libraries, including code hygiene, CI/CD, and fast iteration.
Community Building: Strategies for making adoption easy, iterating quickly, and fostering a vibrant, engaged community.
Marketing: Both online and offline marketing tactics, focusing on real, impactful interactions and collaborations.
Mental Health: Maintaining balance and not feeling pressured by user demands.
Key insights include the importance of automation, making the adoption process seamless, and leveraging offline interactions for marketing. The presentation also emphasizes the need for continuous small improvements and building a friendly, inclusive community that contributes to the project's growth.
Vladimir Iglovikov brings his extensive experience as a Kaggle Grandmaster, ex-Staff ML Engineer at Lyft, sharing valuable lessons and practical advice for anyone looking to enhance the adoption of their open-source projects.
Explore more about Albumentations and join the community at:
GitHub: https://github.com/albumentations-team/albumentations
Website: https://albumentations.ai/
LinkedIn: https://www.linkedin.com/company/100504475
Twitter: https://x.com/albumentations
GraphSummit Singapore | The Art of the Possible with Graph - Q2 2024Neo4j
Neha Bajwa, Vice President of Product Marketing, Neo4j
Join us as we explore breakthrough innovations enabled by interconnected data and AI. Discover firsthand how organizations use relationships in data to uncover contextual insights and solve our most pressing challenges – from optimizing supply chains, detecting fraud, and improving customer experiences to accelerating drug discoveries.
Unlock the Future of Search with MongoDB Atlas_ Vector Search Unleashed.pdfMalak Abu Hammad
Discover how MongoDB Atlas and vector search technology can revolutionize your application's search capabilities. This comprehensive presentation covers:
* What is Vector Search?
* Importance and benefits of vector search
* Practical use cases across various industries
* Step-by-step implementation guide
* Live demos with code snippets
* Enhancing LLM capabilities with vector search
* Best practices and optimization strategies
Perfect for developers, AI enthusiasts, and tech leaders. Learn how to leverage MongoDB Atlas to deliver highly relevant, context-aware search results, transforming your data retrieval process. Stay ahead in tech innovation and maximize the potential of your applications.
#MongoDB #VectorSearch #AI #SemanticSearch #TechInnovation #DataScience #LLM #MachineLearning #SearchTechnology
Dr. Sean Tan, Head of Data Science, Changi Airport Group
Discover how Changi Airport Group (CAG) leverages graph technologies and generative AI to revolutionize their search capabilities. This session delves into the unique search needs of CAG’s diverse passengers and customers, showcasing how graph data structures enhance the accuracy and relevance of AI-generated search results, mitigating the risk of “hallucinations” and improving the overall customer journey.
UiPath Test Automation using UiPath Test Suite series, part 5DianaGray10
Welcome to UiPath Test Automation using UiPath Test Suite series part 5. In this session, we will cover CI/CD with devops.
Topics covered:
CI/CD with in UiPath
End-to-end overview of CI/CD pipeline with Azure devops
Speaker:
Lyndsey Byblow, Test Suite Sales Engineer @ UiPath, Inc.
Maruthi Prithivirajan, Head of ASEAN & IN Solution Architecture, Neo4j
Get an inside look at the latest Neo4j innovations that enable relationship-driven intelligence at scale. Learn more about the newest cloud integrations and product enhancements that make Neo4j an essential choice for developers building apps with interconnected data and generative AI.
20 Comprehensive Checklist of Designing and Developing a WebsitePixlogix Infotech
Dive into the world of Website Designing and Developing with Pixlogix! Looking to create a stunning online presence? Look no further! Our comprehensive checklist covers everything you need to know to craft a website that stands out. From user-friendly design to seamless functionality, we've got you covered. Don't miss out on this invaluable resource! Check out our checklist now at Pixlogix and start your journey towards a captivating online presence today.
zkStudyClub - Reef: Fast Succinct Non-Interactive Zero-Knowledge Regex ProofsAlex Pruden
This paper presents Reef, a system for generating publicly verifiable succinct non-interactive zero-knowledge proofs that a committed document matches or does not match a regular expression. We describe applications such as proving the strength of passwords, the provenance of email despite redactions, the validity of oblivious DNS queries, and the existence of mutations in DNA. Reef supports the Perl Compatible Regular Expression syntax, including wildcards, alternation, ranges, capture groups, Kleene star, negations, and lookarounds. Reef introduces a new type of automata, Skipping Alternating Finite Automata (SAFA), that skips irrelevant parts of a document when producing proofs without undermining soundness, and instantiates SAFA with a lookup argument. Our experimental evaluation confirms that Reef can generate proofs for documents with 32M characters; the proofs are small and cheap to verify (under a second).
Paper: https://eprint.iacr.org/2023/1886
Alt. GDG Cloud Southlake #33: Boule & Rebala: Effective AppSec in SDLC using ...James Anderson
Effective Application Security in Software Delivery lifecycle using Deployment Firewall and DBOM
The modern software delivery process (or the CI/CD process) includes many tools, distributed teams, open-source code, and cloud platforms. Constant focus on speed to release software to market, along with the traditional slow and manual security checks has caused gaps in continuous security as an important piece in the software supply chain. Today organizations feel more susceptible to external and internal cyber threats due to the vast attack surface in their applications supply chain and the lack of end-to-end governance and risk management.
The software team must secure its software delivery process to avoid vulnerability and security breaches. This needs to be achieved with existing tool chains and without extensive rework of the delivery processes. This talk will present strategies and techniques for providing visibility into the true risk of the existing vulnerabilities, preventing the introduction of security issues in the software, resolving vulnerabilities in production environments quickly, and capturing the deployment bill of materials (DBOM).
Speakers:
Bob Boule
Robert Boule is a technology enthusiast with PASSION for technology and making things work along with a knack for helping others understand how things work. He comes with around 20 years of solution engineering experience in application security, software continuous delivery, and SaaS platforms. He is known for his dynamic presentations in CI/CD and application security integrated in software delivery lifecycle.
Gopinath Rebala
Gopinath Rebala is the CTO of OpsMx, where he has overall responsibility for the machine learning and data processing architectures for Secure Software Delivery. Gopi also has a strong connection with our customers, leading design and architecture for strategic implementations. Gopi is a frequent speaker and well-known leader in continuous delivery and integrating security into software delivery.
Goodbye Windows 11: Make Way for Nitrux Linux 3.5.0!SOFTTECHHUB
As the digital landscape continually evolves, operating systems play a critical role in shaping user experiences and productivity. The launch of Nitrux Linux 3.5.0 marks a significant milestone, offering a robust alternative to traditional systems such as Windows 11. This article delves into the essence of Nitrux Linux 3.5.0, exploring its unique features, advantages, and how it stands as a compelling choice for both casual users and tech enthusiasts.
Sudheer Mechineni, Head of Application Frameworks, Standard Chartered Bank
Discover how Standard Chartered Bank harnessed the power of Neo4j to transform complex data access challenges into a dynamic, scalable graph database solution. This keynote will cover their journey from initial adoption to deploying a fully automated, enterprise-grade causal cluster, highlighting key strategies for modelling organisational changes and ensuring robust disaster recovery. Learn how these innovations have not only enhanced Standard Chartered Bank’s data infrastructure but also positioned them as pioneers in the banking sector’s adoption of graph technology.
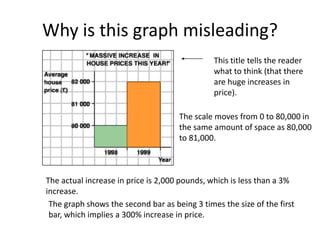
1. Why is this graph misleading?
This title tells the reader
what to think (that there
are huge increases in
price).
The scale moves from 0 to 80,000 in
the same amount of space as 80,000
to 81,000.
The actual increase in price is 2,000 pounds, which is less than a 3%
increase.
The graph shows the second bar as being 3 times the size of the first
bar, which implies a 300% increase in price.
2. A more accurate graph:
An unbiased title
A scale with a regular
interval.
This shows a more accurate picture of the increase.
3. Why is this graph misleading?
The scale does not have a regular interval.
4. What does the top of this graph
show?
•About 12 million people are
downloading music legally.
•Just over 9 million people are
downloading music illegally.
The bottom of the graph is
misleading. Why?
•The graph implies that 1% of
the iPods are filled with legally
downloaded music.
•It implies that the other 99%
are filled with illegally
downloaded music.
Why is this wrong?
5. More information:
• The iPod graphic appeared in Wired magazine.
• A quote from the article: “What’s filling all that
excess capacity? Well, despite the efforts of the
Recording Industry Association of America, nearly
a billion songs are traded on P2P networks every
month.”
• This article was trying to imply that all of the
excess space is filled with illegal downloads,
which is likely untrue.
• The statistics for the article were provided by the
music industry.
6. What could be in those iPods besides
legally downloaded music?
• Empty space – most people don’t have
iPods that are filled to capacity.
• Songs that were added from legally
purchased CDs.
• Games, calendars, other applications.
• Songs that were downloaded illegally.
It is possible that the rest of the iPod contains some illegally downloaded
music, but it is unlikely that 99% of a person’s iPod is filled with illegal music.
7. Of course, there are many different ways to lie with
statistics, and now we’ll show you how it can be done
with a pictograph.
Of course, there are many different ways
to lie with statistics, and now we’ll show
you how it can be done with a pictograph.
The most deceptive aspect of this graph
is the way in which it was drawn. Firstly,
the perspective puts barrel 1979 at the
forefront and barrel 1973 at the back. This
effectively draws reader’s eyes to the 1979
barrel first and then forces him read the
rest of the years in descending order.
Supporting this deceptive tactic is the fact
that only the foremost barrels have
complete year to read. The rest are
indicated with only the last two digits, as in
‘76. Obviously, the makers of the graph
intend for the audience to read in reverse
chronological order, which has the effect of
making oil prices seem to fall.
8. Of course, there are many different ways to lie with
statistics, and now we’ll show you how it can be done
with a pictograph.
Secondly, the perspective makes
it hard to judge the numerical
difference between each barrel.
For example, even though barrel
1975 appears to be over two
thirds the height of 1976, in
reality, the difference between
them is only $0.95. Likewise,
barrel 1973 seems less than half
the height of 1974, yet they differ
by a whopping $8.54! the effect of
making oil prices seem to fall.
9. Of course, there are many different ways to lie with
statistics, and now we’ll show you how it can be done
with a pictograph.
A third misleading aspect is that
this pictograph doesn’t contain a
scale or axis’ of any kind. Without
it, the reader’s attention might be
directed to the area of each barrel
instead. Numerically, the smallest
barrel should only be about one
1/5 of the largest barrel, but in
terms of area, the ratio is about
1/25. This makes the different
between the two much larger than
it actually is.
10. Of course, there are many different ways to lie with
statistics, and now we’ll show you how it can be done
with a pictograph.
Lastly, the way in which the
barrels are labeled seem
somewhat awkward.
Shouldn’t the prices be on
the barrel instead of years?
Prices written on the barrel
will clarify that it is the cost
that is changing, not the
years. And with more space
to indicate years, readers
won’t be forced to read in
reverse.
11. Price per barrel of crude oil leaving Saudi Arabia on
Jan. 1
$14.00
$12.00
$10.00
$8.00
Price
$6.00
$4.00
$2.00
$0.00
1973 1974 1975 1976 1977 1978 1979
Year
This graph neatly depicts the steadily rising prices of crude oil, and
shows sudden rises or drops. Each bar represents a number by its
height without using fancy images to distract the reader. The presence
of the x and y-axis’ also make it much more organized. While the
original graph tended to overstate small differences and gloss over wide
gaps, this graph is much more honest. One can see that the largest rise
occurs between 1973 and 1973, and that it continues to rise by smaller
amounts steadily over the next five years. The years on the x-axis are
all clearly marked in chronological order as well so that it is easy for
readers to understand.
12. For this type of information, using a line graph may be even more
useful than a bar graph. With a line to define the rise of fall of oil
prices, it is all the more obvious what the shape of the changing rates
look like. This graph even seems to accentuate the huge rise between
1973 and 1974. The biggest benefits of a using a line graph, however,
lies in the fact that each point is marked with small, accurate dots.
These are much easier to read than bars, and the line between them
outlines the contour of the rise.
Price per barrel of crude oil leaving Saudi Arabia
on Jan. 1
$16.00
$14.00
$12.00
$10.00
Price
$8.00
$6.00
$4.00
$2.00
$0.00
1973 1974 1975 1976 1977 1978 1979
Year
13. What makes statistical information reliable and accurate?
Although this graph is pleasing to look at, it can also
be confusing. The author meant for the Number of
Buyers to be calculated by the height of each picture,
but the reader’s attention will be more focused on
area. What makes it even more biased is that each
monitor on the graph is a Macintosh.