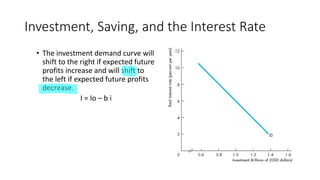
Macroeconomic
By Angel David aroquipa
velaquez
Check terms
Fiscal
policy
Monetary
policy
Economic
growth
Check terms
Ensure Cross Inventory Exogenous
Check terms
Either Short term Borrow
Targeting
inflation
Check terms
Expenditure
Marginal
Propensity of
consume
Slope
Check terms
Effort Disposal
Side
policy
Through
Check terms
Balance Surplus
Deficit Debt
Check terms
Leakages Taxes Discourage
Check terms
Courage Booms Drop
Check terms
Further Derive
Loanable Deriving
Fiscal and monetary policy
Monetary policy
Is the process by which the monetary authority of
a country, typically the central bank, controls either
the cost of very short-term borrowing or the
money supply, often targeting inflation or the
interest rate to ensure price stability and general
trust in the currency.
Fiscal and monetary policy
Fiscal policy
Fiscal policy refers to the use of government
spending and tax policies to influence
economic conditions, including demand for
goods and services, employment, inflation
and economic growth.
The goods markets:
IS - curve
A simple closed-economy model in which income is determined by
expenditure.
Equilibrium in the goods market exists when production, Y, is equal
to the demand for goods. This condition is called the IS relation.
In the simple model developed, the interest rate did not affect the
demand for goods. The equilibrium condition was given by:
Y C Y T I G
= − + +
( )
The Keynesian cross
A simple closed-economy model in which income is determined by expenditure.
(due to J. M. Keynes)
Notation:
• I = planned investment
• Y = PE = C + I + G = planned expenditure
• Y = real GDP = actual expenditure
Difference between actual & planned expenditure = unplanned inventory
investment
Elements of the Keynesian cross
( )
C C Y T
= −
I I
=
,
G G T T
= =
= − + +
( )
PE C Y T I G
=
Y PE
consumption function:
for now, planned
investment is exogenous:
planned expenditure:
equilibrium condition:
govt policy variables:
actual expenditure = planned expenditure
consumption function
Consumption is a linear function of disposable personal
income,
C = C + cYd
C = consumption expenditure
Yd = disposable income
Yd = Y – tY
Y = total income
T = tY is it total taxes ( t = taxes rate )
C = autonomous consumption (intercept of the line)
c = marginal propensity to consume (slope of the line)
Properties of Consumption Function
Consumption is
determined by
current income
Marginal propensity
to consume (MPC =
ΔC/ΔY) is between
zero and one (0<c<1)
Average propensity
to consume (APC =
C/Y) falls as income
rises
Short-run Consumption Function
Disposable income
Consumption expenditure
C = C + cY
C
c
Empirical Evidence
High income families
have a higher marginal
propensity to save (MPS
= 1 – MPC)
High income families
have a higher average
propensity to save (APS
= 1 – APC); APC falls
with the level of income
In the long-run,
autonomous
consumption falls to
zero (C = 0)
Savings function
The Savings function
•Is obtained from the aggregate demand
equation, subtracting investment and
consumption:
•S=Y-C-T
•S= -C0 +(1-c)(Y-T)
Elements of the Keynesian cross
( )
C C Y T
= −
I I
=
,
G G T T
= =
= − + +
( )
PE C Y T I G
=
Y PE
consumption function:
for now, planned
investment is exogenous:
planned expenditure:
equilibrium condition:
govt policy variables:
actual expenditure = planned expenditure
FISCAL POLICY
In an effort to promote the macroeconomic objective (price level stability, economic
growth and full employment) policy-makers have a variety of tools at their disposal. One
set of tools is known as fiscal policy.
Fiscal Policy: Changes in the level of government spending and taxation aimed at either
increasing or decreasing the level of aggregate demand in an economy to promote the
macroeconomic objectives. Fiscal policy is a type of demand-side policy
• Economy A) An economy producing at full-employment is not in need of any fiscal policy actions, however…
• Economy B) An economy in a recession could benefit from expansionary demand-side policies that increase
AD and therefore employment and output closer to the full employment level.
• If AD is too high and has high inflation an economy could benefit from contractionary demand-side policies
that reduce AD.
Fiscal policy puts the government’s budget into action to stimulate or
contract AD as needed. The budget is simply the combination of revenues
earned from taxes and expenditures made by all goods and services by
nation’s government in a year.
Tax revenues: A government’s primary source of revenues is through the
collection of taxes.
• Direct taxes: Taxes on incomes earned by households and firms. These are usually progressive
in nature, meaning that the percentage paid increases as income increases, or proportional,
meaning that all individuals (or firms) pay the same percentage no matter what their income.
• Indirect taxes: Taxes on consumption are indirect, meaning they are actually paid by the
sellers goods, but they are born by both producers and consumers.
THE GOVERNMENT BUDGET – SOURCES OF REVENUE
Fiscal policy puts the government’s budget into action to
stimulate or contract AD as needed. The budget is simply the
combination of revenues earned from taxes and expenditures
made by all goods and services by nation’s government in a year.
Other sources of revenue: To a lesser extent, a government may
earn revenue from:
• The sale of goods and services,
• The sale of government property,
• The privatization of state-owned enterprises to private sector investors
THE GOVERNMENT BUDGET – SOURCES OF REVENUE
THE GOVERNMENT BUDGET – TYPES OF
EXPENDITURES
While a
government’s
revenues come
from the taxes it
collects. its
expenditure
depend on the
goods and services
the government
provides the
nation.
Government
expenditures
include:
Current Expenditures
Capital Expenditures
Transfer payments:
THE GOVERNMENT BUDGET – TYPES OF
EXPENDITURES
While a government’s revenues come from the taxes
it collects. its expenditure depend on the goods and
services the government provides the nation.
Government expenditures include:
• Current Expenditures: This is the day to day cost of running the
government. The wages and salaries of public employees,
including in local, state and national government, such as police,
teachers, legislatures, military servicemen, judges, etc…
THE GOVERNMENT BUDGET – TYPES OF
EXPENDITURES
While a government’s revenues come from the taxes
it collects. its expenditure depend on the goods and
services the government provides the nation.
Government expenditures include:
• Capital Expenditures: These are investments made by the
government in capital equipment and infrastructure, such as
money spent on roads, bridges, schools, hospitals, military
equipment, courthouses, etc...
THE GOVERNMENT BUDGET – TYPES OF
EXPENDITURES
While a government’s revenues come from the taxes it collects.
its expenditure depend on the goods and services the
government provides the nation. Government expenditures
include:
• Transfer payments: This type of government spending does not contribute to
GDP (unlike those above), because income is only transferred from one group of
people to another in the nation. Includes welfare and unemployment benefits,
subsidies to producers and consumers, etc… Money transferred by the
government from one group to another, without going towards the provision of
an actual good or service.
In a particular
year, a
government’s
budget can
either be
balanced, in
surplus or in
deficit. The net
effect on
aggregate
demand
depends on the
government’s
budget balance.
A balanced budget
A budget surplus
A budget deficit
The national debt
THE GOVERNMENT BUDGET – SURPLUSES AND DEFICITS
In a particular
year, a
government’s
budget can
either be
balanced, in
surplus or in
deficit. The net
effect on
aggregate
demand
depends on the
government’s
budget balance.
A balanced budget: A government’s
budget is in balance if its
expenditures in a year equals its tax
revenues for that year. A balanced
budget will have no net effect on
aggregate demand since the leakages
(taxes collected) equal the injection
(expenditures made).
THE GOVERNMENT BUDGET – SURPLUSES AND DEFICITS
In a particular
year, a
government’s
budget can
either be
balanced, in
surplus or in
deficit. The net
effect on
aggregate
demand
depends on the
government’s
budget balance.
A budget surplus: If, in a year, the
government collects MORE in taxes
than it spends, the budget is in surplus.
A surplus may sound like a good thing,
but in fact the net effect of a budget
surplus on AD is negative, since
leakages exceed injections. A budget
surplus will reduce the national debt.
THE GOVERNMENT BUDGET – SURPLUSES AND DEFICITS
In a particular
year, a
government’s
budget can
either be
balanced, in
surplus or in
deficit. The net
effect on
aggregate
demand
depends on the
government’s
budget balance.
A budget deficit: If a government’s
expenditure in a year a greater than
the tax revenue it collects, the
government’s budget is in deficit. A
deficit has a positive net effect on AD,
since injections exceed leakages from
the government sector. A budget
deficit will add to the national debt.
THE GOVERNMENT BUDGET – SURPLUSES AND DEFICITS
In a particular
year, a
government’s
budget can
either be
balanced, in
surplus or in
deficit. The net
effect on
aggregate
demand
depends on the
government’s
budget balance.
The national debt: A nation’s debt is
the sum of all its past deficit minus its
past surpluses. If this number is
negative, then it means the
government has borrowed money
over the years to finance its deficits
that it has not paid back through
accumulated surpluses
THE GOVERNMENT BUDGET – SURPLUSES AND DEFICITS
Elements of the Keynesian cross
( )
C C Y T
= −
I I
=
,
G G T T
= =
= − + +
( )
PE C Y T I G
=
Y PE
consumption function:
for now, planned
investment is exogenous:
planned expenditure:
equilibrium condition:
govt policy variables:
actual expenditure = planned expenditure
Rental Price of Capital
Supply of capital is fixed
in the production process
Demand for capital is
indicated by the Marginal
Product of Capital
Demand = Supply
determines the price of
capital
Competitive Capital Market
Real rental price
Capital stock
Capital supply
Capital demand (MPK)
R/P
At equilibrium, R/P = MPK
Cost of
Capital
Cost of capital = Pk(r + δ ) where
Real cost of capital = (Pk/P) (r + δ )
Pk = price of capital
P = general price level
r = real interest rate
δ = depreciation rate
Investment Function
Investment
Real interest rate Real interest rate
Investment
I(r)
I1
I2
Investment is a negative
function of real interest rate.
Investment increases by
technological advancement.
Effect of Taxes on
Investment
Corporate income tax is a tax on
corporate profit. An increase in the
tax would discourage business
investment.
Investment tax credit is an
incentive for businesses to invest.
An increase in the tax credit would
encourage business investment.
Investment, Saving, and the Interest Rate
• The investment demand curve will
shift to the right if expected future
profits increase and will shift to
the left if expected future profits
decrease.
I = Io – b i
Questions to be
Answered
Why is investment
negatively related
to the interest
rate?
What causes the
investment
function to shift?
Why does
investment rise
during booms and
fall in recessions?
Elements of the Keynesian cross
( )
C C Y T
= −
I I
=
,
G G T T
= =
= − + +
( )
PE C Y T I G
=
Y PE
consumption function:
for now, planned
investment is exogenous:
planned expenditure:
equilibrium condition:
govt policy variables:
actual expenditure = planned expenditure
Graphing planned expenditure
income, output, Y
PE
planned
expenditure
PE =C +I +G
MPC
1
Graphing the equilibrium condition
income, output, Y
PE
planned
expenditure
PE =Y
45º
The equilibrium value of income
income, output, Y
PE =Y
PE =C +I +G
Equilibrium
income
PE
planned
expenditure
An increase in government purchases
Y
PE
PE =C +I +G1
PE1 = Y1
PE =C +I +G2
PE2 = Y2
ΔY
At Y1,
there is now an
unplanned drop
in inventory…
…so firms
increase output,
and income
rises toward a
new equilibrium.
ΔG
Solving for ΔY
Y C I G
= + +
Y C I G
 =  +  + 
MPC
=   + 
Y G
C G
=  + 
(1 MPC)
−  = 
Y G
1
1 MPC
 
 =  
 
−
 
Y G
equilibrium condition
in changes
because I exogenous
because ΔC = MPC ΔY
Collect terms with ΔY
on the left side of the
equals sign:
Solve for ΔY :
The government purchases multiplier
Definition: the increase in income resulting from a $1
increase in G.
In this model, the govt
purchases multiplier equals
Example: If MPC = 0.8, then
1
1 MPC

=
 −
Y
G
1
5
1 0.8

= =
 −
Y
G
An increase in G
causes income to
increase 5 times
as much!
Why the multiplier is greater than 1
• Initially, the increase in G causes an equal increase in Y: ΔY = ΔG.
• But #Y g #C
g further #Y
g further #C
g further #Y
• So the final impact on income is much bigger than the initial ΔG.
An increase in taxes
Y
PE
PE =C2 +I +G
PE2 = Y2
PE =C1 +I +G
PE1 = Y1
ΔY
At Y1, there is now
an unplanned
inventory buildup…
…so firms
reduce output,
and income falls
toward a new
equilibrium
ΔC = −MPC×ΔT
Initially, the tax
increase reduces
consumption and
therefore PE:
Solving for ΔY
Y C I G
 =  +  + 
( )
MPC
=   − 
Y T
C
= 
(1 MPC) MPC
−  = −  
Y T
eq’m condition in
changes
I and G exogenous
Solving for ΔY :
MPC
1 MPC
 
−
 =  
 
−
 
Y T
Final result:
The tax multiplier
def: the change in income resulting from
a $1 increase in T:
MPC
1 MPC
 −
=
 −
Y
T
0.8 0.8
4
1 0.8 0.2
 − −
= = = −
 −
Y
T
If MPC = 0.8, then the tax multiplier equals
NOW YOU TRY
Practice with the Keynesian cross
Use a graph of the Keynesian
cross
to show the effects of an
increase in planned investment
on the equilibrium level of
income/output.
53
ANSWERS
Practice with the Keynesian cross
54
Y
PE
PE =C +I1 +G
PE1 = Y1
PE =C +I2 +G
PE2 = Y2
ΔY
At Y1,
there is now an
unplanned drop
in inventory…
…so firms
increase output,
and income
rises toward a
new equilibrium.
ΔI
The IS curve
def: a graph of all combinations of r and Y that result in
goods market equilibrium
i.e. actual expenditure (output)
= planned expenditure
The equation for the IS curve is:
( ) ( )
Y C Y T I r G
= − + +
Y2
Y1
Y2
Y1
Deriving the IS curve
ir g hI
Y
PE
r
Y
PE =C +I(r1 )+G
PE =C +I(r2 )+G
r1
r2
PE =Y
IS
ΔI
g hPE
g hY
Fiscal Policy and the IS curve
We can use the IS-LM
model to see
how fiscal policy (G and T )
affects
aggregate demand and
output.
Let’s start by using the
Keynesian cross
to see how fiscal policy
shifts the IS curve…
Y2
Y1
Y2
Y1
Shifting the IS curve: ΔG
At any value of r, hG
g hPE g hY
Y
PE
r
Y
PE =C +I(r1 )+G1
PE =C +I(r1 )+G2
r1
PE =Y
IS1
The horizontal
distance of the
IS shift equals
IS2
…so the IS curve shifts
to the right.
1
1 MPC
 = 
−
Y G ΔY
NOW YOU TRY
Shifting the IS curve: ΔT
Use the diagram of the Keynesian cross
or loanable funds model to show how
an increase in taxes shifts the IS curve.
If you can, determine the size of the
shift.
60
ANSWERS
Shifting the IS curve: ΔT
61
Y2
Y2
At any value of r,
hT g iC g iPE PE =C2 +I(r1 )+G
IS2
The horizontal
distance of the
IS shift equals
Y
PE
r
Y
PE =Y
Y1
Y1
PE =C1 +I(r1 )+G
r1
IS1
…so the IS curve shifts
to the left.
−
 = 
−
MPC
1 MPC
Y T ΔY
Shifts of the IS - Curve
Let’s summarize:
•Equilibrium in the goods market implies that an
increase in the interest rate leads to a decrease in
output.
•Changes in factors that decrease the demand for
goods, given the interest rate shift the IS curve to the
left.
The theory of liquidity preference
Due to John Maynard Keynes.
A simple theory in which the interest rate
is determined by money supply and
money demand.

Fiscalandmonetarypolicy.pdf

  • 1.
  • 2.
  • 3.
    Check terms Ensure CrossInventory Exogenous
  • 4.
    Check terms Either Shortterm Borrow Targeting inflation
  • 5.
  • 6.
  • 7.
  • 8.
  • 9.
  • 10.
  • 11.
    Fiscal and monetarypolicy Monetary policy Is the process by which the monetary authority of a country, typically the central bank, controls either the cost of very short-term borrowing or the money supply, often targeting inflation or the interest rate to ensure price stability and general trust in the currency.
  • 12.
    Fiscal and monetarypolicy Fiscal policy Fiscal policy refers to the use of government spending and tax policies to influence economic conditions, including demand for goods and services, employment, inflation and economic growth.
  • 13.
    The goods markets: IS- curve A simple closed-economy model in which income is determined by expenditure. Equilibrium in the goods market exists when production, Y, is equal to the demand for goods. This condition is called the IS relation. In the simple model developed, the interest rate did not affect the demand for goods. The equilibrium condition was given by: Y C Y T I G = − + + ( )
  • 14.
    The Keynesian cross Asimple closed-economy model in which income is determined by expenditure. (due to J. M. Keynes) Notation: • I = planned investment • Y = PE = C + I + G = planned expenditure • Y = real GDP = actual expenditure Difference between actual & planned expenditure = unplanned inventory investment
  • 15.
    Elements of theKeynesian cross ( ) C C Y T = − I I = , G G T T = = = − + + ( ) PE C Y T I G = Y PE consumption function: for now, planned investment is exogenous: planned expenditure: equilibrium condition: govt policy variables: actual expenditure = planned expenditure
  • 16.
    consumption function Consumption isa linear function of disposable personal income, C = C + cYd C = consumption expenditure Yd = disposable income Yd = Y – tY Y = total income T = tY is it total taxes ( t = taxes rate ) C = autonomous consumption (intercept of the line) c = marginal propensity to consume (slope of the line)
  • 17.
    Properties of ConsumptionFunction Consumption is determined by current income Marginal propensity to consume (MPC = ΔC/ΔY) is between zero and one (0<c<1) Average propensity to consume (APC = C/Y) falls as income rises
  • 18.
    Short-run Consumption Function Disposableincome Consumption expenditure C = C + cY C c
  • 19.
    Empirical Evidence High incomefamilies have a higher marginal propensity to save (MPS = 1 – MPC) High income families have a higher average propensity to save (APS = 1 – APC); APC falls with the level of income In the long-run, autonomous consumption falls to zero (C = 0)
  • 20.
    Savings function The Savingsfunction •Is obtained from the aggregate demand equation, subtracting investment and consumption: •S=Y-C-T •S= -C0 +(1-c)(Y-T)
  • 21.
    Elements of theKeynesian cross ( ) C C Y T = − I I = , G G T T = = = − + + ( ) PE C Y T I G = Y PE consumption function: for now, planned investment is exogenous: planned expenditure: equilibrium condition: govt policy variables: actual expenditure = planned expenditure
  • 22.
    FISCAL POLICY In aneffort to promote the macroeconomic objective (price level stability, economic growth and full employment) policy-makers have a variety of tools at their disposal. One set of tools is known as fiscal policy. Fiscal Policy: Changes in the level of government spending and taxation aimed at either increasing or decreasing the level of aggregate demand in an economy to promote the macroeconomic objectives. Fiscal policy is a type of demand-side policy • Economy A) An economy producing at full-employment is not in need of any fiscal policy actions, however… • Economy B) An economy in a recession could benefit from expansionary demand-side policies that increase AD and therefore employment and output closer to the full employment level. • If AD is too high and has high inflation an economy could benefit from contractionary demand-side policies that reduce AD.
  • 23.
    Fiscal policy putsthe government’s budget into action to stimulate or contract AD as needed. The budget is simply the combination of revenues earned from taxes and expenditures made by all goods and services by nation’s government in a year. Tax revenues: A government’s primary source of revenues is through the collection of taxes. • Direct taxes: Taxes on incomes earned by households and firms. These are usually progressive in nature, meaning that the percentage paid increases as income increases, or proportional, meaning that all individuals (or firms) pay the same percentage no matter what their income. • Indirect taxes: Taxes on consumption are indirect, meaning they are actually paid by the sellers goods, but they are born by both producers and consumers. THE GOVERNMENT BUDGET – SOURCES OF REVENUE
  • 24.
    Fiscal policy putsthe government’s budget into action to stimulate or contract AD as needed. The budget is simply the combination of revenues earned from taxes and expenditures made by all goods and services by nation’s government in a year. Other sources of revenue: To a lesser extent, a government may earn revenue from: • The sale of goods and services, • The sale of government property, • The privatization of state-owned enterprises to private sector investors THE GOVERNMENT BUDGET – SOURCES OF REVENUE
  • 25.
    THE GOVERNMENT BUDGET– TYPES OF EXPENDITURES While a government’s revenues come from the taxes it collects. its expenditure depend on the goods and services the government provides the nation. Government expenditures include: Current Expenditures Capital Expenditures Transfer payments:
  • 26.
    THE GOVERNMENT BUDGET– TYPES OF EXPENDITURES While a government’s revenues come from the taxes it collects. its expenditure depend on the goods and services the government provides the nation. Government expenditures include: • Current Expenditures: This is the day to day cost of running the government. The wages and salaries of public employees, including in local, state and national government, such as police, teachers, legislatures, military servicemen, judges, etc…
  • 27.
    THE GOVERNMENT BUDGET– TYPES OF EXPENDITURES While a government’s revenues come from the taxes it collects. its expenditure depend on the goods and services the government provides the nation. Government expenditures include: • Capital Expenditures: These are investments made by the government in capital equipment and infrastructure, such as money spent on roads, bridges, schools, hospitals, military equipment, courthouses, etc...
  • 28.
    THE GOVERNMENT BUDGET– TYPES OF EXPENDITURES While a government’s revenues come from the taxes it collects. its expenditure depend on the goods and services the government provides the nation. Government expenditures include: • Transfer payments: This type of government spending does not contribute to GDP (unlike those above), because income is only transferred from one group of people to another in the nation. Includes welfare and unemployment benefits, subsidies to producers and consumers, etc… Money transferred by the government from one group to another, without going towards the provision of an actual good or service.
  • 29.
    In a particular year,a government’s budget can either be balanced, in surplus or in deficit. The net effect on aggregate demand depends on the government’s budget balance. A balanced budget A budget surplus A budget deficit The national debt THE GOVERNMENT BUDGET – SURPLUSES AND DEFICITS
  • 30.
    In a particular year,a government’s budget can either be balanced, in surplus or in deficit. The net effect on aggregate demand depends on the government’s budget balance. A balanced budget: A government’s budget is in balance if its expenditures in a year equals its tax revenues for that year. A balanced budget will have no net effect on aggregate demand since the leakages (taxes collected) equal the injection (expenditures made). THE GOVERNMENT BUDGET – SURPLUSES AND DEFICITS
  • 31.
    In a particular year,a government’s budget can either be balanced, in surplus or in deficit. The net effect on aggregate demand depends on the government’s budget balance. A budget surplus: If, in a year, the government collects MORE in taxes than it spends, the budget is in surplus. A surplus may sound like a good thing, but in fact the net effect of a budget surplus on AD is negative, since leakages exceed injections. A budget surplus will reduce the national debt. THE GOVERNMENT BUDGET – SURPLUSES AND DEFICITS
  • 32.
    In a particular year,a government’s budget can either be balanced, in surplus or in deficit. The net effect on aggregate demand depends on the government’s budget balance. A budget deficit: If a government’s expenditure in a year a greater than the tax revenue it collects, the government’s budget is in deficit. A deficit has a positive net effect on AD, since injections exceed leakages from the government sector. A budget deficit will add to the national debt. THE GOVERNMENT BUDGET – SURPLUSES AND DEFICITS
  • 33.
    In a particular year,a government’s budget can either be balanced, in surplus or in deficit. The net effect on aggregate demand depends on the government’s budget balance. The national debt: A nation’s debt is the sum of all its past deficit minus its past surpluses. If this number is negative, then it means the government has borrowed money over the years to finance its deficits that it has not paid back through accumulated surpluses THE GOVERNMENT BUDGET – SURPLUSES AND DEFICITS
  • 34.
    Elements of theKeynesian cross ( ) C C Y T = − I I = , G G T T = = = − + + ( ) PE C Y T I G = Y PE consumption function: for now, planned investment is exogenous: planned expenditure: equilibrium condition: govt policy variables: actual expenditure = planned expenditure
  • 35.
    Rental Price ofCapital Supply of capital is fixed in the production process Demand for capital is indicated by the Marginal Product of Capital Demand = Supply determines the price of capital
  • 36.
    Competitive Capital Market Realrental price Capital stock Capital supply Capital demand (MPK) R/P At equilibrium, R/P = MPK
  • 37.
    Cost of Capital Cost ofcapital = Pk(r + δ ) where Real cost of capital = (Pk/P) (r + δ ) Pk = price of capital P = general price level r = real interest rate δ = depreciation rate
  • 38.
    Investment Function Investment Real interestrate Real interest rate Investment I(r) I1 I2 Investment is a negative function of real interest rate. Investment increases by technological advancement.
  • 39.
    Effect of Taxeson Investment Corporate income tax is a tax on corporate profit. An increase in the tax would discourage business investment. Investment tax credit is an incentive for businesses to invest. An increase in the tax credit would encourage business investment.
  • 40.
    Investment, Saving, andthe Interest Rate • The investment demand curve will shift to the right if expected future profits increase and will shift to the left if expected future profits decrease. I = Io – b i
  • 41.
    Questions to be Answered Whyis investment negatively related to the interest rate? What causes the investment function to shift? Why does investment rise during booms and fall in recessions?
  • 42.
    Elements of theKeynesian cross ( ) C C Y T = − I I = , G G T T = = = − + + ( ) PE C Y T I G = Y PE consumption function: for now, planned investment is exogenous: planned expenditure: equilibrium condition: govt policy variables: actual expenditure = planned expenditure
  • 43.
    Graphing planned expenditure income,output, Y PE planned expenditure PE =C +I +G MPC 1
  • 44.
    Graphing the equilibriumcondition income, output, Y PE planned expenditure PE =Y 45º
  • 45.
    The equilibrium valueof income income, output, Y PE =Y PE =C +I +G Equilibrium income PE planned expenditure
  • 46.
    An increase ingovernment purchases Y PE PE =C +I +G1 PE1 = Y1 PE =C +I +G2 PE2 = Y2 ΔY At Y1, there is now an unplanned drop in inventory… …so firms increase output, and income rises toward a new equilibrium. ΔG
  • 47.
    Solving for ΔY YC I G = + + Y C I G  =  +  +  MPC =   +  Y G C G =  +  (1 MPC) −  =  Y G 1 1 MPC    =     −   Y G equilibrium condition in changes because I exogenous because ΔC = MPC ΔY Collect terms with ΔY on the left side of the equals sign: Solve for ΔY :
  • 48.
    The government purchasesmultiplier Definition: the increase in income resulting from a $1 increase in G. In this model, the govt purchases multiplier equals Example: If MPC = 0.8, then 1 1 MPC  =  − Y G 1 5 1 0.8  = =  − Y G An increase in G causes income to increase 5 times as much!
  • 49.
    Why the multiplieris greater than 1 • Initially, the increase in G causes an equal increase in Y: ΔY = ΔG. • But #Y g #C g further #Y g further #C g further #Y • So the final impact on income is much bigger than the initial ΔG.
  • 50.
    An increase intaxes Y PE PE =C2 +I +G PE2 = Y2 PE =C1 +I +G PE1 = Y1 ΔY At Y1, there is now an unplanned inventory buildup… …so firms reduce output, and income falls toward a new equilibrium ΔC = −MPC×ΔT Initially, the tax increase reduces consumption and therefore PE:
  • 51.
    Solving for ΔY YC I G  =  +  +  ( ) MPC =   −  Y T C =  (1 MPC) MPC −  = −   Y T eq’m condition in changes I and G exogenous Solving for ΔY : MPC 1 MPC   −  =     −   Y T Final result:
  • 52.
    The tax multiplier def:the change in income resulting from a $1 increase in T: MPC 1 MPC  − =  − Y T 0.8 0.8 4 1 0.8 0.2  − − = = = −  − Y T If MPC = 0.8, then the tax multiplier equals
  • 53.
    NOW YOU TRY Practicewith the Keynesian cross Use a graph of the Keynesian cross to show the effects of an increase in planned investment on the equilibrium level of income/output. 53
  • 54.
    ANSWERS Practice with theKeynesian cross 54 Y PE PE =C +I1 +G PE1 = Y1 PE =C +I2 +G PE2 = Y2 ΔY At Y1, there is now an unplanned drop in inventory… …so firms increase output, and income rises toward a new equilibrium. ΔI
  • 55.
    The IS curve def:a graph of all combinations of r and Y that result in goods market equilibrium i.e. actual expenditure (output) = planned expenditure The equation for the IS curve is: ( ) ( ) Y C Y T I r G = − + +
  • 56.
    Y2 Y1 Y2 Y1 Deriving the IScurve ir g hI Y PE r Y PE =C +I(r1 )+G PE =C +I(r2 )+G r1 r2 PE =Y IS ΔI g hPE g hY
  • 57.
    Fiscal Policy andthe IS curve We can use the IS-LM model to see how fiscal policy (G and T ) affects aggregate demand and output. Let’s start by using the Keynesian cross to see how fiscal policy shifts the IS curve…
  • 58.
    Y2 Y1 Y2 Y1 Shifting the IScurve: ΔG At any value of r, hG g hPE g hY Y PE r Y PE =C +I(r1 )+G1 PE =C +I(r1 )+G2 r1 PE =Y IS1 The horizontal distance of the IS shift equals IS2 …so the IS curve shifts to the right. 1 1 MPC  =  − Y G ΔY
  • 59.
    NOW YOU TRY Shiftingthe IS curve: ΔT Use the diagram of the Keynesian cross or loanable funds model to show how an increase in taxes shifts the IS curve. If you can, determine the size of the shift. 60
  • 60.
    ANSWERS Shifting the IScurve: ΔT 61 Y2 Y2 At any value of r, hT g iC g iPE PE =C2 +I(r1 )+G IS2 The horizontal distance of the IS shift equals Y PE r Y PE =Y Y1 Y1 PE =C1 +I(r1 )+G r1 IS1 …so the IS curve shifts to the left. −  =  − MPC 1 MPC Y T ΔY
  • 61.
    Shifts of theIS - Curve Let’s summarize: •Equilibrium in the goods market implies that an increase in the interest rate leads to a decrease in output. •Changes in factors that decrease the demand for goods, given the interest rate shift the IS curve to the left.
  • 62.
    The theory ofliquidity preference Due to John Maynard Keynes. A simple theory in which the interest rate is determined by money supply and money demand.