SlideShare a Scribd company logo
1
CHAPTER I
INTRODUCTION
“In a modern money using economy, finance may be defined as the provision of
money at time it is wanted.” The ambitious plans of the businessmen would remain
mere dreams unless adequate money is available to convert them into reality. In the
early stages of industrial revolution, capital was not much consequent and the
financial requirements of businesses were limited. The methods of production were
extremely simple and tools and equipments were inexpensive. Labour was more
important, relatively than capital. Production could, thus, be termed as ‘Labour
intensive’. Under such a set up, finance didn’t pose any big problem. As the time
passed, industries grew and production began to be carried on a mass scale for
national and international markets. It necessitated the use of huge and complex
machineries, very large quantities of raw materials and large number of workers. All
these made industry ‘capital intensive’ and capital became the most important factor
of production.
Finance is required at different stages of business beginning from its formation,
expansion extending up to its winding up. The success of every business depends
upon the way in which required funds are arranged at the right time, in the right
quantity from right sources and at the least cost. All these aspects are covered by
financial management. Financial management in simple terms is concerned with
three broad decision areas like investment decisions, financing decisions and dividend
decisions.
In the present day Capitalistic regime the size of business enterprises is increasing
resulting into corporate empires empowered with a lot of social and political
influence. This makes corporate finance all the more important. Corporate finance is
also referred to as Financial Management. Every management aims to utilize its funds
is a best possible and profitable way. The success and growth of a firm depends upon
adequate return on investment. The investors or shareholders can be attracted by a
firm only by maximization of their wealth through the application of principles and
procedures as laid down by corporate finance.
2
STATEMENT OF THE PROBLEM
To function to create profit and earn goodwill, all businesses needs the financial
support. To carry out its operations, they have to procure funds and make optimum
utilization of these funds. This calls for sound decisions making specifically when it
comes to decision pertaining to finance as all other decisions have financial impact.
Financial management is a managerial activity is a separate discipline; it has evolved
as a separate body of knowledge but still depends heavily on economics for its
theoretical concepts. Besides economic theories, it uses accounting knowledge,
mathematical rules, aspects of system analysis and behavioral science for arising
financial managers. The subject of financial management is of immense interest to
both academicians and practicing managers. Indeed, the emergence of financial
management as a separate discipline have increased the scope of Chartered
Accountants, Cost and Work Accountants, MBA holders etc. It is even important in
our personal life and inevitable in business life.
SCOPE AND SIGNIFICANCE OF THE STUDY
The study on ‘Financial Analysis and Performance Evaluation of Geodesic Limited’
is carried out to get a clear picture of the company by examining its liquidity,
profitability, return on capital employed, earnings per share etc. The performance
effectiveness of the company is also analyzed by comparing with past few years.
Geodesic is a technology company focused on delivering solutions/products in the
field of communication, content management, collaboration and customer
management to the enterprise and retail segments. As the company is dealing with
software development and hardware products, their main focus is on innovation. The
customer base of the company covers major financial institutions, banks, public sector
undertakings, multinational companies, broking houses, mutual funds and insurance
providers. The company assures that they design and build their products and
solutions to help their customers around the world to reduce their communication
costs and sales cycles and improve efficiency to grow their businesses. Hence, in the
world of innovation, a study on an Electronic Communication Technology Company
like Geodesic Limited who serves general public and government is significant from
economic point of view.
3
OBJECTIVES OF THE STUDY
The main purpose of the study is to examine the financial performance of the
‘Geodesic limited’ for the last five years, with the help of their published financial
statements. Through the analysis, the following objectives are accomplished.
1. To assess the profitability, liquidity, solvency and efficiency of the company.
2. To assess the extent of operation and market performance
3. To decide about future prospects of the company
4. To analyze income and expenditure pattern so as to focus its impact on
profitability.
5. To calculate various ratios based on their final accounts.
METHODOLOGY
The proposed in the study is descriptive and analytical in nature. The study is based
on secondary data. The secondary data was collected from books, reports and
journals. The information so collected has been rearranged in a meaningful manner
for the purpose of analysis and interpretation. For analysis and interpretation of data
ratios, averages, charts etc. have been used.
PERIOD OF THE STUDY
The study covers a period of consecutive years from 2006-2007 to 2010-2011. For the
purpose of studying the performance of Geodesic Ltd the researchers have used the
data for five years commencing from 2006-2007 to 2010-2011.
LIMITATIONS OF THE STUDY
The study is subject to certain limitations in spite of the care taken in collection,
classification and analysis of data, the following limitations are noted.
1. The study has the limitations of accounting ratios.
2. The study was concerned on a single company and no comparison is being
made.
3. The study is based only on secondary data.
4. Only financial aspects are studied in detail.
4
5. Financial statements are only interim reports and cannot be final because
true profit/loss can be ascertained only when the business is closed down
CHAPTERIZATION
CHAPTER I- INTRODUCTION
The introductory chapter starts with a brief introduction characterizing the importance
of finance in a business concern and emergence of financial management as a separate
discipline. It is followed by the statement of the problem, scope and significance of
the study, objectives of the study, methodology, period of the study and limitations.
CHAPTER II – FIANCIAL MANAGEMENT AND A COMPANY PROFILE
OF GEODESIC LIMITED
An overview of Financial Management and a detailed note on business of Geodesic
limited, products they offer to various market segments and operational and financial
highlights of the company is given in this chapter.
CHAPTER III- FINANCIAL ANALYSIS- A THEORETICAL FRAMEWORK
This chapter explains various tools and techniques which are generally used for
financial statement analysis to judge about the profitability, liquidity and solvency of
a concern.
CHAPTER IV – ANALYSIS AND ITERPRETATION OF FINANCIAL
STATEMENTS
For getting a clear picture of the company’s performance effectiveness and
management, the data collected are analyzed in detail making use of the tools such as
ratio analysis, comparative statement analysis and trend analysis.
CHAPTER V –FINDINGS, SUGGESTIONS AND CONCLUSIONS
The chapter deals with the observations during the study and suggestions given by the
researchers and conclusions drawn there from.
5
CHAPTER - 2
FINANCIAL MANAGEMENT AND
COMPANY PROFILE OF GEODESIC LTD.
FINANCIAL MANAGEMENT- AN OVER VIEW
Financial Management is an appendage of the finance function with the creation of a
complex industrial structure, the function has grown so much that it has given birth to
a given subject- Financial Management- which is today recognized as the most
important branch of business administration. One cannot think of any business
activity in isolation from its financial implications. The management may accept or
reject a business proposition on the basis of its financial viabilities. In this connection,
Howard and Upton observe: “Financial Management involves the application of
general management principles to a particular financial operation”. Financial
management is that part of management which is concerned mainly with raising funds
in the most economic and suitable manner ; using these funds as profitably as
possible; planning future operations and controlling current performances and future
developments through financial accounting, cost accounting, budgeting, statistics and
other means.
Financial Management is dynamic, evolving or making of day to day financial
decisions in a business of any size. The old concept of finance as treasurer ship has
broadened to include the new, equally meaningful concept of controllership. While
the treasurer keeps track of moneys, the controller’s duties extend to planning,
analysis and the improvement of every phase of the company’s operations, which are
measured with a financial yardstick.
OBJECTIVES OF FINANCIAL MANAGEMENT:
• Profit Maximization
• Wealth Maximization
In the former approach, financial decisions are oriented to maximize the profits of
EPS of the shareholders. Those actions that increase profits are undertaken and those
decrease profits are avoided. Anyhow this objective is suitable only for sole trading
6
concerns where an individual’s capital was employed in anticipation of returns to be
enjoyed by him.
The latter approach aims to maximize the market value of the shares of the firm.
Under this, those decisions which ultimately increase the value of shares, are
considered efficient decisions and decisions which result in decline in the share price,
are poor decisions. It means the aim of financial management is to maximize the
wealth of shareholders, who are the owners of the company.
A’S OF FINANCIAL MANAGEMENT
It refers to the role played by a financial management in a business enterprise.
• Anticipating financial needs
• Acquiring financial resources
• Allocating fund in a business
• Administrating the allocation of funds
• Analyzing the performance of funds
• Accounting and reporting to the management
The link between Economics and Financial Management is close. A study of financial
management is likely to be a barren if it is divorced from the study of Economics.
Modern financial management concentrates on Micro- economic areas with which a
business enterprise has to deal during its day to day operations.
FUNCTIONAL AREAS OF FINANCIAL MANAGEMENT
Functional areas of financial management are the following:
Determining financial needs, determining sources of funds, Financial Analysis,
Optimal Capital Structure, Cost Volume Profit Analysis, Profit planning and Control,
Fixed assets management, Project planning and evaluation, Capital budgeting,
Working capital management, Dividend policies, acquisitions and merger and
Corporate taxation.
7
FINANCIAL DECISIONS
These are the decisions relating to financial matters of a corporate enterprise. These
are areas of financial management, which facilitate a business firm to achieve wealth
maximization.
• Financial requirement decisions
• Investment decisions
• Financing decisions
• Dividend decisions
With technological progress, financial management almost forced to improve its
methodology. Such things as cost of capital, optimal capital structure, effects of
capital structure upon cost of capital and market value of a firm were incorporated in
the subject. Moreover financial management laid emphasis on international business
and finance, and showed a serious concern for the effect of multi- naturals upon price
level. The discipline of financial management was conditioned by changes in the
socio- economic and legal environment. Its emphasis shifted from profitability
analysis to cash flow generation; and it developed an interest in internal management
procedures and control. Modern financial management however, is basically
concerned with optimal matching of uses and sources of corporate funds that lead to
the maximization of a firm’s market value.
Finance function of a business is closely related to its other functional area. The
relationship between accounting and finance is intimate. Charles Gatenberg visualizes
the influence of scientific arrangement of records, with the help of which inflow and
outflow of funds can be efficiently managed and stocks and bonds can be efficiently
marketed. All the accounting tools and control devices, necessary for appraisal of
financial policy can be correctly formulated if the accounting data is properly
recorded. And hence the finance manager has to depend heavily on the accuracy of
the accounting data.
8
COMPANY PROFILE OF GEODESIC LTD
OVERVIEW
Geodesic company is a technology company focused on delivering solutions in the
space of Communication, Content Management, Collaboration and Customer
Relationship Management to the enterprise and retail segments. Their innovative
products and services, emphasis on substantial cost reductions, and enhanced
productivity for the enterprise and retail segments, have lead to improve their earnings
and revenues, besides win several global awards. Their mobile products are used by
millions of people around 108 countries at the last count.
Genesis of Geodesic Limited (Geodesic) was started on 8th July of 1999 as Geodesic
Information Systems Private Limited. The Company is an innovator in software
products focused on Information, Communication and Entertainment for mobile
phones and desktop computers under the 'Mundu' brand name for the retail segment.
Headquartered in Mumbai, India, Geodesic's Mundu suite of award-winning products
includes solutions for Instant Messaging, Voice-over-IP and Internet Radio. Geodesic
has offices in Mumbai and Bangalore in India, USA (Silicon Valley), as well as
Sweden, Hong Kong and Singapore.
Their mission is to make Content, Communication and Collaboration accessible and
truly affordable across networks. This in turn will increase productivity and
efficiency. Fun at Work is the mantra at Geodesic. Geodesic is indeed, innovative in
practice.
MILESTONES
Following gives us a summarized picture of the progress of the company Geodesic
ltd.:
1999 - On 8th
July of 1999, Geodesic Ltd. came into existence as Geodesic
Information
Systems Pvt. Ltd.
2000 - The company launched Hamarashop.net (E-commerce portal) and Mundu IM
(world’s first truly Interoperable Messaging System)
2001 - The company launched Mundu IM on Indiatimes.com. in November.
9
2003 - Launched company’s revolutionary technology ‘IM Around’
2004 - Won Deolitte Touche Tohmatsu Asia Pacific Technology Fast 500 Award in
January and started its operations for the first time in US.
2005 - Established its operations in UK, Hong Kong and Sweden.
2006 - Introduced a mobile VOIP product under the name ‘Mundu Speak’ in March.
2007 - The mobile entertainment product of the company, Mundu Radio had
received the ‘CNET Webware 100’ award for the mobile category in June
and in August the company designed its product Mundu IM for the iPhone.
2008 - Launched a New Era in Mobile Entertainment with True Internet Radio
Access in February and w.e.f. 19th
September the company changed its name
from Geodesic Information Systems to Geodesic Limited.
CUSTOMER BASE OF THE COMPANY
They address the following primary segments:
ENTERPRISES
They provide enterprises with their Unified Communication and Collaboration stack,
the CRM module and Content Management System. These modules help Enterprises
in reducing their communication costs, enhancing their productivity through
collaboration, and reducing their sales cycle through better content analytics/
management and a powerful CRM.
TELECOM OPERATORS AND HANDSET MANUFACTURERS
They have a deep line that easily adds value to Telcos and Handset Vendors who
solely rely on value added services and features they provide to their customers. They
bundle their applications on the handsets and are part of the offerings by the Telecom
Operators.
10
RETAIL CONSUMERS
They provide mobile consumers with products in the space of communication
including Mundu IM, Mundu Universal Messenger, Spokn, and Mundu SMS. They
offer streaming, live and on- demand content to users through Mundu Radio and
Mundu TV. All of their applications are available across multiple platforms including
iOS, Androld, Blackberry, Symbian, Java and on Windows and MacOS desktops. In
the last quarter they launched Carrom MP- a game based on Physics for iPad.
SYSTEM INTEGRATORS AND VALUE ADDED RESELLERS
They recognize this as an extremely important segment. They integrate almost all of
their products and solutions and reach out to customers not easily accessible by them.
GOVERNMENT AND FINANCIAL INSTITUTIONS
They provide GeoAmida (hand- held device) based solutions to this segment and on
offer are the following solutions: Mahatma Gandhi Rural Employment Guarantee Act,
Law Enforcement, Public Distribution Systems, Financial Inclusion and Remote
Health Management.
Geodesic now have 14 offices worldwide and over 700 employees. While they have
invested substantially in innovation and growth, they have managed to extend their
competitive advantage, fortified their leadership and retained their work culture.
SUBSIDIARIES AND ASSOCIATE COMPANIES
SUBSIDIARIES
Geodesic and its subsidiaries follow a consistent work ethos with a sprinkling of
region or country specific culture added into enhance the fun quotient across Geodesic
companies. Geodesic and its subsidiaries reflect their philosophy of innovation, adapt
to change and quick response to customer needs. Subsidiaries are:
• Chandamama India Ltd.
• FilmOrbit.com India Pvt. Ltd.
• Geodesic Grid point Energy Pvt. Ltd.
11
The steps- down subsidiaries are:
• Geodesic Information Systems Inc, USA
• Geodesic Hong Kong Ltd, Hong Kong
• Interactive Network International British Virgin Islands
• Publicidad Digital SA, Uruguay
• Geodesic Technology FZE, Dubai
• Emilotto Associated Inc, Panama
Other two more companies
• Spokn Communications’ Pte. Ltd, Singapore
• Zomo Technologies Limited, British Virgin Islands
ASSOCIATE COMPANIES
ITM Digital Pvt. Ltd was incorporated as a Joint Venture Between ZEE
Entertainment Enterprises Ltd and Geodesic Ltd to offer applications for delivery of
content to mobile and internet devices through Mundu TV. Due to lack of
coordination between ZEEL and Geodesic, on mutual understanding and consent,
both the companies decided for the severance of the Joint Venture Agreement. The
deed of Cancellation was signed on 18th
April, 2011. Their holdings in ITM Digital
Pvt. Ltd were transferred to ZEEL as a mark of separation. A step- down subsidiary of
Geodesic Ltd is Republique Media Pvt. Ltd.
WORK CULTURE
Work culture at Geodesic involves challenges, healthy competition, constructive rule
breaking and above all, fun. Each employee becomes a part of the Geodesic family,
which extends beyond the boundaries of work. High retention has been achieved by
continuously upgrading the competencies of the employees. While their focused
initiatives at creating work life balances also serves as a powerful tool for increasing
retention in addition to other factors such as best pay packages and entrepreneurial
work styles.
Geodesic’s emphasis on innovation and commitment to cost containment means each
employee is a hand- on contributor. There is little in the way of corporate hierarchy
12
and everyone wears several hats. At Geodesic, believe in transparency, flexibility,
interaction, integration of thoughts, ideas, culture, values and results across the
organization irrespective of the hierarchy. Though growing rapidly Geodesic still
maintains a small company feel. Almost everyone eats at the Geodesic café, sitting at
the table enjoying conversations with colleagues and friends from various
departments.
BUSINESS MODELS
Geodesic addresses a diverse market segment and have been successful in adopting
unique business models for each of their market segments. They include license and
support fee, usage fee and revenue share and subscriptions. These are built to help
their clients succeed in delivering business value to this enterprise.
Their business models are resilient, adapting to the continuously changing market and
economic environment. Their business models, supported by the long term financial
model, have enabled to deliver strong earnings consistently, cash flows and returns to
share holders in changing economic environment.
ADMINISTRATION
The company comprises of a Supervisory Board of Directors that has an optimum
combination of Executive and Non-Executive Directors who have an in depth
knowledge and a wealth of experience in running successful business. The
Independent Non- Executive Directors bring an external and wider perspective in
Board deliberations and decisions in addition to the expertise in their areas of
Specialization.
ROLE OF BOARD OF DIRECTORS
The primary role of Board is that of the trusteeship to protect and enhance
shareholders’ value through strategic supervision of the company and its subsidiaries.
The board is entrusted with the ultimate responsibility of management, general affairs,
direction and performance of the board has been vested with the requisite powers,
authorities and duties.
13
Table No. 2.1
DETAILS OF BOARD OF DIRECTORS AS ON 31st
March 2011
Name of the
Directors
Designation Category
Mr. Pankaj Kumar Chairman Promoter&
Executive director
Mr. Kiran Kulkarni MD Director
Mr.Prashant
Mulekar
Executive Director Director
Mr. Vinod Seth Director Independent
Director
Mr. Nitin Potdar Director Independent
Director
Mr. G Krishnan Director Independent
Director
AWARDS AND RECOGNITIONS
The company describes how valuable their commitment to innovation has been
resulted in the growth of the company. It is visible in the range of products they have
developed and milestones they have achieved. Following are the awards won by
Geodesic Ltd.in the Financial year 2010-2011.
• Mundu TV was ranked No.1 in Entertainment Application on the Apple
Appstore in the entertainment category and was ranked No. 2 across all
categories on the Apple Appstore and in NDTVs ‘ 10 Apps For Every Indian’.
• Geoamida won the NASSCOM India Leadership Forum 2010 and its project
was nominated for the PC Quest Best IT Implementations in the field of
Mobility and Field Force Automation Projects.
• Business standard listed Mundu Radio amongst the top 10 Internet radio
stations.
14
• Geodesic was ranked amongst Deolitte Technology Fast 50 India 2010
Program and Fast 500 Asia Pacific 2010 Program.
• The company was ranked amongst Data Quest Top 200 companies of the
Indian IT Industry.
KNOWLEDGE MANAGEMENT
Knowledge Management at Geodesic allows geodesic minds together the collective
experiences and knowledge towards better product delivery, individual and
organisational excellence.
Their culture resonates with their goals to create an open and transparent organization
in which knowledge is created and shared in a supportive environment where
creativity and innovation are highly valued Geodesic minds are encouraged to bring
forward any idea for improvement or innovation to offer applications for delivery of
content to mobile and internet devices through Mundu TV.
PRODUCTS AND SERVICES OF GEODESIC LIMITED
The retail products of Geodesic Ltd classify into two categories: Communication and
Content Management & Delivery.
1).ENTERPRISE PRODUCTS
Their Enterprise products have been designed for desktop and mobile platforms that
include Continuum, Spyder and .fn suite of products.
• Continuum
The Unified Communication and Collaboration solution delivers rea- time
communication and collaboration services across a powerful contact
management module unifying user experience while leveraging an enterprise’s
existing IT and telephony infrastructure. Unified Communication,
collaboration, Content Analytics and CRM for the Enterprise Market, Portals,
Financial Institutions, System Integrators and Value Added Resellers.
Continuum is a Unified Communication and Collaboration suite of products
combining the capabilities of the enterprise communication framework and
sophisticated contact management into a single, powerful solution. Continuum
as a concept and as a solution is more relevant to all enterprises as the number
15
of remote workers continues to grow overtime. They have now enhanced
Continuum by adding enterprise wide social CRM elements and business
continuity tools to add more value to the product.
• Spyder
An advanced Client Relationship alignment Management System for the
complex needs of a financial institution that sells intellectual product
manifesting as opinion (backed by research) and it is an ideal solution for
Fund Management and Investment Banking. CRM for Financial Institutions,
Enterprises, System Integrators and Value Added Resellers. Spyder has been
successfully integrated within Continuum to ensure they are a unique offering
of Content Management, Unified Communication& Collaboration and CRM.
• .fn solution or Financial Portal Network
In suite of financial products is designed to provide seamless, smart analytics
interface between Financial Service Providers and their ever- demanding
customer base. Their state of the art financial solutions and powerful Analytics
Framework help to create custom bespoke offerings that are both, value- rich
and competitive. Their elite clientele comprises major Financial Institutions,
Banks, Broking Houses, Mutual Funds and Life Insurance Companies.
Their .fn products include Wallet Wap, Wealth Console and WIT, a content
analytics and management tool. These applications in general provide multi-
dimensional portfolio analysis to enterprises and consumers on their desktops
and phones.
• Wallet Wap : It is the key to anytime /anywhere delivery of personalized
market and investment information. The fastest, most direct channel to keep
clients informed about the happenings in the markets, it is compatible with all
mobile devices.
• Wealth Console: It is an enterprise-ready, client server solution that improves
communication between Financial Wealth Managers and their clients.
16
2).RETAIL PRODUCTS
Their retail products are classified into three categories- Communication, Content
streaming (live/ on- demand) &Management and Gaming.
COMMUNICATION
Mundu IM/ UM
A messenger that unifies different messaging services ( AIM, Face book, Gtalk, ICQ,
Jabber, MSN,Yahoo) in an easy to use single interface. Mundu IM/UM is available on
all platforms including Symbian, iOS, and Android, Blackberry and Feature phones.
Mundu SMS
A global service that allows mobile users to send text messages using the Internet on
their mobile phones and desktops to connect with their contacts at a fraction of the
cost incurred by mobile users on their GSM/ CDMA networks. Mundu SMS retains
their regular SMS usability and user perception.
Spokn
A worldwide Telecom service based on the internet that enables people to make
phone calls and send short Voice Messages(VMS) using their computers, internet
enabled smart phones and PSTN phones. Spokn phone calls and voice messages are
economical by a margin of 70% over regular GSM/PSTN/CDMA calls.
CONTENT MANAGEMENT AND DELIVERY
• Mundu TV: A live streaming and on- demand video application that allows
consumers to watch live TV and video-on-demand content on their mobile
phones and desktops. Live TV and on-demand video apart from great music,
have been touted as two of the most wanted in the 3G space.
• Mundu Radio: An internet radio solution that offers high quality digital audio
on mobile handsets and desktops. The solution allows mobile and desktop
users to choose music genres of their choice from thousands of genre based
Internet radio stations. Consumers can choose a genre/album/song of their
choice or simply discover serendipitously.
17
MOBILE GAMING
• Carom MP: An intriguing strategic board game which is fully compliant with
the laws of Physics, for the iPad. Geodesic launched Carrom MP-an exciting
multiplayer board game app for the Apple iPad.
ELECTRONIC COMPUTING
They have included variants of Geoamida to suit solutions in the area of Law
Enforcement, Rural Employment Guarantee Act, Public Distribution Systems,
Financial Inclusion, Micro Finance, Healthcare, and as a ERP device.
• Geoamida: the world’s first integrated mobile computer based on Linux. It
includes biometric sensors and smartcard readers/writers. It is a multi-lingual,
real-time computing and transaction system with an integrated text to speech
facility.
• Chandamama: it is in the process of internationalizing its content and plans to
deliver this content over the electronic medium including mobile phones and
tablets. They have remodeled their offline distribution channels to maximize
its reach besides actively promoting Chandamama products on online stores
andwww.chandamama.com.
• ENLYTE (Education ‘N’ Learning You Take Everywhere): Their education
device has passed rounds of alpha testing and has entered the crucial phase of
beta testing.
18
CHAPTER-3
FINANCIAL ANALYSIS- THEORETICAL FRAMEWORK
FINANCIAL STATEMENTS
Accounting is the process of identifying, measuring and communicating economic
information to permit informed judgments’ and decisions by users of the information.
It involves recording, classifying and summarizing various business transactions. The
end products of business transactions are the financial statements comprising
primarily the position statement or the balance sheet and the income statement or the
profit and loss account. These statements are the outcome of summarizing process of
accounting and are; therefore the sources of information on the basis of which
conclusions are drawn about the profitability and the financial position of a concern.
They play a dominant role in setting the framework of managerial decisions. But the
information provided in the financial statements is not an end in itself as no
meaningful conclusions can be drawn from these statements alone. However, the
information provided in the financial statements is of immense use in making
decisions through analysis and interpretation of financial statements.
Financial statements are also called financial reports. In the words of Anthony,
“financial statements, essentially are interim reports, presented annually and reflect a
division of life of an enterprise into more or less arbitrary accounting period- more
frequently a year.” Generally Accepted Accounting Principles (GAAP) specifies that
a complete set of financial statements must include:
A Balance Sheet
An Income Statement
A Statement of changes in owners’ accounts, and
A Statement of changes in financial position
The analysis of financial statements and data is an indispensable component of
investing, financing and dividend decisions.
19
FINANCIAL ANALYSIS
Financial analysis is the process of identifying the financial strengths and weaknesses
of the firm by properly establishing relationship between the items of Balance Sheet
and Profit and Loss Account. The term ‘Financial Statement Analysis’ includes both
‘Analysis’ and ‘Interpretation’. A distinction should, therefore, be made between the
two terms. While the term ‘Analysis’ is used to mean the simplification of financial
data, ‘Interpretation’ means, explaining the meaning and significance of the data so
simplified. However, both ‘Analysis’ and ‘Interpretation’ are interlinked and
complimentary to each other. Analysis is useless without Interpretation and
Interpretation without Analysis is difficult or even impossible.
OBJECTIVES OF FINANCIAL ANALYSIS
Financial statement analysis is largely a study of relationship among the various
financial factors in a business as disclosed by a single set of statements and a study of
the trends of these factors are shown in a series of statements. The main objective of
financial statement analysis is given as follows:
1. To examine the earning- capacity and efficiency of various business activities
with the help of financial statements
2. To determine the short term and long term solvency of the business concern
with the help of statement of position.
3. To investigate the future potential of the concern.
4. To make comparative study of the operational efficiency of similar concern
engaged in the identical industry and
5. To estimate about the performance efficiency and managerial ability by the
management of a business concern.
The objectives of the analysis may be varied according to the uses of the financial
statement analysis. Nowadays, the analysis of financial statements and related data
was considered to be important and a number of techniques were developed and used
for analyzing.
20
Figure – 3.1
TYPES OF FINANCIAL ANALYSIS
On the basis of material used On the basis of Modus
Operandi
External Internal Horizontal
Vertical
1. EXTERNAL ANALYSIS
This analysis is done by outsiders who do not have access to the detailed internal
accounting records of the business firm. The outsiders include investors, creditors,
government agencies, general public etc. For financial analysis, they depend entirely
on the published financial statements.
2. INTERNAL ANALYSIS
This analysis is conducted by persons who have access to the internal accounting
records of a business firm. Such analysis can be performed by executives and
employees of an organization.
3. HORIZONTAL ANALYSIS
It refers to the comparison of financial data of a company for several years. This type
of analysis is also called ‘Dynamic Analysis’ as it is based on the data from year to
year rather than data of any one year. Comparative Statements and Trend Percentages
are two tools employed in horizontal analysis.
21
4. VERTICAL ANALYSIS
It refers to the study of relationship of various items in the financial statements of one
accounting period. It is also known as ‘Static Analysis. Common-size statements and
Financial Ratios are the two tools employed in vertical analysis.
METHODS AND DEVICES OF FINANCIAL ANALYSIS
The analysis and interpretation of financial statements is used to determine the
financial position and results of operations as well. A number of methods or devices
are used to study the relationship between statements. The following methods of
analysis are generally used:
1) COMPARATIVE STATEMENTS
2) TREND ANALYSIS
3) RATIO ANALYSIS
4) COMMON-SIZE STATEMENTS
5) FUNDS FLOW ANALYSIS
6) CASH FLOW ANALYSIS
COMPARATIVE STATEMENTS
Comparative financial statements are statements of the financial position at different
periods of time. The elements of financial position are shown in a comparative form
so as to give an idea of financial position at two or more periods. The comparative
statements may show absolute figures, changes in absolute figures; absolute data in
terms of percentages and increase or decrease in terms of percentages. Comparative
financial statement is very useful to the analyst because they contain not only the data
appearing in single statements but also information necessary for the study of
financial and operating trends over a period of years. They indicate the direction of
the movement with respect of the financial position and operating results.
COMPARATIVE BALANCE SHEET
Increase and decrease in various assets and liabilities as well as in proprietors’ equity
or capital brought about by conduct of a business can be observed by a comparison of
the balance sheets at the beginning and the end of the period. Such observation often
yields considerable information which is of value in forming an opinion regarding the
22
progress of the enterprise and in order to facilitate comparison, a simple device known
as “Comparative Balance Sheet” may be used.
COMPARATIVE INCOME STATEMENT
An income statement shows the net profit or net loss resulting from the operation of a
business for designated period of time. A comparative income statement shows the
operating results for a number of accounting periods so that changes in absolute data
from one period to another may be started in terms of money and percentages.
The comparative income statements contain the same columns as the comparative
balance sheet and provide the same type of information-the accounts balances,
increase and decrease in money amounts. The cost of goods sold should not increase
out of proportion to the increase in sales and this would adversely affect gross profit
on sales. Selling expenses bear a direct positive correlation to sales volume because
most of these expenses vary more or less in the same proportion as the sales.
TREND ANALYSIS
This method determines the direction upwards or downwards and involves the
computation of the percentage relationship that each statement item bears to the same
item in the base year. The figures of the base year are taken as 100 and trend ratios for
other years are calculator on the basis of the year
A series of financial statement may be analyzed by determining and studying the
trend of the data shown in the statement. This method of analysis one of direction-
upward or downward- and involves the computation of percentage relationship that
each statement item bears to the same item in the ‘base year’ which may be the
earliest year involved in comparison or the latest year or any intervening year. Trend
percentages relate to the base year, emphasize changes in the financial operating data
from year to year and make a possible a horizontal study on the data.
23
COMPUTATION OF TREND PERCENTAGES
1. A statement is taken as the base with reference to which all other statements
are to be studied.
2. Every item to be stated as 100 in the statement which is taken as the base.
3. If the amount of an item on the other statement is less than that in the base
statement, the trend percentages will be below 100 and if the amount is more
than the base amount, the trend percentage would be above 100 percent.
4. Trend ratios can be computed by dividing each amount in the statements with
the corresponding item in the statement taken as base.
EVALUATION OF TREND PERCENTAGES
It is noted that, though trend ratios show whether an item has increased or decreased
as well as the degree of change, they are valuable only to the extent to which they
provide clues to favorable or unfavorable tendencies and point the way for further
analysis.
The comparability of trend ratios is adversely affected to the extent to which
accounting principles and policies published by the accounts have not be followed
consistently through the period being studied. Comparability of the data is also
adversely affected when the price level has changed materially during the year under
review. Some analysis deflate the statement data by dividing the money amounts with
the related price index thereby providing figures that will give abroad idea of changes
in physical quantity and volume exclusive of price charges.
RATIO ANALYSIS
It is the process of establishing and interpreting various ratios (quantitative
relationship between figures and groups of figures). It is with the help of ratios that
the financial statements can be analyzed more clearly and decisions made from such
analysis. Ratio analysis is a technique of analysis and interpretation of financial
statements. It is the process of establishing and interpreting various ratios for helping
in making certain decisions. It is not only a means of better understanding of financial
strengths and weaknesses of a firm. Calculation of mere ratios does not serve any
purpose, unless several appropriate ratios are analyzed and interpreted. There are a
24
number of ratios which can be calculated from the information given in financial
statements, but the analyst has to select the appropriate data and calculate only a few
appropriate ratios from the same keeping in mind the objective of analysis. The ratios
may be used as a symptom like blood pressure, the pulse rate or the body temperature
and their interpretation depends upon the caliber and the competence of the analyst.
The following are the steps involved in the ratio analysis:
1. Selection of relevant data from the financial statements depending upon the
objective of the analysis.
2. Calculation of appropriate ratios from the above data.
3. Comparison of the calculated ratios with the ratios of the same firm in the past
or the ratios developed from the projected financial statements or the ratios of
some other firms or the comparison with ratios of the industry to which the
firm belongs.
4. Interpretation of the ratios.
INTERPRETATION OF THE RATIOS
The interpretation of the ratios is an important factor. Though calculation of ratios is
also important but it is only a clerical task whereas interpretation needs skill,
intelligence and foresightedness. The inherent limitations of ratio analysis should be
kept in mind while interpreting them. The impact of factors such as price level
changes, change in accounting policies, window dressing etc., should also be kept in
mind when attempting to interpret ratios.
The interpretation of ratios can be made in the following ways:
1. SINGLE ABSOLUTE RATIO
Generally speaking one cannot draw any meaningful conclusion when a single ratio is
considered in isolation. But single ratios may be studied in relation to certain rule of
thumb which is based upon well proven conclusions as for example 2:1 is considered
to be a good ratio for current assets to current liabilities.
2. GROUP OF RATIOS
Ratios may be interpreted by calculating a group of related ratios. A single ratio
supported by other related additional ratios becomes more understandable and
25
meaningful. For example, the ratio of current assets to current liabilities may be
supported by the ratio of liquid assets to liquid liabilities to draw more dependable
conclusions.
3. HISTORICAL COMPARISON
One of the easiest and most popular ways of evaluating the performance of the firm is
to compare its present ratios with past ratios called comparison overtime. When
financial ratios are compared over a period of time, it gives an indication of the
direction of change and reflects whether the firm’s performance and financial
performance has improved, deteriorated or remained constant over a period of time.
But while interpreting ratios from comparison over time, one has to be careful about
the changes, if any, in the firm’s policies and accounting procedures.
4. PROJECTED RATIOS
Ratios can be calculated for future standards based upon the projected or proforma
financial statements. These future ratios may be taken as standard for comparison and
the ratios calculated on actual financial statements can be compared with the standard
ratios to find out variances, if any. Such variances help in interpreting and taking
corrective action for improvement in future.
5. INTER-FIRM COMPARISON
Ratios of one firm can also be compared with the ratios of some other selected firms
in the same industry at the same point of time. This kind of comparison helps in
evaluating relative financial position and performance of the firm.
26
Figure – 3.2
CLASSIFICATION OF RATIOS
(A) (B) (C)
Traditional Classification Functional Classification Significance
Ratios
Balance Sheet Ratios Liquidity Ratios Primary
Ratios
Revenue Statement Leverage Ratios Secondary
Ratios
Ratios
Composite or mixed Activity Ratios
Ratios
Profitability Ratios
FUNCTIONAL CLASSIFICATION OF RATIOS
A). LIQUIDITY RATIOS
The short term creditors of a company like suppliers of goods of credit and
commercial banks providing short-term loans are primarily interested in knowing the
company’s ability to meet its current or short-term obligations as and when these
become due. Therefore, a firm must ensure that it does not suffer from lack of
liquidity or the capacity to pay its current obligations. If a firm fails to meet such
obligations due to lack of good liquidity position, its goodwill in the market is likely
to be affected beyond repair. It will result in a loss of creditor’s confidence in the firm
and may even lead to the closing down of the firm. Even a high degree of liquidity of
27
the firm. To measure the liquidity of a firm, current ratios, quick ratios etc. are
calculated.
B).SOLVENCY RATIOS
The term ‘solvency’ refers to the ability of a concern to meet its long term obligations.
The long- term indebtedness of a firm includes debenture holders, financial
institutions providing medium and long-term loans and other creditors selling goods
on installment basis. The long-term creditors of a firm are primarily interested in
knowing the firm’s ability to pay regular interest on long-term borrowings, repayment
of the principal amount at the maturity of the security and the security of their loans.
Accordingly, long-term solvency ratios indicate a firm’s ability to meet the fixed
interest and costs and repayment schedules associated with its long-term borrowings.
Debt-equity ratios, equity ratios, etc. are the ratios applied to analyze the solvency of
a business enterprise.
C). PROFITABILITY RATIOS
The primary objective of a business undertaking is to earn profits. Profit earning is
considered essential for the survival of the business. In the words of Lord Keynes,
“Profit is the engine that drives the business enterprise”. A business needs profits not
only for its existence but also for expansion and diversification. A business enterprise
can discharge its obligations to the various segments of the society only through
earning of profits. Profitability ratios are calculated to measure the overall efficiency
of the business. Generally
Profitability ratios are calculated in relation to sales or in relation to investment.
These ratios can be divided into General and Overall Profitability ratios. Gross profit
ratio, net profit ratio, return on capital employed etc. are examples.
D).LEVERAGE RATIOS
It is concerned with analysis of capital structure. The term ‘capital structure’ refers to
the relationship between various Long-term source of financing such as debentures,
preference share capital and equity share capital including reserves and surplus.
Financing the firm’s assets is a very crucial problem in every business and as a
general rule there should be a proper mix of debt and equity capital in financing the
firm’s assets. Leverage or capital structure ratios are calculated to test the long-term
financial position of a firm. Capital gearing ratio, financial leverage etc. are examples.
28
E).ACTIVITY RATIOS
Funds are invested in various assets in business to make sales and earn profits. The
efficiency with which assets are managed directly affects the volume of sales. The
better the management of assets, the larger is the amount of sales and the profits.
Activity ratios measure the efficiency or effectiveness with which a firm manages its
resources or assets. These ratios are also called turnover ratios because they indicate
the speed with which assets are converted or turned over into sales. Inventory
turnover ratio is an example.
COMMON-SIZE STATEMENTS
Under this statements are shown in analytical percentages. The figures are shown as
percentages of total assets total liabilities and total sales. These statements are also
known as Component Percentage or 100% Statements because every individual item
is stated as a percentage of total 100. The short-comings in comparative statements
and trend percentages where changes in items could not be compared with the totals
have been covered up. Preparation of comparative financial statements and the
calculation of trend percentages or ratios as methods of analyzing financial
statements, have one common short coming-the inability of the analyst to comprehend
the changes that have taken place from year to year in relation to the total assets, total
liabilities and capital or total net sales. The seriousness of this limitation is brought
forth when a comparison is being made of two or more business units or of one unit
with statements for an industry as a whole, because there is no common base of
comparison when dealing with absolute figures. However, in case the balance sheet
and income statement items are shown in analytical percentages, i.e., percentage or
ratios of the total of appropriate item, a common base for comparison is provided. The
statement in this form is designated as ‘Common Size Statements’.
FUND FLOW STATEMENT
The balance sheet gives a static view of the resources (liabilities) of a business and the
uses (assets) to which these resources have been put at a certain point of time. It does
not disclose the causes for changes in the assets and liabilities between two different
points of time. Hence, another statement has to be prepared to show the change in the
assets and liabilities from the end of one period of time to the end of another point of
29
time. This statement is called a Statement of Changes in Financial Position or a Funds
Flow Statement.
The importance of fund flow statement can be well followed from its various uses.
• It helps in the analysis of financial operations
• It throws light on many perplexing questions of general interest
• It help in the formulation of a realistic dividend policy
• It help in the proper allocation of resources
• It acts as a future guide
• It helps in uprising the use of working capital
• It help in knowing overall credit worthiness of a firm
CASH FLOW STATEMENT
It is a statement which describes the inflows (sources) and outflows (uses) of cash and
cash equivalents in an enterprise during a specific period of time. A cash flow
statement summarizes the causes of changes in cash position of a business enterprise
between dates of two balance sheets. It takes into account receipts and disbursements
of cash. Inflow of cash is known as sources of cash and outflow of cash is known as
use of cash. Cash Flow Statement is a statement designed to highlight upon the causes
which bring changes in cash position between two balance sheets.
UTILITY OF CASH FLOW ANALYSIS
A cash flow statement is useful for short term planning. It is an important tool for the
management. Its chief advantages as follows:
• It helps in efficient cash management
• Helps in internal financial management
• Discloses the movements of cash
30
CHAPTER – 4
ANALYSIS AND INTERPRETATION OF FINANCIAL STATEMENTS
RATIO ANALYSIS
A. LIQUIDITY RATIOS
1. CURRENT RATIO
Current ratio may be defined as the relationship between current assets and current
liabilities. It is also known as working capital ratio. It is used in the analysis of short-
term financial position of a firm. It is calculated using the formula:
Current Assets
Current Liabilities
Current assets are those assets which can be easily converted into cash within a short
period. It includes cash, debtors, bills receivables etc. Current liabilities are those
obligations which are payable within a short period i.e., within one year. Examples
are creditors, bills payables etc.
Table no. 4.1
STATEMENT SHOWING CURRENT RATIO (in crores)
YEAR CURRENT
ASSETS
CURRENT
LIABILITIES
RATIO
( no. of times)
2006-2007 200.25 10.54 19.01
2007-2008 816.28 57.85 14.11
2008-2009 784.99 105.04 7.47
2009-2010 782.3 91.74 8.53
2010-2011 906.35 332.28 2.73
Graph showing Current ratio for the years
The table 4.1 shows the current ratio during the years 2007 to 2011. Current ratio has
shown a decreasing trend from 2007 to 2011. Though there was a slight increase in
2010 to 8.5 from 7.47 in 2009, the rate was less than the rate in 2007 which was
19.01. The optimal current ratio is 2:1.
pay off current liabilities. Usually, current assets should be twice of current liabilities.
Excessive current assets indicate idleness of working capital and shortage of funds
indicates the absence of liquidity. The current ratio of Geodesic ltd. has never reached
the ideal level except on 2011. And the ratio was 2.73:1. Though steps must be taken
by the firm for improving its short
shown a decreasing trend.
2. QUICK RATIO
Quick ratio, also known as Acid Test or Liquid ratio, is a more rigorous test of
liquidity than the current ratio. Quick ratio may be defined as the relationship between
quick or liquid assets and current or
most liquid Assets.
31
Figure 4.1
Graph showing Current ratio for the years March 2007to March
CURRENT RATIO
Source – Table 4.1
The table 4.1 shows the current ratio during the years 2007 to 2011. Current ratio has
shown a decreasing trend from 2007 to 2011. Though there was a slight increase in
2010 to 8.5 from 7.47 in 2009, the rate was less than the rate in 2007 which was
The optimal current ratio is 2:1. There should be sufficient current assets to
pay off current liabilities. Usually, current assets should be twice of current liabilities.
Excessive current assets indicate idleness of working capital and shortage of funds
indicates the absence of liquidity. The current ratio of Geodesic ltd. has never reached
the ideal level except on 2011. And the ratio was 2.73:1. Though steps must be taken
by the firm for improving its short-term liquidity position as the current ratio
shown a decreasing trend.
Quick ratio, also known as Acid Test or Liquid ratio, is a more rigorous test of
liquidity than the current ratio. Quick ratio may be defined as the relationship between
quick or liquid assets and current or liquid liabilities. Cash in hand and at bank are the
0
5
10
15
20
2007 2008 2009 2010 2011
March 2011
The table 4.1 shows the current ratio during the years 2007 to 2011. Current ratio has
shown a decreasing trend from 2007 to 2011. Though there was a slight increase in
2010 to 8.5 from 7.47 in 2009, the rate was less than the rate in 2007 which was
There should be sufficient current assets to
pay off current liabilities. Usually, current assets should be twice of current liabilities.
Excessive current assets indicate idleness of working capital and shortage of funds
indicates the absence of liquidity. The current ratio of Geodesic ltd. has never reached
the ideal level except on 2011. And the ratio was 2.73:1. Though steps must be taken
term liquidity position as the current ratio has
Quick ratio, also known as Acid Test or Liquid ratio, is a more rigorous test of
liquidity than the current ratio. Quick ratio may be defined as the relationship between
liquid liabilities. Cash in hand and at bank are the
32
Quick ratio is calculated using the formula:
Quick or Liquid assets
Current liabilities
Quick assets = Current assets- (inventories + Prepaid expenses)
Table No.-4.2
STATEMENT SHOWING LIQUID RATIO(in crores)
YEAR LIQUID
ASSETS
CURRENT
LIABILITIES
RATIO
(no. of times)
2006-2007 200.15 10.54 18.99
2007-2008 814.5 57.85 14.08
2008-2009 784.6 105.04 7.47
2009-2010 777.04 91.74 8.47
2010-2011 897.16 332.28 2.7
The table 4.9 showing liquidity ratio reveals that the ratio has shown same trend that
current ratio in the table 4.7 has shown. During the year 2008 and 2009, the liquidity
ratio which was 18.99 in 2007 fell down to 14.08 and 7.47 respectively. Afterwards in
2010, though there was an increase to 8.47, it declined to 207 in 2011. As a rule of
convention a ratio of 1:1 is considered satisfactory. A liquidity ratio of 1:1 does not
necessarily mean satisfactory liquidity position if all the debtors cannot be realized
and cash is needed immediately to meet current obligations. In the same manner, a
low liquidity ratio does not necessarily mean a bad liquidity position as inventories
are not absolutely liquid.
Graph showing Quick ratio
B. SOLVENCY RATIOS
1. DEBT-EQUITY RATIO
Debt-equity ratio, also known as External
measure the relative claims of outsiders and the owners (shareholders)
assets. This ratio indicates the relationship between outsiders’ funds and shareholders’
funds. Thus, Debt- Equity ratio is calculated as:
Shareholders’ funds = Equity capital + Preference Capital +
Accumulated Profits + Accumulated Losses
Outsiders’ funds = Debentures + Mortgage Loans + Bonds + Long
10
20
33
Figure 4.2
Graph showing Quick ratio for the years March 2007 to March
QUICK RATIO
Source – Table 4.2
B. SOLVENCY RATIOS
EQUITY RATIO
equity ratio, also known as External- Internal Equity Ratio is calculated to
measure the relative claims of outsiders and the owners (shareholders) against firm’s
assets. This ratio indicates the relationship between outsiders’ funds and shareholders’
Equity ratio is calculated as:
Outsiders’ funds
Shareholders’ funds
Shareholders’ funds = Equity capital + Preference Capital + Reserves and Surplus +
Accumulated Profits + Accumulated Losses
= Debentures + Mortgage Loans + Bonds + Long- term Loans
0
10
20
2007 2008 2009 2010 2011
March 2011
Internal Equity Ratio is calculated to
against firm’s
assets. This ratio indicates the relationship between outsiders’ funds and shareholders’
Reserves and Surplus +
term Loans
34
Table No. - 4.3
STATEMENT SHOWING DEBT-EQUITY RATIO (in crores)
YEAR OUTSIDERS’
FUNDS
SHAREHOLDERS’
FUNDS
RATIO
(no. of times)
2006-2007 .19 320.04 .01
2007-2008 506.79 426.38 1.18
2008-2009 640.97 602.72 1.06
2009-2010 586.93 762.42 .76
2010-2011 614.07 964.23 .63
Debt- equity ratio is calculated to measure the extent to which debt financing has been
used in a business. As a general rule, there should be an appropriate mix of owners’
funds and outsiders’ funds in financing the firms’ assets. Interpretation of this ratio
depends primarily upon the financial policy of the firm and the nature of the business.
Generally speaking, a low ratio is considered as favorable from the Long-term
creditors’ point of view because a high proportion of funds provide a larger margin of
safety for them at the time of liquidation of the firm. But from the perspective of the
owners, a low ratio is unfavorable as it indicates that the firm has not been able to use
low-cost outsiders’ funds to magnify their earnings.
The table 4.9 above showing Debt-equity ratio from 2007 to 2011, projects a
fluctuating trend. The ratio which was .001:1 in 2007 moved upwards to 1.18:1 in
2008 which later showed a sudden decline to 1.06, .76 and .63 in 2009, 2010 and
2011 respectively.
The ratio was satisfactory from outsiders’ point of view and the company in 2007,
2010 and 2011. Because outsiders’ fund was less than owners’ funds in all these years
(low ratio) except in 2008 and 2009 which was favorable to the owners of the
company. In 2008 and 2009 the ratio was not favorable to the firm as it was higher
than the generally accepted norm of 1:1.
Graph showing Debt
2. FUNDED DEBT TO TOTAL CAPITALISATION
This ratio establishes a link between long
long-term funds available in the business. The two words used in this ratio are:
Funded Debt = Debentures + mortgage Loans + Bonds + other long
Total Capitalization = Equity capital + Preference
Funded Debt
This ratio is calculated as,
0.5
1.5
35
Figure 4.3
Graph showing Debt-equity ratio for the years March 2007 to March
DEBT-EQUITY RATIO
Source- Table 4.3
2. FUNDED DEBT TO TOTAL CAPITALISATION
This ratio establishes a link between long-term funds raised from outsiders and total
term funds available in the business. The two words used in this ratio are:
= Debentures + mortgage Loans + Bonds + other long
Total Capitalization = Equity capital + Preference capital + Reserves and Surplus +
This ratio is calculated as, Funded Debt
Total Capitalization
0
0.5
1
1.5
2007 2008 2009 2010 2011
March 2011
funds raised from outsiders and total
term funds available in the business. The two words used in this ratio are:
= Debentures + mortgage Loans + Bonds + other long- term loans
Reserves and Surplus +
36
Table No. 4.4
STATEMENT SHOWING FUNDED DEBT TO TOTAL CAPITALISATION
(In crores)
YEAR FUNDED DEBT TOTAL
CAPITALISATION
RATIO
(%)
2006-2007 0.19 320.23 .1
2007-2008 506.79 933.18 54
2008-2009 640.97 1243.69 51
2009-2010 586.93 1349.35 43
2010-2011 614.07 1578.3 39
A study of this ratio helps us to know how much the company has relied on outside
sources for raising long-term funds. Though there is no ‘Rule of Thumb’ but still the
less the reliance on outsiders’ funds the better it will be. If the ratio is smaller, better
it will be, up to 50% or 55% this ratio may be tolerable and not beyond.
The above table indicates that the portion of Funded Debt in total long-term funds is
satisfactory. Because in all these five years the percentage of Funded Debt in Total
Capitalization is less than 55%. It was least in 2007 (only 1%). Though it increased to
54% in 2008, there was a decline afterwards. The debt financing was at peak in 2008
i.e. 54% which reduced to 39% in 2011.
The ratio which was 1% in 2007 is quite low. It is because the Company hadn’t raised
unsecured loans in 2007 and also the amount of debt raised in all the following years
was low. Hence, there is enough scope for the company to raise long- term loans from
outsiders.
Graph showing funded debt to total capitalization
FUNDED DEBT TO TOTAL CAPITALISATION RATIO
3. PROPRIETARY/ EQUITY RATIO
This ratio also known as Net Worth to total assets ratio is an important ratio for
determining long-term solvency of a firm. Net worth means shareholders’ funds and
total assets on the other hand denote total resources of the concern. The ratio is
calculated as under:
STATEMENT SHOWING EQUITY RATIO
YEAR SHAREHOLDERS’
2006-2007
2007-2008
2008-2009
2009-2010
2010-2011
37
Figure 4.4
ed debt to total capitalization for the years March
2011
FUNDED DEBT TO TOTAL CAPITALISATION RATIO
Source- Table 4.4
RY/ EQUITY RATIO
This ratio also known as Net Worth to total assets ratio is an important ratio for
term solvency of a firm. Net worth means shareholders’ funds and
total assets on the other hand denote total resources of the concern. The ratio is
Shareholders’ funds
Total Assets
Table No.4.5
STATEMENT SHOWING EQUITY RATIO (in crores)
SHAREHOLDERS’
FUNDS
TOTAL ASSETS RATIO
320.04 330.37
426.38 991.02
602.72 1348.73
762.42 1441.09
964.23 1910.58
0
20
40
60
2007 2008 2009 2010 2011
March 2007 to
FUNDED DEBT TO TOTAL CAPITALISATION RATIO
This ratio also known as Net Worth to total assets ratio is an important ratio for
term solvency of a firm. Net worth means shareholders’ funds and
total assets on the other hand denote total resources of the concern. The ratio is
crores)
RATIO
(%)
97
43
45
53
50
The table above showing statement of equity ratio
owners’ funds to total assets. Higher the ratio or the ratio or the share of the
shareholders in the total capital of the company, better is the long
position of the company. This ratio indicates that the extent
company can be lost without affecting the interest of the creditors of the creditors of
the company.
In 2007, the ratio was 97% it is the year in which the ratio was at peak in all the five
years. Then in 2008, the ratio came do
ratio was lowest. In 2009 and 2010, it showed an increasing trend by 45% and 53%
respectively. But it fell down to 50% in 2011. Though the performance was
satisfactory, the company should try to raise equity capit
Graph showing Equity ratio
4. RATIO OF TOTAL LIABILITIES TO TOTAL ASSETS
This ratio indicates the relationship between the Total liabilities to outsiders to
Assets of a firm and can be calculated as follows:
0
20
40
60
80
100
38
The table above showing statement of equity ratio represents the relationship of
owners’ funds to total assets. Higher the ratio or the ratio or the share of the
shareholders in the total capital of the company, better is the long-term solvency
position of the company. This ratio indicates that the extent to which the assets of the
company can be lost without affecting the interest of the creditors of the creditors of
In 2007, the ratio was 97% it is the year in which the ratio was at peak in all the five
years. Then in 2008, the ratio came down to 43% and it was the year in which the
ratio was lowest. In 2009 and 2010, it showed an increasing trend by 45% and 53%
respectively. But it fell down to 50% in 2011. Though the performance was
satisfactory, the company should try to raise equity capital again.
Figure 4.5
Graph showing Equity ratio for the years March 2007 to March
EQUITY RATIO
Source – Table 4.5
ATIO OF TOTAL LIABILITIES TO TOTAL ASSETS
This ratio indicates the relationship between the Total liabilities to outsiders to
Assets of a firm and can be calculated as follows:
Total liabilities to outsiders
Total assets
2007 2008 2009 2010 2011
represents the relationship of
owners’ funds to total assets. Higher the ratio or the ratio or the share of the
term solvency
to which the assets of the
company can be lost without affecting the interest of the creditors of the creditors of
In 2007, the ratio was 97% it is the year in which the ratio was at peak in all the five
wn to 43% and it was the year in which the
ratio was lowest. In 2009 and 2010, it showed an increasing trend by 45% and 53%
respectively. But it fell down to 50% in 2011. Though the performance was
March 2011
This ratio indicates the relationship between the Total liabilities to outsiders to Total
STATEMENT SHOWING
YEAR
2006-2007
2007-2008
2008-2009
2009-2010
2010-2011
The above table representing Solvency ratio explains that the total liabilities forms 1%
of total resources of the firm in 2007, which increased to 51% in 2008. But there was
a decline in 2009, 2010 and 2011 by 48%, 41% and 32% respectively. The ratio was
at its maximum in 2008 i.e. 51%. Generally, lower the ratio of total liabilities to total
assets is considered as favorable to the long
was most satisfactory only in 2007. Hence, the company should try again to redu
liabilities to outsiders.
Graph showing Solvency Ratio
20
40
60
39
Table No.4.6
STATEMENT SHOWING SOLVENCY RATIO (in crores)
TOTAL
LIABILITIES TO
OUTSIDERS
TOTAL
ASSETS
10.73 330.77
564.64 991.02
746.01 1348.73
678.67 1441.09
946.35 1910.58
The above table representing Solvency ratio explains that the total liabilities forms 1%
of total resources of the firm in 2007, which increased to 51% in 2008. But there was
a decline in 2009, 2010 and 2011 by 48%, 41% and 32% respectively. The ratio was
at its maximum in 2008 i.e. 51%. Generally, lower the ratio of total liabilities to total
assets is considered as favorable to the long-term solvency position. Hence, the ratio
was most satisfactory only in 2007. Hence, the company should try again to redu
Figure 4.6
Graph showing Solvency Ratio for the years March 2007 to March
SOLVENCY RATIO
Source – Table 4.6
0
20
40
60
2007 2008 2009 2010 2011
(in crores)
RATIO
(%)
3
57
55
47
50
The above table representing Solvency ratio explains that the total liabilities forms 1%
of total resources of the firm in 2007, which increased to 51% in 2008. But there was
a decline in 2009, 2010 and 2011 by 48%, 41% and 32% respectively. The ratio was
at its maximum in 2008 i.e. 51%. Generally, lower the ratio of total liabilities to total
term solvency position. Hence, the ratio
was most satisfactory only in 2007. Hence, the company should try again to reduce
March 2007 to March 2011
40
5. FIXED ASSETS TO NETWORTH RATIO
This ratio establishes the relationship between fixed assets and shareholders’ funds.
The ratio is calculated as follows:
Fixed assets after depreciation
Shareholders’ funds
Table No.4.7
STATEMENT SHOWING FIXED ASSETS TO NETWORTH RATIO (in
crores)
YEAR FIXED ASSETS SHAREHOLDERS’
FUNDS
RATIO
(%)
2006-2007 56.58 320.04 18
2007-2008 67.64 426.38 16
2008-2009 62.86 602.72 10
2009-2010 59.86 762.42 8
2010-2011 104.41 964.23 11
The table below representing the ratio of fixed assets to net worth indicates the extent
to which shareholders’ funds are sunk into the fixed assets. Generally, the purchase of
fixed assets should be financed by shareholders’ equity. If the ratio is less than 100%,
it implies that owners’ funds are more than total fixed assets and a part of working
capital is provided by the shareholders. And if vice versa, it implies that owners’
funds are not sufficient to finance the fixed assets and the firm has to depend upon
outsiders to finance the fixed assets. From the table above it is understood that the rate
have shown a decline to 2010 from 18% in 2007 to 8% in 2010. Though there was an
increase of 11% in 2011, it was less than the rate of 2007. Anyhow, since, the ratio is
less than 100%, we can say that the owners’ funds is more than fixed assets and a part
of working capital is also financed by shareholders’ funds. That means, the company
does not need to depend on debt financing for purchasing fixed assets.
Graph showing fixed assets to net worth ratio of
FIXED ASSETS TO NET WORTH RATIO
6. FIXED ASSETS RATIO
It is a variant to fixed assets to net worth ratio which is calculated
STATEMENT SHOWING FIXED ASSETS RATIO
YEAR FIXED ASSETS
2006-2007
2007-2008
2008-2009
2009-2010
2010-2011
The above table indicates the extent to which the total of fixed assets is financed by
long-term funds of the firm. Generally, the ratio should be 100. But if the fixed
0
2
4
6
8
10
12
14
16
18
41
Figure 4.7
Graph showing fixed assets to net worth ratio of for the years March
2011
FIXED ASSETS TO NET WORTH RATIO
Source – Table 4.7
ASSETS RATIO
It is a variant to fixed assets to net worth ratio which is calculated as:
Fixed assets after depreciation
Long term funds
Table No. 4. 8
STATEMENT SHOWING FIXED ASSETS RATIO
FIXED ASSETS LONG-TERM
FUNDS
RATIO (%)
56.58 320.23
67.64 933.17
62.86 1243.69
59.86 1349.35
104.41 1578.3
The above table indicates the extent to which the total of fixed assets is financed by
term funds of the firm. Generally, the ratio should be 100. But if the fixed
0
2
4
6
8
10
12
14
16
18
2007 2008 2009 2010 2011
March 2007 to
RATIO (%)
18
7
5
4
7
The above table indicates the extent to which the total of fixed assets is financed by
term funds of the firm. Generally, the ratio should be 100. But if the fixed assets
exceed the total long-term funds, it implies that the firm ha
assets out of current funds or the working capital which is not a good financial policy.
The table shows that the trend of fixed assets to long
2007 to 2010, from18% to 4%.
rate of 2007. However, not only the fixed assets requirements but also a part of
working capital is met out from the long
ratio of fixed asset is much less than 100%, t
investments in fixed assets, as increase in
of the concern.
Graph showing fixed assets ratio of
C. GENERAL PROFITABILITY RATIOS
1. OPERATING PROFIT RATIO
This ratio indicates the portion remaining out of every rupee worth of sales after all
operating costs and expenses have been met. This ratio is calculated by dividing
operating profit by net sales or income from operations.
Operating Profit = Operating Income
Operating Profit Ratio = Operating Profit
42
term funds, it implies that the firm has financed a part of fixed
of current funds or the working capital which is not a good financial policy.
The table shows that the trend of fixed assets to long-term funds is declining from
18% to 4%. Though it increased to 7% in 2011, it was less than the
However, not only the fixed assets requirements but also a part of
working capital is met out from the long-term funds of the company. But since the
ratio of fixed asset is much less than 100%, the company has to make more
investments in fixed assets, as increase in fixed assets means increase in the solvency
Figure 4.8
Graph showing fixed assets ratio of for the years March 2007 to March
FIXED ASSETS RATIO
Source – Table 4.8
PROFITABILITY RATIOS
1. OPERATING PROFIT RATIO
This ratio indicates the portion remaining out of every rupee worth of sales after all
operating costs and expenses have been met. This ratio is calculated by dividing
sales or income from operations.
Operating Profit = Operating Income – Operating Cost
Operating Profit Ratio = Operating Profit
Income from operations
0
5
10
15
20
2007 2008 2009 2010 2011
s financed a part of fixed
of current funds or the working capital which is not a good financial policy.
term funds is declining from
increased to 7% in 2011, it was less than the
However, not only the fixed assets requirements but also a part of
term funds of the company. But since the
he company has to make more
fixed assets means increase in the solvency
March 2011
This ratio indicates the portion remaining out of every rupee worth of sales after all
operating costs and expenses have been met. This ratio is calculated by dividing
Operating Cost
STATEMENT SHOWING OPERATING PROFIT RATIO
YEAR
2006-2007
2007-2008
2008-2009
2009-2010
2010-2011
From the table it is understood that
from 2007 to 2011. The ratio which was 68.82% in 2007 fell to 61.32%, 54.91%,
54.39% and 47.04% in 2008, 2009, 2010 and 2011 respectively. Generally, higher the
operating profit ratio, the better is the pro
downwards. It implies the company has to take steps to improve the situation.
Graph showing operating profit ratio of
2. NET PROFIT RATIO
The net profit ratio establishes a relationship between Net Profit after Taxes and
Sales, and indicates the efficiency of the management in manufacturing, selling,
administrating and other activities of the firm. This ratio is the overall
profitability and is calculated
43
Table No. 4.9
STATEMENT SHOWING OPERATING PROFIT RATIO (in crores)
OPERATING
PROFIT
INCOME FROM
OPERATIONS
113.62 165.09
156.66 255.46
271.18 493.79
265.04 487.27
315.84 671.43
From the table it is understood that the operating profit has shown a declining trend
from 2007 to 2011. The ratio which was 68.82% in 2007 fell to 61.32%, 54.91%,
54.39% and 47.04% in 2008, 2009, 2010 and 2011 respectively. Generally, higher the
operating profit ratio, the better is the profitability. But here the rate has gone
downwards. It implies the company has to take steps to improve the situation.
Figure 4.9
Graph showing operating profit ratio of for the years March 2007 to
OPERATING PROFIT RATIO
Source – Table 4.9
NET PROFIT RATIO
The net profit ratio establishes a relationship between Net Profit after Taxes and
Sales, and indicates the efficiency of the management in manufacturing, selling,
administrating and other activities of the firm. This ratio is the overall measure of the
profitability and is calculated as:
0
20
40
60
80
2007 2008 2009 2010 2011
(in crores)
RATIO (%)
68.82
61.32
54.91
54.39
47.04
the operating profit has shown a declining trend
from 2007 to 2011. The ratio which was 68.82% in 2007 fell to 61.32%, 54.91%,
54.39% and 47.04% in 2008, 2009, 2010 and 2011 respectively. Generally, higher the
fitability. But here the rate has gone
downwards. It implies the company has to take steps to improve the situation.
2007 to March 2011
The net profit ratio establishes a relationship between Net Profit after Taxes and
Sales, and indicates the efficiency of the management in manufacturing, selling,
measure of the
44
Net Profit Ratio = Net Profit after Tax
Income from Operations
Table No. 4.10
STATEMENT SHOWING NET PROFIT RATIO (in crores)
YEAR NET PROFIT
AFTER TAX
INCOME FROM
OPERATIONS
RATIO (%)
2006-2007 94.34 165.09 57
2007-2008 110.37 255.46 43
2008-2009 191.41 493.79 39
2009-2010 174.88 487.27 36
2010-2011 234.64 671.43 35
The two basic elements of the ratio are net profits and sales. The net profits are
obtained after deducting income tax. The ratio is very useful as if the profit is not
sufficient, the firm shall not be able to achieve a satisfactory return on its investment.
This ratio also indicates the firm’s capacity to face adverse economic conditions such
as price competition, low demand etc. Obviously, higher the ratio better is the
profitability. The table representing the net profit ratio indicates a decreasing trend.
The ratio was at peak in 2007 at 57% which fell down to 43% in 2008, 39% in 2009,
36% in 2010 and 35% in 2011. It means the profitability of the concern has heavily
deteriorated in 2011 when compared to all other years. The company has to be very
conscious in coming future to recover the prosperity at least in 2007.
Graph showing operating profit ratio of
D. OVERALL PROFITABILITY RATIOS
1. RETURN ON NET WORTH
Return on shareholders’ investment, popularly known as Return on Investment, is the
relationship between net profits after interest and tax and the proprietors’ funds.
profit after interest and tax is taken only because
available to shareholders. This ratio is one of the most important ratios used for
measuring the overall efficiency of a firm. As this ratio reveals how well the resources
of a firm are being used. Higher the ratio better ar
Thus:
Return on Net Worth
45
Figure 4.10
Graph showing operating profit ratio of for the years 2007 to 2011
NET PROFIT RATIO
Source – Table 4.10
D. OVERALL PROFITABILITY RATIOS
1. RETURN ON NET WORTH
on shareholders’ investment, popularly known as Return on Investment, is the
relationship between net profits after interest and tax and the proprietors’ funds.
profit after interest and tax is taken only because those will be the only profits
available to shareholders. This ratio is one of the most important ratios used for
measuring the overall efficiency of a firm. As this ratio reveals how well the resources
of a firm are being used. Higher the ratio better are the results.
= Net Profit (after interest and tax)
Share holders’ funds
0
10
20
30
40
50
60
2007 2008 2009 2010 2011
for the years 2007 to 2011
on shareholders’ investment, popularly known as Return on Investment, is the
relationship between net profits after interest and tax and the proprietors’ funds. Net
those will be the only profits
available to shareholders. This ratio is one of the most important ratios used for
measuring the overall efficiency of a firm. As this ratio reveals how well the resources
46
Table No. 4.11
STATEMENT SHOWING RETURN ON NET WORTH (in crores)
YEAR NET PROFIT SHARE
HOLDERS’
FUNDS
RATIO (%)
2006-2007 94.34 320.04 29
2007-2008 110.37 426.38 26
2008-2009 191.41 602.72 32
2009-2010 174.88 762.42 23
2010-2011 234.64 964.23 24
The above table showing return on net worth explains that the ratio has shown a
fluctuating trend. The ratio which was 29% in 2007 fell to 26% in 2008 which later
became 32% in 2009.
There was a tremendous decline to 23% in 2010. Though there was a further increase
in 2011, it was only by 1% i.e. 24%. The company has much to improve.
Figure 4.11
Graph showing return on net worth ratio of for the years March 2007 to March
2011
RETURN ON NET WORTH
Source – Table 4.11
0
5
10
15
20
25
30
35
2007 2008 2009 2010 2011
47
2. EARNINGS PER SHARE
EPS is a small variation of return on equity capital and is calculated by dividing the
net profit after taxes and preference dividend by total number of equity shares. Thus,
Earnings per Share = Net Profit after Tax – Preference Dividend
Number of Equity Shares
Table No. 4.12
STATEMENT SHOWING EARNINGS PER SHARE (in crores)
YEAR NET PROFIT
AFTER TAX AND
DIVIDEND
NUMBER OF
EQUITY
SHARES
RATIO
(Rs.)
2006-2007 94.34 5.9165 15.94
2007-2008 110.37 9.2153 11.97
2008-2009 191.41 9.2215 20.75
2009-2010 174.88 9.2244 18.95
2010-2011 234.64 9.0141 26.03
The EPS is a good measure of profitability. Preference dividend is deducted from net
profit after interest and tax to find out the net income available for equity
shareholders. The performance and prospects of the company are affected by EPS.
EPS calculated for a number of years indicate whether or not earnings power of the
company has increased or not.
The table above explains that the EPS for the last five years has shown a fluctuating
trend. EPS which was Rs. 15.94 in 2007 dropped to Rs. 11.97 in 2008 which again
increased to Rs. 20.75 in 2009. But there was a fall in 2010 to Rs. 18.95 which
increased to Rs. 26.03 in 2011. EPS was at peak in this year.
48
Figure 4.12
Graph showing Earnings per Share of for the years March 2007 to March 2011
EARNINGS PER SHARE
Source – Table 4.12
3. RETURN ON CAPITAL EMPLOYED
Return on capital employed establishes the relationship between profits and the
capital employed. It is the primary ratio and is most widely used to measure the
overall profitability and efficiency of the business. There are three classifications
given to capital employed:
A).Gross Capital Employed = Fixed Assets + Current Assets
B). Net Capital Employed = Total Assets – Current Liabilities
C). Proprietors’ Capital Employed = Fixed Assets + Current Assets – Outsiders’
liabilities
Return on Net Capital Employed = Profit before Interest and Tax
Net Capital Employed
0
5
10
15
20
25
30
2007 2008 2009 2010 2011
49
Table No. 4.13
STATEMENT SHOWING RETURN ON CAPITAL EMPLOYED (in crores)
YEAR NET
PROFITBEFORE
INTEREST AND
TAX
NET CAPITAL
EMPLOYED
RATIO (%)
2006-2007 119.99 320.23 37
2007-2008 168.6 933.18 18
2008-2009 291.35 1243.69 23
2009-2010 272.39 1349.36 20.1
2010-2011 322.29 1578.3 20.4
The owners are interested in knowing the profitability of the business in relation to
amounts invested in it. A high percentage of return on capital employed will satisfy
the owners that their money is profitably utilized.
From the table above it is understood that the trend of the return on capital employed
is highly fluctuating. The trend which was 37% in 2007 fell to 18% which increased
to 23% in 2009. But the rate again dropped down to 20.1% which later in 2011
showed a slight increase to 20.4%. Rate was at peak in 2007 (37%) and lowest in
2008 (18%).
Figure 4.13
Graph showing Return on capital employed for the years March 2007 to 2011
RETURN ON CAPITAL EMPLOYED
Source – Table 4.13
0
10
20
30
40
2007 2008 2009 2010 2011
50
4. DIVIDEND PAY- OUT RATIO
Dividend payout ratio is calculated to find the extent to which Earnings per Share
have been retained in the business. It is an important ratio because ploughing back of
profits enables a company to grow and pay more dividends in future.
Pay- out Ratio = Dividend per Equity Share
Earnings per Share
Table No. 4.14
STATEMENT SHOWING DIVIDEND PAY-OUT RATIO (in Rs.)
YEAR DIVIDEND PER
EQUTY SHARE
EPS RATIO (%)
2006-2007 .4 15.94 2.5
2007-2008 .6 11.97 5
2008-2009 1.6 20.75 8
2009-2010 1.75 18.95 9
2010-2011 2.75 26.03 11
Pay-out ratio is very important from shareholders’ point of view, as it tells him that if
a company has used wholly or substantially the whole of its earnings for paying
dividend and retained nothing for future growth ad expansion purposes, then there
will be very dim chances of capital appreciation in the price of shares of such
company. In other words, an investor who is more interested in capital appreciation
must look for a company having low pay-out ratio.
The table above showing pay-out ratio shows an increasing trend. The rate which was
2.5% in 2007 increased to 11% in 2011. It means there is less chance for capital
appreciation, because the payment of dividend is low.
Graph showing Dividend pay
E. LEVERAGE RATIOS
1. CAPITAL GEARING RATIO
The term ‘capital gearing’ is used to describe the relationship between equity share
capital including reserves and surplus to preference share capital and other
interest bearing loans. If preference share capital and other fixed interest bearing loans
exceed the equity share capital and including reserves, the firm is said to be highly
geared and if vice versa, the firm is said to be in low gear.
Capital Gearing Ratio = Equity Share capital + Reserves and surplus
Capital Gearing Ratio = Fixed Income Bearing Funds
0
2
4
6
8
10
12
51
Figure 4.14
Graph showing Dividend pay-out ratio for the years March 2007 to
DIVIDEND PAY-OUT RATIO
Source – Table 4.14
LEVERAGE RATIOS
1. CAPITAL GEARING RATIO
The term ‘capital gearing’ is used to describe the relationship between equity share
capital including reserves and surplus to preference share capital and other
interest bearing loans. If preference share capital and other fixed interest bearing loans
exceed the equity share capital and including reserves, the firm is said to be highly
geared and if vice versa, the firm is said to be in low gear.
aring Ratio = Equity Share capital + Reserves and surplus
Preference Share Capital + Long-Term
Debt bearing fixed interest
Capital Gearing Ratio = Fixed Income Bearing Funds
Total Capital Employed
0
2
4
6
8
10
12
2007 2008 2009 2010 2011
2007 to March 2011
The term ‘capital gearing’ is used to describe the relationship between equity share
capital including reserves and surplus to preference share capital and other fixed
interest bearing loans. If preference share capital and other fixed interest bearing loans
exceed the equity share capital and including reserves, the firm is said to be highly
aring Ratio = Equity Share capital + Reserves and surplus
STATEMENT SHOWING CAPITAL GEARING RATIO
YEAR
CAPITAL &
RESERVES
2006-2007
2007-2008
2008-2009
2009-2010
2010-2011
The table representing capital gearing ratio explains that the company was low geared
in 2007, 2010 and 2011, and the ratio was 163:1, 1.3:1 and 1.6:1 respectively. In 2008
and 2009, the company was in high gear i.e. .87:1 and .96:1.
Graph showing Capital gearing rat
52
Table No. 4.15
STATEMENT SHOWING CAPITAL GEARING RATIO (in crores)
EQUITY
CAPITAL &
RESERVES
PREFERENCE
CAPITAL &
LONG-TERM
DEBT
(NO. OF TIMES)
300.8 1.84
439.36 506.79
614.07 640.97
770.36 586.93
969.32 614.07
capital gearing ratio explains that the company was low geared
in 2007, 2010 and 2011, and the ratio was 163:1, 1.3:1 and 1.6:1 respectively. In 2008
and 2009, the company was in high gear i.e. .87:1 and .96:1.
Figure 4.15
Graph showing Capital gearing ratio for the years March 2007 to March
CAPITAL GEARING RATIO
Source – Table 4.15
0
100
200
2007 2008 2009 2010 2011
(in crores)
RATIO
(NO. OF TIMES)
163
.87
.96
1.3
1.6
capital gearing ratio explains that the company was low geared
in 2007, 2010 and 2011, and the ratio was 163:1, 1.3:1 and 1.6:1 respectively. In 2008
March 2011
53
Table
No.
4.16
COMPARATIVE
BALANCE
SHEET
(ASSETS
SIDE)
(in
crores)
Year
&
Change
Assets
March
2007
Change
in
(%)
March
2008
Change
in
(%)
March
2009
Change
in
(%)
March
2010
Change
in
(%)
March
2011
Fixed
assets
56.58
19.5
67.64
-7.1
62.86
-4.8
59.86
74.4
104.41
Capital
work-
in-
progress
33.86
93.9
65.64
12.6
73.94
14.9
84.94
-66
28.86
Investments
40.08
3.5
41.47
930
426.94
20.4
514
69.4
870.96
Current
assets,
loans
&
advances
200.25
308
816.28
3.83
784.99
-.34
782.3
15.86
906.35
Miscellaneous
expenses
1.72
762
14.82
-23.4
11.35
-30
7.94
-35.89
5.09
54
Table
No.
4.17
COMPARATIVE
BALANCE
SHEET
(LIABILITIES
SIDE)
(in
crores)
Year
&
Change
Liabilities
March
2007
Change
in
%
March
2008
Change
in
%
March
2009
Change
in
%
March
2010
Change
in
%
March
2011
Equity
share
capital
31.14
-35
20.27
-9
18.44
.05
18.45
-2.28
18.03
Preference
share
capital
1.65
_
_
_
_
_
_
_
_
Reserves
and
surplus
288.97
45.67
420.93
41.5
595.63
26.24
751.91
26.5
951.29
Secured
loans
.19
-36.8
.12
-66.67
.04
-75
.01
700
.08
Unsecured
loans
_
_
506.67
26.65
640.93
-8.43
586.92
4.61
613.99
Current
liabilities
10.54
448.86
57.85
81.57
105.04
-12.66
91.74
262
332.28
55
INTERPRETATION
While interpreting the comparative balance sheet, the interpreter is expected to study the
following aspects:
1. Current financial position and the liquidity position
2. Long-term financial position
3. Profitability of the concern
The comparative balance sheet analysis of the past five years from 2007 to 2011 reveals
that, the changes in the balance sheet items has shown an uneven movement. From a
close view into the statement it is understood that, the net working capital has shown a
tremendous increase by Rs. 568.72 Crores in the year 2008. But it fell down by Rs.
78.48 Crores in 2009. Though there was a slight increase in 2010 by Rs. 10.61 Crores,
the decline was at peak in 2011 i.e. 116.49 Crores. This is understood by the analysis of
current assets and current liabilities. Working capital is the excess of current assets over
current liabilities. An increase in working capital indicates the improvement in the
current financial position of the business. Comparative analysis carried out reveals that,
in the case of current assets, the rate increased by 308% in 2008 and it was the year in
which the rate of increase in current assets was at peak. In the following year too there
was an increase but at a lesser rate by 3.83%. Despite of increase in the previous years,
the same declined by 34% in 2010 and the year 2011 showed a slight increase in the rate
by 15.86%.
In the case of current liabilities too there was an increase by 81.57% in 2009, though at a
lesser rate. The rate later fell down by 12.66% in 2010. In spite of all these, there was a
stunning increase in the rate by 262% in 2011 which turned unfavorable.
The long-term financial position of the concern can be analyzed by studying the changes
in fixed assets, long-term liabilities and share capital. Fixed assets are generally financed
by the issue of either long-term securities or fresh share capital. The comparative
statement explains that, there was a stunning increase in long-term securities and share
capital which was 4265% in 2008. But the increase was only 26% in 2009. Later the
funds fell down by 85 in 2010. And though there was an increase in 2011, it was only by
56
4.4%. At the same time, there was an increase in fixed assets by 19.5% and 74.4% in
2008 and 2011 respectively. In the years between i.e. 2009 and 2010, there was a decline
in investment in fixed assets by 7.1% and 4.8%. The increase was at peak in 2011 and the
decline was on the top in 2009. It confirms that, not only fixed assets but also a part of
working capital is financed through long-term sources in the years 2008 and 2009. It is
because long-term funds increase exceeds the increase in fixed assets. Where as in 2010
and 2011, since the increase in fixed assets is more than increase in long-term funds, it is
understood that fixed assets have not only been financed from long-term sources but a
part of the same has been financed from working capital. But it is not a wise financial
policy. One more important thing is that, the company has financed major part of long-
term funds through the issue of share capital except in 2011. In that year long-term funds
were given preference.
When the aspect of profitability is concerned, we have to study about the increase or
decrease in the retained earnings and other reserves. The statement projects that, the
reserves of the company has never declined. That means major part of the earnings of the
company has been kept as retained earnings for future expansion and development
purposes. This is understood from the ratio analysis of dividend pay-out.
The capital work-in-progress increased by 93.9% in 2008, 12.6% in 2009 and 14.9% in
2010. Though the capital work-in-progress increased at a decreased rate 2009 and 2010,
the rate in 2010 was higher when compared to the rate in 2009.Unfortunately the rate
declined by 66% in 2011.
The rate of investment never declined in all these five years. The increase in the rate was
at peak in 2009i.e. 930% when compared to 2008. But increase in the rate was only
20.4% in 2010.
There is nothing much to explain about miscellaneous expenses or preliminary expenses
as they cannot be considered as assets as they are actually deferred expenses.
57
Table
No.
4.18
TREND
BALANCE
SHEET
(ASSETS
SIDE)
(in
crores)
Year
&
Change
Assets
March
2007
Change
(%)
March
2008
Change
(%)
March
2009
Change
(%)
March
2010
Change
(%)
March
2011
Change
(%)
Fixed
assets
56.58
100
67.64
120
62.86
111
59.86
106
104.41
185
Work-in
progress
33.86
100
65.64
194
73.94
218
84.94
251
28.86
85
Investments
40.08
100
41.47
103
426.94
1065
514
1282
870.96
2173
Current
assets
200.25
100
816.28
408
784.99
392
782.3
391
906.35
453
Miscellaneous
expenses
1.72
100
14.82
862
11.35
660
7.94
462
5.09
296
58
Table
No.
4.19
TREND
BALANCE
SHEET
(LIABILITIES
SIDE)
(in
crores)
Year
&
Change
Liabilities
March
2007
Change
(%)
March
2008
Change
(%)
March
2009
Change
(%)
March
2010
Change
(%)
March
2011
Change
(%)
Equity
capital
31.14
100
20.27
65
18.44
59
18.45
59
18.03
58
Preference
capital
1.65
100
_
_
_
_
_
_
_
_
Reserves
and
Surplus
288.97
100
420.93
146
595.63
206
751.91
260
951.29
329
Secured
loans
.19
100
.12
63
.04
21
.01
5
700
42
Unsecured
loans
_
100
506.67
_
640.93
127
586.92
116
613.99
121
Current
liabilities
10.54
100
57.85
549
105.04
997
91.74
870
332.28
3153
59
INTERPRETATION
The trend analysis of Balance sheet reveals that the current assets showed a decrease
from 2008 to 2010 when compared to the base year 2007. Current assets which were
407.6% in 2008 fell to 390.6%. On the other hand, current liabilities showed a decrease
only in 2010(870.4%). In 2011, the same acquired a tremendous increase to 3152.6%
which is more than the increase in current assets.
Share capital projected a decreasing trend. While reserves and investments projected an
increasing trend. The trend of fixed assets was uneven. It decreased to 111% in 2009 and
106% in 2010 from 120% in 2008.
Work-in progress registered an increase except in 2011. It fell to 85% in 2011 from 194%
in 2008. Secured loans decreased in 2008, 2009 and 2010 to 63%, 21%, 5% and though
there was an increase in 2011, it was only 42%. Unsecured loans were at peak in
2009(127%). It fell to 116% in 2010 and increased to 121% in 2011.
60
Table
No.
4.20
COMPARATIVE
INCOME
STATEMENT
(in
crores)
Items
2007
Change
in
(%)
2008
Change
in
(%)
2009
Change
in
(%)
2010
Change
in
(%)
2011
Operating
Income
165.09
+55
255.46
+93
493.79
-1.3
487.27
+38
671.43
Operating
Expenses
51.46
+92
98.8
+125
222.62
-0.18
222.23
+60
355.59
OperatingProfit
113.62
+38
156.66
+73
271.18
-2.26
265.04
+19
315.84
Add:
Non-
operating
income
6.37
+87
11.94
+91
22.82
+68
7.36
-11
6.53
Less:
Non-
operating
expense
26.5
+61
42.55
+100
85.11
+17
99.41
-15
84.71
PBT
93.49
+35
126.05
+66
208.89
-17
172.99
+34
237.66
Less:
Tax
-0.89
-19.67
15.68
+11.48
17.48
-110.8
-1.89
-260.3
3.03
NPAT
94.33
+17
110.37
+73
191.41
-8.64
174.88
+34.17
234.63
61
INTERPRETATION OF COMPARATIVE INCOME STATEMENT
Geodesic Ltd .a Technology Company does not engage in trading of retail physical
products. Operating income is taken as sales and operating expenses is taken as cost of
sales. As a first step of Analysis firstly increase or decrease in operating income should
be compared with increase or decrease in operating expenses. An increase in operating
profit will result from the increase in sales/income from operations and control of
operating expenses and vice versa decrease in operating profit. The comparative income
statement presented above reveals that operating income increased by 93% in 2009 which
was only 55% in 2008. At the same time operating expenses also registered an increase
by 125% in 2009 from 92% in 2008. Though the increase in operating expense was more
than the increase in operating income, operating profit also projected an increase to 73%
in 2009.
In the case of non-operating income, the same showed an increase by 91% in 2009 which
was 87% in 2008. Non-operating expenses which were 60% in 2008 increased to 100%.
As a result Profit before Tax also increased by 66% in 2009 from 35% in 2008 was high
profits of 2008 and 2009 didn’t tell.
But the year 2010 was not at all favorable to the company. The fall in operating income
was -1.3% and operating expenses was -0.16%. Fall in operating income was more than
fall in operating expense which was resulted in decline of operating profit by -2.3%.
Similarly the non-operating expense increased by 17% which turned the profit before tax
negative. Though there was a refund of income tax in the year 2010, the Net Profit for the
year declined by -8.6%. This is only due to huge fall in non-operating income and
increase in non-operating expenses. The operating profit of the year 2011 increased by
19% only because of the increase in operating income by 38%. There wasn’t appreciable
increase due to increase in operating expenses which was 60%. Non-operating income
and expenses for the year declining by -11.3% and -15%, PBT increased by 37% only
because the rate of decline of non-operating expense was more than decline in the rate of
non- operating income. Net profit for the year also increased by34%. Though there were
fluctuations in Income Statement, it is understood from the Ratio analysis operating profit
and net profit of the company has shown a decreasing trend from 2007 to2011.
62
CHAPTER- 5
FINDINGS, SUGGESTIONS AND CONCLUSIONS
FINDINGS
Just like a doctor examines his patient by recording his body temperature, blood pressure,
etc. before making his conclusion regarding the illness and before giving his treatment, a
financial analyst analyses the financial statements with various tools of analysis before
commenting upon the financial health or weaknesses of an enterprise. This is essential to
bring out the mystery behind the figures in financial statements.
1. A current ratio equal to or near to the rule of thumb 2:1 i.e. current assets double
the current liabilities is considered to be satisfactory. The idea of having double
the current assets as compared to current liabilities is tom provide for delays and
losses in the realization of current assets. Geodesic Ltd. hasn’t yet reached this
ideal level in all these years except in 2011. The ratio was 2.73:1. But the ratio
hasn’t gone below 2:1.
2. As a rule of thumb, quick ratio of 1:1 is considered satisfactory. It is generally
thought that if quick assets are equal to current liabilities then the concern may be
able to meet its short-term obligations. The study explains that the firm have
more liquid assets than current liabilities and the ratio was lowest in 2011i.e.2.7:1
and peak in 2007 i.e. 18.99:1
3. From the shareholders point of view, a low debt-equity ratio is unfavorable and it
indicates that the firm has not been able to use low-cost outsiders’ funds to
magnify their earnings. And from the perspective of outsiders, a low ratio is
favorable as a high proportion of funds provide larger safety for them during
liquidation. However, the study explains that the ratio was more than the
generally accepted norm of 1:1 in 2008 and 2009.
4. From the analysis of funded debt to total capitalization, it is understood that the
ratio of all the five years is satisfactory as it is less than 55% the maximum ideal
level.
FINANCIAL-ANALYSIS-PERFORMANCE-EVALUATION-OF-GEODESIC-LTD.pdf

More Related Content

Similar to FINANCIAL-ANALYSIS-PERFORMANCE-EVALUATION-OF-GEODESIC-LTD.pdf

Financial management
Financial managementFinancial management
Financial management
Ashim Roy
 
capital budgeting at bsnl
capital budgeting at bsnlcapital budgeting at bsnl
capital budgeting at bsnl
Peda Babu Vadiyala
 
minor project on ratio analysis of "......"
minor project on ratio analysis of "......"minor project on ratio analysis of "......"
minor project on ratio analysis of "......"
Kh Corporate
 
Corporate Finance.pptx
Corporate Finance.pptxCorporate Finance.pptx
Corporate Finance.pptx
Vikash Barnwal
 
A Study on Budgetary Control System conducted at Hassan Cooperative Milk Prod...
A Study on Budgetary Control System conducted at Hassan Cooperative Milk Prod...A Study on Budgetary Control System conducted at Hassan Cooperative Milk Prod...
A Study on Budgetary Control System conducted at Hassan Cooperative Milk Prod...
Projects Kart
 
Working Capital Management
Working Capital ManagementWorking Capital Management
Working Capital ManagementPrakash Rajiv
 
conceptual learning for FM Unit-1-1.pptx
conceptual learning for FM Unit-1-1.pptxconceptual learning for FM Unit-1-1.pptx
conceptual learning for FM Unit-1-1.pptx
ssusera156cd
 
Unit 1-fm-intrduction-1 ppt
Unit 1-fm-intrduction-1 pptUnit 1-fm-intrduction-1 ppt
Managerial Finance introduxtion to the world of finance
Managerial Finance  introduxtion to the world of financeManagerial Finance  introduxtion to the world of finance
Managerial Finance introduxtion to the world of finance
mohamedsafwat23816
 
Business economics
Business economicsBusiness economics
Business economics
Richie Pandey
 
Business economics
Business economicsBusiness economics
Business economics
BADRIRAGHU1
 
financial management objectives & the organization chart of financial management
financial management objectives & the organization chart of financial managementfinancial management objectives & the organization chart of financial management
financial management objectives & the organization chart of financial management
Mohamed Adel
 
Synopsis on financial statement analysis
Synopsis on financial statement analysisSynopsis on financial statement analysis
Synopsis on financial statement analysis
saurabh surve
 
Finacial managment www.it-workss.com
Finacial managment   www.it-workss.comFinacial managment   www.it-workss.com
Finacial managment www.it-workss.com
Varunraj Kalse
 
NATURE & SCOPE OF BUSINESS FINANCEwE.ppt
NATURE & SCOPE OF BUSINESS FINANCEwE.pptNATURE & SCOPE OF BUSINESS FINANCEwE.ppt
NATURE & SCOPE OF BUSINESS FINANCEwE.ppt
socialmedia2022k
 
NATURE & SCOPE OF BUSINESS FINANCEEe.ppt
NATURE & SCOPE OF BUSINESS FINANCEEe.pptNATURE & SCOPE OF BUSINESS FINANCEEe.ppt
NATURE & SCOPE OF BUSINESS FINANCEEe.ppt
socialmedia2022k
 
Financial management
Financial managementFinancial management
Bba project
Bba projectBba project
Bba project
Mitesh Ghiya
 
Financial analysis of eicl
Financial analysis of eiclFinancial analysis of eicl
Financial analysis of eiclAshok G Roy
 

Similar to FINANCIAL-ANALYSIS-PERFORMANCE-EVALUATION-OF-GEODESIC-LTD.pdf (20)

Financial management
Financial managementFinancial management
Financial management
 
capital budgeting at bsnl
capital budgeting at bsnlcapital budgeting at bsnl
capital budgeting at bsnl
 
minor project on ratio analysis of "......"
minor project on ratio analysis of "......"minor project on ratio analysis of "......"
minor project on ratio analysis of "......"
 
Corporate Finance.pptx
Corporate Finance.pptxCorporate Finance.pptx
Corporate Finance.pptx
 
A Study on Budgetary Control System conducted at Hassan Cooperative Milk Prod...
A Study on Budgetary Control System conducted at Hassan Cooperative Milk Prod...A Study on Budgetary Control System conducted at Hassan Cooperative Milk Prod...
A Study on Budgetary Control System conducted at Hassan Cooperative Milk Prod...
 
Working Capital Management
Working Capital ManagementWorking Capital Management
Working Capital Management
 
conceptual learning for FM Unit-1-1.pptx
conceptual learning for FM Unit-1-1.pptxconceptual learning for FM Unit-1-1.pptx
conceptual learning for FM Unit-1-1.pptx
 
Unit 1-fm-intrduction-1 ppt
Unit 1-fm-intrduction-1 pptUnit 1-fm-intrduction-1 ppt
Unit 1-fm-intrduction-1 ppt
 
Managerial Finance introduxtion to the world of finance
Managerial Finance  introduxtion to the world of financeManagerial Finance  introduxtion to the world of finance
Managerial Finance introduxtion to the world of finance
 
Bba 103
Bba 103Bba 103
Bba 103
 
Business economics
Business economicsBusiness economics
Business economics
 
Business economics
Business economicsBusiness economics
Business economics
 
financial management objectives & the organization chart of financial management
financial management objectives & the organization chart of financial managementfinancial management objectives & the organization chart of financial management
financial management objectives & the organization chart of financial management
 
Synopsis on financial statement analysis
Synopsis on financial statement analysisSynopsis on financial statement analysis
Synopsis on financial statement analysis
 
Finacial managment www.it-workss.com
Finacial managment   www.it-workss.comFinacial managment   www.it-workss.com
Finacial managment www.it-workss.com
 
NATURE & SCOPE OF BUSINESS FINANCEwE.ppt
NATURE & SCOPE OF BUSINESS FINANCEwE.pptNATURE & SCOPE OF BUSINESS FINANCEwE.ppt
NATURE & SCOPE OF BUSINESS FINANCEwE.ppt
 
NATURE & SCOPE OF BUSINESS FINANCEEe.ppt
NATURE & SCOPE OF BUSINESS FINANCEEe.pptNATURE & SCOPE OF BUSINESS FINANCEEe.ppt
NATURE & SCOPE OF BUSINESS FINANCEEe.ppt
 
Financial management
Financial managementFinancial management
Financial management
 
Bba project
Bba projectBba project
Bba project
 
Financial analysis of eicl
Financial analysis of eiclFinancial analysis of eicl
Financial analysis of eicl
 

Recently uploaded

The key differences between the MDR and IVDR in the EU
The key differences between the MDR and IVDR in the EUThe key differences between the MDR and IVDR in the EU
The key differences between the MDR and IVDR in the EU
Allensmith572606
 
Enterprise Excellence is Inclusive Excellence.pdf
Enterprise Excellence is Inclusive Excellence.pdfEnterprise Excellence is Inclusive Excellence.pdf
Enterprise Excellence is Inclusive Excellence.pdf
KaiNexus
 
Mastering B2B Payments Webinar from BlueSnap
Mastering B2B Payments Webinar from BlueSnapMastering B2B Payments Webinar from BlueSnap
Mastering B2B Payments Webinar from BlueSnap
Norma Mushkat Gaffin
 
RMD24 | Retail media: hoe zet je dit in als je geen AH of Unilever bent? Heid...
RMD24 | Retail media: hoe zet je dit in als je geen AH of Unilever bent? Heid...RMD24 | Retail media: hoe zet je dit in als je geen AH of Unilever bent? Heid...
RMD24 | Retail media: hoe zet je dit in als je geen AH of Unilever bent? Heid...
BBPMedia1
 
LA HUG - Video Testimonials with Chynna Morgan - June 2024
LA HUG - Video Testimonials with Chynna Morgan - June 2024LA HUG - Video Testimonials with Chynna Morgan - June 2024
LA HUG - Video Testimonials with Chynna Morgan - June 2024
Lital Barkan
 
一比一原版加拿大渥太华大学毕业证(uottawa毕业证书)如何办理
一比一原版加拿大渥太华大学毕业证(uottawa毕业证书)如何办理一比一原版加拿大渥太华大学毕业证(uottawa毕业证书)如何办理
一比一原版加拿大渥太华大学毕业证(uottawa毕业证书)如何办理
taqyed
 
Satta Matka Dpboss Matka Guessing Satta batta Matka 420 Satta 143
Satta Matka Dpboss Matka Guessing Satta batta Matka 420 Satta 143Satta Matka Dpboss Matka Guessing Satta batta Matka 420 Satta 143
Satta Matka Dpboss Matka Guessing Satta batta Matka 420 Satta 143
bosssp10
 
Authentically Social Presented by Corey Perlman
Authentically Social Presented by Corey PerlmanAuthentically Social Presented by Corey Perlman
Authentically Social Presented by Corey Perlman
Corey Perlman, Social Media Speaker and Consultant
 
falcon-invoice-discounting-a-premier-platform-for-investors-in-india
falcon-invoice-discounting-a-premier-platform-for-investors-in-indiafalcon-invoice-discounting-a-premier-platform-for-investors-in-india
falcon-invoice-discounting-a-premier-platform-for-investors-in-india
Falcon Invoice Discounting
 
Kseniya Leshchenko: Shared development support service model as the way to ma...
Kseniya Leshchenko: Shared development support service model as the way to ma...Kseniya Leshchenko: Shared development support service model as the way to ma...
Kseniya Leshchenko: Shared development support service model as the way to ma...
Lviv Startup Club
 
Search Disrupted Google’s Leaked Documents Rock the SEO World.pdf
Search Disrupted Google’s Leaked Documents Rock the SEO World.pdfSearch Disrupted Google’s Leaked Documents Rock the SEO World.pdf
Search Disrupted Google’s Leaked Documents Rock the SEO World.pdf
Arihant Webtech Pvt. Ltd
 
20240425_ TJ Communications Credentials_compressed.pdf
20240425_ TJ Communications Credentials_compressed.pdf20240425_ TJ Communications Credentials_compressed.pdf
20240425_ TJ Communications Credentials_compressed.pdf
tjcomstrang
 
Company Valuation webinar series - Tuesday, 4 June 2024
Company Valuation webinar series - Tuesday, 4 June 2024Company Valuation webinar series - Tuesday, 4 June 2024
Company Valuation webinar series - Tuesday, 4 June 2024
FelixPerez547899
 
Cracking the Workplace Discipline Code Main.pptx
Cracking the Workplace Discipline Code Main.pptxCracking the Workplace Discipline Code Main.pptx
Cracking the Workplace Discipline Code Main.pptx
Workforce Group
 
Premium MEAN Stack Development Solutions for Modern Businesses
Premium MEAN Stack Development Solutions for Modern BusinessesPremium MEAN Stack Development Solutions for Modern Businesses
Premium MEAN Stack Development Solutions for Modern Businesses
SynapseIndia
 
Evgen Osmak: Methods of key project parameters estimation: from the shaman-in...
Evgen Osmak: Methods of key project parameters estimation: from the shaman-in...Evgen Osmak: Methods of key project parameters estimation: from the shaman-in...
Evgen Osmak: Methods of key project parameters estimation: from the shaman-in...
Lviv Startup Club
 
-- June 2024 is National Volunteer Month --
-- June 2024 is National Volunteer Month ---- June 2024 is National Volunteer Month --
-- June 2024 is National Volunteer Month --
NZSG
 
The-McKinsey-7S-Framework. strategic management
The-McKinsey-7S-Framework. strategic managementThe-McKinsey-7S-Framework. strategic management
The-McKinsey-7S-Framework. strategic management
Bojamma2
 
3.0 Project 2_ Developing My Brand Identity Kit.pptx
3.0 Project 2_ Developing My Brand Identity Kit.pptx3.0 Project 2_ Developing My Brand Identity Kit.pptx
3.0 Project 2_ Developing My Brand Identity Kit.pptx
tanyjahb
 
ModelingMarketingStrategiesMKS.CollumbiaUniversitypdf
ModelingMarketingStrategiesMKS.CollumbiaUniversitypdfModelingMarketingStrategiesMKS.CollumbiaUniversitypdf
ModelingMarketingStrategiesMKS.CollumbiaUniversitypdf
fisherameliaisabella
 

Recently uploaded (20)

The key differences between the MDR and IVDR in the EU
The key differences between the MDR and IVDR in the EUThe key differences between the MDR and IVDR in the EU
The key differences between the MDR and IVDR in the EU
 
Enterprise Excellence is Inclusive Excellence.pdf
Enterprise Excellence is Inclusive Excellence.pdfEnterprise Excellence is Inclusive Excellence.pdf
Enterprise Excellence is Inclusive Excellence.pdf
 
Mastering B2B Payments Webinar from BlueSnap
Mastering B2B Payments Webinar from BlueSnapMastering B2B Payments Webinar from BlueSnap
Mastering B2B Payments Webinar from BlueSnap
 
RMD24 | Retail media: hoe zet je dit in als je geen AH of Unilever bent? Heid...
RMD24 | Retail media: hoe zet je dit in als je geen AH of Unilever bent? Heid...RMD24 | Retail media: hoe zet je dit in als je geen AH of Unilever bent? Heid...
RMD24 | Retail media: hoe zet je dit in als je geen AH of Unilever bent? Heid...
 
LA HUG - Video Testimonials with Chynna Morgan - June 2024
LA HUG - Video Testimonials with Chynna Morgan - June 2024LA HUG - Video Testimonials with Chynna Morgan - June 2024
LA HUG - Video Testimonials with Chynna Morgan - June 2024
 
一比一原版加拿大渥太华大学毕业证(uottawa毕业证书)如何办理
一比一原版加拿大渥太华大学毕业证(uottawa毕业证书)如何办理一比一原版加拿大渥太华大学毕业证(uottawa毕业证书)如何办理
一比一原版加拿大渥太华大学毕业证(uottawa毕业证书)如何办理
 
Satta Matka Dpboss Matka Guessing Satta batta Matka 420 Satta 143
Satta Matka Dpboss Matka Guessing Satta batta Matka 420 Satta 143Satta Matka Dpboss Matka Guessing Satta batta Matka 420 Satta 143
Satta Matka Dpboss Matka Guessing Satta batta Matka 420 Satta 143
 
Authentically Social Presented by Corey Perlman
Authentically Social Presented by Corey PerlmanAuthentically Social Presented by Corey Perlman
Authentically Social Presented by Corey Perlman
 
falcon-invoice-discounting-a-premier-platform-for-investors-in-india
falcon-invoice-discounting-a-premier-platform-for-investors-in-indiafalcon-invoice-discounting-a-premier-platform-for-investors-in-india
falcon-invoice-discounting-a-premier-platform-for-investors-in-india
 
Kseniya Leshchenko: Shared development support service model as the way to ma...
Kseniya Leshchenko: Shared development support service model as the way to ma...Kseniya Leshchenko: Shared development support service model as the way to ma...
Kseniya Leshchenko: Shared development support service model as the way to ma...
 
Search Disrupted Google’s Leaked Documents Rock the SEO World.pdf
Search Disrupted Google’s Leaked Documents Rock the SEO World.pdfSearch Disrupted Google’s Leaked Documents Rock the SEO World.pdf
Search Disrupted Google’s Leaked Documents Rock the SEO World.pdf
 
20240425_ TJ Communications Credentials_compressed.pdf
20240425_ TJ Communications Credentials_compressed.pdf20240425_ TJ Communications Credentials_compressed.pdf
20240425_ TJ Communications Credentials_compressed.pdf
 
Company Valuation webinar series - Tuesday, 4 June 2024
Company Valuation webinar series - Tuesday, 4 June 2024Company Valuation webinar series - Tuesday, 4 June 2024
Company Valuation webinar series - Tuesday, 4 June 2024
 
Cracking the Workplace Discipline Code Main.pptx
Cracking the Workplace Discipline Code Main.pptxCracking the Workplace Discipline Code Main.pptx
Cracking the Workplace Discipline Code Main.pptx
 
Premium MEAN Stack Development Solutions for Modern Businesses
Premium MEAN Stack Development Solutions for Modern BusinessesPremium MEAN Stack Development Solutions for Modern Businesses
Premium MEAN Stack Development Solutions for Modern Businesses
 
Evgen Osmak: Methods of key project parameters estimation: from the shaman-in...
Evgen Osmak: Methods of key project parameters estimation: from the shaman-in...Evgen Osmak: Methods of key project parameters estimation: from the shaman-in...
Evgen Osmak: Methods of key project parameters estimation: from the shaman-in...
 
-- June 2024 is National Volunteer Month --
-- June 2024 is National Volunteer Month ---- June 2024 is National Volunteer Month --
-- June 2024 is National Volunteer Month --
 
The-McKinsey-7S-Framework. strategic management
The-McKinsey-7S-Framework. strategic managementThe-McKinsey-7S-Framework. strategic management
The-McKinsey-7S-Framework. strategic management
 
3.0 Project 2_ Developing My Brand Identity Kit.pptx
3.0 Project 2_ Developing My Brand Identity Kit.pptx3.0 Project 2_ Developing My Brand Identity Kit.pptx
3.0 Project 2_ Developing My Brand Identity Kit.pptx
 
ModelingMarketingStrategiesMKS.CollumbiaUniversitypdf
ModelingMarketingStrategiesMKS.CollumbiaUniversitypdfModelingMarketingStrategiesMKS.CollumbiaUniversitypdf
ModelingMarketingStrategiesMKS.CollumbiaUniversitypdf
 

FINANCIAL-ANALYSIS-PERFORMANCE-EVALUATION-OF-GEODESIC-LTD.pdf

  • 1. 1 CHAPTER I INTRODUCTION “In a modern money using economy, finance may be defined as the provision of money at time it is wanted.” The ambitious plans of the businessmen would remain mere dreams unless adequate money is available to convert them into reality. In the early stages of industrial revolution, capital was not much consequent and the financial requirements of businesses were limited. The methods of production were extremely simple and tools and equipments were inexpensive. Labour was more important, relatively than capital. Production could, thus, be termed as ‘Labour intensive’. Under such a set up, finance didn’t pose any big problem. As the time passed, industries grew and production began to be carried on a mass scale for national and international markets. It necessitated the use of huge and complex machineries, very large quantities of raw materials and large number of workers. All these made industry ‘capital intensive’ and capital became the most important factor of production. Finance is required at different stages of business beginning from its formation, expansion extending up to its winding up. The success of every business depends upon the way in which required funds are arranged at the right time, in the right quantity from right sources and at the least cost. All these aspects are covered by financial management. Financial management in simple terms is concerned with three broad decision areas like investment decisions, financing decisions and dividend decisions. In the present day Capitalistic regime the size of business enterprises is increasing resulting into corporate empires empowered with a lot of social and political influence. This makes corporate finance all the more important. Corporate finance is also referred to as Financial Management. Every management aims to utilize its funds is a best possible and profitable way. The success and growth of a firm depends upon adequate return on investment. The investors or shareholders can be attracted by a firm only by maximization of their wealth through the application of principles and procedures as laid down by corporate finance.
  • 2. 2 STATEMENT OF THE PROBLEM To function to create profit and earn goodwill, all businesses needs the financial support. To carry out its operations, they have to procure funds and make optimum utilization of these funds. This calls for sound decisions making specifically when it comes to decision pertaining to finance as all other decisions have financial impact. Financial management is a managerial activity is a separate discipline; it has evolved as a separate body of knowledge but still depends heavily on economics for its theoretical concepts. Besides economic theories, it uses accounting knowledge, mathematical rules, aspects of system analysis and behavioral science for arising financial managers. The subject of financial management is of immense interest to both academicians and practicing managers. Indeed, the emergence of financial management as a separate discipline have increased the scope of Chartered Accountants, Cost and Work Accountants, MBA holders etc. It is even important in our personal life and inevitable in business life. SCOPE AND SIGNIFICANCE OF THE STUDY The study on ‘Financial Analysis and Performance Evaluation of Geodesic Limited’ is carried out to get a clear picture of the company by examining its liquidity, profitability, return on capital employed, earnings per share etc. The performance effectiveness of the company is also analyzed by comparing with past few years. Geodesic is a technology company focused on delivering solutions/products in the field of communication, content management, collaboration and customer management to the enterprise and retail segments. As the company is dealing with software development and hardware products, their main focus is on innovation. The customer base of the company covers major financial institutions, banks, public sector undertakings, multinational companies, broking houses, mutual funds and insurance providers. The company assures that they design and build their products and solutions to help their customers around the world to reduce their communication costs and sales cycles and improve efficiency to grow their businesses. Hence, in the world of innovation, a study on an Electronic Communication Technology Company like Geodesic Limited who serves general public and government is significant from economic point of view.
  • 3. 3 OBJECTIVES OF THE STUDY The main purpose of the study is to examine the financial performance of the ‘Geodesic limited’ for the last five years, with the help of their published financial statements. Through the analysis, the following objectives are accomplished. 1. To assess the profitability, liquidity, solvency and efficiency of the company. 2. To assess the extent of operation and market performance 3. To decide about future prospects of the company 4. To analyze income and expenditure pattern so as to focus its impact on profitability. 5. To calculate various ratios based on their final accounts. METHODOLOGY The proposed in the study is descriptive and analytical in nature. The study is based on secondary data. The secondary data was collected from books, reports and journals. The information so collected has been rearranged in a meaningful manner for the purpose of analysis and interpretation. For analysis and interpretation of data ratios, averages, charts etc. have been used. PERIOD OF THE STUDY The study covers a period of consecutive years from 2006-2007 to 2010-2011. For the purpose of studying the performance of Geodesic Ltd the researchers have used the data for five years commencing from 2006-2007 to 2010-2011. LIMITATIONS OF THE STUDY The study is subject to certain limitations in spite of the care taken in collection, classification and analysis of data, the following limitations are noted. 1. The study has the limitations of accounting ratios. 2. The study was concerned on a single company and no comparison is being made. 3. The study is based only on secondary data. 4. Only financial aspects are studied in detail.
  • 4. 4 5. Financial statements are only interim reports and cannot be final because true profit/loss can be ascertained only when the business is closed down CHAPTERIZATION CHAPTER I- INTRODUCTION The introductory chapter starts with a brief introduction characterizing the importance of finance in a business concern and emergence of financial management as a separate discipline. It is followed by the statement of the problem, scope and significance of the study, objectives of the study, methodology, period of the study and limitations. CHAPTER II – FIANCIAL MANAGEMENT AND A COMPANY PROFILE OF GEODESIC LIMITED An overview of Financial Management and a detailed note on business of Geodesic limited, products they offer to various market segments and operational and financial highlights of the company is given in this chapter. CHAPTER III- FINANCIAL ANALYSIS- A THEORETICAL FRAMEWORK This chapter explains various tools and techniques which are generally used for financial statement analysis to judge about the profitability, liquidity and solvency of a concern. CHAPTER IV – ANALYSIS AND ITERPRETATION OF FINANCIAL STATEMENTS For getting a clear picture of the company’s performance effectiveness and management, the data collected are analyzed in detail making use of the tools such as ratio analysis, comparative statement analysis and trend analysis. CHAPTER V –FINDINGS, SUGGESTIONS AND CONCLUSIONS The chapter deals with the observations during the study and suggestions given by the researchers and conclusions drawn there from.
  • 5. 5 CHAPTER - 2 FINANCIAL MANAGEMENT AND COMPANY PROFILE OF GEODESIC LTD. FINANCIAL MANAGEMENT- AN OVER VIEW Financial Management is an appendage of the finance function with the creation of a complex industrial structure, the function has grown so much that it has given birth to a given subject- Financial Management- which is today recognized as the most important branch of business administration. One cannot think of any business activity in isolation from its financial implications. The management may accept or reject a business proposition on the basis of its financial viabilities. In this connection, Howard and Upton observe: “Financial Management involves the application of general management principles to a particular financial operation”. Financial management is that part of management which is concerned mainly with raising funds in the most economic and suitable manner ; using these funds as profitably as possible; planning future operations and controlling current performances and future developments through financial accounting, cost accounting, budgeting, statistics and other means. Financial Management is dynamic, evolving or making of day to day financial decisions in a business of any size. The old concept of finance as treasurer ship has broadened to include the new, equally meaningful concept of controllership. While the treasurer keeps track of moneys, the controller’s duties extend to planning, analysis and the improvement of every phase of the company’s operations, which are measured with a financial yardstick. OBJECTIVES OF FINANCIAL MANAGEMENT: • Profit Maximization • Wealth Maximization In the former approach, financial decisions are oriented to maximize the profits of EPS of the shareholders. Those actions that increase profits are undertaken and those decrease profits are avoided. Anyhow this objective is suitable only for sole trading
  • 6. 6 concerns where an individual’s capital was employed in anticipation of returns to be enjoyed by him. The latter approach aims to maximize the market value of the shares of the firm. Under this, those decisions which ultimately increase the value of shares, are considered efficient decisions and decisions which result in decline in the share price, are poor decisions. It means the aim of financial management is to maximize the wealth of shareholders, who are the owners of the company. A’S OF FINANCIAL MANAGEMENT It refers to the role played by a financial management in a business enterprise. • Anticipating financial needs • Acquiring financial resources • Allocating fund in a business • Administrating the allocation of funds • Analyzing the performance of funds • Accounting and reporting to the management The link between Economics and Financial Management is close. A study of financial management is likely to be a barren if it is divorced from the study of Economics. Modern financial management concentrates on Micro- economic areas with which a business enterprise has to deal during its day to day operations. FUNCTIONAL AREAS OF FINANCIAL MANAGEMENT Functional areas of financial management are the following: Determining financial needs, determining sources of funds, Financial Analysis, Optimal Capital Structure, Cost Volume Profit Analysis, Profit planning and Control, Fixed assets management, Project planning and evaluation, Capital budgeting, Working capital management, Dividend policies, acquisitions and merger and Corporate taxation.
  • 7. 7 FINANCIAL DECISIONS These are the decisions relating to financial matters of a corporate enterprise. These are areas of financial management, which facilitate a business firm to achieve wealth maximization. • Financial requirement decisions • Investment decisions • Financing decisions • Dividend decisions With technological progress, financial management almost forced to improve its methodology. Such things as cost of capital, optimal capital structure, effects of capital structure upon cost of capital and market value of a firm were incorporated in the subject. Moreover financial management laid emphasis on international business and finance, and showed a serious concern for the effect of multi- naturals upon price level. The discipline of financial management was conditioned by changes in the socio- economic and legal environment. Its emphasis shifted from profitability analysis to cash flow generation; and it developed an interest in internal management procedures and control. Modern financial management however, is basically concerned with optimal matching of uses and sources of corporate funds that lead to the maximization of a firm’s market value. Finance function of a business is closely related to its other functional area. The relationship between accounting and finance is intimate. Charles Gatenberg visualizes the influence of scientific arrangement of records, with the help of which inflow and outflow of funds can be efficiently managed and stocks and bonds can be efficiently marketed. All the accounting tools and control devices, necessary for appraisal of financial policy can be correctly formulated if the accounting data is properly recorded. And hence the finance manager has to depend heavily on the accuracy of the accounting data.
  • 8. 8 COMPANY PROFILE OF GEODESIC LTD OVERVIEW Geodesic company is a technology company focused on delivering solutions in the space of Communication, Content Management, Collaboration and Customer Relationship Management to the enterprise and retail segments. Their innovative products and services, emphasis on substantial cost reductions, and enhanced productivity for the enterprise and retail segments, have lead to improve their earnings and revenues, besides win several global awards. Their mobile products are used by millions of people around 108 countries at the last count. Genesis of Geodesic Limited (Geodesic) was started on 8th July of 1999 as Geodesic Information Systems Private Limited. The Company is an innovator in software products focused on Information, Communication and Entertainment for mobile phones and desktop computers under the 'Mundu' brand name for the retail segment. Headquartered in Mumbai, India, Geodesic's Mundu suite of award-winning products includes solutions for Instant Messaging, Voice-over-IP and Internet Radio. Geodesic has offices in Mumbai and Bangalore in India, USA (Silicon Valley), as well as Sweden, Hong Kong and Singapore. Their mission is to make Content, Communication and Collaboration accessible and truly affordable across networks. This in turn will increase productivity and efficiency. Fun at Work is the mantra at Geodesic. Geodesic is indeed, innovative in practice. MILESTONES Following gives us a summarized picture of the progress of the company Geodesic ltd.: 1999 - On 8th July of 1999, Geodesic Ltd. came into existence as Geodesic Information Systems Pvt. Ltd. 2000 - The company launched Hamarashop.net (E-commerce portal) and Mundu IM (world’s first truly Interoperable Messaging System) 2001 - The company launched Mundu IM on Indiatimes.com. in November.
  • 9. 9 2003 - Launched company’s revolutionary technology ‘IM Around’ 2004 - Won Deolitte Touche Tohmatsu Asia Pacific Technology Fast 500 Award in January and started its operations for the first time in US. 2005 - Established its operations in UK, Hong Kong and Sweden. 2006 - Introduced a mobile VOIP product under the name ‘Mundu Speak’ in March. 2007 - The mobile entertainment product of the company, Mundu Radio had received the ‘CNET Webware 100’ award for the mobile category in June and in August the company designed its product Mundu IM for the iPhone. 2008 - Launched a New Era in Mobile Entertainment with True Internet Radio Access in February and w.e.f. 19th September the company changed its name from Geodesic Information Systems to Geodesic Limited. CUSTOMER BASE OF THE COMPANY They address the following primary segments: ENTERPRISES They provide enterprises with their Unified Communication and Collaboration stack, the CRM module and Content Management System. These modules help Enterprises in reducing their communication costs, enhancing their productivity through collaboration, and reducing their sales cycle through better content analytics/ management and a powerful CRM. TELECOM OPERATORS AND HANDSET MANUFACTURERS They have a deep line that easily adds value to Telcos and Handset Vendors who solely rely on value added services and features they provide to their customers. They bundle their applications on the handsets and are part of the offerings by the Telecom Operators.
  • 10. 10 RETAIL CONSUMERS They provide mobile consumers with products in the space of communication including Mundu IM, Mundu Universal Messenger, Spokn, and Mundu SMS. They offer streaming, live and on- demand content to users through Mundu Radio and Mundu TV. All of their applications are available across multiple platforms including iOS, Androld, Blackberry, Symbian, Java and on Windows and MacOS desktops. In the last quarter they launched Carrom MP- a game based on Physics for iPad. SYSTEM INTEGRATORS AND VALUE ADDED RESELLERS They recognize this as an extremely important segment. They integrate almost all of their products and solutions and reach out to customers not easily accessible by them. GOVERNMENT AND FINANCIAL INSTITUTIONS They provide GeoAmida (hand- held device) based solutions to this segment and on offer are the following solutions: Mahatma Gandhi Rural Employment Guarantee Act, Law Enforcement, Public Distribution Systems, Financial Inclusion and Remote Health Management. Geodesic now have 14 offices worldwide and over 700 employees. While they have invested substantially in innovation and growth, they have managed to extend their competitive advantage, fortified their leadership and retained their work culture. SUBSIDIARIES AND ASSOCIATE COMPANIES SUBSIDIARIES Geodesic and its subsidiaries follow a consistent work ethos with a sprinkling of region or country specific culture added into enhance the fun quotient across Geodesic companies. Geodesic and its subsidiaries reflect their philosophy of innovation, adapt to change and quick response to customer needs. Subsidiaries are: • Chandamama India Ltd. • FilmOrbit.com India Pvt. Ltd. • Geodesic Grid point Energy Pvt. Ltd.
  • 11. 11 The steps- down subsidiaries are: • Geodesic Information Systems Inc, USA • Geodesic Hong Kong Ltd, Hong Kong • Interactive Network International British Virgin Islands • Publicidad Digital SA, Uruguay • Geodesic Technology FZE, Dubai • Emilotto Associated Inc, Panama Other two more companies • Spokn Communications’ Pte. Ltd, Singapore • Zomo Technologies Limited, British Virgin Islands ASSOCIATE COMPANIES ITM Digital Pvt. Ltd was incorporated as a Joint Venture Between ZEE Entertainment Enterprises Ltd and Geodesic Ltd to offer applications for delivery of content to mobile and internet devices through Mundu TV. Due to lack of coordination between ZEEL and Geodesic, on mutual understanding and consent, both the companies decided for the severance of the Joint Venture Agreement. The deed of Cancellation was signed on 18th April, 2011. Their holdings in ITM Digital Pvt. Ltd were transferred to ZEEL as a mark of separation. A step- down subsidiary of Geodesic Ltd is Republique Media Pvt. Ltd. WORK CULTURE Work culture at Geodesic involves challenges, healthy competition, constructive rule breaking and above all, fun. Each employee becomes a part of the Geodesic family, which extends beyond the boundaries of work. High retention has been achieved by continuously upgrading the competencies of the employees. While their focused initiatives at creating work life balances also serves as a powerful tool for increasing retention in addition to other factors such as best pay packages and entrepreneurial work styles. Geodesic’s emphasis on innovation and commitment to cost containment means each employee is a hand- on contributor. There is little in the way of corporate hierarchy
  • 12. 12 and everyone wears several hats. At Geodesic, believe in transparency, flexibility, interaction, integration of thoughts, ideas, culture, values and results across the organization irrespective of the hierarchy. Though growing rapidly Geodesic still maintains a small company feel. Almost everyone eats at the Geodesic café, sitting at the table enjoying conversations with colleagues and friends from various departments. BUSINESS MODELS Geodesic addresses a diverse market segment and have been successful in adopting unique business models for each of their market segments. They include license and support fee, usage fee and revenue share and subscriptions. These are built to help their clients succeed in delivering business value to this enterprise. Their business models are resilient, adapting to the continuously changing market and economic environment. Their business models, supported by the long term financial model, have enabled to deliver strong earnings consistently, cash flows and returns to share holders in changing economic environment. ADMINISTRATION The company comprises of a Supervisory Board of Directors that has an optimum combination of Executive and Non-Executive Directors who have an in depth knowledge and a wealth of experience in running successful business. The Independent Non- Executive Directors bring an external and wider perspective in Board deliberations and decisions in addition to the expertise in their areas of Specialization. ROLE OF BOARD OF DIRECTORS The primary role of Board is that of the trusteeship to protect and enhance shareholders’ value through strategic supervision of the company and its subsidiaries. The board is entrusted with the ultimate responsibility of management, general affairs, direction and performance of the board has been vested with the requisite powers, authorities and duties.
  • 13. 13 Table No. 2.1 DETAILS OF BOARD OF DIRECTORS AS ON 31st March 2011 Name of the Directors Designation Category Mr. Pankaj Kumar Chairman Promoter& Executive director Mr. Kiran Kulkarni MD Director Mr.Prashant Mulekar Executive Director Director Mr. Vinod Seth Director Independent Director Mr. Nitin Potdar Director Independent Director Mr. G Krishnan Director Independent Director AWARDS AND RECOGNITIONS The company describes how valuable their commitment to innovation has been resulted in the growth of the company. It is visible in the range of products they have developed and milestones they have achieved. Following are the awards won by Geodesic Ltd.in the Financial year 2010-2011. • Mundu TV was ranked No.1 in Entertainment Application on the Apple Appstore in the entertainment category and was ranked No. 2 across all categories on the Apple Appstore and in NDTVs ‘ 10 Apps For Every Indian’. • Geoamida won the NASSCOM India Leadership Forum 2010 and its project was nominated for the PC Quest Best IT Implementations in the field of Mobility and Field Force Automation Projects. • Business standard listed Mundu Radio amongst the top 10 Internet radio stations.
  • 14. 14 • Geodesic was ranked amongst Deolitte Technology Fast 50 India 2010 Program and Fast 500 Asia Pacific 2010 Program. • The company was ranked amongst Data Quest Top 200 companies of the Indian IT Industry. KNOWLEDGE MANAGEMENT Knowledge Management at Geodesic allows geodesic minds together the collective experiences and knowledge towards better product delivery, individual and organisational excellence. Their culture resonates with their goals to create an open and transparent organization in which knowledge is created and shared in a supportive environment where creativity and innovation are highly valued Geodesic minds are encouraged to bring forward any idea for improvement or innovation to offer applications for delivery of content to mobile and internet devices through Mundu TV. PRODUCTS AND SERVICES OF GEODESIC LIMITED The retail products of Geodesic Ltd classify into two categories: Communication and Content Management & Delivery. 1).ENTERPRISE PRODUCTS Their Enterprise products have been designed for desktop and mobile platforms that include Continuum, Spyder and .fn suite of products. • Continuum The Unified Communication and Collaboration solution delivers rea- time communication and collaboration services across a powerful contact management module unifying user experience while leveraging an enterprise’s existing IT and telephony infrastructure. Unified Communication, collaboration, Content Analytics and CRM for the Enterprise Market, Portals, Financial Institutions, System Integrators and Value Added Resellers. Continuum is a Unified Communication and Collaboration suite of products combining the capabilities of the enterprise communication framework and sophisticated contact management into a single, powerful solution. Continuum as a concept and as a solution is more relevant to all enterprises as the number
  • 15. 15 of remote workers continues to grow overtime. They have now enhanced Continuum by adding enterprise wide social CRM elements and business continuity tools to add more value to the product. • Spyder An advanced Client Relationship alignment Management System for the complex needs of a financial institution that sells intellectual product manifesting as opinion (backed by research) and it is an ideal solution for Fund Management and Investment Banking. CRM for Financial Institutions, Enterprises, System Integrators and Value Added Resellers. Spyder has been successfully integrated within Continuum to ensure they are a unique offering of Content Management, Unified Communication& Collaboration and CRM. • .fn solution or Financial Portal Network In suite of financial products is designed to provide seamless, smart analytics interface between Financial Service Providers and their ever- demanding customer base. Their state of the art financial solutions and powerful Analytics Framework help to create custom bespoke offerings that are both, value- rich and competitive. Their elite clientele comprises major Financial Institutions, Banks, Broking Houses, Mutual Funds and Life Insurance Companies. Their .fn products include Wallet Wap, Wealth Console and WIT, a content analytics and management tool. These applications in general provide multi- dimensional portfolio analysis to enterprises and consumers on their desktops and phones. • Wallet Wap : It is the key to anytime /anywhere delivery of personalized market and investment information. The fastest, most direct channel to keep clients informed about the happenings in the markets, it is compatible with all mobile devices. • Wealth Console: It is an enterprise-ready, client server solution that improves communication between Financial Wealth Managers and their clients.
  • 16. 16 2).RETAIL PRODUCTS Their retail products are classified into three categories- Communication, Content streaming (live/ on- demand) &Management and Gaming. COMMUNICATION Mundu IM/ UM A messenger that unifies different messaging services ( AIM, Face book, Gtalk, ICQ, Jabber, MSN,Yahoo) in an easy to use single interface. Mundu IM/UM is available on all platforms including Symbian, iOS, and Android, Blackberry and Feature phones. Mundu SMS A global service that allows mobile users to send text messages using the Internet on their mobile phones and desktops to connect with their contacts at a fraction of the cost incurred by mobile users on their GSM/ CDMA networks. Mundu SMS retains their regular SMS usability and user perception. Spokn A worldwide Telecom service based on the internet that enables people to make phone calls and send short Voice Messages(VMS) using their computers, internet enabled smart phones and PSTN phones. Spokn phone calls and voice messages are economical by a margin of 70% over regular GSM/PSTN/CDMA calls. CONTENT MANAGEMENT AND DELIVERY • Mundu TV: A live streaming and on- demand video application that allows consumers to watch live TV and video-on-demand content on their mobile phones and desktops. Live TV and on-demand video apart from great music, have been touted as two of the most wanted in the 3G space. • Mundu Radio: An internet radio solution that offers high quality digital audio on mobile handsets and desktops. The solution allows mobile and desktop users to choose music genres of their choice from thousands of genre based Internet radio stations. Consumers can choose a genre/album/song of their choice or simply discover serendipitously.
  • 17. 17 MOBILE GAMING • Carom MP: An intriguing strategic board game which is fully compliant with the laws of Physics, for the iPad. Geodesic launched Carrom MP-an exciting multiplayer board game app for the Apple iPad. ELECTRONIC COMPUTING They have included variants of Geoamida to suit solutions in the area of Law Enforcement, Rural Employment Guarantee Act, Public Distribution Systems, Financial Inclusion, Micro Finance, Healthcare, and as a ERP device. • Geoamida: the world’s first integrated mobile computer based on Linux. It includes biometric sensors and smartcard readers/writers. It is a multi-lingual, real-time computing and transaction system with an integrated text to speech facility. • Chandamama: it is in the process of internationalizing its content and plans to deliver this content over the electronic medium including mobile phones and tablets. They have remodeled their offline distribution channels to maximize its reach besides actively promoting Chandamama products on online stores andwww.chandamama.com. • ENLYTE (Education ‘N’ Learning You Take Everywhere): Their education device has passed rounds of alpha testing and has entered the crucial phase of beta testing.
  • 18. 18 CHAPTER-3 FINANCIAL ANALYSIS- THEORETICAL FRAMEWORK FINANCIAL STATEMENTS Accounting is the process of identifying, measuring and communicating economic information to permit informed judgments’ and decisions by users of the information. It involves recording, classifying and summarizing various business transactions. The end products of business transactions are the financial statements comprising primarily the position statement or the balance sheet and the income statement or the profit and loss account. These statements are the outcome of summarizing process of accounting and are; therefore the sources of information on the basis of which conclusions are drawn about the profitability and the financial position of a concern. They play a dominant role in setting the framework of managerial decisions. But the information provided in the financial statements is not an end in itself as no meaningful conclusions can be drawn from these statements alone. However, the information provided in the financial statements is of immense use in making decisions through analysis and interpretation of financial statements. Financial statements are also called financial reports. In the words of Anthony, “financial statements, essentially are interim reports, presented annually and reflect a division of life of an enterprise into more or less arbitrary accounting period- more frequently a year.” Generally Accepted Accounting Principles (GAAP) specifies that a complete set of financial statements must include: A Balance Sheet An Income Statement A Statement of changes in owners’ accounts, and A Statement of changes in financial position The analysis of financial statements and data is an indispensable component of investing, financing and dividend decisions.
  • 19. 19 FINANCIAL ANALYSIS Financial analysis is the process of identifying the financial strengths and weaknesses of the firm by properly establishing relationship between the items of Balance Sheet and Profit and Loss Account. The term ‘Financial Statement Analysis’ includes both ‘Analysis’ and ‘Interpretation’. A distinction should, therefore, be made between the two terms. While the term ‘Analysis’ is used to mean the simplification of financial data, ‘Interpretation’ means, explaining the meaning and significance of the data so simplified. However, both ‘Analysis’ and ‘Interpretation’ are interlinked and complimentary to each other. Analysis is useless without Interpretation and Interpretation without Analysis is difficult or even impossible. OBJECTIVES OF FINANCIAL ANALYSIS Financial statement analysis is largely a study of relationship among the various financial factors in a business as disclosed by a single set of statements and a study of the trends of these factors are shown in a series of statements. The main objective of financial statement analysis is given as follows: 1. To examine the earning- capacity and efficiency of various business activities with the help of financial statements 2. To determine the short term and long term solvency of the business concern with the help of statement of position. 3. To investigate the future potential of the concern. 4. To make comparative study of the operational efficiency of similar concern engaged in the identical industry and 5. To estimate about the performance efficiency and managerial ability by the management of a business concern. The objectives of the analysis may be varied according to the uses of the financial statement analysis. Nowadays, the analysis of financial statements and related data was considered to be important and a number of techniques were developed and used for analyzing.
  • 20. 20 Figure – 3.1 TYPES OF FINANCIAL ANALYSIS On the basis of material used On the basis of Modus Operandi External Internal Horizontal Vertical 1. EXTERNAL ANALYSIS This analysis is done by outsiders who do not have access to the detailed internal accounting records of the business firm. The outsiders include investors, creditors, government agencies, general public etc. For financial analysis, they depend entirely on the published financial statements. 2. INTERNAL ANALYSIS This analysis is conducted by persons who have access to the internal accounting records of a business firm. Such analysis can be performed by executives and employees of an organization. 3. HORIZONTAL ANALYSIS It refers to the comparison of financial data of a company for several years. This type of analysis is also called ‘Dynamic Analysis’ as it is based on the data from year to year rather than data of any one year. Comparative Statements and Trend Percentages are two tools employed in horizontal analysis.
  • 21. 21 4. VERTICAL ANALYSIS It refers to the study of relationship of various items in the financial statements of one accounting period. It is also known as ‘Static Analysis. Common-size statements and Financial Ratios are the two tools employed in vertical analysis. METHODS AND DEVICES OF FINANCIAL ANALYSIS The analysis and interpretation of financial statements is used to determine the financial position and results of operations as well. A number of methods or devices are used to study the relationship between statements. The following methods of analysis are generally used: 1) COMPARATIVE STATEMENTS 2) TREND ANALYSIS 3) RATIO ANALYSIS 4) COMMON-SIZE STATEMENTS 5) FUNDS FLOW ANALYSIS 6) CASH FLOW ANALYSIS COMPARATIVE STATEMENTS Comparative financial statements are statements of the financial position at different periods of time. The elements of financial position are shown in a comparative form so as to give an idea of financial position at two or more periods. The comparative statements may show absolute figures, changes in absolute figures; absolute data in terms of percentages and increase or decrease in terms of percentages. Comparative financial statement is very useful to the analyst because they contain not only the data appearing in single statements but also information necessary for the study of financial and operating trends over a period of years. They indicate the direction of the movement with respect of the financial position and operating results. COMPARATIVE BALANCE SHEET Increase and decrease in various assets and liabilities as well as in proprietors’ equity or capital brought about by conduct of a business can be observed by a comparison of the balance sheets at the beginning and the end of the period. Such observation often yields considerable information which is of value in forming an opinion regarding the
  • 22. 22 progress of the enterprise and in order to facilitate comparison, a simple device known as “Comparative Balance Sheet” may be used. COMPARATIVE INCOME STATEMENT An income statement shows the net profit or net loss resulting from the operation of a business for designated period of time. A comparative income statement shows the operating results for a number of accounting periods so that changes in absolute data from one period to another may be started in terms of money and percentages. The comparative income statements contain the same columns as the comparative balance sheet and provide the same type of information-the accounts balances, increase and decrease in money amounts. The cost of goods sold should not increase out of proportion to the increase in sales and this would adversely affect gross profit on sales. Selling expenses bear a direct positive correlation to sales volume because most of these expenses vary more or less in the same proportion as the sales. TREND ANALYSIS This method determines the direction upwards or downwards and involves the computation of the percentage relationship that each statement item bears to the same item in the base year. The figures of the base year are taken as 100 and trend ratios for other years are calculator on the basis of the year A series of financial statement may be analyzed by determining and studying the trend of the data shown in the statement. This method of analysis one of direction- upward or downward- and involves the computation of percentage relationship that each statement item bears to the same item in the ‘base year’ which may be the earliest year involved in comparison or the latest year or any intervening year. Trend percentages relate to the base year, emphasize changes in the financial operating data from year to year and make a possible a horizontal study on the data.
  • 23. 23 COMPUTATION OF TREND PERCENTAGES 1. A statement is taken as the base with reference to which all other statements are to be studied. 2. Every item to be stated as 100 in the statement which is taken as the base. 3. If the amount of an item on the other statement is less than that in the base statement, the trend percentages will be below 100 and if the amount is more than the base amount, the trend percentage would be above 100 percent. 4. Trend ratios can be computed by dividing each amount in the statements with the corresponding item in the statement taken as base. EVALUATION OF TREND PERCENTAGES It is noted that, though trend ratios show whether an item has increased or decreased as well as the degree of change, they are valuable only to the extent to which they provide clues to favorable or unfavorable tendencies and point the way for further analysis. The comparability of trend ratios is adversely affected to the extent to which accounting principles and policies published by the accounts have not be followed consistently through the period being studied. Comparability of the data is also adversely affected when the price level has changed materially during the year under review. Some analysis deflate the statement data by dividing the money amounts with the related price index thereby providing figures that will give abroad idea of changes in physical quantity and volume exclusive of price charges. RATIO ANALYSIS It is the process of establishing and interpreting various ratios (quantitative relationship between figures and groups of figures). It is with the help of ratios that the financial statements can be analyzed more clearly and decisions made from such analysis. Ratio analysis is a technique of analysis and interpretation of financial statements. It is the process of establishing and interpreting various ratios for helping in making certain decisions. It is not only a means of better understanding of financial strengths and weaknesses of a firm. Calculation of mere ratios does not serve any purpose, unless several appropriate ratios are analyzed and interpreted. There are a
  • 24. 24 number of ratios which can be calculated from the information given in financial statements, but the analyst has to select the appropriate data and calculate only a few appropriate ratios from the same keeping in mind the objective of analysis. The ratios may be used as a symptom like blood pressure, the pulse rate or the body temperature and their interpretation depends upon the caliber and the competence of the analyst. The following are the steps involved in the ratio analysis: 1. Selection of relevant data from the financial statements depending upon the objective of the analysis. 2. Calculation of appropriate ratios from the above data. 3. Comparison of the calculated ratios with the ratios of the same firm in the past or the ratios developed from the projected financial statements or the ratios of some other firms or the comparison with ratios of the industry to which the firm belongs. 4. Interpretation of the ratios. INTERPRETATION OF THE RATIOS The interpretation of the ratios is an important factor. Though calculation of ratios is also important but it is only a clerical task whereas interpretation needs skill, intelligence and foresightedness. The inherent limitations of ratio analysis should be kept in mind while interpreting them. The impact of factors such as price level changes, change in accounting policies, window dressing etc., should also be kept in mind when attempting to interpret ratios. The interpretation of ratios can be made in the following ways: 1. SINGLE ABSOLUTE RATIO Generally speaking one cannot draw any meaningful conclusion when a single ratio is considered in isolation. But single ratios may be studied in relation to certain rule of thumb which is based upon well proven conclusions as for example 2:1 is considered to be a good ratio for current assets to current liabilities. 2. GROUP OF RATIOS Ratios may be interpreted by calculating a group of related ratios. A single ratio supported by other related additional ratios becomes more understandable and
  • 25. 25 meaningful. For example, the ratio of current assets to current liabilities may be supported by the ratio of liquid assets to liquid liabilities to draw more dependable conclusions. 3. HISTORICAL COMPARISON One of the easiest and most popular ways of evaluating the performance of the firm is to compare its present ratios with past ratios called comparison overtime. When financial ratios are compared over a period of time, it gives an indication of the direction of change and reflects whether the firm’s performance and financial performance has improved, deteriorated or remained constant over a period of time. But while interpreting ratios from comparison over time, one has to be careful about the changes, if any, in the firm’s policies and accounting procedures. 4. PROJECTED RATIOS Ratios can be calculated for future standards based upon the projected or proforma financial statements. These future ratios may be taken as standard for comparison and the ratios calculated on actual financial statements can be compared with the standard ratios to find out variances, if any. Such variances help in interpreting and taking corrective action for improvement in future. 5. INTER-FIRM COMPARISON Ratios of one firm can also be compared with the ratios of some other selected firms in the same industry at the same point of time. This kind of comparison helps in evaluating relative financial position and performance of the firm.
  • 26. 26 Figure – 3.2 CLASSIFICATION OF RATIOS (A) (B) (C) Traditional Classification Functional Classification Significance Ratios Balance Sheet Ratios Liquidity Ratios Primary Ratios Revenue Statement Leverage Ratios Secondary Ratios Ratios Composite or mixed Activity Ratios Ratios Profitability Ratios FUNCTIONAL CLASSIFICATION OF RATIOS A). LIQUIDITY RATIOS The short term creditors of a company like suppliers of goods of credit and commercial banks providing short-term loans are primarily interested in knowing the company’s ability to meet its current or short-term obligations as and when these become due. Therefore, a firm must ensure that it does not suffer from lack of liquidity or the capacity to pay its current obligations. If a firm fails to meet such obligations due to lack of good liquidity position, its goodwill in the market is likely to be affected beyond repair. It will result in a loss of creditor’s confidence in the firm and may even lead to the closing down of the firm. Even a high degree of liquidity of
  • 27. 27 the firm. To measure the liquidity of a firm, current ratios, quick ratios etc. are calculated. B).SOLVENCY RATIOS The term ‘solvency’ refers to the ability of a concern to meet its long term obligations. The long- term indebtedness of a firm includes debenture holders, financial institutions providing medium and long-term loans and other creditors selling goods on installment basis. The long-term creditors of a firm are primarily interested in knowing the firm’s ability to pay regular interest on long-term borrowings, repayment of the principal amount at the maturity of the security and the security of their loans. Accordingly, long-term solvency ratios indicate a firm’s ability to meet the fixed interest and costs and repayment schedules associated with its long-term borrowings. Debt-equity ratios, equity ratios, etc. are the ratios applied to analyze the solvency of a business enterprise. C). PROFITABILITY RATIOS The primary objective of a business undertaking is to earn profits. Profit earning is considered essential for the survival of the business. In the words of Lord Keynes, “Profit is the engine that drives the business enterprise”. A business needs profits not only for its existence but also for expansion and diversification. A business enterprise can discharge its obligations to the various segments of the society only through earning of profits. Profitability ratios are calculated to measure the overall efficiency of the business. Generally Profitability ratios are calculated in relation to sales or in relation to investment. These ratios can be divided into General and Overall Profitability ratios. Gross profit ratio, net profit ratio, return on capital employed etc. are examples. D).LEVERAGE RATIOS It is concerned with analysis of capital structure. The term ‘capital structure’ refers to the relationship between various Long-term source of financing such as debentures, preference share capital and equity share capital including reserves and surplus. Financing the firm’s assets is a very crucial problem in every business and as a general rule there should be a proper mix of debt and equity capital in financing the firm’s assets. Leverage or capital structure ratios are calculated to test the long-term financial position of a firm. Capital gearing ratio, financial leverage etc. are examples.
  • 28. 28 E).ACTIVITY RATIOS Funds are invested in various assets in business to make sales and earn profits. The efficiency with which assets are managed directly affects the volume of sales. The better the management of assets, the larger is the amount of sales and the profits. Activity ratios measure the efficiency or effectiveness with which a firm manages its resources or assets. These ratios are also called turnover ratios because they indicate the speed with which assets are converted or turned over into sales. Inventory turnover ratio is an example. COMMON-SIZE STATEMENTS Under this statements are shown in analytical percentages. The figures are shown as percentages of total assets total liabilities and total sales. These statements are also known as Component Percentage or 100% Statements because every individual item is stated as a percentage of total 100. The short-comings in comparative statements and trend percentages where changes in items could not be compared with the totals have been covered up. Preparation of comparative financial statements and the calculation of trend percentages or ratios as methods of analyzing financial statements, have one common short coming-the inability of the analyst to comprehend the changes that have taken place from year to year in relation to the total assets, total liabilities and capital or total net sales. The seriousness of this limitation is brought forth when a comparison is being made of two or more business units or of one unit with statements for an industry as a whole, because there is no common base of comparison when dealing with absolute figures. However, in case the balance sheet and income statement items are shown in analytical percentages, i.e., percentage or ratios of the total of appropriate item, a common base for comparison is provided. The statement in this form is designated as ‘Common Size Statements’. FUND FLOW STATEMENT The balance sheet gives a static view of the resources (liabilities) of a business and the uses (assets) to which these resources have been put at a certain point of time. It does not disclose the causes for changes in the assets and liabilities between two different points of time. Hence, another statement has to be prepared to show the change in the assets and liabilities from the end of one period of time to the end of another point of
  • 29. 29 time. This statement is called a Statement of Changes in Financial Position or a Funds Flow Statement. The importance of fund flow statement can be well followed from its various uses. • It helps in the analysis of financial operations • It throws light on many perplexing questions of general interest • It help in the formulation of a realistic dividend policy • It help in the proper allocation of resources • It acts as a future guide • It helps in uprising the use of working capital • It help in knowing overall credit worthiness of a firm CASH FLOW STATEMENT It is a statement which describes the inflows (sources) and outflows (uses) of cash and cash equivalents in an enterprise during a specific period of time. A cash flow statement summarizes the causes of changes in cash position of a business enterprise between dates of two balance sheets. It takes into account receipts and disbursements of cash. Inflow of cash is known as sources of cash and outflow of cash is known as use of cash. Cash Flow Statement is a statement designed to highlight upon the causes which bring changes in cash position between two balance sheets. UTILITY OF CASH FLOW ANALYSIS A cash flow statement is useful for short term planning. It is an important tool for the management. Its chief advantages as follows: • It helps in efficient cash management • Helps in internal financial management • Discloses the movements of cash
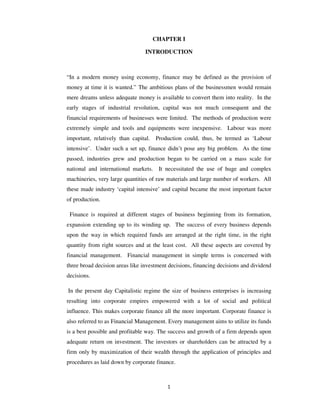
  • 30. 30 CHAPTER – 4 ANALYSIS AND INTERPRETATION OF FINANCIAL STATEMENTS RATIO ANALYSIS A. LIQUIDITY RATIOS 1. CURRENT RATIO Current ratio may be defined as the relationship between current assets and current liabilities. It is also known as working capital ratio. It is used in the analysis of short- term financial position of a firm. It is calculated using the formula: Current Assets Current Liabilities Current assets are those assets which can be easily converted into cash within a short period. It includes cash, debtors, bills receivables etc. Current liabilities are those obligations which are payable within a short period i.e., within one year. Examples are creditors, bills payables etc. Table no. 4.1 STATEMENT SHOWING CURRENT RATIO (in crores) YEAR CURRENT ASSETS CURRENT LIABILITIES RATIO ( no. of times) 2006-2007 200.25 10.54 19.01 2007-2008 816.28 57.85 14.11 2008-2009 784.99 105.04 7.47 2009-2010 782.3 91.74 8.53 2010-2011 906.35 332.28 2.73
  • 31. Graph showing Current ratio for the years The table 4.1 shows the current ratio during the years 2007 to 2011. Current ratio has shown a decreasing trend from 2007 to 2011. Though there was a slight increase in 2010 to 8.5 from 7.47 in 2009, the rate was less than the rate in 2007 which was 19.01. The optimal current ratio is 2:1. pay off current liabilities. Usually, current assets should be twice of current liabilities. Excessive current assets indicate idleness of working capital and shortage of funds indicates the absence of liquidity. The current ratio of Geodesic ltd. has never reached the ideal level except on 2011. And the ratio was 2.73:1. Though steps must be taken by the firm for improving its short shown a decreasing trend. 2. QUICK RATIO Quick ratio, also known as Acid Test or Liquid ratio, is a more rigorous test of liquidity than the current ratio. Quick ratio may be defined as the relationship between quick or liquid assets and current or most liquid Assets. 31 Figure 4.1 Graph showing Current ratio for the years March 2007to March CURRENT RATIO Source – Table 4.1 The table 4.1 shows the current ratio during the years 2007 to 2011. Current ratio has shown a decreasing trend from 2007 to 2011. Though there was a slight increase in 2010 to 8.5 from 7.47 in 2009, the rate was less than the rate in 2007 which was The optimal current ratio is 2:1. There should be sufficient current assets to pay off current liabilities. Usually, current assets should be twice of current liabilities. Excessive current assets indicate idleness of working capital and shortage of funds indicates the absence of liquidity. The current ratio of Geodesic ltd. has never reached the ideal level except on 2011. And the ratio was 2.73:1. Though steps must be taken by the firm for improving its short-term liquidity position as the current ratio shown a decreasing trend. Quick ratio, also known as Acid Test or Liquid ratio, is a more rigorous test of liquidity than the current ratio. Quick ratio may be defined as the relationship between quick or liquid assets and current or liquid liabilities. Cash in hand and at bank are the 0 5 10 15 20 2007 2008 2009 2010 2011 March 2011 The table 4.1 shows the current ratio during the years 2007 to 2011. Current ratio has shown a decreasing trend from 2007 to 2011. Though there was a slight increase in 2010 to 8.5 from 7.47 in 2009, the rate was less than the rate in 2007 which was There should be sufficient current assets to pay off current liabilities. Usually, current assets should be twice of current liabilities. Excessive current assets indicate idleness of working capital and shortage of funds indicates the absence of liquidity. The current ratio of Geodesic ltd. has never reached the ideal level except on 2011. And the ratio was 2.73:1. Though steps must be taken term liquidity position as the current ratio has Quick ratio, also known as Acid Test or Liquid ratio, is a more rigorous test of liquidity than the current ratio. Quick ratio may be defined as the relationship between liquid liabilities. Cash in hand and at bank are the
  • 32. 32 Quick ratio is calculated using the formula: Quick or Liquid assets Current liabilities Quick assets = Current assets- (inventories + Prepaid expenses) Table No.-4.2 STATEMENT SHOWING LIQUID RATIO(in crores) YEAR LIQUID ASSETS CURRENT LIABILITIES RATIO (no. of times) 2006-2007 200.15 10.54 18.99 2007-2008 814.5 57.85 14.08 2008-2009 784.6 105.04 7.47 2009-2010 777.04 91.74 8.47 2010-2011 897.16 332.28 2.7 The table 4.9 showing liquidity ratio reveals that the ratio has shown same trend that current ratio in the table 4.7 has shown. During the year 2008 and 2009, the liquidity ratio which was 18.99 in 2007 fell down to 14.08 and 7.47 respectively. Afterwards in 2010, though there was an increase to 8.47, it declined to 207 in 2011. As a rule of convention a ratio of 1:1 is considered satisfactory. A liquidity ratio of 1:1 does not necessarily mean satisfactory liquidity position if all the debtors cannot be realized and cash is needed immediately to meet current obligations. In the same manner, a low liquidity ratio does not necessarily mean a bad liquidity position as inventories are not absolutely liquid.
  • 33. Graph showing Quick ratio B. SOLVENCY RATIOS 1. DEBT-EQUITY RATIO Debt-equity ratio, also known as External measure the relative claims of outsiders and the owners (shareholders) assets. This ratio indicates the relationship between outsiders’ funds and shareholders’ funds. Thus, Debt- Equity ratio is calculated as: Shareholders’ funds = Equity capital + Preference Capital + Accumulated Profits + Accumulated Losses Outsiders’ funds = Debentures + Mortgage Loans + Bonds + Long 10 20 33 Figure 4.2 Graph showing Quick ratio for the years March 2007 to March QUICK RATIO Source – Table 4.2 B. SOLVENCY RATIOS EQUITY RATIO equity ratio, also known as External- Internal Equity Ratio is calculated to measure the relative claims of outsiders and the owners (shareholders) against firm’s assets. This ratio indicates the relationship between outsiders’ funds and shareholders’ Equity ratio is calculated as: Outsiders’ funds Shareholders’ funds Shareholders’ funds = Equity capital + Preference Capital + Reserves and Surplus + Accumulated Profits + Accumulated Losses = Debentures + Mortgage Loans + Bonds + Long- term Loans 0 10 20 2007 2008 2009 2010 2011 March 2011 Internal Equity Ratio is calculated to against firm’s assets. This ratio indicates the relationship between outsiders’ funds and shareholders’ Reserves and Surplus + term Loans
  • 34. 34 Table No. - 4.3 STATEMENT SHOWING DEBT-EQUITY RATIO (in crores) YEAR OUTSIDERS’ FUNDS SHAREHOLDERS’ FUNDS RATIO (no. of times) 2006-2007 .19 320.04 .01 2007-2008 506.79 426.38 1.18 2008-2009 640.97 602.72 1.06 2009-2010 586.93 762.42 .76 2010-2011 614.07 964.23 .63 Debt- equity ratio is calculated to measure the extent to which debt financing has been used in a business. As a general rule, there should be an appropriate mix of owners’ funds and outsiders’ funds in financing the firms’ assets. Interpretation of this ratio depends primarily upon the financial policy of the firm and the nature of the business. Generally speaking, a low ratio is considered as favorable from the Long-term creditors’ point of view because a high proportion of funds provide a larger margin of safety for them at the time of liquidation of the firm. But from the perspective of the owners, a low ratio is unfavorable as it indicates that the firm has not been able to use low-cost outsiders’ funds to magnify their earnings. The table 4.9 above showing Debt-equity ratio from 2007 to 2011, projects a fluctuating trend. The ratio which was .001:1 in 2007 moved upwards to 1.18:1 in 2008 which later showed a sudden decline to 1.06, .76 and .63 in 2009, 2010 and 2011 respectively. The ratio was satisfactory from outsiders’ point of view and the company in 2007, 2010 and 2011. Because outsiders’ fund was less than owners’ funds in all these years (low ratio) except in 2008 and 2009 which was favorable to the owners of the company. In 2008 and 2009 the ratio was not favorable to the firm as it was higher than the generally accepted norm of 1:1.
  • 35. Graph showing Debt 2. FUNDED DEBT TO TOTAL CAPITALISATION This ratio establishes a link between long long-term funds available in the business. The two words used in this ratio are: Funded Debt = Debentures + mortgage Loans + Bonds + other long Total Capitalization = Equity capital + Preference Funded Debt This ratio is calculated as, 0.5 1.5 35 Figure 4.3 Graph showing Debt-equity ratio for the years March 2007 to March DEBT-EQUITY RATIO Source- Table 4.3 2. FUNDED DEBT TO TOTAL CAPITALISATION This ratio establishes a link between long-term funds raised from outsiders and total term funds available in the business. The two words used in this ratio are: = Debentures + mortgage Loans + Bonds + other long Total Capitalization = Equity capital + Preference capital + Reserves and Surplus + This ratio is calculated as, Funded Debt Total Capitalization 0 0.5 1 1.5 2007 2008 2009 2010 2011 March 2011 funds raised from outsiders and total term funds available in the business. The two words used in this ratio are: = Debentures + mortgage Loans + Bonds + other long- term loans Reserves and Surplus +
  • 36. 36 Table No. 4.4 STATEMENT SHOWING FUNDED DEBT TO TOTAL CAPITALISATION (In crores) YEAR FUNDED DEBT TOTAL CAPITALISATION RATIO (%) 2006-2007 0.19 320.23 .1 2007-2008 506.79 933.18 54 2008-2009 640.97 1243.69 51 2009-2010 586.93 1349.35 43 2010-2011 614.07 1578.3 39 A study of this ratio helps us to know how much the company has relied on outside sources for raising long-term funds. Though there is no ‘Rule of Thumb’ but still the less the reliance on outsiders’ funds the better it will be. If the ratio is smaller, better it will be, up to 50% or 55% this ratio may be tolerable and not beyond. The above table indicates that the portion of Funded Debt in total long-term funds is satisfactory. Because in all these five years the percentage of Funded Debt in Total Capitalization is less than 55%. It was least in 2007 (only 1%). Though it increased to 54% in 2008, there was a decline afterwards. The debt financing was at peak in 2008 i.e. 54% which reduced to 39% in 2011. The ratio which was 1% in 2007 is quite low. It is because the Company hadn’t raised unsecured loans in 2007 and also the amount of debt raised in all the following years was low. Hence, there is enough scope for the company to raise long- term loans from outsiders.
  • 37. Graph showing funded debt to total capitalization FUNDED DEBT TO TOTAL CAPITALISATION RATIO 3. PROPRIETARY/ EQUITY RATIO This ratio also known as Net Worth to total assets ratio is an important ratio for determining long-term solvency of a firm. Net worth means shareholders’ funds and total assets on the other hand denote total resources of the concern. The ratio is calculated as under: STATEMENT SHOWING EQUITY RATIO YEAR SHAREHOLDERS’ 2006-2007 2007-2008 2008-2009 2009-2010 2010-2011 37 Figure 4.4 ed debt to total capitalization for the years March 2011 FUNDED DEBT TO TOTAL CAPITALISATION RATIO Source- Table 4.4 RY/ EQUITY RATIO This ratio also known as Net Worth to total assets ratio is an important ratio for term solvency of a firm. Net worth means shareholders’ funds and total assets on the other hand denote total resources of the concern. The ratio is Shareholders’ funds Total Assets Table No.4.5 STATEMENT SHOWING EQUITY RATIO (in crores) SHAREHOLDERS’ FUNDS TOTAL ASSETS RATIO 320.04 330.37 426.38 991.02 602.72 1348.73 762.42 1441.09 964.23 1910.58 0 20 40 60 2007 2008 2009 2010 2011 March 2007 to FUNDED DEBT TO TOTAL CAPITALISATION RATIO This ratio also known as Net Worth to total assets ratio is an important ratio for term solvency of a firm. Net worth means shareholders’ funds and total assets on the other hand denote total resources of the concern. The ratio is crores) RATIO (%) 97 43 45 53 50
  • 38. The table above showing statement of equity ratio owners’ funds to total assets. Higher the ratio or the ratio or the share of the shareholders in the total capital of the company, better is the long position of the company. This ratio indicates that the extent company can be lost without affecting the interest of the creditors of the creditors of the company. In 2007, the ratio was 97% it is the year in which the ratio was at peak in all the five years. Then in 2008, the ratio came do ratio was lowest. In 2009 and 2010, it showed an increasing trend by 45% and 53% respectively. But it fell down to 50% in 2011. Though the performance was satisfactory, the company should try to raise equity capit Graph showing Equity ratio 4. RATIO OF TOTAL LIABILITIES TO TOTAL ASSETS This ratio indicates the relationship between the Total liabilities to outsiders to Assets of a firm and can be calculated as follows: 0 20 40 60 80 100 38 The table above showing statement of equity ratio represents the relationship of owners’ funds to total assets. Higher the ratio or the ratio or the share of the shareholders in the total capital of the company, better is the long-term solvency position of the company. This ratio indicates that the extent to which the assets of the company can be lost without affecting the interest of the creditors of the creditors of In 2007, the ratio was 97% it is the year in which the ratio was at peak in all the five years. Then in 2008, the ratio came down to 43% and it was the year in which the ratio was lowest. In 2009 and 2010, it showed an increasing trend by 45% and 53% respectively. But it fell down to 50% in 2011. Though the performance was satisfactory, the company should try to raise equity capital again. Figure 4.5 Graph showing Equity ratio for the years March 2007 to March EQUITY RATIO Source – Table 4.5 ATIO OF TOTAL LIABILITIES TO TOTAL ASSETS This ratio indicates the relationship between the Total liabilities to outsiders to Assets of a firm and can be calculated as follows: Total liabilities to outsiders Total assets 2007 2008 2009 2010 2011 represents the relationship of owners’ funds to total assets. Higher the ratio or the ratio or the share of the term solvency to which the assets of the company can be lost without affecting the interest of the creditors of the creditors of In 2007, the ratio was 97% it is the year in which the ratio was at peak in all the five wn to 43% and it was the year in which the ratio was lowest. In 2009 and 2010, it showed an increasing trend by 45% and 53% respectively. But it fell down to 50% in 2011. Though the performance was March 2011 This ratio indicates the relationship between the Total liabilities to outsiders to Total
  • 39. STATEMENT SHOWING YEAR 2006-2007 2007-2008 2008-2009 2009-2010 2010-2011 The above table representing Solvency ratio explains that the total liabilities forms 1% of total resources of the firm in 2007, which increased to 51% in 2008. But there was a decline in 2009, 2010 and 2011 by 48%, 41% and 32% respectively. The ratio was at its maximum in 2008 i.e. 51%. Generally, lower the ratio of total liabilities to total assets is considered as favorable to the long was most satisfactory only in 2007. Hence, the company should try again to redu liabilities to outsiders. Graph showing Solvency Ratio 20 40 60 39 Table No.4.6 STATEMENT SHOWING SOLVENCY RATIO (in crores) TOTAL LIABILITIES TO OUTSIDERS TOTAL ASSETS 10.73 330.77 564.64 991.02 746.01 1348.73 678.67 1441.09 946.35 1910.58 The above table representing Solvency ratio explains that the total liabilities forms 1% of total resources of the firm in 2007, which increased to 51% in 2008. But there was a decline in 2009, 2010 and 2011 by 48%, 41% and 32% respectively. The ratio was at its maximum in 2008 i.e. 51%. Generally, lower the ratio of total liabilities to total assets is considered as favorable to the long-term solvency position. Hence, the ratio was most satisfactory only in 2007. Hence, the company should try again to redu Figure 4.6 Graph showing Solvency Ratio for the years March 2007 to March SOLVENCY RATIO Source – Table 4.6 0 20 40 60 2007 2008 2009 2010 2011 (in crores) RATIO (%) 3 57 55 47 50 The above table representing Solvency ratio explains that the total liabilities forms 1% of total resources of the firm in 2007, which increased to 51% in 2008. But there was a decline in 2009, 2010 and 2011 by 48%, 41% and 32% respectively. The ratio was at its maximum in 2008 i.e. 51%. Generally, lower the ratio of total liabilities to total term solvency position. Hence, the ratio was most satisfactory only in 2007. Hence, the company should try again to reduce March 2007 to March 2011
  • 40. 40 5. FIXED ASSETS TO NETWORTH RATIO This ratio establishes the relationship between fixed assets and shareholders’ funds. The ratio is calculated as follows: Fixed assets after depreciation Shareholders’ funds Table No.4.7 STATEMENT SHOWING FIXED ASSETS TO NETWORTH RATIO (in crores) YEAR FIXED ASSETS SHAREHOLDERS’ FUNDS RATIO (%) 2006-2007 56.58 320.04 18 2007-2008 67.64 426.38 16 2008-2009 62.86 602.72 10 2009-2010 59.86 762.42 8 2010-2011 104.41 964.23 11 The table below representing the ratio of fixed assets to net worth indicates the extent to which shareholders’ funds are sunk into the fixed assets. Generally, the purchase of fixed assets should be financed by shareholders’ equity. If the ratio is less than 100%, it implies that owners’ funds are more than total fixed assets and a part of working capital is provided by the shareholders. And if vice versa, it implies that owners’ funds are not sufficient to finance the fixed assets and the firm has to depend upon outsiders to finance the fixed assets. From the table above it is understood that the rate have shown a decline to 2010 from 18% in 2007 to 8% in 2010. Though there was an increase of 11% in 2011, it was less than the rate of 2007. Anyhow, since, the ratio is less than 100%, we can say that the owners’ funds is more than fixed assets and a part of working capital is also financed by shareholders’ funds. That means, the company does not need to depend on debt financing for purchasing fixed assets.
  • 41. Graph showing fixed assets to net worth ratio of FIXED ASSETS TO NET WORTH RATIO 6. FIXED ASSETS RATIO It is a variant to fixed assets to net worth ratio which is calculated STATEMENT SHOWING FIXED ASSETS RATIO YEAR FIXED ASSETS 2006-2007 2007-2008 2008-2009 2009-2010 2010-2011 The above table indicates the extent to which the total of fixed assets is financed by long-term funds of the firm. Generally, the ratio should be 100. But if the fixed 0 2 4 6 8 10 12 14 16 18 41 Figure 4.7 Graph showing fixed assets to net worth ratio of for the years March 2011 FIXED ASSETS TO NET WORTH RATIO Source – Table 4.7 ASSETS RATIO It is a variant to fixed assets to net worth ratio which is calculated as: Fixed assets after depreciation Long term funds Table No. 4. 8 STATEMENT SHOWING FIXED ASSETS RATIO FIXED ASSETS LONG-TERM FUNDS RATIO (%) 56.58 320.23 67.64 933.17 62.86 1243.69 59.86 1349.35 104.41 1578.3 The above table indicates the extent to which the total of fixed assets is financed by term funds of the firm. Generally, the ratio should be 100. But if the fixed 0 2 4 6 8 10 12 14 16 18 2007 2008 2009 2010 2011 March 2007 to RATIO (%) 18 7 5 4 7 The above table indicates the extent to which the total of fixed assets is financed by term funds of the firm. Generally, the ratio should be 100. But if the fixed assets
  • 42. exceed the total long-term funds, it implies that the firm ha assets out of current funds or the working capital which is not a good financial policy. The table shows that the trend of fixed assets to long 2007 to 2010, from18% to 4%. rate of 2007. However, not only the fixed assets requirements but also a part of working capital is met out from the long ratio of fixed asset is much less than 100%, t investments in fixed assets, as increase in of the concern. Graph showing fixed assets ratio of C. GENERAL PROFITABILITY RATIOS 1. OPERATING PROFIT RATIO This ratio indicates the portion remaining out of every rupee worth of sales after all operating costs and expenses have been met. This ratio is calculated by dividing operating profit by net sales or income from operations. Operating Profit = Operating Income Operating Profit Ratio = Operating Profit 42 term funds, it implies that the firm has financed a part of fixed of current funds or the working capital which is not a good financial policy. The table shows that the trend of fixed assets to long-term funds is declining from 18% to 4%. Though it increased to 7% in 2011, it was less than the However, not only the fixed assets requirements but also a part of working capital is met out from the long-term funds of the company. But since the ratio of fixed asset is much less than 100%, the company has to make more investments in fixed assets, as increase in fixed assets means increase in the solvency Figure 4.8 Graph showing fixed assets ratio of for the years March 2007 to March FIXED ASSETS RATIO Source – Table 4.8 PROFITABILITY RATIOS 1. OPERATING PROFIT RATIO This ratio indicates the portion remaining out of every rupee worth of sales after all operating costs and expenses have been met. This ratio is calculated by dividing sales or income from operations. Operating Profit = Operating Income – Operating Cost Operating Profit Ratio = Operating Profit Income from operations 0 5 10 15 20 2007 2008 2009 2010 2011 s financed a part of fixed of current funds or the working capital which is not a good financial policy. term funds is declining from increased to 7% in 2011, it was less than the However, not only the fixed assets requirements but also a part of term funds of the company. But since the he company has to make more fixed assets means increase in the solvency March 2011 This ratio indicates the portion remaining out of every rupee worth of sales after all operating costs and expenses have been met. This ratio is calculated by dividing Operating Cost
  • 43. STATEMENT SHOWING OPERATING PROFIT RATIO YEAR 2006-2007 2007-2008 2008-2009 2009-2010 2010-2011 From the table it is understood that from 2007 to 2011. The ratio which was 68.82% in 2007 fell to 61.32%, 54.91%, 54.39% and 47.04% in 2008, 2009, 2010 and 2011 respectively. Generally, higher the operating profit ratio, the better is the pro downwards. It implies the company has to take steps to improve the situation. Graph showing operating profit ratio of 2. NET PROFIT RATIO The net profit ratio establishes a relationship between Net Profit after Taxes and Sales, and indicates the efficiency of the management in manufacturing, selling, administrating and other activities of the firm. This ratio is the overall profitability and is calculated 43 Table No. 4.9 STATEMENT SHOWING OPERATING PROFIT RATIO (in crores) OPERATING PROFIT INCOME FROM OPERATIONS 113.62 165.09 156.66 255.46 271.18 493.79 265.04 487.27 315.84 671.43 From the table it is understood that the operating profit has shown a declining trend from 2007 to 2011. The ratio which was 68.82% in 2007 fell to 61.32%, 54.91%, 54.39% and 47.04% in 2008, 2009, 2010 and 2011 respectively. Generally, higher the operating profit ratio, the better is the profitability. But here the rate has gone downwards. It implies the company has to take steps to improve the situation. Figure 4.9 Graph showing operating profit ratio of for the years March 2007 to OPERATING PROFIT RATIO Source – Table 4.9 NET PROFIT RATIO The net profit ratio establishes a relationship between Net Profit after Taxes and Sales, and indicates the efficiency of the management in manufacturing, selling, administrating and other activities of the firm. This ratio is the overall measure of the profitability and is calculated as: 0 20 40 60 80 2007 2008 2009 2010 2011 (in crores) RATIO (%) 68.82 61.32 54.91 54.39 47.04 the operating profit has shown a declining trend from 2007 to 2011. The ratio which was 68.82% in 2007 fell to 61.32%, 54.91%, 54.39% and 47.04% in 2008, 2009, 2010 and 2011 respectively. Generally, higher the fitability. But here the rate has gone downwards. It implies the company has to take steps to improve the situation. 2007 to March 2011 The net profit ratio establishes a relationship between Net Profit after Taxes and Sales, and indicates the efficiency of the management in manufacturing, selling, measure of the
  • 44. 44 Net Profit Ratio = Net Profit after Tax Income from Operations Table No. 4.10 STATEMENT SHOWING NET PROFIT RATIO (in crores) YEAR NET PROFIT AFTER TAX INCOME FROM OPERATIONS RATIO (%) 2006-2007 94.34 165.09 57 2007-2008 110.37 255.46 43 2008-2009 191.41 493.79 39 2009-2010 174.88 487.27 36 2010-2011 234.64 671.43 35 The two basic elements of the ratio are net profits and sales. The net profits are obtained after deducting income tax. The ratio is very useful as if the profit is not sufficient, the firm shall not be able to achieve a satisfactory return on its investment. This ratio also indicates the firm’s capacity to face adverse economic conditions such as price competition, low demand etc. Obviously, higher the ratio better is the profitability. The table representing the net profit ratio indicates a decreasing trend. The ratio was at peak in 2007 at 57% which fell down to 43% in 2008, 39% in 2009, 36% in 2010 and 35% in 2011. It means the profitability of the concern has heavily deteriorated in 2011 when compared to all other years. The company has to be very conscious in coming future to recover the prosperity at least in 2007.
  • 45. Graph showing operating profit ratio of D. OVERALL PROFITABILITY RATIOS 1. RETURN ON NET WORTH Return on shareholders’ investment, popularly known as Return on Investment, is the relationship between net profits after interest and tax and the proprietors’ funds. profit after interest and tax is taken only because available to shareholders. This ratio is one of the most important ratios used for measuring the overall efficiency of a firm. As this ratio reveals how well the resources of a firm are being used. Higher the ratio better ar Thus: Return on Net Worth 45 Figure 4.10 Graph showing operating profit ratio of for the years 2007 to 2011 NET PROFIT RATIO Source – Table 4.10 D. OVERALL PROFITABILITY RATIOS 1. RETURN ON NET WORTH on shareholders’ investment, popularly known as Return on Investment, is the relationship between net profits after interest and tax and the proprietors’ funds. profit after interest and tax is taken only because those will be the only profits available to shareholders. This ratio is one of the most important ratios used for measuring the overall efficiency of a firm. As this ratio reveals how well the resources of a firm are being used. Higher the ratio better are the results. = Net Profit (after interest and tax) Share holders’ funds 0 10 20 30 40 50 60 2007 2008 2009 2010 2011 for the years 2007 to 2011 on shareholders’ investment, popularly known as Return on Investment, is the relationship between net profits after interest and tax and the proprietors’ funds. Net those will be the only profits available to shareholders. This ratio is one of the most important ratios used for measuring the overall efficiency of a firm. As this ratio reveals how well the resources
  • 46. 46 Table No. 4.11 STATEMENT SHOWING RETURN ON NET WORTH (in crores) YEAR NET PROFIT SHARE HOLDERS’ FUNDS RATIO (%) 2006-2007 94.34 320.04 29 2007-2008 110.37 426.38 26 2008-2009 191.41 602.72 32 2009-2010 174.88 762.42 23 2010-2011 234.64 964.23 24 The above table showing return on net worth explains that the ratio has shown a fluctuating trend. The ratio which was 29% in 2007 fell to 26% in 2008 which later became 32% in 2009. There was a tremendous decline to 23% in 2010. Though there was a further increase in 2011, it was only by 1% i.e. 24%. The company has much to improve. Figure 4.11 Graph showing return on net worth ratio of for the years March 2007 to March 2011 RETURN ON NET WORTH Source – Table 4.11 0 5 10 15 20 25 30 35 2007 2008 2009 2010 2011
  • 47. 47 2. EARNINGS PER SHARE EPS is a small variation of return on equity capital and is calculated by dividing the net profit after taxes and preference dividend by total number of equity shares. Thus, Earnings per Share = Net Profit after Tax – Preference Dividend Number of Equity Shares Table No. 4.12 STATEMENT SHOWING EARNINGS PER SHARE (in crores) YEAR NET PROFIT AFTER TAX AND DIVIDEND NUMBER OF EQUITY SHARES RATIO (Rs.) 2006-2007 94.34 5.9165 15.94 2007-2008 110.37 9.2153 11.97 2008-2009 191.41 9.2215 20.75 2009-2010 174.88 9.2244 18.95 2010-2011 234.64 9.0141 26.03 The EPS is a good measure of profitability. Preference dividend is deducted from net profit after interest and tax to find out the net income available for equity shareholders. The performance and prospects of the company are affected by EPS. EPS calculated for a number of years indicate whether or not earnings power of the company has increased or not. The table above explains that the EPS for the last five years has shown a fluctuating trend. EPS which was Rs. 15.94 in 2007 dropped to Rs. 11.97 in 2008 which again increased to Rs. 20.75 in 2009. But there was a fall in 2010 to Rs. 18.95 which increased to Rs. 26.03 in 2011. EPS was at peak in this year.
  • 48. 48 Figure 4.12 Graph showing Earnings per Share of for the years March 2007 to March 2011 EARNINGS PER SHARE Source – Table 4.12 3. RETURN ON CAPITAL EMPLOYED Return on capital employed establishes the relationship between profits and the capital employed. It is the primary ratio and is most widely used to measure the overall profitability and efficiency of the business. There are three classifications given to capital employed: A).Gross Capital Employed = Fixed Assets + Current Assets B). Net Capital Employed = Total Assets – Current Liabilities C). Proprietors’ Capital Employed = Fixed Assets + Current Assets – Outsiders’ liabilities Return on Net Capital Employed = Profit before Interest and Tax Net Capital Employed 0 5 10 15 20 25 30 2007 2008 2009 2010 2011
  • 49. 49 Table No. 4.13 STATEMENT SHOWING RETURN ON CAPITAL EMPLOYED (in crores) YEAR NET PROFITBEFORE INTEREST AND TAX NET CAPITAL EMPLOYED RATIO (%) 2006-2007 119.99 320.23 37 2007-2008 168.6 933.18 18 2008-2009 291.35 1243.69 23 2009-2010 272.39 1349.36 20.1 2010-2011 322.29 1578.3 20.4 The owners are interested in knowing the profitability of the business in relation to amounts invested in it. A high percentage of return on capital employed will satisfy the owners that their money is profitably utilized. From the table above it is understood that the trend of the return on capital employed is highly fluctuating. The trend which was 37% in 2007 fell to 18% which increased to 23% in 2009. But the rate again dropped down to 20.1% which later in 2011 showed a slight increase to 20.4%. Rate was at peak in 2007 (37%) and lowest in 2008 (18%). Figure 4.13 Graph showing Return on capital employed for the years March 2007 to 2011 RETURN ON CAPITAL EMPLOYED Source – Table 4.13 0 10 20 30 40 2007 2008 2009 2010 2011
  • 50. 50 4. DIVIDEND PAY- OUT RATIO Dividend payout ratio is calculated to find the extent to which Earnings per Share have been retained in the business. It is an important ratio because ploughing back of profits enables a company to grow and pay more dividends in future. Pay- out Ratio = Dividend per Equity Share Earnings per Share Table No. 4.14 STATEMENT SHOWING DIVIDEND PAY-OUT RATIO (in Rs.) YEAR DIVIDEND PER EQUTY SHARE EPS RATIO (%) 2006-2007 .4 15.94 2.5 2007-2008 .6 11.97 5 2008-2009 1.6 20.75 8 2009-2010 1.75 18.95 9 2010-2011 2.75 26.03 11 Pay-out ratio is very important from shareholders’ point of view, as it tells him that if a company has used wholly or substantially the whole of its earnings for paying dividend and retained nothing for future growth ad expansion purposes, then there will be very dim chances of capital appreciation in the price of shares of such company. In other words, an investor who is more interested in capital appreciation must look for a company having low pay-out ratio. The table above showing pay-out ratio shows an increasing trend. The rate which was 2.5% in 2007 increased to 11% in 2011. It means there is less chance for capital appreciation, because the payment of dividend is low.
  • 51. Graph showing Dividend pay E. LEVERAGE RATIOS 1. CAPITAL GEARING RATIO The term ‘capital gearing’ is used to describe the relationship between equity share capital including reserves and surplus to preference share capital and other interest bearing loans. If preference share capital and other fixed interest bearing loans exceed the equity share capital and including reserves, the firm is said to be highly geared and if vice versa, the firm is said to be in low gear. Capital Gearing Ratio = Equity Share capital + Reserves and surplus Capital Gearing Ratio = Fixed Income Bearing Funds 0 2 4 6 8 10 12 51 Figure 4.14 Graph showing Dividend pay-out ratio for the years March 2007 to DIVIDEND PAY-OUT RATIO Source – Table 4.14 LEVERAGE RATIOS 1. CAPITAL GEARING RATIO The term ‘capital gearing’ is used to describe the relationship between equity share capital including reserves and surplus to preference share capital and other interest bearing loans. If preference share capital and other fixed interest bearing loans exceed the equity share capital and including reserves, the firm is said to be highly geared and if vice versa, the firm is said to be in low gear. aring Ratio = Equity Share capital + Reserves and surplus Preference Share Capital + Long-Term Debt bearing fixed interest Capital Gearing Ratio = Fixed Income Bearing Funds Total Capital Employed 0 2 4 6 8 10 12 2007 2008 2009 2010 2011 2007 to March 2011 The term ‘capital gearing’ is used to describe the relationship between equity share capital including reserves and surplus to preference share capital and other fixed interest bearing loans. If preference share capital and other fixed interest bearing loans exceed the equity share capital and including reserves, the firm is said to be highly aring Ratio = Equity Share capital + Reserves and surplus
  • 52. STATEMENT SHOWING CAPITAL GEARING RATIO YEAR CAPITAL & RESERVES 2006-2007 2007-2008 2008-2009 2009-2010 2010-2011 The table representing capital gearing ratio explains that the company was low geared in 2007, 2010 and 2011, and the ratio was 163:1, 1.3:1 and 1.6:1 respectively. In 2008 and 2009, the company was in high gear i.e. .87:1 and .96:1. Graph showing Capital gearing rat 52 Table No. 4.15 STATEMENT SHOWING CAPITAL GEARING RATIO (in crores) EQUITY CAPITAL & RESERVES PREFERENCE CAPITAL & LONG-TERM DEBT (NO. OF TIMES) 300.8 1.84 439.36 506.79 614.07 640.97 770.36 586.93 969.32 614.07 capital gearing ratio explains that the company was low geared in 2007, 2010 and 2011, and the ratio was 163:1, 1.3:1 and 1.6:1 respectively. In 2008 and 2009, the company was in high gear i.e. .87:1 and .96:1. Figure 4.15 Graph showing Capital gearing ratio for the years March 2007 to March CAPITAL GEARING RATIO Source – Table 4.15 0 100 200 2007 2008 2009 2010 2011 (in crores) RATIO (NO. OF TIMES) 163 .87 .96 1.3 1.6 capital gearing ratio explains that the company was low geared in 2007, 2010 and 2011, and the ratio was 163:1, 1.3:1 and 1.6:1 respectively. In 2008 March 2011
  • 55. 55 INTERPRETATION While interpreting the comparative balance sheet, the interpreter is expected to study the following aspects: 1. Current financial position and the liquidity position 2. Long-term financial position 3. Profitability of the concern The comparative balance sheet analysis of the past five years from 2007 to 2011 reveals that, the changes in the balance sheet items has shown an uneven movement. From a close view into the statement it is understood that, the net working capital has shown a tremendous increase by Rs. 568.72 Crores in the year 2008. But it fell down by Rs. 78.48 Crores in 2009. Though there was a slight increase in 2010 by Rs. 10.61 Crores, the decline was at peak in 2011 i.e. 116.49 Crores. This is understood by the analysis of current assets and current liabilities. Working capital is the excess of current assets over current liabilities. An increase in working capital indicates the improvement in the current financial position of the business. Comparative analysis carried out reveals that, in the case of current assets, the rate increased by 308% in 2008 and it was the year in which the rate of increase in current assets was at peak. In the following year too there was an increase but at a lesser rate by 3.83%. Despite of increase in the previous years, the same declined by 34% in 2010 and the year 2011 showed a slight increase in the rate by 15.86%. In the case of current liabilities too there was an increase by 81.57% in 2009, though at a lesser rate. The rate later fell down by 12.66% in 2010. In spite of all these, there was a stunning increase in the rate by 262% in 2011 which turned unfavorable. The long-term financial position of the concern can be analyzed by studying the changes in fixed assets, long-term liabilities and share capital. Fixed assets are generally financed by the issue of either long-term securities or fresh share capital. The comparative statement explains that, there was a stunning increase in long-term securities and share capital which was 4265% in 2008. But the increase was only 26% in 2009. Later the funds fell down by 85 in 2010. And though there was an increase in 2011, it was only by
  • 56. 56 4.4%. At the same time, there was an increase in fixed assets by 19.5% and 74.4% in 2008 and 2011 respectively. In the years between i.e. 2009 and 2010, there was a decline in investment in fixed assets by 7.1% and 4.8%. The increase was at peak in 2011 and the decline was on the top in 2009. It confirms that, not only fixed assets but also a part of working capital is financed through long-term sources in the years 2008 and 2009. It is because long-term funds increase exceeds the increase in fixed assets. Where as in 2010 and 2011, since the increase in fixed assets is more than increase in long-term funds, it is understood that fixed assets have not only been financed from long-term sources but a part of the same has been financed from working capital. But it is not a wise financial policy. One more important thing is that, the company has financed major part of long- term funds through the issue of share capital except in 2011. In that year long-term funds were given preference. When the aspect of profitability is concerned, we have to study about the increase or decrease in the retained earnings and other reserves. The statement projects that, the reserves of the company has never declined. That means major part of the earnings of the company has been kept as retained earnings for future expansion and development purposes. This is understood from the ratio analysis of dividend pay-out. The capital work-in-progress increased by 93.9% in 2008, 12.6% in 2009 and 14.9% in 2010. Though the capital work-in-progress increased at a decreased rate 2009 and 2010, the rate in 2010 was higher when compared to the rate in 2009.Unfortunately the rate declined by 66% in 2011. The rate of investment never declined in all these five years. The increase in the rate was at peak in 2009i.e. 930% when compared to 2008. But increase in the rate was only 20.4% in 2010. There is nothing much to explain about miscellaneous expenses or preliminary expenses as they cannot be considered as assets as they are actually deferred expenses.
  • 59. 59 INTERPRETATION The trend analysis of Balance sheet reveals that the current assets showed a decrease from 2008 to 2010 when compared to the base year 2007. Current assets which were 407.6% in 2008 fell to 390.6%. On the other hand, current liabilities showed a decrease only in 2010(870.4%). In 2011, the same acquired a tremendous increase to 3152.6% which is more than the increase in current assets. Share capital projected a decreasing trend. While reserves and investments projected an increasing trend. The trend of fixed assets was uneven. It decreased to 111% in 2009 and 106% in 2010 from 120% in 2008. Work-in progress registered an increase except in 2011. It fell to 85% in 2011 from 194% in 2008. Secured loans decreased in 2008, 2009 and 2010 to 63%, 21%, 5% and though there was an increase in 2011, it was only 42%. Unsecured loans were at peak in 2009(127%). It fell to 116% in 2010 and increased to 121% in 2011.
  • 61. 61 INTERPRETATION OF COMPARATIVE INCOME STATEMENT Geodesic Ltd .a Technology Company does not engage in trading of retail physical products. Operating income is taken as sales and operating expenses is taken as cost of sales. As a first step of Analysis firstly increase or decrease in operating income should be compared with increase or decrease in operating expenses. An increase in operating profit will result from the increase in sales/income from operations and control of operating expenses and vice versa decrease in operating profit. The comparative income statement presented above reveals that operating income increased by 93% in 2009 which was only 55% in 2008. At the same time operating expenses also registered an increase by 125% in 2009 from 92% in 2008. Though the increase in operating expense was more than the increase in operating income, operating profit also projected an increase to 73% in 2009. In the case of non-operating income, the same showed an increase by 91% in 2009 which was 87% in 2008. Non-operating expenses which were 60% in 2008 increased to 100%. As a result Profit before Tax also increased by 66% in 2009 from 35% in 2008 was high profits of 2008 and 2009 didn’t tell. But the year 2010 was not at all favorable to the company. The fall in operating income was -1.3% and operating expenses was -0.16%. Fall in operating income was more than fall in operating expense which was resulted in decline of operating profit by -2.3%. Similarly the non-operating expense increased by 17% which turned the profit before tax negative. Though there was a refund of income tax in the year 2010, the Net Profit for the year declined by -8.6%. This is only due to huge fall in non-operating income and increase in non-operating expenses. The operating profit of the year 2011 increased by 19% only because of the increase in operating income by 38%. There wasn’t appreciable increase due to increase in operating expenses which was 60%. Non-operating income and expenses for the year declining by -11.3% and -15%, PBT increased by 37% only because the rate of decline of non-operating expense was more than decline in the rate of non- operating income. Net profit for the year also increased by34%. Though there were fluctuations in Income Statement, it is understood from the Ratio analysis operating profit and net profit of the company has shown a decreasing trend from 2007 to2011.
  • 62. 62 CHAPTER- 5 FINDINGS, SUGGESTIONS AND CONCLUSIONS FINDINGS Just like a doctor examines his patient by recording his body temperature, blood pressure, etc. before making his conclusion regarding the illness and before giving his treatment, a financial analyst analyses the financial statements with various tools of analysis before commenting upon the financial health or weaknesses of an enterprise. This is essential to bring out the mystery behind the figures in financial statements. 1. A current ratio equal to or near to the rule of thumb 2:1 i.e. current assets double the current liabilities is considered to be satisfactory. The idea of having double the current assets as compared to current liabilities is tom provide for delays and losses in the realization of current assets. Geodesic Ltd. hasn’t yet reached this ideal level in all these years except in 2011. The ratio was 2.73:1. But the ratio hasn’t gone below 2:1. 2. As a rule of thumb, quick ratio of 1:1 is considered satisfactory. It is generally thought that if quick assets are equal to current liabilities then the concern may be able to meet its short-term obligations. The study explains that the firm have more liquid assets than current liabilities and the ratio was lowest in 2011i.e.2.7:1 and peak in 2007 i.e. 18.99:1 3. From the shareholders point of view, a low debt-equity ratio is unfavorable and it indicates that the firm has not been able to use low-cost outsiders’ funds to magnify their earnings. And from the perspective of outsiders, a low ratio is favorable as a high proportion of funds provide larger safety for them during liquidation. However, the study explains that the ratio was more than the generally accepted norm of 1:1 in 2008 and 2009. 4. From the analysis of funded debt to total capitalization, it is understood that the ratio of all the five years is satisfactory as it is less than 55% the maximum ideal level.