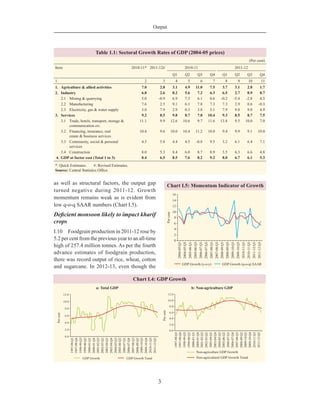
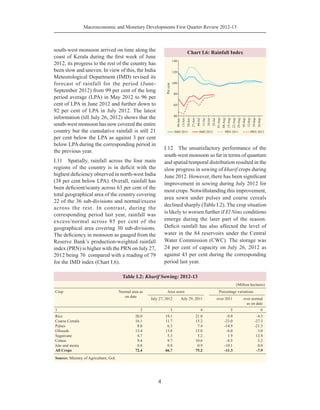
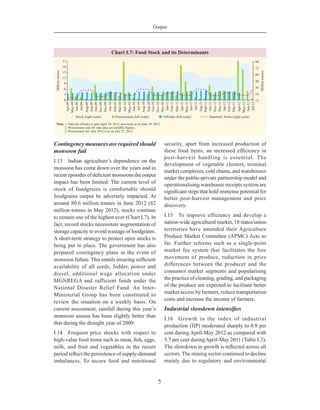
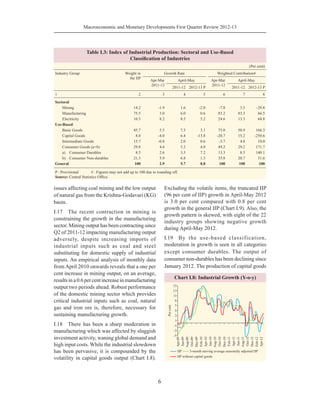
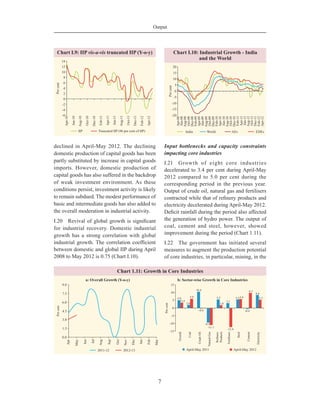
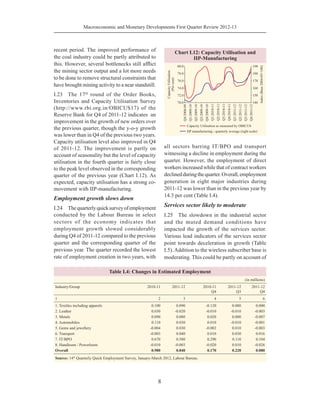
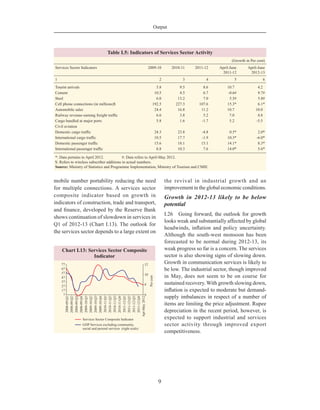
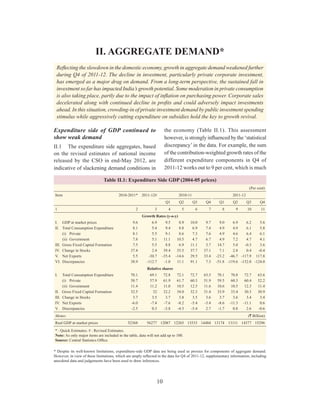
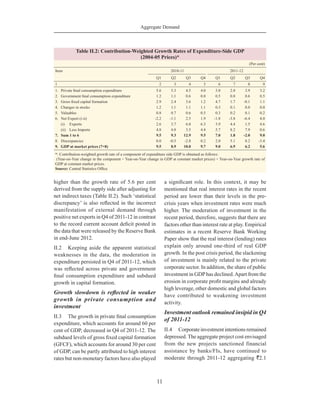
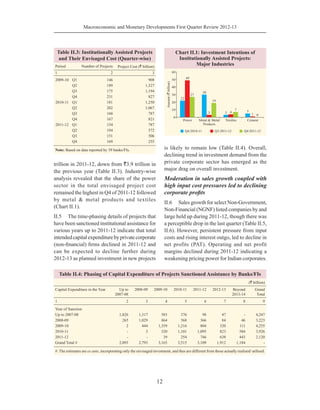
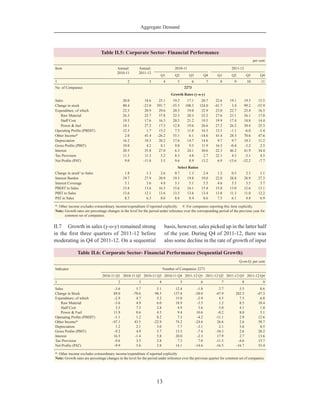
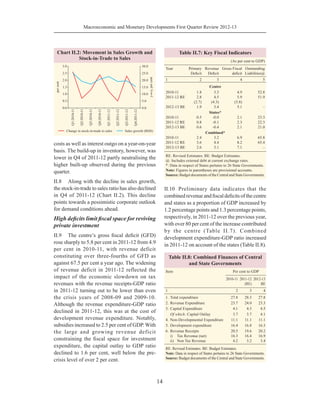
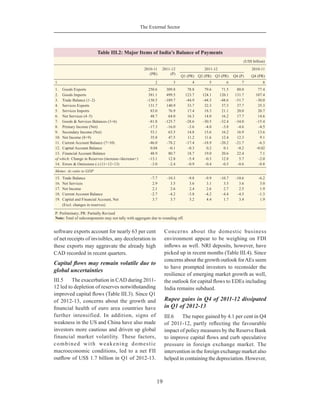
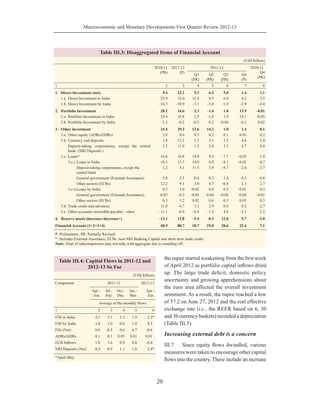
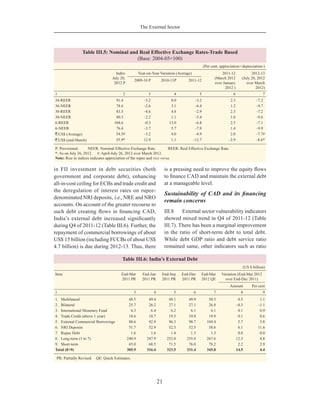
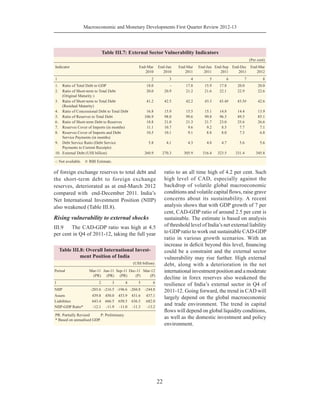
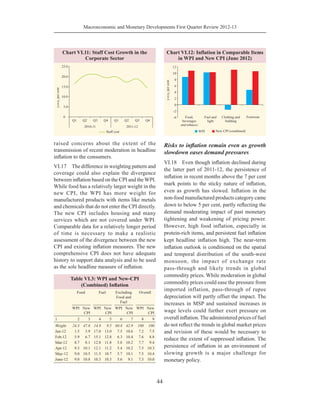
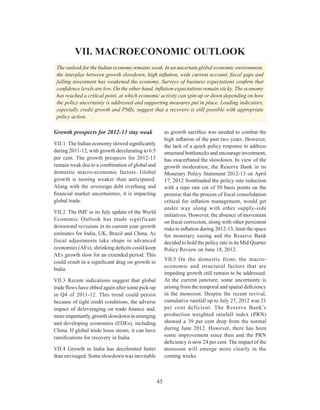
Macroeconomic and
Monetary Developments
First Quarter Review 2012-13
Reserve Bank of India
Mumbai
Contents
	 Overview	 i - iii
I. 	 Output	 1 - 9
		
II. 	 Aggregate Demand	 10 - 16
		
III.	 The External Sector	 17 - 22
		
IV.	 Monetary and Liquidity Conditions	 23 - 29
		
V.	 Financial Markets	 30 - 36
		
VI.	 Price Situation	 37 - 44
		
VII.	 Macroeconomic Outlook	 45 - 50
Overview
i
1.	 Monetary and liquidity conditions have
eased during 2012-13 as cuts in cash reserve
ratio (CRR) and policy rates worked through
the system. The Reserve Bank cut CRR by 125
basis points (bps) and front-loaded the policy
rate reduction by cutting the repo rate by 50 bps
in April 2012. It, however, paused at its Mid-
Quarter Review in June 2012 factoring in
inflation persistence and macro-economic risks
that emanated from lack of momentum in fiscal
consolidation. Significantly, while there is slack
in the economy, inflation remains persistent.
Going forward, monetary policy space needs to
be created through fiscal adjustment and
structuralmeasurestoimprovesupplyconditions
and boost the investment climate, so that the
revival is supported in a non-inflationary
manner.
2.	 Growth in Q1 of 2012-13 is likely to have
stayed low after having dropped to a 29-quarter
low in the sequentially preceding quarter. While
the slowdown has been primarily driven by
investment, more recently and to a lesser extent,
consumption has also slowed. Global growth
prospects have worsened during Q1 of 2012-13,
thus putting domestic recovery at greater risk.
Inflation, after falling in Q4 of 2011-12 has
turned sticky. Price pressures remain with
significant suppressed inflation in domestic
energy prices and rupee depreciation, which
have partly off-set the gains from lower global
commodity prices.
Global Economic Conditions
Global growth prospects worsen with
growth also slowing in EDEs
3.	 Debt overhang and persistent euro area
problems coupled with still incomplete
adjustment of the US economy from the 2008
financial crisis are keeping growth in Advanced
Economies (AEs) low. Deceleration in growth
in BRICS economies, which have so far been
the drivers of growth in Emerging and
Developing Economies (EDEs), has worsened
global growth prospects further.
Financial market stress accentuates
4.	 Global financial market stress eased
significantly during Q1 of 2012 after ECB made
a large liquidity injection, but was accentuated
again by the deepening crisis in the euro area,
especially in Greece and Spain. The recent
Libor fixing case has also added to the
uncertainty by drawing attention to how a few
large global financial institutions allegedly
manipulated one of the most commonly used
market rates. Meanwhile, falling commodity
prices and subdued inflation in large economies
provided additional space for monetary easing.
This fresh round of monetary easing has,
however, increased the risks of inflation in EDEs
even while inflation is likely to remain subdued
in most AEs.
Indian Economy: Developments and
Outlook
Output
Growth risks accentuate, negative output
gap likely to persist during 2012-13
5.	 Economic activity slowed down
considerably during Q4 of 2011-12 and has
likely stayed weak during Q1 of 2012-13.
Growth in 2012-13 is likely to remain below
potential. Newer risks to growth have arisen
from slowing global trade, domestic supply
MACROECONOMIC AND
MONETARY DEVELOPMENTS
FIRST QUARTER REVIEW 2012-13
Overview
Macroeconomic and Monetary Developments First Quarter Review 2012-13
ii
bottlenecks of industrial inputs, coal and
electricity and less-than-satisfactory monsoon
so far. Services growth is also showing signs of
slowing in line with slowing industrial growth
and weak global economy.
Aggregate Demand
Needforcurtailingsubsidiesandpropelling
a government investment stimulus to
address investment slack
6.	 Aggregate demand weakened further
during Q4 of 2011-12. The investment slowdown
seen since H2 of 2010-11 has extended to Q4 of
2011-12.Apart from the sharp fall in investment,
private consumption moderated during Q4 of
2011-12. Fiscal and monetary space to stimulate
the economy remain limited in the presence of
an already large fiscal deficit and persistent
inflation. The fiscal deficit target for 2012-13 is
at a risk of being breached due to likely
overshooting of subsidies and shortfall in
receipts. To address this risk, fiscal space needs
to be created by curtailing subsidies and
significantly boosting government capital
expenditures to provide an investment stimulus
to the economy, which would help crowd-in
private investment.
External Sector
CADrisksandconcernsaboutsustainability
persist
7.	 Softening of global crude oil prices and
moderation of gold imports may bring some
relief to the balance of payments, but Current
Account Deficit (CAD) risks remain significant
for 2012-13. Slowing global growth and trade
are likely to keep expansion in exports of goods
and services low. Services exports net of
services imports have declined notably in Q1
of 2012-13. With lower growth, the sustainable
level of CAD has also come down to around 2.5
per cent of GDP. Financing a large CAD may
pose difficulties in face of slowing foreign
investment flows. External debt is likely to rise
as increased debt flows bridge financing gap.
As a result, external vulnerability indicators
may deteriorate and would make economy
susceptible to external shocks unless trade
balance is compressed and FDI flows improve.
Monetary and Liquidity Conditions
Monetary and liquidity conditions ease
during 2012-13
8.	 A 50 basis points (bps) rate cut, following
a 125 bps CRR reduction, coupled with active
open market operation purchases have
significantly eased monetary and liquidity
conditions during 2012-13 so far. While these
measures are supportive of growth, the rate of
deposit expansion has slowed which could
adversely affect liquidity. Credit growth has
picked up in the current financial year and is in
line with the indicative projections. The flow of
resources from non-bank sources has also been
good. In spite of a relative improvement in
monetary and liquidity conditions during Q1 of
2012-13, the Reserve Bank would need to
closely monitor the liquidity and monetary
conditions ahead so that they remain consistent
with the evolving growth-inflation mix.
Financial Markets
Currency and equity markets remained
under pressure
9.	 Spillovers from global financial market
uncertainties and waning investor confidence
amidstdeterioratingmacroeconomicconditions,
kept domestic currency and equity markets
under pressure. The rupee depreciated by nearly
10 per cent during Q1 of 2012-13, before
staging some recovery in July 2012. Equity
markets remained range bound, with sharp
gains in May 2012 being nullified during June
2012. Money market rates and G-sec yields
eased reflecting improved liquidity and falling
global commodity prices. However, going
forward, financial stress is likely to remain with
falling earnings and high leverage for non-
financial firms.
Overview
iii
Price Situation
Inflation pressures persist despite
weakening growth momentum
10.	 Headline WPI inflation persisted above
7 per cent, while consumer price inflation, as
per the new CPI, remains in double-digits.
Inflationary pressures have persisted, with
significant contribution from food and energy
segments. Going forward, the decline in global
commodity prices will provide some relief, but
the gains have been partly offset by rupee
depreciation. While core inflationary pressures
are currently muted, a continued rise in real
wages could spill over to core inflation.
Persistence of inflation, even as growth is
slowing, has emerged as a major challenge for
monetary policy.
Macroeconomic Outlook
Outlook remains weak, need to support
recovery in a non-inflationary manner
11.	 Growth risks in 2012-13 have been
amplified by decelerating global trade and
domestic supply constraints. At the same time,
inflation risks remain significant due to
suppressed inflation, poor supply responses
and deficit monsoon conditions. Various
surveys suggest that business and consumer
confidence remain low. Revival of investor
confidence would, therefore, need to be
supported by addressing concerns over policy
stasis, while putting in place complimentary
actions that address macro-economic
weaknesses.
Output
1
I. OUTPUT
The Indian economy grew at a slower pace than its potential in 2011-12. Growth slowed down in
all three sectors of the economy through the course of the year. Moderation in industrial growth
persisted in the midst of domestic supply constraints, a clouded domestic policy environment and
a deteriorating external outlook. The services sector also under-performed given its inter-linkages
with the industrial sector. The available information suggests that slowdown has extended into
Q1 of 2012-13, and output expansion in 2012-13 is likely to stay below the potential.
Persistent euro area problems and
weakening growth in EDEs may drag
global growth in 2012
I.1	 Global growth, which was better than
expected during Q1 of 2012, weakened sharply
during Q2 mainly due to increased uncertainties
in the euro area and dampened demand
conditions in emerging and developing
economies (EDEs). Global growth projection
for the year 2012 by the IMF (World Economic
Outlook Update, July 2012) is 3.5 per cent. The
growth projection for the EDEs has been revised
downward (by 0.1 per cent from the earlier
projection in WEO,April 2012) to 5.6 per cent.
I.2	 The deceleration in growth in the BRICS
nations, which have so far been drivers of EDEs’
growth, has added a new dimension to the global
slowdown, making near-term recovery difficult.
Growth in China, India, Brazil and SouthAfrica
has decelerated since 2011, while that in Russia
has been low since 2008.
I.3	 The euro area crisis has strongly affected
the global economic outlook through effects on
confidence as well as trade and capital flows.
While economic activity in the euro area
diminished or stagnated in Q4 of 2011 and Q1
of 2012, the US economy grew at a modest pace
(Chart I.1). As per advance estimates, US
growth decelerated to 1.5 per cent in Q2 of 2012.
Even though the Japanese economy expanded
at an annualised rate of 4.7 per cent in Q1 of
2012, it may slow down ahead as the impact of
reconstruction spending wears off.
I.4	 The Institute for Supply Management
(ISM) report on US manufacturing suggests a
contraction in economic activity in the
manufacturing sector in June 2012 (PMI of
49.7), the first time since July 2009. The
uncertainty over the path of fiscal policy, which
is set to tighten abruptly at the beginning of
2013 or what is termed the ‘fiscal cliff’, could
further weaken the US growth later this year.
Even though Germany recorded 0.5 per cent
q-o-q growth in Q1 of 2012 (as against a
contraction in Q4 of 2011), business sentiment
fell for the second consecutive month in June
to a two-year low. The UK economy witnessed
its third consecutive quarterly contraction as the
preliminary estimates indicate 0.7 per cent q-o-q
decline in GDP in Q2 of 2012.
I.5	 IntheUS,theuptickintheunemployment
rate to 8.2 per cent since May 2012 has
compounded the sense that the economy is
Macroeconomic and Monetary Developments First Quarter Review 2012-13
2
going through a sluggish patch. The
unemployment rate across the euro area rose to
a new high of 11.1 per cent in May 2012, the
highest level since records began in January
1995 (Chart I.2). The unemployment rate for
people below the age of 25 was even higher at
22.6 per cent. According to the OECD, the
unemployment rate in the advanced economies
(AEs) will stay high till the end of 2013.
I.6	 The weak economic activity in the AEs
is impacting the EDEs. The reduced demand for
exports and weak capital flows combined with
their own domestic policy shortcomings has
resulted in subdued economic performance in
the EDEs, especially in the case of India and
Brazil. China’s growth in Q2 of 2012 fell to a
three-year low of 7.6 per cent.
Dampening trade volume growth is
affecting EDEs exports
I.7	 The slowing growth of theAEs and EDEs
hasresultedinsignificantcoolingofinternational
trade in Q2 of 2012 after a modest rebound in
Q1 of 2012. World trade growth decelerated
from its peak of 20 per cent (CPB World Trade
Monitor Index) in May 2010 to as low as 2.3
per cent inApril 2012 (Chart I.3). The downturn
in Europe and resultant fall in import demand
has adversely affected the EDEs as the EU
constitutes their single largest market. There
was a sharp deceleration in both China’s exports
and imports during H1 of 2012 to 9.2 per cent
and 6.6 per cent, respectively (23.9 per cent and
27.9 per cent in H1 of 2011). Continued
deceleration of imports into China does not
augur well for other EDEs.
Growth slowdown persists during Q4 of
2011-12 in India
I.8	 The sequential slowdown in growth
witnessed in the first three quarters of 2011-12
persisted with the fourth quarter registering
growth of 5.3 per cent (Table I.1). This was the
lowest y-o-y growth in any quarter of the
previous seven years, including the crisis year
of 2008-09. The sharp slowdown in growth in
Q4 of 2011-12 is largely attributable to the
contraction in value added in the manufacturing
sub-sector and deceleration in most services
sub-sectors.The downturn reflects the continued
high inflation as well as the impact of other
adverse global and domestic macro-economic
factors. For 2011-12 as a whole, growth
decelerated sharply to 6.5 per cent from 8.4 per
cent in the previous two years.
I.9	 The potential growth rate, which is the
maximum rate of growth that the economy can
sustain without creating macroeconomic
imbalances, moderated during 2009-10 to 2011-
12 from around 8.0 per cent to around 7.5 per
cent (Chart I.4). The output gap was positive
during 2009-10 and 2010-11. With the growth
rate declining by nearly 2 percentage points in
2011-12, reflecting the impact of both cyclical
Output
3
as well as structural factors, the output gap
turned negative during 2011-12. Growth
momentum remains weak as is evident from
low q-o-q SAAR numbers (Chart I.5).
Deficient monsoon likely to impact kharif
crops
I.10	 Foodgrain production in 2011-12 rose by
5.2 per cent from the previous year to an all-time
high of 257.4 million tonnes. As per the fourth
advance estimates of foodgrain production,
there was record output of rice, wheat, cotton
and sugarcane. In 2012-13, even though the
Table 1.1: Sectoral Growth Rates of GDP (2004-05 prices)
(Per cent)
Item 2010-11* 2011-12# 2010-11 2011-12
Q1 Q2 Q3 Q4 Q1 Q2 Q3 Q4
1 2 3 4 5 6 7 8 9 10 11
1.	 Agriculture & allied activities 7.0 2.8 3.1 4.9 11.0 7.5 3.7 3.1 2.8 1.7
2.	 Industry 6.8 2.6 8.2 5.6 7.2 6.3 6.5 2.7 0.9 0.7
	 2.1	 Mining & quarrying 5.0 -0.9 6.9 7.3 6.1 0.6 -0.2 -5.4 -2.8 4.3
	 2.2	 Manufacturing 7.6 2.5 9.1 6.1 7.8 7.3 7.3 2.9 0.6 -0.3
	 2.3	 Electricity, gas & water supply 3.0 7.9 2.9 0.3 3.8 5.1 7.9 9.8 9.0 4.9
3.	 Services 9.2 8.5 9.8 8.7 7.8 10.4 9.3 8.5 8.7 7.5
	 3.1	 Trade, hotels, transport, storage &
communication etc.
11.1 9.9 12.6 10.6 9.7 11.6 13.8 9.5 10.0 7.0
	 3.2	 Financing, insurance, real
estate & business services
10.4 9.6 10.0 10.4 11.2 10.0 9.4 9.9 9.1 10.0
	 3.3	 Community, social & personal
services
4.5 5.8 4.4 4.5 -0.8 9.5 3.2 6.1 6.4 7.1
	 3.4	Construction 8.0 5.3 8.4 6.0 8.7 8.9 3.5 6.3 6.6 4.8
4.	 GDP at factor cost (Total 1 to 3) 8.4 6.5 8.5 7.6 8.2 9.2 8.0 6.7 6.1 5.3
*: Quick Estimates. #: Revised Estimates.
Source: Central Statistics Office.
Macroeconomic and Monetary Developments First Quarter Review 2012-13
4
south-west monsoon arrived on time along the
coast of Kerala during the first week of June
2012, its progress to the rest of the country has
been slow and uneven. In view of this, the India
Meteorological Department (IMD) revised its
forecast of rainfall for the period (June-
September 2012) from 99 per cent of the long
period average (LPA) in May 2012 to 96 per
cent of LPA in June 2012 and further down to
92 per cent of LPA in July 2012. The latest
information (till July 26, 2012) shows that the
south-west monsoon has now covered the entire
country but the cumulative rainfall is still 21
per cent below the LPA as against 3 per cent
below LPA during the corresponding period in
the previous year.
I.11	 Spatially, rainfall across the four main
regions of the country is in deficit with the
highest deficiency observed in north-west India
(38 per cent below LPA). Overall, rainfall has
been deficient/scanty across 63 per cent of the
total geographical area of the country covering
22 of the 36 sub-divisions and normal/excess
across the rest. In contrast, during the
corresponding period last year, rainfall was
excess/normal across 85 per cent of the
geographical area covering 30 sub-divisions.
The deficiency in monsoon as gauged from the
Reserve Bank’s production-weighted rainfall
index (PRN) is higher with the PRN on July 27,
2012 being 76 compared with a reading of 79
for the IMD index (Chart I.6).
I.12	 The unsatisfactory performance of the
south-west monsoon so far in terms of quantum
and spatial/temporal distribution resulted in the
slow progress in sowing of kharif crops during
June 2012. However, there has been significant
improvement in sowing during July 2012 for
most crops. Notwithstanding this improvement,
area sown under pulses and coarse cereals
declined sharply (Table I.2). The crop situation
is likely to worsen further if El Nino conditions
emerge during the later part of the season.
Deficit rainfall has also affected the level of
water in the 84 reservoirs under the Central
Water Commission (CWC). The storage was
24 per cent of capacity on July 26, 2012 as
against 43 per cent during the corresponding
period last year.
Table I.2: Kharif Sowing: 2012-13
 (Million hectares)
Crop
 
Normal area as
on date
Area sown Percentage variations
July 27, 2012 July 29, 2011 over 2011 over normal
as on date
1 2 3 4 5 6
Rice 20.0 19.1 21.0 -9.0 -4.5
Coarse Cereals 16.1 11.7 15.2 -23.0 -27.3
Pulses 8.0 6.3 7.4 -14.9 -21.3
Oilseeds 13.4 13.8 15.0 -8.0 3.0
Sugarcane 4.7 5.3 5.2 1.9 12.8
Cotton 9.4 9.7 10.6 -8.5 3.2
Jute and mesta 0.8 0.8 0.9 -10.1 0.0
All Crops 72.4 66.7 75.2 -11.3 -7.9
Source: Ministry of Agriculture, GoI.
Output
5
Contingency measures are required should
monsoon fail
I.13	 Indian agriculture’s dependence on the
monsoon has come down over the years and in
recent episodes of deficient monsoons the output
impact has been limited. The current level of
stock of foodgrains is comfortable should
foodgrains output be adversely impacted. At
around 80.6 million tonnes in June 2012 (82
million tonnes in May 2012), stocks continue
to remain one of the highest ever (Chart I.7). In
fact, record stocks necessitate augmentation of
storage capacity to avoid wastage of foodgrains.
A short-term strategy to protect open stocks is
being put in place. The government has also
prepared contingency plans in the event of
monsoon failure. This entails ensuring sufficient
availability of all seeds, fodder, power and
diesel, additional wage allocation under
MGNREGA and sufficient funds under the
National Disaster Relief Fund. An Inter-
Ministerial Group has been constituted to
review the situation on a weekly basis. On
current assessment, rainfall during this year’s
monsoon season has been slightly better than
that during the drought year of 2009.
I.14	 Frequent price shocks with respect to
high-value food items such as meat, fish, eggs,
milk, and fruit and vegetables in the recent
period reflect the persistence of supply-demand
imbalances. To secure food and nutritional
security, apart from increased production of
these food items, an increased efficiency in
post-harvest handling is essential. The
development of vegetable clusters, terminal
market complexes, cold chains, and warehouses
under the public-private partnership model and
operationalising warehouse receipts system are
significant steps that hold immense potential for
better post-harvest management and price
discovery.
I.15	 To improve efficiency and develop a
nation-wide agricultural market, 18 states/union
territories have amended their Agriculture
Produce Market Committee (APMC) Acts so
far. Further reforms such as a single-point
market fee system that facilitates the free
movement of produce, reduction in price
differences between the producer and the
consumer market segments and popularising
the practice of cleaning, grading, and packaging
of the produce are expected to facilitate better
market access by farmers, reduce transportation
costs and increase the income of farmers.
Industrial slowdown intensifies
I.16	 Growth in the index of industrial
production (IIP) moderated sharply to 0.8 per
cent during April-May 2012 as compared with
5.7 per cent duringApril-May 2011 (Table I.3).
The slowdown in growth is reflected across all
sectors. The mining sector continued to decline
mainly due to regulatory and environmental
Macroeconomic and Monetary Developments First Quarter Review 2012-13
6
issues affecting coal mining and the low output
of natural gas from the Krishna-Godavari (KG)
basin.
I.17	 The recent contraction in mining is
constraining the growth in the manufacturing
sector. Mining output has been contracting since
Q2 of 2011-12 impacting manufacturing output
adversely, despite increasing imports of
industrial inputs such as coal and steel
substituting for domestic supply of industrial
inputs. An empirical analysis of monthly data
from April 2010 onwards reveals that a one per
cent increase in mining output, on an average,
resultsina0.6percentincreaseinmanufacturing
output two periods ahead. Robust performance
of the domestic mining sector which provides
critical industrial inputs such as coal, natural
gas and iron ore is, therefore, necessary for
sustaining manufacturing growth.
I.18	 There has been a sharp moderation in
manufacturing which was affected by sluggish
investment activity, waning global demand and
high input costs. While the industrial slowdown
has been pervasive, it is compounded by the
volatility in capital goods output (Chart I.8).
Excluding the volatile items, the truncated IIP
(96 per cent of IIP) growth in April-May 2012
is 3.0 per cent compared with 0.8 per cent
growth in the general IIP (Chart I.9). Also, the
growth pattern is skewed, with eight of the 22
industry groups showing negative growth
during April-May 2012.
I.19	 By the use-based classification,
moderation in growth is seen in all categories
except consumer durables. The output of
consumer non-durables has been declining since
January 2012. The production of capital goods
Table I.3: Index of Industrial Production: Sectoral and Use-Based
Classification of Industries
(Per cent)
Industry Group Weight in
the IIP
Growth Rate Weighted Contribution#
Apr-Mar
2011-12
April-May Apr-Mar
2011-12
April-May
2011-12 2012-13 P 2011-12 2012-13 P
1 2 3 4 5 6 7 8
Sectoral
	Mining 14.2 -1.9 1.6 -2.0 -7.8 3.3 -29.8
	Manufacturing 75.5 3.0 6.0 0.6 83.2 83.3 66.5
	Electricity 10.3 8.2 8.5 5.2 24.6 13.3 64.8
Use-Based
	 Basic Goods 45.7 5.5 7.3 3.1 75.0 50.9 166.3
	 Capital Goods 8.8 -4.0 6.4 -13.8 -20.7 15.2 -250.6
	 Intermediate Goods 15.7 -0.8 2.0 0.6 -3.7 4.8 10.0
	 Consumer Goods (a+b) 29.8 4.4 5.2 4.0 49.2 29.2 171.7
	 a)	 Consumer Durables 8.5 2.6 3.3 7.2 13.3 8.5 140.1
	 b)	 Consumer Non-durables 21.3 5.9 6.8 1.3 35.8 20.7 31.6
General 100 2.9 5.7 0.8 100 100 100
P : Provisional 	 # : Figures may not add up to 100 due to rounding off.
Source: Central Statistics Office.
Output
7
declined in April-May 2012. The declining
domestic production of capital goods has been
partly substituted by increase in capital goods
imports. However, domestic production of
capital goods has also suffered in the backdrop
of weak investment environment. As these
conditions persist, investment activity is likely
to remain subdued. The modest performance of
basic and intermediate goods has also added to
the overall moderation in industrial activity.
I.20	 Revival of global growth is significant
for industrial recovery. Domestic industrial
growth has a strong correlation with global
industrial growth. The correlation coefficient
between domestic and global IIP during April
2008 to May 2012 is 0.75 (Chart I.10).
Input bottlenecks and capacity constraints
impacting core industries
I.21	 Growth of eight core industries
decelerated to 3.4 per cent during April-May
2012 compared to 5.0 per cent during the
corresponding period in the previous year.
Output of crude oil, natural gas and fertilisers
contracted while that of refinery products and
electricity decelerated during April-May 2012.
Deficit rainfall during the period also affected
the generation of hydro power. The output of
coal, cement and steel, however, showed
improvement during the period (Chart 1.11).
I.22	 The government has initiated several
measures to augment the production potential
of core industries, in particular, mining, in the
Macroeconomic and Monetary Developments First Quarter Review 2012-13
8
recent period. The improved performance of
the coal industry could be partly attributed to
this. However, several bottlenecks still afflict
the mining sector output and a lot more needs
to be done to remove structural constraints that
have brought mining activity to a near standstill.
I.23	 The 17th
round of the Order Books,
Inventories and Capacity Utilisation Survey
(http://www.rbi.org.in/OBICUS17) of the
Reserve Bank for Q4 of 2011-12 indicates an
improvement in the growth of new orders over
the previous quarter, though the y-o-y growth
was lower than in Q4 of the previous two years.
Capacity utilisation level also improved in Q4
of 2011-12. The improvement is partly on
account of seasonality but the level of capacity
utilisation in the fourth quarter is fairly close
to the peak level observed in the corresponding
quarter of the previous year (Chart I.12). As
expected, capacity utilisation has a strong co-
movement with IIP-manufacturing.
Employment growth slows down
I.24	 Thequarterlyquicksurveyofemployment
conducted by the Labour Bureau in select
sectors of the economy indicates that
employment growth slowed considerably
during Q4 of 2011-12 compared to the previous
quarter and the corresponding quarter of the
previous year. The quarter recorded the lowest
rate of employment creation in two years, with
all sectors barring IT/BPO and transport
witnessing a decline in employment during the
quarter. However, the employment of direct
workers increased while that of contract workers
declinedduringthequarter.Overall,employment
generation in eight major industries during
2011-12 was lower than in the previous year by
14.3 per cent (Table I.4).
Services sector likely to moderate
I.25	 The slowdown in the industrial sector
and the muted demand conditions have
impacted the growth of the services sector.
Various lead indicators of the services sector
point towards deceleration in growth (Table
I.5).Addition to the wireless subscriber base is
moderating. This could be partly on account of
Table I.4: Changes in Estimated Employment
(in millions)
Industry/Group 2010-11 2011-12 2010-11
Q4
2011-12
Q3
2011-12
Q4
1 2 3 4 5 6
1. Textiles including apparels 0.100 0.090 -0.120 0.080 0.000
2. Leather 0.030 -0.020 -0.010 -0.010 -0.003
3. Metals 0.090 0.080 0.020 0.000 -0.007
4. Automobiles 0.110 0.030 0.010 -0.010 -0.001
5. Gems and jewellery -0.004 0.030 -0.002 0.010 -0.003
6. Transport -0.003 0.040 0.010 0.030 0.016
7. IT/BPO 0.670 0.580 0.290 0.110 0.104
8. Handloom / Powerloom -0.010 -0.003 -0.020 0.010 -0.026
Overall 0.980 0.840 0.170 0.220 0.080
Source: 14th
Quarterly Quick Employment Survey, January-March 2012, Labour Bureau.
Output
9
mobile number portability reducing the need
for multiple connections. A services sector
composite indicator based on growth in
indicators of construction, trade and transport,
and finance, developed by the Reserve Bank
shows continuation of slowdown in services in
Q1 of 2012-13 (Chart I.13). The outlook for
the services sector depends to a large extent on
the revival in industrial growth and an
improvement in the global economic conditions.
Growth in 2012-13 likely to be below
potential
I.26	 Going forward, the outlook for growth
looks weak and substantially affected by global
headwinds, inflation and policy uncertainty.
Although the south-west monsoon has been
forecasted to be normal during 2012-13, its
weak progress so far is a concern. The services
sector is also showing signs of slowing down.
Growth in communication services is likely to
be low. The industrial sector, though improved
in May, does not seem to be on course for
sustained recovery. With growth slowing down,
inflation is expected to moderate but demand-
supply imbalances in respect of a number of
items are limiting the price adjustment. Rupee
depreciation in the recent period, however, is
expected to support industrial and services
sector activity through improved export
competitiveness.
Table I.5: Indicators of Services Sector Activity
(Growth in Per cent)
Services Sector Indicators 2009-10 2010-11 2011-12 April-June
2011-12
April-June
2012-13
1 2 3 4 5 6
Tourist arrivals 5.8 9.5 8.6 10.7 4.2
Cement 10.5 4.5 6.7 -0.6# 9.7#
Steel 6.0 13.2 7.0 5.5# 5.8#
Cell phone connections (in millions)$ 192.5 227.3 107.6 15.3* 6.1*
Automobile sales 24.4 16.8 11.2 10.7 10.0
Railway revenue-earning freight traffic 6.6 3.8 5.2 7.0 4.8
Cargo handled at major ports 5.8 1.6 -1.7 5.2 -5.5
Civil aviation
Domestic cargo traffic 24.3 23.8 -4.8 0.5* 2.0*
International cargo traffic 10.5 17.7 -1.9 10.3* -6.0*
Domestic passenger traffic 15.6 18.1 15.1  14.1* 8.3*
International passenger traffic 8.8 10.3 7.6 14.0* 5.6*
*: Data pertains to April 2012. #: Data refers to April-May 2012.
$: Refers to wireless subscriber additions in actual numbers.
Source: Ministry of Statistics and Programme Implementation, Ministry of Tourism and CMIE.
10
Macroeconomic and Monetary Developments First Quarter Review 2012-13
II. AGGREGATE DEMAND*
Reflecting the slowdown in the domestic economy, growth in aggregate demand weakened further
during Q4 of 2011-12. The decline in investment, particularly private corporate investment,
has emerged as a major drag on demand. From a long-term perspective, the sustained fall in
investment so far has impacted India’s growth potential. Some moderation in private consumption
is also taking place, partly due to the impact of inflation on purchasing power. Corporate sales
decelerated along with continued decline in profits and could adversely impact investments
ahead. In this situation, crowding-in of private investment demand by public investment spending
stimulus while aggressively cutting expenditure on subsidies hold the key to growth revival.
Expenditure side of GDP continued to
show weak demand
II.1	 The expenditure side aggregates, based
on the revised estimates of national income
released by the CSO in end-May 2012, are
indicative of slackening demand conditions in
the economy (Table II.1). This assessment
however, is strongly influenced by the ‘statistical
discrepancy’ in the data. For example, the sum
of the contribution-weighted growth rates of the
different expenditure components in Q4 of
2011-12 works out to 9 per cent, which is much
Table II.1: Expenditure Side GDP (2004-05 prices)
(Per cent)
Item 2010-2011* 2011-12# 2010-11 2011-12
Q1 Q2 Q3 Q4 Q1 Q2 Q3 Q4
1 2 3 4 5 6 7 8 9 10 11
Growth Rates (y-o-y)
I.	 GDP at market prices 9.6 6.9 9.5 8.9 10.0 9.7 9.0 6.9 6.2 5.6
II.	 Total Consumption Expenditure 8.1 5.4 9.4 8.8 6.9 7.4 4.9 4.9 6.1 5.8
	(i)	 Private 8.1 5.5 9.1 8.6 7.3 7.6 4.9 4.6 6.4 6.1
	(ii)	 Government 7.8 5.1 11.1 10.5 4.7 6.7 4.9 7.2 4.7 4.1
III.	 Gross Fixed Capital Formation 7.5 5.5 8.8 6.9 11.1 3.7 14.7 5.0 -0.3 3.6
IV.	 Change in Stocks 37.4 2.4 39.4 35.5 37.7 37.1 7.1 2.8 0.4 -0.4
V.	 Net Exports 5.5 -30.7 -35.4 -14.6 29.5 33.4 -23.2 -46.7 -117.9 117.8
VI.	Discrepancies 38.9 -112.7 -1.0 11.1 91.1 7.3 -51.8 -119.6 -152.0 -124.0
Relative shares
I.	 Total Consumption Expenditure 70.1 69.1 72.8 72.1 72.7 63.5 70.1 70.8 72.7 63.6
	(i)	 Private 58.7 57.9 61.9 61.7 60.3 51.9 59.5 60.3 60.4 52.2
	(ii)	 Government 11.4 11.2 11.0 10.5 12.5 11.6 10.6 10.5 12.3 11.4
II.	 Gross Fixed Capital Formation 32.5 32 32.2 34.0 32.3 31.4 33.9 33.4 30.3 30.9
III.	 Change in Stocks 3.7 3.5 3.7 3.8 3.5 3.6 3.7 3.6 3.4 3.4
IV.	 Net Exports -6.0 -7.4 -7.6 -8.2 -5.4 -3.4 -8.6 -11.3 -11.1 0.6
V.	Discrepancies -2.5 0.3 -3.8 -4.3 -5.4 2.7 -1.7 0.8 2.6 -0.6
Memo:	(` Billion)
Real GDP at market prices 52368 56277 12087 12265 13533 14484 13174 13111 14377 15296
* : Quick Estimates. # : Revised Estimates.
Note: As only major items are included in the table, data will not add up to 100.
Source: Central Statistics Office.
* Despite its well-known limitations, expenditure-side GDP data are being used as proxies for components of aggregate demand.
However, in view of these limitations, which are amply reflected in the data for Q4 of 2011-12, supplementary information, including
anecdotal data and judgements have been used to draw inferences.
Aggregate Demand
11
higher than the growth rate of 5.6 per cent
derived from the supply side after adjusting for
net indirect taxes (Table II.2). Such ‘statistical
discrepancy’ is also reflected in the incorrect
manifestation of external demand through
positive net exports in Q4 of 2011-12 in contrast
to the record current account deficit posted in
the data that were released by the Reserve Bank
in end-June 2012.
II.2	 Keeping aside the apparent statistical
weaknesses in the data, the moderation in
expenditure persisted in Q4 of 2011-12, which
was reflected across private and government
final consumption expenditure and subdued
growth in capital formation.
Growth slowdown is reflected in weaker
growth in private consumption and
investment
II.3	 The growth in private final consumption
expenditure, which accounts for around 60 per
cent of GDP, decreased in Q4 of 2011-12. The
subdued levels of gross fixed capital formation
(GFCF), which accounts for around 30 per cent
of GDP, can be partly attributed to high interest
rates but non-monetary factors have also played
a significant role. In this context, it may be
mentioned that real interest rates in the recent
period are lower than their levels in the pre-
crisis years when investment rates were much
higher. The moderation of investment in the
recent period, therefore, suggests that there are
factors other than interest rate at play. Empirical
estimates in a recent Reserve Bank Working
Paper show that the real interest (lending) rates
explain only around one-third of real GDP
growth. In the post crisis period, the slackening
of investment is mainly related to the private
corporate sector. In addition, the share of public
investment in GDPhas declined.Apart from the
erosion in corporate profit margins and already
high leverage, other domestic and global factors
have contributed to weakening investment
activity.
Investment outlook remained insipid in Q4
of 2011-12
II.4	 Corporateinvestmentintentionsremained
depressed. The aggregate project cost envisaged
from the new projects sanctioned financial
assistance by banks/FIs, have continued to
moderate through 2011-12 aggregating `2.1
Table II.2: Contribution-Weighted Growth Rates of Expenditure-Side GDP
(2004-05 Prices)*
(Per cent)
Item 2010-11 2011-12
Q1 Q2 Q3 Q4 Q1 Q2 Q3 Q4
1 2 3 4 5 6 7 8 9
1.	 Private final consumption expenditure 5.6 5.3 4.5 4.0 3.0 2.8 3.9 3.2
2.	 Government final consumption expenditure 1.2 1.1 0.6 0.8 0.5 0.8 0.6 0.5
3.	 Gross fixed capital formation 2.9 2.4 3.6 1.2 4.7 1.7 -0.1 1.1
4.	 Changes in stocks 1.2 1.1 1.1 1.1 0.3 0.1 0.0 0.0
5.	Valuables 0.8 0.7 0.6 0.5 0.3 0.2 0.1 0.2
6.	 Net Export (i-ii) -2.2 -1.1 2.5 1.9 -1.8 -3.8 -6.4 4.0
		 (i)	 Exports 2.6 3.7 6.0 6.3 3.9 4.4 1.5 4.6
		 (ii)	 Less Imports 4.8 4.8 3.5 4.4 5.7 8.2 7.9 0.6
7.	 Sum 1 to 6 9.5 9.3 12.9 9.5 7.0 1.8 -2.0 9.0
8.	Discrepancies 0.0 -0.5 -2.8 0.2 2.0 5.1 8.2 -3.4
9.	 GDP at market prices (7+8) 9.5 8.9 10.0 9.7 9.0 6.9 6.2 5.6
*: Contribution-weighted growth rate of a component of expenditure side GDP is obtained as follows:
(Year-on-Year change in the component ÷ Year-on-Year change in GDP at constant market prices) × Year-on-Year growth rate of
GDP at constant market prices.
Source: Central Statistics Office
12
Macroeconomic and Monetary Developments First Quarter Review 2012-13
trillion in 2011-12, down from `3.9 trillion in
the previous year (Table II.3). Industry-wise
analysis revealed that the share of the power
sector in the total envisaged project cost
remained the highest in Q4 of 2011-12 followed
by metal & metal products and textiles
(Chart II.1).
II.5	 The time-phasing details of projects that
have been sanctioned institutional assistance for
various years up to 2011-12 indicate that total
intendedcapitalexpenditurebyprivatecorporate
(non-financial) firms declined in 2011-12 and
can be expected to decline further during
2012-13 as planned investment in new projects
is likely to remain low (Table II.4). Overall,
declining trend in investment demand from the
private corporate sector has emerged as the
major drag on overall investment.
Moderation in sales growth coupled with
high input cost pressures led to declining
corporate profits
II.6	 Sales growth for select Non-Government,
Non-Financial (NGNF) listed companies by and
large held up during 2011-12, though there was
a perceptible drop in the last quarter (Table II.5,
II.6). However, persistent pressure from input
costs and rising interest outgo, led to decline in
net profits (PAT). Operating and net profit
margins declined during 2011-12 indicating a
weakening pricing power for Indian corporates.
Table II.3: Institutionally Assisted Projects
and Their Envisaged Cost (Quarter-wise)
Period Number of Projects Project Cost (` billion)
1 2 3
2009-10 Q1 146 908
Q2 189 1,327
Q3 175 1,194
Q4 231 827
2010-11 Q1 181 1,250
Q2 202 1,067
Q3 160 787
Q4 167 821
2011-12 Q1 154 787
Q2 194 572
Q3 151 506
Q4 169 255
Note: Based on data reported by 39 banks/FIs.
Table II.4: Phasing of Capital Expenditure of Projects Sanctioned Assistance by Banks/FIs
(` billion)
Capital Expenditure in the Year Up to
2007-08
2008-09 2009-10 2010-11 2011-12 2012-13 Beyond
2013-14
Grand
Total
1 2 3 4 5 6 7 8 9
Year of Sanction
Up to 2007-08 1,826 1,317 583 376 98 47 - 4,247
2008-09 265 1,029 864 568 366 84 46 3,223
2009-10 2 444 1,359 1,216 804 320 111 4,255
2010-11 - 3 320 1,101 1,095 823 584 3,926
2011-12 - - 39 254 746 638 443 2,120
Grand Total # 2,093 2,793 3,165 3,515 3,109 1,912 1,184 -
#: The estimates are ex ante, incorporating only the envisaged investment, and thus are different from those actually realised/ utilised.
Aggregate Demand
13
Table II.5: Corporate Sector- Financial Performance
per cent
Item Annual:
2010-11
Annual:
2011-12
2010-11 2011-12
Q1 Q2 Q3 Q4 Q1 Q2 Q3 Q4
1 2 3 4 5 6 7 8 9 10 11
No. of Companies 2273
Growth Rates (y-o-y)
Sales 20.0 18.6 25.1 19.2 17.1 20.7 22.6 19.1 19.5 15.5
Change in stock 80.4 -23.0 391.7 -55.5 108.5 124.0 -41.7 3.4 99.2 -55.9
Expenditure, of which 22.3 20.9 29.6 20.3 19.0 22.9 23.0 22.7 25.4 16.5
	 Raw Material 26.3 22.7 37.8 22.3 20.3 25.2 27.6 23.1 26.1 17.0
	 Staff Cost 19.3 17.6 16.5 20.5 21.2 19.5 19.9 17.4 18.8 14.4
	 Power & fuel 18.1 27.2 17.5 12.8 19.6 26.6 27.2 26.2 30.4 25.3
Operating Profits (PBDIT) 12.3 1.7 15.2 7.3 11.0 16.5 12.5 -1.1 -6.0 -1.4
Other Income* 2.0 41.4 -26.2 55.1 6.1 -14.6 45.4 28.3 70.6 47.6
Depreciation 16.2 10.5 20.2 17.6 14.7 14.6 9.7 9.7 10.3 11.2
Gross Profits (PBIT) 10.0 4.2 8.1 9.0 9.5 11.9 16.5 -0.4 -3.2 2.5
Interest 20.5 35.8 27.0 6.3 24.1 30.6 22.3 46.2 41.9 34.4
Tax Provision 11.3 11.3 5.2 8.3 4.8 2.7 22.1 4.3 -3.1 4.5
Net Profits (PAT) 9.0 -11.8 5.5 9.6 8.9 13.2 6.9 -15.6 -32.2 -7.7
Select Ratios
Change in stock#
to Sales 1.8 1.3 2.6 0.7 1.3 2.4 1.2 0.5 2.3 1.1
Interest Burden 19.7 27.9 20.9 19.5 19.8 19.0 22.0 28.8 28.9 27.3
Interest Coverage 5.1 3.6 4.8 5.1 5.1 5.3 4.6 3.5 3.5 3.7
PBDIT to Sales 15.8 13.6 16.3 15.6 16.1 15.4 15.0 13.0 12.6 13.1
PBIT to Sales 13.6 12.1 13.6 13.5 13.6 13.4 13.0 11.3 11.0 12.2
PAT to Sales 8.5 6.3 8.6 8.6 8.4 8.6 7.5 6.1 4.8 6.9
*: Other income excludes extraordinary income/expenditure if reported explicitly. #: For companies reporting this item explicitly.
Note: Growth rates are percentage changes in the level for the period under reference over the corresponding period of the previous year for
common set of companies.
Table II.6: Corporate Sector- Financial Performance (Sequential Growth)
Q-on-Q, per cent
Indicator Number of Companies 2273
2010-11 Q1 2010-11 Q2 2010-11 Q3 2010-11 Q4 2011-12 Q1 2011-12 Q2 2011-12 Q3 2011-12 Q4
1 2 3 4 5 6 7 8 9
Sales -3.6 5.7 5.1 12.4 -1.8 2.7 5.5 8.6
Change in Stock 89.0 -70.6 98.5 137.8 -58.0 -47.9 282.5 -47.3
Expenditure, of which -2.9 4.7 5.2 15.0 -2.9 4.5 7.5 6.8
	 Raw Material -3.6 4.9 6.0 18.9 -3.5 1.2 8.5 10.4
	 Staff Cost 3.5 7.3 2.8 4.9 3.6 5.0 4.1 1.0
	 Power & Fuel 11.9 0.6 4.5 9.4 10.6 -0.2 8.0 5.1
Operating Profits (PBDIT) -1.1 1.2 8.2 7.3 -4.2 -11.1 2.9 12.6
Other Income* -47.1 43.5 -22.9 74.2 -24.6 26.6 2.6 50.7
Depreciation 1.2 2.1 3.0 7.7 -3.1 2.1 3.6 8.5
Gross Profits (PBIT) -9.2 4.9 5.7 13.5 -7.4 -10.3 2.6 20.2
Interest 16.5 -1.4 5.8 20.0 -2.3 17.9 2.7 13.6
Tax Provision -9.6 3.5 2.8 7.3 7.0 -11.5 -4.6 15.7
Net Profits (PAT) -9.9 5.6 3.8 14.1 -14.6 -16.5 -16.7 55.4
*: Other income excludes extraordinary income/expenditure if reported explicitly
Note: Growth rates are percentage changes in the level for the period under reference over the previous quarter for common set of companies.
II.7	 Growth in sales (y-o-y) remained strong
in the first three quarters of 2011-12 before
moderating in Q4 of 2011-12. On a sequential
basis, however, sales picked up in the latter half
of the year. During Q4 of 2011-12, there was
also some decline in the rate of growth of input
14
Macroeconomic and Monetary Developments First Quarter Review 2012-13
costs as well as interest outgo on a year-on-year
basis. The build-up in inventory, however, was
lower in Q4 of 2011-12 partly neutralising the
higher built-up observed during the previous
quarter.
II.8	 Along with the decline in sales growth,
the stock-in-trade to sales ratio has also declined
in Q4 of 2011-12 (Chart II.2). This decline
points towards a pessimistic corporate outlook
for demand conditions ahead.
High deficits limit fiscal space for reviving
private investment
II.9	 The centre’s gross fiscal deficit (GFD)
rose sharply to 5.8 per cent in 2011-12 from 4.9
per cent in 2010-11, with revenue deficit
constituting over three-fourths of GFD as
against 67.5 per cent a year ago. The widening
of revenue deficit in 2011-12 reflected the
impact of the economic slowdown on tax
revenues with the revenue receipts-GDP ratio
in 2011-12 turning out to be lower than even
the crisis years of 2008-09 and 2009-10.
Although the revenue expenditure-GDP ratio
declined in 2011-12, this was at the cost of
development revenue expenditure. Notably,
subsidies increased to 2.5 per cent of GDP. With
the large and growing revenue deficit
constraining the fiscal space for investment
expenditure, the capital outlay to GDP ratio
declined to 1.6 per cent, well below the pre-
crisis level of over 2 per cent.
Table II.7: Key Fiscal Indicators
(As per cent to GDP)
Year Primary
Deficit
Revenue
Deficit
Gross Fiscal
deficit
Outstanding
Liabilities@
1 2 3 4 5
Centre
2010-11 1.8 3.3 4.9 52.8
2011-12 RE 2.8 4.5 5.9 51.9
(2.7) (4.3) (5.8)
2012-13 BE 1.9 3.4 5.1 –
States*
2010-11 0.5 -0.0 2.1 23.3
2011-12 RE 0.8 -0.1 2.3 22.3
2012-13 BE 0.6 -0.4 2.1 21.0
Combined*
2010-11 2.4 3.2 6.9 65.8
2011-12 RE 3.6 4.4 8.2 65.4
2012-13 BE 2.6 3.1 7.1 –
RE: Revised Estimates. BE: Budget Estimates.
@: Includes external debt at current exchange rates.
*: Data in respect of States pertains to 26 State Governments.
Note: Figures in parentheses are provisional accounts.
Source: Budget documents of the Central and State Governments.
II.10	 Preliminary data indicates that the
combined revenue and fiscal deficits of the centre
and states as a proportion of GDP increased by
1.2 percentage points and 1.3 percentage points,
respectively, in 2011-12 over the previous year,
with over 80 per cent of the increase contributed
by the centre (Table II.7). Combined
development expenditure-GDP ratio increased
in 2011-12 on account of the states (Table II.8).
Table II.8: Combined Finances of Central
and State Governments
Item Per cent to GDP
2010-11 2011-12
(RE)
2012-13
BE
1 2 3 4
1.	Total expenditure 27.8 28.3 27.8
2.	Revenue Expenditure 23.7 24.0 23.3
3.	Capital Expenditure 4.1 4.3 4.5
	 Of which: Capital Outlay 3.7 3.7 4.1
4.	Non-Developmental Expenditure 11.1 11.1 11.1
5.	Development expenditure 16.4 16.8 16.3
6.	Revenue Receipts 20.5 19.6 20.2
	 i)	 Tax Revenue (net) 16.3 16.4 16.9
	 ii)	 Non Tax Revenue 4.2 3.2 3.4
RE: Revised Estimates. BE: Budget Estimates.
Note: Data in respect of States pertains to 26 State Governments.
Source: Budget documents of the Central and State Governments.
Aggregate Demand
15
Likely overshooting of subsidies pose fiscal
risks during 2012-13
II.11	 Achieving fiscal consolidation as
envisaged in the budget for 2012-13 would
hinge on the realisation of budgeted tax
buoyancies and capping of subsidies to below
2 per cent of GDP. The compensation to oil
marketing companies for under-recoveries
budgeted at `400 billion for 2012-13, however,
appears inadequate, given the spillover in
compensation of `385 billion in Q4 of 2011-12
and under-recoveries of `478 billion reported
by oil marketing companies for Q1 of 2012-13,
in spite of some softening of global crude oil
prices. Capping the subsidies within the
budgeted limits would necessitate steps to
allow the pass-through of international crude
oil prices to domestic prices, failing which it
would be difficult to achieve the overall deficit
targets.
II.12	 Besides the fiscal slippage on account of
fuel subsidies, moderation in growth from the
assumed 7.6 per cent for 2011-12 in the Union
budget could be another risk factor for revenue
receipts.
II.13	 Available data show that during April-
May 2012 key deficits in terms of percentages
to budget estimates improved over the
corresponding period of the previous year
mainly on account of higher tax revenue,
particularly under income and services tax
collections. Direct taxes continued to exhibit
buoyant growth in Q1 of 2012-13, although the
increase partly reflects the lower tax refunds
compared with the previous year. Indirect tax
collections under Union excise and customs
duties during Q1 of 2012-13 shows marked
slippage from budgeted growth.
II.14	 Aggregate expenditure growth in the first
two months of 2012-13 was higher than a year
ago, attributable to higher non-plan revenue
expenditure, with interest payments accounting
for over 29 per cent of the increase.
State finances budgeted to improve further
in 2012-13
II.15	 In contrast to the centre, the consolidated
revenue account of the states (excluding
Mizoram and Manipur) showed a marginal
surplus in 2011-12 as compared with the
revenue balance in 2010-11.Although there was
an increase in the GFD-GDPratio, this was used
to fund higher capital outlays. On the revenue
front, despite the economic slowdown, the tax-
GDP ratio of the states increased over the
previous year, aided in large part by higher VAT/
sales tax collections on petroleum products. In
fact, for the first time tax collections of state
governments on petroleum products in 2011-12
were higher than those of the centre. The quality
of expenditure also improved in 2011-12, with
increases in development and social sector
expenditures as well as capital outlay in
proportion to GDP.
II.16	 The key deficit indicators of the states are
budgeted to improve further in 2012-13. The
consolidated revenue surplus of the state
governments is budgeted to increase in 2012-13,
mainly on account of an increase in the revenue
receipts-GDPratio, which is to be supplemented
by reduction in the revenue expenditure-GDP
ratio. The budgeted increase in revenue surplus
would enable a higher capital outlay-GDP ratio
for the states in 2012-13, even while reducing
their consolidated GFD-GDP ratio.
II.17	 The majority of the states have budgeted
to meet the targets set by the Thirteenth Finance
Commission (ThFC) for deficit/debt indicating
their commitment to the fiscal consolidation
process. The challenge for the states is to refrain
from sacrificing the quality of fiscal adjustment
in their endeavour to meet the incentivised
quantitative targets.
Need to create fiscal space, spur investment
to revive growth
II.18	 Recovery of investment is critical in
reviving growth but depends on fiscal
consolidation and improvement in overall
16
Macroeconomic and Monetary Developments First Quarter Review 2012-13
macroeconomic scenario. The major challenges
to growth recovery at the current juncture
emanate from the weak investment demand.
Even a modest recovery in economic growth
during 2012-13 is contingent on the recovery
of investment. However, the capacity of
investment to respond to monetary policy
actions to stimulate growth is conditional on
an improvement in non-monetary factors that
have impacted investment in the current cycle.
On the other hand, persistent inflation, limits
the space for monetary policy to revive growth.
II.19	 The slowdown in consumption demand
also points towards the impact of high and
persistent inflation on purchasing power. This
also indicates the need for keeping inflation
under check to maintain consumption demand
at levels consistent with the overall growth
objective. Therefore, monetary policy has to
continue to remain guarded against a build-up
of inflationary risks as well as to sustain the
growth potential.
II.20	 Given the deterioration in the fiscal
situation, the option of using fiscal policy to
stimulateaggregatedemandremainsunavailable
unlike in 2008-09 when the previous period of
fiscal consolidation helped to provide the
necessary fiscal space. As higher deficits could
lead to pressures on yields, affecting the already
weak private investment demand, it is critical
to return to a credible and durable fiscal
consolidation path.As such, fiscal space would
need to be created by controlling revenue
expenditure to provide more resources for
capital expenditure which could crowd-in
private investment.
The External Sector
17
III. THE EXTERNAL SECTOR
The weakness in the external sector observed in 2011-12 continued during the first quarter of
2012-13, mainly reflecting uncertainty in global economic and financial conditions coupled
with weak domestic macroeconomic conditions. The rupee witnessed renewed pressures and
depreciated against the US dollar in Q1 of 2012-13, in line with the trend registered by major
EDE currencies. Capital flows have remained subdued and volatile. Notwithstanding various
policy measures initiated by the Reserve Bank, significant depreciation of the rupee, softening
commodity prices and moderation in gold imports, improvement in the trade deficit will
continue to hinge upon global macroeconomic conditions and therefore, upside risks remain.
With services exports likely to decelerate during 2012-13, the risks of CAD going above its
sustainable rate, and difficulties in financing it, persist.
Global factors continue to weigh on
India’s exports
III.1 India’s merchandise exports, which had
decelerated in 2011-12, contracted in Q1 of
2012-13 mainly reflecting subdued demand
conditions in key global markets, particularly
the EU and the US (Table III.1). In particular,
exports of engineering goods, petroleum
products, gems and jewellery and readymade
garments have been affected. Evidently the
significant depreciation in the rupee since H2
of 2011-12 could not sufficiently offset the
impact of the slowdown in global demand. In
recent years, due to export diversification
efforts, the share of developing economies in
India’s total exports witnessed a gradual
increase. However, as the sluggish economic
conditions in advanced economies (AEs) slowly
spilled over to other emerging and developing
economies (EDEs), diversification did not yield
results similar to those seen in previous years.
Going forward, economic conditions especially
in EU are likely to remain muted for some time.
As a result, growth in global trade volume,
including exports from EDEs, is likely to be
lower in 2012. Indian exports are likely to reflect
this general trend.
Table III.1: India’s Merchandise Trade
(US$ billion)
Item April-March April-June
2010-11 R 2011-12 P 2011-12 R 2012-13 P
Value Growth
(%)
Value Growth
(%)
Value Growth
(%)
Value Growth
(%)
1 2 3 4 5 6 7 8 9
Exports 251.1 40.5 304.6 21.3 76.5 36.4 75.2 –1.7
Of which: Oil 41.5 47.1 55.6 34.0 15.3 76.2 12.9 –15.6
Non-oil 209.7 39.3 249.0 18.8 61.2 29.1 62.3 1.8
Imports 369.8 28.2 489.4 32.4 122.7 36.3 115.3 –6.1
Of which : Oil 106.0 21.6 154.9 46.2 39.4 52.5 41.5 5.3
Non-oil 263.8 31.1 334.5 26.8 83.3 29.7 73.8 –11.5
Gold 40.5 41.6 56.2 38.8 16.1 109.1 8.5 –47.5
Non-Oil Non-Gold 223.3 29.3 278.3 24.6 67.2 18.9 65.3 –2.9
Trade Deficit –118.6 –184.8 –46.2 –40.1
Of which: Oil –64.5 –99.3 –24.1 –28.6
Non-oil –54.1 –85.5 –22.1 –11.5
R: Revised. P: Provisional.
Source: DGCI&S.
Macroeconomic and Monetary Developments First Quarter Review 2012-13
18
Softening of international commodity
prices narrowed the trade deficit
III.2	 The weakness in India’s external
position in 2011-12 stemmed partly from the
import-induced surge in the current account
deficit (CAD). Given the inelastic nature of
India’s imports of petroleum, oil and lubricants
(POL) and gold, the rise in international prices
of these commodities led to overall high
imports. This trend, however, reversed in Q1 of
2012-13. The decline in imports in the quarter
was sharper than that in exports (Chart III.1a).
Import moderation was mainly on account of a
modest contraction in POL imports and a
significant contraction in gold and silver
imports. The lower growth in POL reflects the
softening of international crude oil prices, while
the decline in gold and silver imports appears
to reflect the impact of policy measures taken
in January and March 2012 (Chart III.1b).
Growth moderation in non-oil imports in recent
months appears to be on account of confluence
of various factors, viz., domestic slowdown,
global uncertainty, moderation in global
commodity prices and the possible impact of
rupee depreciation in some sectors. As a result,
the trade deficit narrowed somewhat in Q1 of
2012-13 compared with the corresponding
period of the previous year.
Upside risks to trade deficit persist
III.3	 Recent trend of faster deceleration in
imports than exports has given rise to the
possibility that CAD could improve in 2012-13.
However, current assessment suggests that such
improvement could be insufficient to ensure
CAD sustainability. The upside risk to CAD
remain significant. The response of exports to
depreciation of rupee has so far remained muted
due to subdued global demand. Downside risks
to export growth are large in view of worsening
global conditions. Exchange rate sensitivity of
India’s import is also limited.
Slowdown in global IT spending may
dampen growth in software exports
III.4	 Despite the challenges in global market
conditions, services exports, in general and
software exports in particular sustained the
growth momentum in 2011-12 (Table III.2).
However, net services exports earnings at
US$14 billion in Q1 of 2012-13, have declined
by about 12 per cent y-o-y, suggesting loss of
momentum. Services exports in gross terms
expanded by 3 per cent, while imports increased
by 19 per cent in this quarter. Going forward,
NASSCOM projection of 11-14 per cent
growth in software exports in 2012-13, suggests
deceleration. Current indications, borne out by
dollar revenue guidance of IT majors, suggest
that software export earnings may even be
lower than projected by NASSCOM. The risk
of lower software exports may arise from
reduced spending on technology by US
corporations, continued uncertainty in the euro
area countries and likely euro depreciation. As
The External Sector
19
software exports account for nearly 63 per cent
of net receipts of invisibles, any deceleration in
these exports may aggravate the already high
CAD recorded in recent quarters.
Capital flows may remain volatile due to
global uncertainties
III.5 The exacerbation in CAD during 2011-
12 led to depletion of reserves notwithstanding
improved capital flows (Table III.3). Since Q1
of 2012-13, concerns about the growth and
financial health of euro area countries have
further intensified. In addition, signs of
weakness in the US and China have also made
investors more cautious and driven up global
financial market volatility. These factors,
combined with weakening domestic
macroeconomic conditions, led to a net FII
outflow of US$ 1.7 billion in Q1 of 2012-13.
Concerns about the domestic business
environment appear to be weighing on FDI
inflows as well. NRI deposits, however, have
picked up in recent months (Table III.4). Since
concerns about the growth outlook forAEs seem
to have prompted investors to reconsider the
resilience of emerging market growth as well,
the outlook for capital flows to EDEs including
India remains subdued.
Rupee gains in Q4 of 2011-12 dissipated
in Q1 of 2012-13
III.6 The rupee gained by 4.1 per cent in Q4
of 2011-12, partly reflecting the favourable
impact of policy measures by the Reserve Bank
to improve capital flows and curb speculative
pressure in foreign exchange market. The
intervention in the foreign exchange market also
helped in containing the depreciation. However,
Table III.2: Major Items of India’s Balance of Payments
(US$ billion)
2010-11
(PR)
2011-12
(P)
2011-12 2010-11
Q1 (PR) Q2 (PR) Q3 (PR) Q4 (P) Q4 (PR)
1 2 3 4 5 6 7 8
1. Goods Exports 250.6 309.8 78.8 79.6 71.5 80.0 77.4
2. Goods Imports 381.1 499.5 123.7 124.1 120.1 131.7 107.4
3. Trade Balance (1–2) –130.5 –189.7 –44.9 –44.5 –48.6 –51.7 –30.0
4. Services Exports 131.7 140.9 33.7 32.3 37.3 37.7 35.3
5. Services Imports 83.0 76.9 17.4 18.3 21.1 20.0 20.7
6. Net Services (4–5) 48.7 64.0 16.3 14.0 16.2 17.7 14.6
7. Goods & Services Balances (3+6) –81.8 –125.7 –28.6 –30.5 –32.4 –34.0 –15.4
8. Primary Income (Net) –17.3 –16.0 –3.6 –4.0 –3.8 –4.6 –4.5
9. Secondary Income (Net) 53.1 63.5 14.8 15.6 16.2 16.9 13.6
10. Net Income (8+9) 35.8 47.5 11.2 11.6 12.4 12.3 9.1
11. Current Account Balance (7+10) –46.0 –78.2 –17.4 –18.9 –20.2 –21.7 –6.3
12. Capital Account Balance 0.04 –0.1 –0.3 0.2 0.1 –0.2 –0.02
13. Financial Account Balance 48.9 80.7 18.7 19.0 20.6 22.4 7.1
of which: Change in Reserves (increase-/decrease+) –13.1 12.8 –5.4 –0.3 12.8 5.7 –2.0
14. Errors & Omissions (-) (11+12+13) –3.0 –2.4 –0.9 –0.4 –0.5 –0.6 –0.8
Memo: As ratio to GDP
15. Trade Balance –7.7 –10.3 –9.8 –9.9 –10.7 –10.6 –6.2
16. Net Services 2.9 3.5 3.6 3.1 3.5 3.6 3.0
17. Net Income 2.1 2.6 2.4 2.6 2.7 2.5 1.9
18. Current Account Balance –2.7 –4.2 –3.8 –4.2 –4.4 –4.5 –1.3
19. Capital and Financial Account, Net 3.7 3.7 5.2 4.4 1.7 3.4 1.9
(Excl. changes in reserves)
P: Preliminary; PR: Partially Revised
Note: Total of subcomponents may not tally with aggregate due to rounding off.
Macroeconomic and Monetary Developments First Quarter Review 2012-13
20
the rupee started weakening from the first week
of April 2012 as portfolio capital inflows dried
up. The large trade deficit, domestic policy
uncertainty and growing apprehensions about
the euro area affected the overall investment
sentiment. As a result, the rupee reached a low
of 57.2 on June 27, 2012 and the real effective
exchange rate (i.e., the REER based on 6, 30
and 36 currency baskets) recorded a depreciation
(Table III.5).
Increasing external debt is a concern
III.7 Since equity flows dwindled, various
measures were taken to encourage other capital
flows into the country.These include an increase
Table III.3: Disaggregated Items of Financial Account
(US$ billion)
2010-11
(PR)
2011-12
(P)
2011-12 2010-11
Q4
(PR)
Q1
(PR)
Q2
(PR)
Q3
(PR)
Q4
(P)
1 2 3 4 5 6 7 8
1. Direct Investment (net) 9.4 22.1 9.3 6.5 5.0 1.4 1.1
1.a Direct Investment to India 25.9 33.0 12.4 9.5 6.9 4.2 5.5
1.b Direct Investment by India –16.5 –10.9 –3.1 –3.0 –1.9 –2.9 –4.4
2. Portfolio Investment 28.2 16.6 2.3 –1.4 1.8 13.9 –0.01
2.a Portfolio Investment in India 29.4 16.8 2.5 –1.6 1.9 14.1 –0.03
2.b Portfolio Investment by India –1.2 –0.2 –0.2 0.2 –0.04 –0.2 0.02
3. Other investment 24.4 29.2 12.6 14.2 1.0 1.4 8.1
3.a Other equity (ADRs/GDRs) 2.0 0.6 0.3 0.2 0.1 0.03 0.2
3.b Currency and deposits 3.8 12.1 1.2 3.1 3.2 4.6 2.0
Deposit-taking corporations, except the central
bank: (NRI Deposits )
3.2 11.9 1.2 2.8 3.3 4.7 0.9
3.c Loans* 18.6 16.8 14.9 9.5 –7.7 –0.03 1.0
3.c.i Loans to India 18.3 15.7 14.9 8.9 –8.1 –0.02 0.7
Deposit-taking corporations, except the
central bank
1.2 4.1 11.5 3.9 –8.7 –2.6 –2.7
General government (External Assistance) 5.0 2.5 0.4 0.3 1.4 0.3 0.8
Other sectors (ECBs) 12.2 9.1 3.0 4.7 –0.8 2.3 2.7
3.c.iiLoans by India 0.3 1.0 –0.02 0.6 0.5 –0.01 0.3
General government (External Assistance) –0.03 –0.2 –0.04 –0.04 –0.04 –0.04 –0.01
Other sectors (ECBs) 0.3 1.2 0.02 0.6 0.5 0.03 0.3
3.d Trade credit and advances 11.0 6.7 3.1 2.9 0.6 0.2 2.7
3.e Other accounts receivable/payable - other –11.1 –6.9 –6.8 –1.5 4.9 –3.3 2.2
4. Reserve assets (increase-/decrease+) –13.1 12.8 –5.4 –0.3 12.8 5.7 –2.0
Financial Account (1+2+3+4) 48.9 80.7 18.7 19.0 20.6 22.4 7.1
P: Preliminary; PR: Partially Revised
*: Includes External Assistance, ECBs, non-NRI Banking Capital and short term trade credit.
Note: Total of subcomponents may not tally with aggregate due to rounding off.
Table III.4: Capital Flows in 2011-12 and
2012-13 So Far
(US$ billion)
Component 2011-12 2012-13
Apr.-
Jun.
Jul.-
Sep.
Oct.-
Dec.
Jan.-
Mar.
Apr.-
Jun.
Average of the monthly flows
1 2 3 4 5 6
FDI in India 4.1 3.1 2.3 1.5 2.2*
FDI by India 1.0 1.0 0.6 1.0 0.5
FIIs (Net) 0.8 –0.5 0.6 4.7 –0.6
ADRs/GDRs 0.1 0.1 0.03 0.01 0.01
ECB Inflows 1.0 1.6 0.9 0.8 –0.4
NRI Deposits (Net) 0.4 0.9 1.1 1.6 2.4*
*April-May.
The External Sector
21
in FII investment in debt securities (both
government and corporate debt), enhancing
all-in-cost ceiling for ECBs and trade credit and
the deregulation of interest rates on rupee-
denominated NRI deposits, i.e., NRE and NRO
accounts. On account of the greater recourse to
such debt creating flows in financing CAD,
India’s external debt increased significantly
during Q4 of 2011-12 (Table III.6). Further, the
repayment of commercial borrowings of about
US$ 15 billion (including FCCBs of about US$
4.7 billion) is due during 2012-13. Thus, there
is a pressing need to improve the equity flows
to finance CAD and maintain the external debt
at a manageable level.
Sustainability of CAD and its financing
remain concerns
III.8 External sector vulnerability indicators
showed mixed trend in Q4 of 2011-12 (Table
III.7). There has been a marginal improvement
in the ratio of short-term debt to total debt.
While debt GDP ratio and debt service ratio
remained same, other indicators such as ratio
Table III.5: Nominal and Real Effective Exchange Rates-Trade Based
(Base: 2004-05=100)
(Per cent, appreciation+/depreciation-)
Index
July 20,
2012 P
Year-on-Year Variation (Average) 2011-12
(March 2012
over January
2012 )
2012-13
(July 20, 2012
over March
2012)
2009-10 P 2010-11P 2011-12
1 2 3 4 5 6 7
36-REER 91.4 –3.2 8.0 –3.2 2.3 –7.2
36-NEER 78.6 –2.6 3.1 –6.4 1.2 –9.7
30-REER 83.5 –4.6 4.8 –2.9 2.3 –7.2
30-NEER 80.3 –2.2 1.1 –5.4 1.0 –9.6
6-REER 104.6 –0.3 13.0 –6.8 2.5 –7.1
6-NEER 76.4 –3.7 5.7 –7.9 1.4 –9.9
`/US$ (Average) 54.5# –3.2 4.0 –4.9 2.0 –7.7#
`/US$ (end-March) 55.9* 12.9 1.1 –12.7 –2.9 –8.6*
P: Provisional. NEER: Nominal Effective Exchange Rate. REER: Real Effective Exchange Rate.
*: As on July 26, 2012. #: April-July 26, 2012 over March 2012.
Note: Rise in indices indicates appreciation of the rupee and vice versa.
Table III.6: India’s External Debt
(US $ billion)
Item End-Mar
2011 PR
End-Jun
2011 PR
End-Sep
2011 PR
End-Dec
2011 PR
End-Mar
2012 QE
Variation (End-Mar 2012
over End-Dec 2011)
Amount Per cent
1 3 4 5 6 7 8 9
1. Multilateral 48.5 49.4 49.1 49.9 50.5 0.5 1.1
2. Bilateral 25.7 26.2 27.1 27.1 26.8 –0.3 –1.1
3. International Monetary Fund 6.3 6.4 6.2 6.1 6.1 0.1 0.9
4. Trade Credit (above 1 year) 18.6 18.7 19.5 19.8 19.9 0.1 0.6
5. External Commercial Borrowings 88.6 92.9 96.3 98.7 104.4 5.7 5.8
6. NRI Deposits 51.7 52.9 52.3 52.5 58.6 6.1 11.6
7. Rupee Debt 1.6 1.6 1.4 1.3 1.3 0.0 0.0
8. Long-term (1 to 7) 240.9 247.9 252.0 255.4 267.6 12.3 4.8
9. Short-term 65.0 68.5 71.5 76.0 78.2 2.2 2.9
Total (8+9) 305.9 316.4 323.5 331.4 345.8 14.5 4.4
PR: Partially Revised. QE: Quick Estimates.
Macroeconomic and Monetary Developments First Quarter Review 2012-13
22
of foreign exchange reserves to total debt and
the short-term debt to foreign exchange
reserves, deteriorated as at end-March 2012
compared with end-December 2011. India’s
Net International Investment Position (NIIP)
also weakened (Table III.8).
Rising vulnerability to external shocks
III.9 The CAD-GDP ratio was high at 4.5
per cent in Q4 of 2011-12, taking the full year
ratio to an all time high of 4.2 per cent. Such
high level of CAD, especially against the
backdrop of volatile global macroeconomic
conditions and volatile capital flows, raise grave
concerns about its sustainability. A recent
analysis shows that with GDP growth of 7 per
sustainable. The estimate is based on analysis
of threshold level of India’s net external liability
to GDPratio to work out sustainable CAD-GDP
ratio in various growth scenarios. With an
increase in deficit beyond this level, financing
could be a constraint and the external sector
vulnerability may rise further. High external
debt, along with a deterioration in the net
international investment position and a moderate
decline in forex reserves also weakened the
resilience of India’s external sector in Q4 of
2011-12. Going forward, the trend in CAD will
largely depend on the global macroeconomic
and trade environment. The trend in capital
flows will depend on global liquidity conditions,
as well as the domestic investment and policy
environment.
Table III.7: External Sector Vulnerability Indicators
(Per cent)
Indicator End-Mar
2010
End-Jun
2010
End-Mar
2011
End-Jun
2011
End-Sep
2011
End-Dec
2011
End-Mar
2012
1 2 3 4 5 6 7 8
1. Ratio of Total Debt to GDP 18.0 - 17.8 15.9 17.8 20.0 20.0
2. Ratio of Short-term to Total Debt
(Original Maturity )
20.0 20.9 21.2 21.6 22.1 22.9 22.6
3. Ratio of Short-term to Total Debt
(Residual Maturity)
41.2 42.5 42.2 43.3 43.4# 43.5# 42.6
4. Ratio of Concessional Debt to Total Debt 16.8 15.9 15.5 15.1 14.8 14.4 13.9
5. Ratio of Reserves to Total Debt 106.9 98.0 99.6 99.8 96.3 89.5 85.1
6. Ratio of Short-term Debt to Reserves 18.8 21.0 21.3 21.7 23.0 25.6 26.6
7. Reserves Cover of Imports (in months) 11.1 10.7 9.6 9.2 8.5 7.7 7.1
8. Reserves Cover of Imports and Debt
Service Payments (in months)
10.5 10.1 9.1 8.8 8.0 7.3 6.8
9. Debt Service Ratio (Debt Service
Payments to Current Receipts)
5.8 4.1 4.3 4.8 4.7 5.6 5.6
10. External Debt (US$ billion) 260.9 270.3 305.9 316.4 323.5 331.4 345.8
-: Not available. #: RBI Estimate.
Table III.8: Overall International Invest-
ment Position of India
(US$ billion)
Period Mar-11
(PR)
Jun-11
(PR)
Sep-11
(PR)
Dec-11
(P)
Mar-12
(P)
1 2 3 4 5 6
NIIP -203.6 -216.5 -196.6 -204.8 -244.8
Assets 439.8 450.0 453.9 431.6 437.1
Liabilities 643.4 666.5 650.5 636.5 682.0
NIIP-GDP Ratio* -12.1 -11.9 -11.0 -11.3 -13.2
PR: Partially Revised P: Preliminary.
* Based on annualised GDP.
cent, CAD-GDP ratio of around 2.5 per cent is
Monetary and Liquidity Conditions
23
While continuing to manage the growth-inflation trade-off, the Reserve Bank reduced the repo
rate by 50 basis points in April 2012. Monetary conditions have gradually eased in 2012-13
so far as a result of the two-stage reduction in the cash reserve ratio in Q4 of 2011-12, the
repo rate cut and significant depreciation of the exchange rate. Active liquidity management
by the Reserve Bank by way of sizeable open market purchases and other policy measures has
helped correct the excessively tight liquidity that prevailed during the latter part of 2011-12.
Besides the gradual pick-up in growth in monetary aggregates in 2012-13 so far, there has
been a pick-up in non-food credit which as of mid-July 2012 was growing marginally above
the indicative projection for 2012-13.
Reserve Bank front-loads rate cut using
the available monetary policy space
IV.1	 In April 2012, the Reserve Bank
reduced the repo rate for the first time in three
years. Even as inflation remained the main
concern, the policy rate was reduced by 50 basis
points on account of moderation in growth
below its post-crisis trend (Table IV.1). While
it was recognised that the deviation in growth
from its trend was modest, the slowdown,
nevertheless, was expected to contribute to
some moderation in core inflation. The
cumulative impact of past monetary tightening
was expected to moderate inflation further
through slower growth.
IV.2	 Inflation has, however, persisted above
the level consistent with sustainable growth.
When the Reserve Bank undertook the front-
loaded rate cut action in April 2012, it clearly
enunciated that upside risks to inflation persisted
and space for further reduction in policy rates
was limited. This space was further constrained
by lack of credible action to curtail subsidies
and related expenditure by the government.
Also, there were a number of factors other than
monetary policy actions behind the growth
slowdown in 2011-12.
IV.3	 Apart from the rate cut, monetary
conditions eased as a result of softening impact
on interest rates of the 125 basis points reduction
in the cash reserve ratio (CRR) during Q4 of
2011-12 and the significant exchange rate
depreciation (about 10 per cent in Q1 of 2012-
13 and about 20 per cent cumulative since
August 2011). The monetary easing during Q1
of 2012-13 has significantly corrected the
tightness in monetary and liquidity conditions
witnessed during Q4 of 2011-12. M3
expansion
during 2011-12 at 13.1 per cent was below the
indicative projection of 15.5 per cent. Low
reserve money expansion at 9.6 per cent
(adjusted for CRR changes) contributed to lower
expansion of money supply. Reserve money
creation has improved during 2012-13 so far,
and deposit creation and consequently, monetary
expansion is within sight of indicative
projections for the year (Table IV.2).
IV. MONETARYAND LIQUIDITYCONDITIONS
Table IV.1: Movements in Key Policy
Variables
(Per cent)
Effective since Repo Rate Cash Reserve Ratio
1 2 3
May 3, 2011 7.25 (+0.50) 6.00
June 16, 2011 7.50 (+0.25) 6.00
July 26, 2011 8.00 (+0.50) 6.00
September 16, 2011 8.25 (+0.25) 6.00
October 25, 2011 8.50 (+0.25) 6.00
January 28, 2012 8.50 5.50 (-0.50)
March 10, 2012 8.50 4.75 (-0.75)
April 17, 2012 8.00 (-0.50) 4.75
Note: Figures in parentheses indicate change in percentage
points.
Macroeconomic and Monetary Developments First Quarter Review 2012-13
24
Liquidity deficit eases in response to active
management and measures taken by the
Reserve Bank
IV.4	 There was a significant easing of
liquidity deficit in Q1 of 2012-13, and the extent
of deficit returned to the Reserve Bank’s
comfort level of one per cent of net demand
and time liabilities (NDTL) in July 2012 (Chart
IV.1). This was primarily on account of large
scale open market purchases by the Reserve
Bank as also measures such as enhancing of the
limit of export credit refinance (ECR).
IV.5	 There was a distinct period of liquidity
tightness that prevailed from November 2011
to early April 2012. The liquidity squeeze
started in November 2011 on account of large
scale forex intervention by the Reserve Bank as
well as the usual high currency demand during
the festive season. The squeeze on liquidity
persisted into Q4 of 2011-12 as the government
built up large balances with the Reserve Bank.
There was continued intervention in the forex
market while the drain on account of currency
persisted due to seasonal factors as well as
elections in a few states (Chart IV.2). Moreover,
Table IV.2: Monetary Indicators
Item Outstanding
Amount
(` billion)
July 13, 2012
Financial year to date
variations (Per cent)
Y-o-y variations
(Per cent)
2011-12 2012-13 July 15, 2011 July 13, 2012
1 2 3 4 5 6
Reserve Money (M0
)* 14,810.1 -1.8 3.8 13.3 9.5
Reserve Money (Adjusted) -1.8 3.6 13.5 15.7
Broad Money (M3
) 77,301.2 4.0 5.0 16.9 14.3
Main Components of M3
Currency with the Public 10,798.0 4.5 5.2 14.9 13.4
Aggregate Deposits 66,463.9 4.0 5.0 17.3 14.4
of which: Demand Deposits 6,603.5 -13.7 -6.3 -5.2 5.8
Time Deposits 59,860.4 6.6 6.4 20.7 15.4
Main Sources of M3
Net Bank Credit to Government 25,558.2 7.7 7.9 22.3 19.6
Bank Credit to Commercial Sector 50,751.6 2.0 2.3 19.3 17.4
Net Foreign Assets of the Banking Sector 16,377.6 1.2 6.1 5.8 16.2
Memo:
NetNon-monetaryLiabilitiesoftheBankingSector 15,531.7 -0.3 1.7 20.8 38.8
Note: 1. Data are provisional.
2. *: Data pertain to July 20, 2012.
Monetary and Liquidity Conditions
25
the spread between the pace of credit growth
and deposit growth, which had narrowed in the
first three quarters of 2011-12 and had in fact
turned negative in December 2011, widened
again during the fourth quarter. This added a
structural dimension to the liquidity deficit
(Chart IV.3). The Reserve Bank responded by
injecting liquidity through outright open market
operations of `1.3 trillion between November
2011 and March 2012 as also CRR cuts that
released about `0.8 trillion into the system.
Despite the active management, the liquidity
deficit persisted at a high level.
IV.6	 Since April 2012, however, there has
been an easing of the liquidity stress in the
system. The significant easing was brought
about by the Reserve Bank actively managing
liquidity through the liquidity adjustment facility
(LAF) and open market operations (OMO). The
Reserve Bank injected liquidity through outright
OMO purchases of `0.8 trillion in the financial
year so far, of which `0.6 trillion was through
auction route. Also, there was some narrowing
of the wedge between the pace of growth of
deposit and credit in Q1 of 2012-13.
IV.7	 In order to provide greater liquidity
cushion to banks, the borrowing limit of
scheduled commercial banks (SCBs) under the
Marginal Standing Facility (MSF) has been
raised from one per cent of their NDTL to two
per cent since April 17, 2012. This has further
helped in steering the monetary policy operating
target, the weighted average overnight call
money rate, within the formal corridor
(Chart IV.4). The movements in the operating
target of monetary policy mostly mirror the
liquidity position in the system.As noted above,
there was a systemic liquidity deficit from
November 2011 to earlyApril 2012. This period
coincided with the call rate mainly staying
above the mid-point of the corridor (i.e., the
repo rate) and at times hovering close to the
ceiling set by the MSF rate. As liquidity eased
in Q1 of 2012-13, the call rate gradually eased
back to the mid-point of the corridor.
IV.8	 To further augment liquidity and
encourage banks to increase credit flow to the
export sector, the Reserve Bank increased the
limit of ECR from 15 per cent of outstanding
export credit to 50 per cent with effect from the
fortnight beginning June 30, 2012. This
amounted to release of additional liquidity
support of over `300 billion, equivalent to about
50 basis points reduction in the CRR. The daily
average amount of ECR availed increased from
`70 billion in June 2012 to `177 billion in July
2012 (up to July 26) .
IV.9	 As regards the autonomous factors that
drive liquidity – currency with the public,
intervention in the foreign exchange market and
government’s cash position – the first two were
largely adverse during the Q1 of 2012-13. There
Macroeconomic and Monetary Developments First Quarter Review 2012-13
26
is typically strong demand for currency inApril
and May coinciding with the rabi marketing
season. Also, as there was extreme volatility in
the exchange rate, the Reserve Bank sold
foreign exchange to authorised dealers in May
and June. However, as a large part of the
intervention was also in the forward/swap
market, drain on rupee liquidity was not very
significant. The liquidity stress from the above
two autonomous factors was partly addressed
by the net drawdown of balances by the
government.As noted earlier, the large build-up
in the government balance with the Reserve
Bank in Q4 of 2011-12 had compounded the
liquidity deficit in that quarter. As government
spending increased significantly in the first
quarter of 2012-13, there was concomitant
easing of liquidity. The net effect of government
spending during the quarter (June 30, 2012 over
March 31, 2012) was release of `549 billion
into the system.
Reserve money expansion improves in Q1
of 2012-13
IV.10	 There was a sharp deceleration in the
pace of expansion of reserve money during Q4
of 2011-12. While this was predominantly on
account of the CRR cuts, even adjusting for the
first-round impact of CRR cut, the adjusted
reserve money growth showed a deceleration.
As seen earlier, active management of liquidity
through OMO, LAF and MSF transactions led
to a gradual rise in the rate of reserve money
expansion in Q1 of 2012-13 as against the
steady deceleration observed in the previous
quarters (Chart IV.5). On the liabilities side of
the Reserve Bank balance sheet, the growth is
explained by the increased demand for
currency.
Deceleration in broad money growth
arrested in Q1 of 2012-13
IV.11	 Given the significant primary liquidity
injection through OMO purchases and CRR
cuts, there has been a pick-up in growth rates
of monetary aggregates in 2012-13 so far as
against the steady deceleration observed in the
fourth quarter of 2011-12 (Chart IV.6). On a
y-o-y basis, the growth rate as on July 13, 2012
was lower than the previous year.
IV.12	 There was a pick-up in demand for
currency during the first quarter of 2012-13 as
is usually observed in Q1. The y-o-y growth
rate was lower than that of the previous
year on account of the base effect (Chart IV.7).
IV.13	 The mobilisation of deposits during the
first quarter of 2012-13 was higher than in
comparable period of recent years. The y-o-y
deposit growth of SCBs at 14.7 per cent on July
13, 2012 is below the indicative projection of
16 per cent for 2012-13 (Chart IV.8). The
Monetary and Liquidity Conditions
27
increase in deposit across the bank groups has,
however, been skewed (Table IV.3).
Monetary expansion improves with rise in
money multiplier
IV.14	 With the CRR cuts effected in January
2012 and March 2012, there has been a
reduction in the ratio of bankers’ deposits with
the Reserve Bank to aggregate deposits in the
banking system (the reserves deposit ratio).
However, monetary expansion remained
subdued during Q4 of 2011-12 as increase in
money multiplier was not commensurate to the
CRR cut as currency demand was high. The
relatively higher pace of deposit mobilisation
in 2012-13 so far has resulted in lowering both
the behavioural ratios. Thus, with the rise in the
Table IV.3: Aggregate Deposits of
Scheduled Commercial Banks
(Amount in ` billion)
Bank Group Out-
standing
as on
July 13,
2012
Y-o-y variation as on
July 15, 2011 July 13, 2012
Amount Per
cent
Amount Per
cent
1 2 3 4 5 6
1.	Public Sector Banks* 46,453.6 6,458.6 18.9 5,897.2 14.5
	 of which: SBI and
Associates
14,076.4 1,650.9 15.7 1,898.6 15.6
Nationalised
Banks
32,377.1 4,807.8 20.4 3,998.6 14.1
2. 	Foreign Banks 2,697.6 114.7 5.0 276.8 11.4
3. 	Private Banks 11,294.3 1,485.1 18.2 1,645.6 17.1
4. 	All Scheduled
Commercial Banks
62,217.5 8,259.0 18.0 7,991.3 14.7
Note:	 1)	 Data as on July 13, 2012 are provisional.
	2)	 * Excluding Regional Rural Banks.
Macroeconomic and Monetary Developments First Quarter Review 2012-13
28
money multiplier, there has been a gradual pick-
up in money supply in 2012-13 so far (Chart
IV.9).
Credit growth in line with the indicative
trajectory for 2012-13
IV.15	 The y-o-y growth rate in non-food
credit increased to 17.4 per cent in mid-July
2012 from 16.8 per cent at end-March 2012
(Chart IV.10). Hence, credit growth is in line
with the indicative trajectory of 17 per cent for
the year. Anecdotal evidence from bankers
suggests that there may be some deceleration
ahead.
IV.16	 Analysis of the sectoral deployment of
credit (based on data from select banks which
cover 95 per cent of total non-food credit
	
extended by all SCBs) for Q1 of 2012-13 reveals
that industries, services and personal loans
accounted for 36.1 per cent, 28.6 per cent and
28.6 per cent, respectively, of the incremental
credit flow during the quarter. Within industries,
nearly two-thirds of the credit flow was to
mining and quarrying, rubber, plastic and their
products, beverage and tobacco, vehicle, vehicle
parts and transport equipment and wood and
wood products.
Increase in the flow of resources to the
commercial sector
IV.17	 There has been a 41 per cent increase
in the total flow of financial resources to the
commercial sector during 2012-13 so far,
compared to the corresponding period of
previous year (data on banks is available till
July 13, 2012 while that for most non-bank
sources is for up to June only). Unlike the
previous year, banks as well as non-banks had
a near equal contribution to funding in the
economy during the period (Table IV.4). There
was about two-fold increase in funding from
non-bank domestic sources. The marked
increase was on account of higher issuances of
commercial papers (CPs), accommodation
from all Indian financial institutions (AIFIs),
net credit by housing finance companies and
LIC’s net investment. Foreign sources of
funding, however, declined compared to the
corresponding period of the previous year. This
is consistent with the slowdown in capital flows
during the year so far.
Monetary and liquidity conditions are not
significantly impinging on growth
IV.18	 While there has been some rise in
nominal and real interest rates during 2011-12,
computation of real weighted average lending
rates (WALR) suggest that they are currently
much lower than the pre-crisis period of
2003-04 to 2007-08 when the investment boom
took place. In nominal terms, the WALR
averaged 12.4 per cent in the pre-crisis period,
Monetary and Liquidity Conditions
29
but fell to 10.5 per cent in 2009-10. After
marginal hardening for two years, the nominal
rate stood at 12.7 per cent for 2011-12. The real
WALR calculated as nominal rate less WPI
inflation fell from an average of 7.0 per cent in
the pre-crisis period to 4.0 per cent in the post-
crisis period, and was as low as 3.8 per cent in
2011-12 (Table IV.5). The fall is less sharp if
GDP deflator is used to calculate inflation
instead of WPI.
IV.19	 A negative relationship between real
output growth and real interest rates does exist,
and as such real interest rate matters for growth
and investment. In spite of the rate hikes, real
interest rates are lower than in the pre-crisis
period. In this context, there is a need to look
at non-monetary factors that are constraining
growth as current monetary and liquidity
Table IV.5: Real Lending Rate based on
Weighted Average Lending Rate (WALR)
Year (March-end) WALR Real Lending Rate
calculated using
WPI GDP-deflator
1 2 3 4
2003-08* 12.4 7.0 7.3
2008-09 11.5 3.4 3.0
2009-10 10.5 6.7 4.6
2010-11 11.4 1.8 3.0
2011-12^ 12.7 3.8 4.7
WALR: Weighted average nominal lending rate, estimated
based on Basic Statistical Returns of Scheduled Commercial
Banks.
* 	Average of the years 2003-04, 2004-05, 2005-06, 2006-07
and 2007-08.
^	 WALR for 2011-12 is based on data for 21,452 branches of
16 banks.
Table IV.4: Flow of Financial Resources to the Commercial Sector
(` billion)
Item April-March April-July 13
2010-11 2011-12 2011-12 2012-13
1 2 3 4 5
A.	 Adjusted Non-food Bank Credit (NFC) 7,110.3 6,764.4 526.3 984.7
	 i)	 Non-Food Credit 6,815.0 6,525.2 601.5 911.3
		 of which: petroleum and fertiliser credit -243.2 171.4 41.8 -28.7 #
	 ii)	 Non-SLR Investment by SCBs 295.3 239.2 -75.2 73.4
B.	 Flow from Non-banks (B1+B2) 5,341.1 5,745.8 846.3 944.8
	 B1.	 Domestic Sources 3,010.9 3,441.8 255.9 556.4
		 1.	 Public issues by non-financial entities 285.2 74.0 7.5 5.1 #
		 2.	 Gross private placements by non-financial entities 674.4 558.1 - -
		 3.	 Net issuance of CPs subscribed to by non-banks 67.9 100.2 234.3 355.0 #
		 4.	 Net credit by housing finance companies 427.9 530.1 19.8 68.5 $
		 5.	 Total gross accommodation by the four RBI regulated AIFIs - NABARD,
NHB, SIDBI & EXIM Bank
400.1 469.2 -66.8 37.6 #
		 6.	 Systemically important non-deposit taking NBFCs (net of bank credit) 794.7 1,290.8 P - -
		 7.	 LIC's gross investment in corporate debt, infrastructure and social sector 360.8 419.4 61.1 90.2 #
	 B2.	 Foreign Sources 2,330.3 2,304.0 590.4 388.4
		 1.	 External Commercial Borrowings / FCCBs 555.0 421.0 136.0 102 #
		 2.	 ADR/GDR Issues excluding banks and financial institutions 92.5 27.0 12.4 2.4 #
		 3.	 Short-term credit from abroad 501.8 306.0 - -
		 4.	 FDI to India 1,181.0 1,550.0 442.0 284.0 $
C.	 Total Flow of Resources (A+B) 12,451.5 12,510.2 1,372.6 1,929.5
Memo Item:
Net resource mobilisation by Mutual Funds through Debt (non-Gilt) Schemes -367.1 185.2 101.9  210.2  #
 $: Up to May 2012. #: Up to June 2012. P: Provisional. -: Data not Available.
conditions are not impinging upon growth
significantly.
Macroeconomic and Monetary Developments First Quarter Review 2012-13
30
V. FINANCIAL MARKETS
Global financial conditions deteriorated further during Q1 of 2012-13 as Greece and Spain
came near flashpoint, requiring further bailouts to contain the contagion. The LIBOR-fixing case
further demonstrated the fragilities in the banking and financial market space. Subdued global
growth is increasing spillover risks, even as fresh rounds of austerity measures have been put
in place to tackle the sovereign debt crisis. The financial markets in India also remained under
pressure with increased volatility in the currency and equity markets, in line with the other
emerging economies. The Reserve Bank undertook a slew of measures to boost capital flows
and also to ensure adequate liquidity in the domestic money markets.
Optimism for euro area recovery fades as
uncertainties re-emerge
V.1	 Euro area difficulties increased sharply
in Q1 of 2012-13, first as political parties in
Greece failed to form a new government
necessitating re-elections, and later with the
deepening banking crisis in Spain. Prior to the
re-elections in Greece, markets viewed Greece’s
exit from the euro area as imminent. Even after
the pro-euro coalition of parties came to power
in the Greece re-elections, market uncertainty
prevails on how long Greece may stay as part
of the euro area.Aheightened Spanish banking
problem has increased the risks to euro area
financial stability. The risks associated with
sovereign debt indicated by spreads of credit
default swaps (CDS) has, in general, increased
over end-March 2012 levels (Chart V.1 a, b).
V.2	 The subdued economic outlook and
increased risk aversion drove investors to safe
assets such as US and German sovereign bonds
leading to lower yields. On the other hand, the
G-sec yields of countries perceived as riskier
rose significantly (Chart V.1 c).
V.3	 Increased funding pressures and
regulatory requirements, compounded by the
uncertainties in the euro area, have intensified
deleveraging by European banks since H2 of
2011-12. The impact of deleveraging was also
evident as international claims by European
Financial Markets
31
banks in BRICS countries declined in the
second half of 2011 (Chart V.1d). Going
forward, the pace of deleveraging may slow
down. However, the ongoing regulatory reforms
and proposed implementation of Basel III
recommendations in 2013 may lead to continued
tightening of lending conditions.
V.4	 Since Q3 of 2011-12, the euro area
economy has either contracted or remained
stagnant. The difficulties in the euro area have
triggered an austerity versus growth debate,
reflecting the perception that austerity-focused
policies have contributed to economic hardship
while failing to eliminate the existential threat
to the euro. Despite the two Long-Term
Refinancing Operations (LTROs) conducted by
the ECB that infused more than €1 trillion into
the system, credit off-take has remained
subdued. Much of the liquidity found its way
back to the ECB’s overnight deposit facility,
while the growth in private sector lending turned
negative in May 2012 (Chart V.2).
Policy Response to Slowing Growth and
Sovereign Debt Concerns
V.5	 Significant headwinds from the euro area
have compounded the global slowdown,
prompting widespread growth-enabling policy
measures towards the end of Q1 of
2012-13. Recent initiatives by the European
Council to alleviate economic and financial
pressures in the euro area include proposals to
establish a single supervisory mechanism
involving the ECB,  the European Stability
Mechanism (ESM) and plausible direct
recapitalisation of banks. However, a robust
long term solution is pending.This is highlighted
by the return of stress in the financial markets
following Moody’s decision to attach a negative
outlook on theAaa sovereign rating of Germany,
Netherlands and Luxembourg and the debt
rollover difficulties being faced by Spain and
Italy. Thereafter, the Spanish yields firmed up.
Capital inflows into emerging markets
decline as growth moderates
V.6	 Subdued growth in the advanced
economies (AEs) and euro area concerns
coupled with moderation in domestic growth
conditioned the financial markets of emerging
and developing economies (EDEs), with FII
inflows turning negative for most EDEs
(Chart V.3). However, following the slew of
monetary easing measures in mostAEs towards
the end of Q1 and early Q2 of 2012-13, the trend
is expected to reverse moderately. Declining
equity market trends as well as the depreciation
of EDE currencies against the US dollar
underscore the damp investor sentiments.
Indian financial markets impacted by
lower growth, decline in capital inflows
and euro area uncertainty
V.7	 Lower growth, persistent inflation and
concerns over fiscal and current account deficits,
in addition to the global economic weakness
and the re-emergence of the euro area crisis,
Macroeconomic and Monetary Developments First Quarter Review 2012-13
32
conditioned the Indian financial markets in Q1
of 2012-13. Money market rates declined during
2012-13 so far, reflecting improved liquidity
conditions in the system and the 50 bps
reduction in the repo rate announced in the
Monetary Policy Statement 2012-13. The G-sec
yields declined reflecting the lower growth
expectations, global risk aversion driven flight
to safe-haven government securities and
purchase of securities through OMO. Funding
strains kept deposit rates sticky, nevertheless,
the base rate of banks showed a slight
moderation. In line with other Asian countries,
the Indian rupee depreciated, but by a higher
magnitude on account of exacerbated concerns
on current account and fiscal deficits. Equity
markets declined led by a weak investment
climate, muted domestic growth and FII
outflows in Q1 of 2012-13.
Call rate eased reflecting improved liquidity
conditions
V.8	 With liquidity conditions remaining
significantly tight in March 2012 on account of
quarterly advance tax outflows and rise in
currency in circulation, all segments of the
money market witnessed an increase in rates.
However, during Q1 of 2012-13, the liquidity
conditions eased with the average daily LAF
injection showing a declining trend (Table V.1).
Supported by the cut in policy rate and improved
liquidity conditions (partly due to the OMOs by
the Reserve Bank), the call rate declined
subsequently (Chart V.4).
V.9	 The rates in the collateralised segments
moved in tandem with the call rate, but have
generally remained below it during 2012-13 so
far. Banks and primary dealers remain the major
Table V.1: Average Daily Volume in Domestic Financial Markets
(` billion)
Money Market Bond Market Forex
Market
Inter-bank
(US$ mn)
Stock
Market ##
LAF Call
Money
Market
Repo
CBLO Commercial
Paper*
Certificates
of Deposit*
G-Sec** Corporate
Bond #
1 2 3 4 5 6 7 8 9 10 11
Mar-12 -1574.3 175.1 111.8 379.8 911.9 4195.3 98.6 26.1 20.6 151.9
Apr-12 -1028.6 249.5 143.2 376.8 1310.0 4447.5 141.1 20.0 23.1 120.1
May-12 -985.5 184.5 151.3 339.1 1498.0 4394.1 151.8 17.5 20.9 117.3
Jun-12 -913.0 151.8 180.4 375.9 1258.1 4251.7 257.6 29.5 18.4 117.1
Jul-12(P) -476.5^ 149.9^ 172.1^ 411.6^ - - - 28.8@
- 112.8@
*: Outstanding position. 	 **: Average daily outright trading volume in central government dated securities.
#: Average daily trading in corporate bonds.	 ##: Average daily turnover in BSE and NSE.        P: Provisional
^: Average daily data up to July 26, 2012.	 @
: Up to July 24, 2012.
Note: In col. 2, (-) ve sign indicates injection of liquidity while (+) ve sign indicates absorption of liquidity.
Financial Markets
33
groups of borrowers in the collateralised
segments, while mutual funds (MFs) continue
as the major group of lenders.
V.10	 CD rates spiked during March 2012,
reflecting overall tight liquidity conditions in
the money markets and the reluctance of MFs
to rollover bank CDs after asset management
companies were made accountable for fair
valuations on a mark-to-market basis. CP rates
firmed up similarly. However, since then the
weighted average effective interest rates
(WAEIR) on CDs and the weighted average
discount rate (WADR) of commercial paper
(CP) declined, following improved liquidity
conditions.
G-sec yields declined, reflecting the
domestic economic situation, declining
crude oil prices
V.11	 Driven by expectations of a rate cut in
theAnnual Policy of the Reserve Bank, and also
by concerns of weakening industrial and export
growth, G-sec yields softened at the beginning
of Q1 of 2012-13. However, S&P’s revision of
India’s long term rating outlook to negative led
yields to temporarily firm up towards the end
of April 2012. The declining trend in crude oil
prices, general risk aversion and purchase of
securities through OMO caused the yields to
ease thereafter (Chart V.5).
V.12	 Yields continued to soften during the first
half of June 2012 following the disappointing
growth figure for Q4 of 2011-12 at 5.30 per cent.
On the whole, in Q2 of 2012-13 so far, the yields
exhibited a softening bias. According to SEBI
data, FIIs made investments in debt worth `51.5
billion in 2012-13 so far (up to July 23, 2012).
MFs also bought debt worth `1,535.5 billion
during the same period.
V.13	 The markets remain cautious about the
reduction in fiscal deficit. Gross market
borrowings of the government through dated
securities during 2012-13 were `2.3 trillion (net
borrowings `1.6 trillion) up to July 23, 2012
compared with `1.6 trillion (net borrowings
`1.1 trillion) during the corresponding period
of the previous year (Table V.2). During 2012-
13 (up to July 23, 2012), 20 states raised `420
billion on a gross basis (net `370 billion)
compared with `370 billion on a gross basis (net
`303 billion) raised by 14 states during the
Table V.2: Issuances of Central and State
Government Dated Securities
Item 2011-12 2012-13*
1 2 3
Central government
Gross amount raised (` billion) 5,100.0 2,340.0
Devolvement on primary dealers (` billion) 121.1 12.0
Bid-cover ratio (range) 1.4-5.1 1.5-3.6
Weighted average maturity (years) 12.7 13.6
Weighted average yield (per cent) 8.5 8.5
State government
Gross amount raised (` billion) 1,586.3 419.8
Cut-off yield range (per cent) 8.4-9.5 8.7-9.3
Weighted average yield (per cent) 8.8 9.0
*Up to July 23, 2012.
Macroeconomic and Monetary Developments First Quarter Review 2012-13
34
corresponding period of 2011-12. The weighted
average yield firmed up to 9.0 per cent up to
July 23, 2012 from 8.6 per cent for the same
period in the previous year.
Deposit rates of banks stay sticky, reflecting
higher costs and inflation
V.14	 The modal deposit rates for scheduled
commercial banks (SCBs) declined marginally
by 2 bps to 7.40 per cent across all maturities
during Q1 of 2012-13, while the modal base
rate of SCBs declined by 25 bps to 10.50 per
cent (Table V.3). Banks’ response on deposit
rates remain rather muted so far, reflecting the
interplay of factors such as tight liquidity
conditions in Q1 of 2012-13 and high inflation.
Rupee depreciated sharply amid concerns
of widening current account and fiscal
deficit and global uncertainty
V.15	 In Q4 of 2011-12, the Indian rupee
reversed its falling streak exhibited during most
of the year and recorded some gains. Owing to
the interplay of a mix of domestic and global
factors (see para III.6 page 19), the rupee started
weakening from April 2012. Subsequently
however, the rupee gained due to improved FII
flows coupled with the lower trade deficit partly
aided by policy initiatives. The distinct phases
and primary drivers of the rupee movement over
the course of the year have been mapped in  
Chart V.6.
V.16	 The depreciation of the exchange rate in
Q1 of 2012-13 is not specific to India; most EDE
currencies have also depreciated. However, the
depreciation of Indian rupee is large reflecting
growing current account deficit unlike other
major Asian economies who have current
account surpluses (Table V.4).
Equity markets turned cautious on
concerns about the investment climate
V.17	 The slow recovery in Q4 of 2011-12
reversed for most part of Q1 of 2012-13, on the
Table V.3: Deposit and Lending Rates of Banks
(Per cent)
Items Mar-11 Jun-11 Sep-11 Dec-11 Mar-12 Jun-12
1 2 3 4 5 6 7
1.	 Domestic Deposit Rate (1 - 3 year tenor)
i)	 Public Sector Banks 8.00-9.75 8.25-9.75 8.55-9.75 8.55-9.75 9.00-9.75 8.75-9.50
ii) 	 Private Sector Banks 7.75-10.10 8.00-10.50 8.00-10.50 8.00-10.50 8.00-10.50 8.00-10.00
iii) 	 Foreign Banks 3.50-9.10 3.50-10.00 3.50-9.75 3.50-9.75 3.50-9.75 3.50-9.75
Modal Deposit Rate (all tenors) 6.65 7.08 7.44 7.46 7.42 7.40
2. Base Rate
i) 	 Public Sector Banks 8.25-9.50 9.25-10.00 10.00-10.75 10.00-10.75 10.00-10.75 10.00-10.50
ii) 	 Private Sector Banks 8.25-10.00 8.50-10.50 9.70-11.00 10.00-11.25 10.00-11.25 9.75-11.25
iii) 	 Foreign Banks 6.25-9.50 6.25-9.50 6.25-10.75 6.25-10.75 7.38-11.85 7.38-11.85
Modal Base Rate 9.50 10.00 10.75 10.75 10.75 10.50
3. Median Lending Rate*
i) 	 Public Sector Banks 8.88-14.00 9.50-14.50 10.50-15.25 10.25-15.25 10.60-15.35 -
ii) 	 Private Sector Banks 9.00-14.50 9.25-15.00 9.00-15.25 10.00-15.50 10.50-15.50 -
iii) 	 Foreign Banks 7.70-14.05 7.70-14.50 9.13-14.75 9.50-14.38 10.00-14.50 -
* : Median range of interest rate at which at least 60 per cent business has been contracted.      - : Not available.
Financial Markets
35
backdrop of deceleration in IIP growth, weak
revenue outlook for major Indian IT companies
and concerns over the implementation of
retrospective tax and general anti-avoidance
rules (GAAR). Euro area crisis, the downgrade
of India’s long term rating outlook to negative
from stable and the rupee slide also affected the
market sentiment. However, the later part of
June 2012 saw the market turnaround from low
levels on account of a pick-up in FII investment
in the equity market, clarifications by the
government on retrospective tax, GAAR and
the government decision to boost investments
in infrastructure, and, on the global front, the
European Council’s decision to support stressed
euro area sovereigns and banks. SEBI data
indicate that FIIs sold shares worth `9.8 billion
in Q1 of 2012-13, while MFs sold shares worth
`6.4 billion during the same period (Chart V.7).
V.18	 In Q2 of 2012-13 so far (up to July 23,
2012), the equity market recovered aided by FII
investments (`78.7 billion), moderation in the
depreciation of the rupee and the easy monetary
policy pursued globally.
The primary market remained subdued
V.19	 The low risk appetite of investors coupled
with a weak secondary market and negative
returns on IPOs led to low resource mobilisation
Table V.4: Movements in Select EDE
Currencies against the US Dollar
Appreciation (+)/Depreciation (-) in per cent (y-o-y)
 Currency 2010-11 2011-12 Apr-Jul 26, 2012
1 2 3 4
Current Account Deficit Countries
1. Brazil 9.7 -10.8 -10.1
2. India 1.1 -12.7 -8.6
3. Mexico 4.3 -7.0 -4.6
4. South Africa 8.0 -11.5 -7.5
5. Turkey -4.8 -10.5 -1.7
Current Account Surplus Countries
1. Argentina* -4.3 -7.5 -4.2
2. China 4.1 4.2 -0.7
3. Indonesia 4.7 -5.1 -3.3
4. Malaysia 8.2 -1.4 -3.2
5. Russia 3.4 -2.8 -10.1
6. South Korea 2.2 -2.7 -1.1
7. Thailand 6.7 -1.8 -2.6
*: Current account balance turned into deficit from 2011.
Table V.5: Resource Mobilisation from
Capital Market
(` billion)
Category 2011-12 2011-12
(Apr-Jun)
2012-13
(Apr-Jun)
1 2 3 4
A.	 Prospectus and Rights
Issues*
129 70 5
	 1.	 Private Sector (a+b) 83 24 5
		 a)	 Financial 9 17 0
		 b)	 Non-financial 74 7 5
	 2.	 Public Sector 46 46 0
B.	 Euro Issues 27 12 2
C. 	Mutual Fund
Mobilisation(net)@
-220 730 -4,995
	 1. 	Private Sector -154 644 -3,985
	 2. 	Public Sector # -66 86 -1,010
* Excluding offer for sale. 	 @: Net of redemptions.
#: Including UTI MF.
Source: Mutual Fund data are sourced from SEBI and exclude
funds mobilised under Fund of Funds Schemes.
Macroeconomic and Monetary Developments First Quarter Review 2012-13
36
in the primary segment in 2011-12. During
2012-13 so far (up to end-June 2012), the
primary market continued to remain muted, with
only `5 billion mobilised through six public
issues (four IPO and two rights issues)
(Table V.5).
Housing prices increased in most cities
despite lower volumes
V.20	 AccordingtotheReserveBank’squarterly
House Price Index (HPI) during Q4 of 2011-12
housing prices in all cities, except Kolkata,
showed an increase on a y-o-y basis. Compared
to the previous quarter, housing prices show a
moderation for Bengaluru, Lucknow and
Chennai (Table V.6). The number of housing
transactions on an annual basis shows mixed
trends,withtheaverageall-IndiaIndexremaining
almost unchanged. While Mumbai, Delhi,
Ahmedabad and Bengaluru report a decline in
transaction volumes on an annual basis, the
quarterly decline in five out of nine cities has led
to a decline in the all-India transaction volume
index growth. Despite transaction volumes
moderating in the later part of 2011-12, housing
prices seem to have firmed up.
Stressedfinancialconditionslikelytopersist
V.21	 Financial conditions are likely to remain
uncertain in the near-term with the stress likely
to persist for some time, given both global and
domestic conditions. The recent LIBOR fixing
controversy has also added to the uncertainty
by drawing attention to how a few large global
financial institutions allegedly manipulated one
of the most commonly used market rates. The
episode has also reduced market confidence in
key benchmark rates. Cases of inattention to
money laundering have also dented market
confidence. These events add to the already
existing pressures arising from euro area
fragilities.
V.22	 On the domestic front, falling corporate
earnings at a time when corporate positions are
already leveraged, could keep equity markets
under pressure. As such, there is a need to
improve the investment climate to drive the
economy out of its slowdown and improve
market sentiments. While currency pressures
have currently abated, uncertainty remains
ahead with global risk aversion being high and
the external sector weakening.
Table V.6: House Price and Transactions Volume Indices (Base Q4:2008-09 = 100)
Quarter Mumbai Delhi Bengaluru Ahmedabad Lucknow Kolkata Chennai* Jaipur Kanpur All India
1 2 3 4 5 6 7 8 9 10 11
House Price Index
Q4: 2010-11 172.3 135.2 113.6 128.7 140.3 171.9 106.8 155.3 135.7 141.7
Q1:2011-12 191.6 152.8 116.9 152.3 149.3 157.0 106.3 161.1 135.4 152.0
Q2:2011-12 206.1 153.0 116.0 162.8 159.2 159.0 113.9 165.1 138.3 157.8
Q3:2011-12 191.7 168.6 146.1 171.8 172.3 155.0 120.3 163.5 140.0 164.1
Q4:2011-12 224.7 195.3 140.6 177.2 169.7 158.4 117.0 164.4 148.7 176.9
Growth in per cent
Y-o-Y 30.4 44.4 23.7 37.7 21.0 -7.9 9.5 5.9 9.5 24.8
Q-o-Q 17.2 15.8 -3.8 3.1 -1.5 2.2 -2.7 0.5 6.2 7.8
House Transactions Volume Index
Q4: 2010-11 111.9 151.5 102.2 153.8 108.4 91.1 81.6 218.7 156.2 126.3
Q1:2011-12 89.5 149.4 100.8 134.3 93.9 107.9 80.3 243.1 208.4 123.2
Q2:2011-12 79.0 165.5 123.5 154.1 106.7 139.2 85.5 239.1 131.1 129.1
Q3:2011-12 75.9 195.9 84.6 131.2 165.1 108.9 130.9 222.0 120.6 128.9
Q4:2011-12 108.6 149.8 70.8 122.2 153.0 128.5 99.0 247.5 172.1 126.5
Growth in per cent
Y-o-Y -2.9 -1.1 -30.7 -20.5 41.1 41.1 21.3 13.2 10.2 0.2
Q-o-Q 43.1 -23.5 -16.3 -6.9 -7.3 18.0 -24.4 11.5 42.7 -1.9
Note: * Chennai index is based on both residential and commercial properties.
All India index is a weighted average of city indices, weights based on population proportion.
37
Price Situation
Addedmonetaryeasingbymajoreconomies
as falling inflation provides space
VI.1	 Continuing uncertainty about how the
sovereign debt crisis might play out along with
newer indications of weakening growth, both
in Advanced Economies (AEs) as well as
Emerging and Developing Economies (EDEs)
resulted in a decline in global commodity prices
and moderation of global inflation. Demand
pressures in theAEs are likely to remain muted
for an extended period of time due to negative
output gaps and subdued wages in the face of
continued high unemployment in most
economies. Inflation is also edging lower in
mostEDEs,largelyhelpedbylowerinternational
primary commodity prices, given the higher
share of primary commodities in their overall
consumption. However, the ultimate impact of
falling commodity prices on the EDEs is also
conditioned by the exchange rate movements
of their currencies. Volatility in commodity
prices and exchange rate movements are likely
to impart greater volatility in inflation for EDEs
as compared with AEs.
VI.2	 In view of the amplified risks to growth
and weakening inflationary pressures, many
central banks undertook further monetary policy
easing, although most of them remained wary
VI. PRICE SITUATION
Headline inflation persisted above 7 per cent during Q1 of 2012-13 due to a rebound in food
inflation as well as high fuel inflation even as non-food manufactured products inflation declined
to below 5 per cent. The softening impact of growth moderation on inflation was partly offset by
structural rigidities in the supply of food as well as the exchange rate depreciation. The benefits
from the decline in global commodity prices were also partly offset by the falling rupee. The
near-term inflation trajectory could remain sticky and conditioned by a number of risks that
emanate from the unsatisfactory progress and distribution of the south-west monsoon, higher
MSPs announced for kharif crops and the impact of the exchange rate pass-through. The path
of inflation could also be impacted by the timing and magnitude of administered price revisions
even though such adjustments have become necessary to reduce pressure on the medium-term
inflation from expansionary fiscal policy. Continued pressure from wages and the structural nature
of protein-food inflation could also keep inflation high even with moderation in overall growth.
of additional quantitative easing. The US Fed
decided to extend “Operation Twist” till
December 2012. The European Central Bank in
June 2012 broadened the collateral acceptable
at its window and in July 2012 reduced its policy
rate. However, the Bank of England decided to
increase its quantitative easing asset purchase
programme. The People’s Bank of China
reduced the reserve requirements ratio in May
2012 and further cut its policy rate in June and
July 2012. CPI inflation in all these countries
has fallen and is currently below 3 per cent, thus
providing monetary space to address growth
risks (Table VI.1).
Global commodity prices declined on
amplified risks to global growth and
improved supply prospects
VI.3	 International prices of most
commodities weakened during Q1 of 2011-12
due to growing economic uncertainties and
weakening growth (Chart VI.1). Though the
benefit from lower global commodity prices to
India was partly offset by the depreciation of
the rupee, as in the case of many EDEs, overall
it has had a softening impact on global inflation.
Global crude oil prices moderated on sovereign
debt fears and the continued rise in production
and build-up of inventories. Brent crude prices
Macroeconomic and Monetary Developments First Quarter Review 2012-13
38
fell by about 25 per cent during Q1 of 2012-13.
Compared with the average price of US$ 111.9
per barrel during 2011-12, the average Indian
basket crude oil prices moderated to US$ 106.9
Table VI.1: Global Inflation Indicators
Country/
Region
Key Policy Rate Policy Rate
(as on July 27, 2012)
Changes in Policy Rates
(basis points)
CPI Inflation
(y-o-y,
Per cent)
Sep. 2009 to
Dec. 2011
Jan. 2012 to
Jul. 2012
(as on 27th
)
Jun-11 Jun-12 
1 2 3 4 5 6 7
Advanced Economies
Australia Cash Rate 	 3.50	 (Jun. 6, 2012) 125 (-) 75 3.6# 1.2#
Canada Overnight Rate 	 1.00	 (Sep. 8, 2010) 75 0 3.1 1.5
Euro area Interest Rate on Main Refinancing
Operations
	 0.75	 (Jul. 6, 2012) 0 (-) 25 2.7 2.4
Israel Key Rate 	 2.25	 (Jul. 1, 2012) 225 (-) 50 4.2 1.0
Japan Uncollateralised Overnight Call Rate 	 0.0 to 0.10*	(Oct. 5, 2010) (-) 10 0 -0.4$ 0.2$
Korea Base Rate 	 3.00	 (Jul. 12, 2012) 125 (-) 25 4.2 2.2
UK Official Bank Rate 	 0.50	 (Mar. 5,2009) 0 0 4.2 2.4
US Federal Funds Rate 	 0.0 to 0.25*	(Dec. 16,2008) 0 0 3.6 1.7
Emerging and Developing Economies 
Brazil Selic Rate 	 8.00	 (Jul. 7, 2012) 225 (-)300 6.7 4.9
China Benchmark 1-year Deposit Rate 	 3.00	 (Jul. 6, 2012) 125 (-)50 6.4 2.2
  Benchmark 1-year Lending Rate 	 6.00	 (Jul. 6, 2012) 125 (-)56    
    (600) (-150)    
India Repo Rate 	 8.00	 (Apr. 17, 2012) 375 (-) 50 8.7$ 10.2$
      (100) (-125)    
Indonesia BI Rate 	 5.75	 (Feb. 9, 2012) (-) 50 (-) 25 5.5 4.5
Philippines Reverse Repurchase Rate 	 3.75	 (Jul. 26, 2012) 50 (-) 75 5.2 2.8
  Repurchase Rate 	 5.75	 (Jul. 26, 2012) 50 (-) 75    
Russia Refinancing Rate 	 8.00	 (Dec. 26 2011) (-) 275 0 9.4 4.3
South Africa Repo Rate 	 5.00	 (Jul. 20, 2012) (-) 150 (-) 50 5.0 5.5
Thailand 1-day Repurchase Rate 	 3.00	 (Jan. 25, 2012) 200 (-) 25 4.1 2.6
 *: Change is worked out from the minimum point of target range. #: Q2 (April-June). $: May.
Note:	Figures in parentheses in column (3) indicate the effective dates when the policy rates were last revised. Figures in parentheses
in columns (4), (5) and (6) indicate the variation in the cash reserve ratio during the period. For India, data on inflation pertain
to CPI for Industrial Workers (CPI-IW).
Source: Websites of respective central banks/statistical agencies.
39
Price Situation
per barrel during Q1 of 2012-13. Prices declined
to US$92 per barrel during the second fortnight
of June 2012 before recovering to US$102.3
per barrel as on July 26, 2012. The recent
increase has been both on account of aggravated
geo-political tensions and monetary policy
stimulus to revive growth by a number of central
banks.
VI.4	 Metal prices declined on concerns about
moderation in global demand with the focus on
Europe and China. Global food prices also
moderated in recent months as is evident from
the decline of the Food and Agricultural
Organisation (FAO) food price index by about
7 per cent during Q1 of 2012-13. However,
drought in the US and unfavourable weather
conditions in Europe and other major crop
producing countries are likely to impact food
production negatively during 2012-13, which
could put upward pressure on global food prices.
Moreover, global commodity prices could come
under further pressure if demand in the EDEs
recover or excess global liquidity spills over to
the commodity markets.
Inflation pressures persist in India despite
weakening of growth momentum
VI.5	 Headline wholesale price index (WPI)
inflation declined from a high of 10 per cent in
September 2011 to 7.2 per cent in January 2012.
During Q1 of 2012-13, the average headline
inflation was at 7.4 per cent (7.3 per cent,
provisional, for June 2012) (Chart VI.2). The
current headline inflation, though lower than
the average inflation of above 9 per cent during
the past two years, is much higher than the
decadal average of 5.4 per cent during the
2000s. The WPI increased on a sustained basis
and the 3-month moving average seasonally
adjusted month-over-month changes since
January 2012 indicate sustained price pressures
with some moderation in April-May 2012
(Chart VI.2 d).
VI.6	 In terms of contribution to overall
inflation, the share of food picked up sharply
from February 2012. However, the contribution
of manufactured non-food products recorded a
consistent decline which was largely on account
of deceleration in growth momentum in Q4 of
Macroeconomic and Monetary Developments First Quarter Review 2012-13
40
2011-12. The contribution of the fuel group
remained high (Chart VI.3).
Food inflation persists at high levels
VI.7	 Food inflation increased significantly
in recent months, driven largely by the increase
in vegetable prices following the seasonal
decline. Apart from vegetables, inflation was
also high in pulses and edible oils in recent
months.Advance estimates of production show
shortfalls in the production of pulses as well
as oilseeds during 2011-12. While cereals
inflation remained moderate in the recent past
(3.6 per cent on average during October
2010-March 2012), it increased to 6.4 per cent
in Q1 of 2012-13 despite record foodgrains
production in the previous year.Also, inflation
in protein-rich items like milk, eggs, fish and
meat continued to be in the double digits since
August 2011, reflecting both structural
demand-supply imbalances and input cost
pressures (Chart VI.4). While the volatility in
food inflation was largely on account of the
seasonal movements in the prices of vegetables,
the sustained increase in the prices of protein-
rich items imparted a structural character to
food inflation.
Uncertainty over monsoon and high MSP
could put further pressure on food inflation
VI.8	 There could be a further build-up of
food inflationary pressures during 2012-13. The
slow progress of the south-west monsoon so
far and the uncertainty about its quantum as
well as spatial and temporal distribution has
emerged as a major risk to food inflation in the
near-term. For the marketing year 2012-13, the
government has announced increase in the
minimum support price (MSP) for various
crops in the range of 15 to 53 per cent. The
commodities for which MSP has been raised
have a combined weight of 3.4 per cent in
overall WPI and the average increase (using
WPI weights) work out to 25.6 per cent. The
impact of MSP on market prices could vary
across different commodities. However, the
price pressures from the MSP continue to
remain a major risk to inflation as the increases
in MSP tend to translate into increases in
market prices for most commodities.
41
Price Situation
High fuel inflation continued as rupee
depreciation partly offset lower crude
prices
VI.9	 Fuel inflation remained in double
digits, reflecting the increase in international
crude oil prices over the past two years.
Though global crude oil prices have declined
since March 2012, lagged pass-through of past
increases has led to further increase in fuel
prices. The Oil Marketing Companies (OMC)
raised petrol prices by `7.5 per litre on May
24, 2012 and subsequently adjusted the prices
in line with changes in international prices.
Also, the OMCs decided to implement the
revised structure of ‘state specific cost’ with
effect from July 24/25, 2012 to adjust for
irrecoverable state taxes. This has led to
changes in prices of petrol, diesel, kerosene and
LPG across different states. While prices
increased in some states, it declined in some
other states reflecting the state specific tax
structure. Since March 2012, the extent of crude
oil prices decline in dollar terms has been
substantial enough to reduce the price in Indian
rupee terms despite depreciation of the rupee
(Table VI.2). However, administered prices
have not been revised for more than a year and
therefore, risks to fuel inflation continue to
remain significant (Chart VI.5).
VI.10	 Currently, the estimated under-recovery
by domestic OMCs for diesel is `9.95 per litre,
for PDS kerosene `27.20 per litre and `319.00
per cylinder for domestic LPG. Not adjusting
administered prices in line with trends in
international prices will further expand under-
recoveries, which will lead to considerable fiscal
strain. Though price adjustments will exert
inflationary pressures in the near term, the risk
to medium-term price stability from a widening
fiscal deficit will be addressed by adjustment of
prices in line with market conditions
VI.11	 Coal prices were increased in January
2012, with non-coking coal prices being hiked
by 32.7 per cent. Increase in coal prices could
lead to significant input cost pressures,
particularly for electricity generation. Electricity
price increases in the recent period have been
much less than the increase in input costs.
Therefore, State Electricity Boards (SEBs) need
to catch up by the large hikes in prices at which
they sell electricity to Discoms. Revision in
power tariffs could become inevitable under
such a scenario, which would add pressure to
fuel inflation.
Table VI.2: Comparative Movement of Oil Price and Exchange Rate since July 2011
  July 2011 March 2012 July 26, 2012 Change in per cent
July, 2011 to
March, 2012
Since March,
2012
1 2 3 4 5 6
Crude Oil Indian Basket (US$/barrel) 112.5 123.61 102.3 9.9 -17.2
Exchange Rate (`/US$) 44.4 50.3 56.0 11.7* 10.1*
Crude Oil Indian Basket (`/barrel) 4995.8 6220.1 5724.8 24.5 -8.0
* Indicates the depreciation of the rupee against dollar.
Note: The composition of Indian Basket of Crude Oil represents average of Oman & Dubai for sour grades and Brent (Dated) for
sweet grade in the ratio of 67.6:32.4.
Source: Petroleum Planning and Analysis Cell.
Macroeconomic and Monetary Developments First Quarter Review 2012-13
42
Inflation in non-food manufactured
products muted by decline in growth
VI.12	 Manufactured non-food products
inflation, an indicator of generalised inflationary
pressures, moderated to below 5 per cent by
March 2012 after two years. Since then,
manufactured non-food products inflation
remained subdued (4.8 per cent, provisional,
June 2012), though price pressures are still
visible in some manufactured commodities such
as metals, fertilisers, pesticides and paints. Even
though non-food manufactured products
inflation declined in recent months, it still
remains higher than the decadal average of 4.0
per cent during the 2000s. Also, core inflation
in India in the recent period has been much
higher than in AEs and EDEs.
VI.13	 The month-over-month seasonally
adjusted annualised changes (3-month moving
average) showed moderation of price pressures,
notwithstanding a marginal pick-up in the latest
month (Chart VI.6). Within non-food
manufactured products, the ‘basic metals and
metals products’group, which has a substantial
weight (10.7 per cent) in overall WPI, continued
to have double digit inflation. Domestic metal
prices have largely been following the global
trends and therefore, the inflation in this
category remained high as exchange rate
depreciation partly offset the impact of
moderating global prices (Chart VI.7). Apart
from the pressure from global price trends and
exchange rate movements, domestic constraints
on supplies of key inputs like minerals and coal
could also be a source of pressure on prices.
These trends also indicate that the supply-side
pressures do translate to generalised inflation
through the input cost channel. These partly
explain the lower than expected pace of
moderation in non-food manufactured products
inflation in the wake of significant slowdown
in growth.
VI.14	 Input cost pressures continued to
remain persistent as seen from the HSBC Markit
Purchasing Managers Index (PMI) which
indicates that the pace of expansion of input
costs was much higher than increases in output
prices (Chart VI.8). In an environment of
43
Price Situation
significant decline in profit margins (see Chapter
II for details) this could force manufacturers to
pass on prices even when demand remains
moderate. This is corroborated by the output
price index in PMI picking up significantly in
recent months.
Wage pressures remain significant and
may constrain the moderation in core
inflation
VI.15	 The persistence of inflation can also
partly be attributed to labour market conditions.
The increase in wages in rural areas continued
to be much sharper than compared to the
comparable rate of inflation (Chart VI.9). The
divergent pattern of this relationship between
wage growth and inflation across major states
also points out to region specific factors that
influenced the wage-price dynamics (Chart
VI.10). Similarly, in the formal sector, analysis
of company finance data suggests that growth
in staff costs, despite a moderate decline in the
recent period, remained elevated (Chart VI.11).
Rising real wages during the period of high
inflation do protect the working population from
the adverse impacts of inflation. However, rising
real wages in excess of the productivity growth
may not be sustainable in the medium-term and
run the risk of a wage-price spiral.
New CPIs exhibit higher inflation
VI.16	 Inflation as per the newly introduced
Consumer Price Index (CPI) remained
significantly higher than the WPI inflation
(Table VI.3). There was also substantial
divergence in inflation in certain product groups
such as condiments and spices and vegetables.
Notably, the divergence in the new CPI and the
WPI inflation after excluding the volatile items
(food and fuel) continued to be high. A
comparison of similar items under the WPI and
the new CPI indicate that there is divergence
even among common product group inflation
(Chart VI.12). This divergence between the new
CPI inflation and the headline WPI inflation has
Macroeconomic and Monetary Developments First Quarter Review 2012-13
44
raised concerns about the extent of the
transmission of recent moderation in headline
inflation to the consumers.
VI.17	 The difference in weighting pattern and
coverage could also explain the divergence
between inflation based on the CPI and the WPI.
While food has a relatively larger weight in the
new CPI, the WPI has more weight for
manufactured products with items like metals
and chemicals that do not enter the CPI directly.
The new CPI includes housing and many
services which are not covered under WPI.
Comparable data for a relatively longer period
of time is necessary to make a realistic
assessment of the divergence between the new
CPI and existing inflation measures. The new
comprehensive CPI does not have adequate
history to support data analysis and to be used
as the sole headline measure of inflation.
Risks to inflation remain even as growth
slowdown eases demand pressures
VI.18	 Even though inflation declined during
the latter part of 2011-12, the persistence of
inflation in recent months above the 7 per cent
mark points to the sticky nature of inflation,
even as growth has slowed. Inflation in the
non-food manufactured products category came
down to below 5 per cent, partly reflecting the
demand moderating impact of past monetary
tightening and weakening of pricing power.
However, high food inflation, especially in
protein-rich items, and persistent fuel inflation
kept headline inflation high. The near-term
inflation outlook is conditioned on the spatial
and temporal distribution of the south-west
monsoon, the impact of exchange rate
pass-through and likely trends in global
commodity prices. While moderation in global
commodity prices could ease the pressure from
imported inflation, pass-through of rupee
depreciation will partly offset the impact. The
increases in MSP and sustained increases in
wage levels could further exert pressure on
overall inflation. The administered prices of fuel
do not reflect the trends in global market prices
and revision of these would be necessary to
reduce the extent of suppressed inflation. The
persistence of inflation in an environment of
slowing growth is a major challenge for
monetary policy.
Table VI.3: WPI and New-CPI
(Combined) Inflation
  Food Fuel Excluding
Food and
Fuel
Overall
WPI New
CPI
WPI New
CPI
WPI New
CPI
WPI New
CPI
1 2 3 4 5 6 7 8 9
Weight 24.3 47.6 14.9 9.5 60.8 42.9 100 100
Jan-12 1.5 3.9 17.0 13.0 7.5 10.6 7.2 7.5
Feb-12 5.9 6.7 15.1 12.8 6.3 10.4 7.6 8.8
Mar-12 8.7 8.1 12.8 11.8 5.8 10.2 7.7 9.4
Apr-12 9.3 10.1 12.1 11.2 5.4 10.2 7.5 10.3
May-12 9.0 10.5 11.5 10.7 5.7 10.1 7.5 10.4
June-12 9.0 10.8 10.3 10.3 5.6 9.1 7.3 10.0
Macroeconomic Outlook
45
VII. MACROECONOMIC OUTLOOK
The outlook for the Indian economy remains weak. In an uncertain global economic environment,
the interplay between growth slowdown, high inflation, wide current account, fiscal gaps and
falling investment has weakened the economy. Surveys of business expectations confirm that
confidence levels are low. On the other hand, inflation expectations remain sticky. The economy
has reached a critical point, at which economic activity can spin up or down depending on how
the policy uncertainty is addressed and supporting measures put in place. Leading indicators,
especially credit growth and PMIs, suggest that a recovery is still possible with appropriate
policy action.
Growth prospects for 2012-13 stay weak
VII.1	 The Indian economy slowed significantly
during 2011-12, with growth decelerating to 6.5
per cent. The growth prospects for 2012-13
remain weak due to a combination of global and
domestic macro-economic factors. Global
growth is turning weaker than anticipated.
Along with the sovereign debt overhang and
financial market uncertainties, it is impacting
global trade.
VII.2	 The IMF in its July update of the World
Economic Outlook has made significant
downward revisions in its current year growth
estimates for India, UK, Brazil and China. As
fiscal adjustments take shape in advanced
economies (AEs), shrinking deficits could keep
AEs growth slow for an extended period. This
could result in a significant drag on growth in
India.
VII.3	Recent indications suggest that global
trade flows have ebbed again after some pick-up
in Q4 of 2011-12. This trend could persist
because of tight credit conditions, the adverse
impact of deleveraging on trade finance and,
moreimportantly,growthslowdowninemerging
and developing economies (EDEs), including
China. If global trade loses steam, it can have
ramifications for recovery in India.
VII.4	Growth in India has decelerated faster
than envisaged. Some slowdown was inevitable
as growth sacrifice was needed to combat the
high inflation of the past two years. However,
the lack of a quick policy response to address
structuralbottlenecksandencourageinvestment,
has exacerbated the slowdown. In view of the
growth moderation, the Reserve Bank in its
Monetary Policy Statement 2012-13 on April
17, 2012 frontloaded the policy rate reduction
with a repo rate cut of 50 basis points on the
premise that the process of fiscal consolidation
critical for inflation management, would get
under way along with other supply-side
initiatives. However, the absence of movement
on fiscal correction, along with other persistent
risks to inflation during 2012-13, limit the space
for monetary easing and the Reserve Bank
decided to hold the policy rate in its Mid Quarter
Policy Review on June 18, 2012.
VII.5	On the domestic front, the macro-
economic and structural factors that are
impeding growth still remain to be addressed.
At the current juncture, some uncertainty is
arising from the temporal and spatial deficiency
in the monsoon. Despite the recent revival,
cumulative rainfall up to July 27, 2012 was 21
per cent deficient. The Reserve Bank’s
production weighted rainfall index (PRN)
showed a 39 per cent drop from the normal
during June 2012. However, there has been
some improvement since then and the PRN
deficiency is now 24 per cent. The impact of the
monsoon will emerge more clearly in the
coming weeks.
Macroeconomic and Monetary Developments First Quarter Review 2012-13
46
VII.6	Monsoon risks to overall growth could
turn out to be limited due to the declining share
of rainfed agriculture with improved irrigation,
as also the small share of total agriculture output
in GDP. However, from a welfare standpoint,
the impact may be significant because it affects
the poor through inflation as well as income.
This also has fiscal implications through drought
relief, MGNREGA and other government
welfare schemes.
VII.7	The slowdown in industrial activity
continues. Mining activity remains at a near
standstill in the face of a lack of adequate
regulatory environment to support good
business. Manufacturing activity also remains
sluggish in the face of a rise in input costs and
slack domestic demand. High inflation has
impacted consumption, at a time when
investment activity is already weak, making the
immediate revival of growth difficult. Subdued
global demand amid weakening consumer
confidence has weighed down on services
growth, which may continue to experience some
spillover from the slow industrial growth. While
construction growth remains subdued, the
‘trade, hotels, transport and communications’
segment has also slowed down.
VII.8	 Taking into account the increased risks,
the growth outlook in 2012-13 may turn out to
be lower than anticipated. However, a recovery,
even if modest, still appears possible if
appropriate policy correctives are quickly put
in place. Credit expansion in Q1 of 2012-13 has
picked-up and PMIs for manufacturing and
services remain in expansion mode. This
suggests that while growth has decelerated, a
sharp dip can still be averted.
Inflation risks remain significant
VII.9	 Headline inflation has moderated from
near double-digit levels and remained in the
range of 7-8 per cent for the past seven months.
The extent of moderation, in spite of the
negative output gap, has been constrained by a
number of off-setting factors such as rupee
depreciation and sustained pressures from input
costs and wages. Typically, episodes of high
inflation have been marked by inflation
persisting for 2-3 years and have required
sustained efforts to lower inflation expectations
and inflation.
VII.10	 The near-term outlook on inflation
continues to be marked by a number of upside
risks, despite the significant slowdown in
growth. Both persistent headline WPI inflation
and retail inflation, even as the core inflation
remains moderate, indicate continued supply-
side pressures on overall inflation. These are
unlikely to be mitigated in the near term. The
progress of the monsoon so far has been
unsatisfactory. Some price pressures could
emerge in coarse cereals, pulses and edible oils.
The short-term trajectory of food inflation could
shift upwards impacted by the adverse monsoon,
large increases in the Minimum Support Prices
(MSP) and structural pressures on protein
inflation that can further be reinforced if feed
costs increase due to poor rainfall. The impact
of the rupee depreciation against the US dollar
will limit the favourable impact from a fall in
globalcrudeoilandmetalprices.Thesuppressed
inflation of the past is likely to show up in
electricity, coal and fuels during 2012-13. On
the whole, in spite of core inflation pressures
moderating and some deceleration in wage
inflation, upside risks to inflation projections
for 2012-13 remain significant.
Business expectations indices suggest
subdued business confidence
VII.11	 Various surveys portray weakening
optimism about business prospects. The
NCAER Business Confidence Index, which
registered an improvement in business
environment duringApril 2012, slid back during
July 2012. Private sector firms appear
apprehensive about the investment climate and
their financial positions, even though capacity
utilisation levels remain relatively high.
Macroeconomic Outlook
47
VII.12	 The latest Dun & Bradstreet Business
Optimism Index for July–September 2012,
conducted in June 2012 amid renewed domestic
and global economic pressures, indicates
increased pessimism, with a q-o-q decline in
volume of sales, net profits, new orders,
inventory and employee levels. Weak demand
conditions are observed across sectors,
especially in the intermediate and capital goods
sectors. The demand for finished goods also
shows a significant moderation, pointing to a
further slowdown in capital expenditure by
firms.
VII.13	 The CII business confidence index,
however, registered moderate recovery, with
almost three-fourth of the respondents expecting
a 7 or higher per cent growth in 2012-13, with
the primary concern being stagnancy in reforms.
The survey indicates optimism about overall
sales, new orders and pre-tax profits in Q1 of
2012-13, as results indicate a corresponding rise
in the last quarter as well.
VII.14	 Across surveys, higher input costs
seem to be the major deterrent to business
confidence (Table VII.1). The seasonally
adjusted HSBC Markit Purchasing Managers’
Indices (PMI) for both manufacturing and
services (June 2012) suggest improved business
conditions and rising output. Despite the
increasing input costs, higher employment
levels and rising output prices point to some
optimism about growth revival. Business
expectations remain positive.
Industrial Outlook Survey points to
moderation in both demand and financial
conditions
VII.15	 The Reserve Bank’s 58th round of the
Industrial Outlook Survey (http://www.rbi.org.
in/IOS58), conducted during Q1 of 2012-13
with a sample of 1,404 manufacturing
companies, showed a deterioration in business
sentiments both in the assessment quarter Q1
and the expectations quarter Q2 of 2012-13.
VII.16	 The Business Expectation Index (BEI),
a composite indicator based on several business
parameters, shows moderation for assessment
(Q1 of 2012-13) as well as expectation (Q2 of
2012-13) quarters (Chart VII.1). The fall in
assessment index has been much sharper than
the expectation index, indicating that the
perceived plateauing was not realised. However,
these indices remained in the positive growth
zone (i.e., above 100, which is the threshold
separating contraction from expansion).
Table VII.1: Business Expectations Surveys
Period Index NCAER-
Business Confidence
Index July 2012
FICCI Overall
Business Confidence
Index Q2:2011-12
Dun & Bradstreet
Business Optimism
Index Q3: 2012
CII Business
Confidence Index
Q1: 2012-13
1 2 3 4 5
Current level of the Index 126.6 51.5 136.1 55.0
Index as per previous survey 134.9 51.6 150.0 52.9
Index levels one year back 145.2 76.2 143.6 62.5
% change (q-on-q) sequential -6.2 -0.2 -9.2 4.0
% change (y-on-y) -12.8 -32.3 -5.2 -12.0
Macroeconomic and Monetary Developments First Quarter Review 2012-13
48
VII.17	 Net response of major demand side
parameters, viz., production, order books,
capacity utilisation, exports and imports for
Q1of 2012-13, remained positive, albeit, lower
when compared on a y-o-y as well as a q-o-q
basis.Theoutlookresponseshowssimilarresults.
VII.18	 The results also point to lower optimism
in the overall financial situation through H1 of
2012-13. The net response for availability of
finance was positive, although marginally lower
than the previous quarter. ‘Cost of external
finance’ is perceived to rise further, but by a
lower percentage of respondents. The majority
still expect the cost of raw material to rise
further in Q2 of 2012-13. While a higher
percentage of respondents (on a net basis)
assessed that the profit margin declined over the
last quarter, the outlook for Q2 of 2012-13
remains more or less balanced (Table VII.2).
Consumer Confidence Survey indicates
static future expectations
VII.19	 The Reserve Bank’s 9th round of the
Consumer Confidence Survey (http://www.rbi.
Table VII.2: Reserve Bank’s Industrial Outlook Survey
Parameter Optimistic
Response
Net Response*
2011 2012
Jul-Sep Oct-Dec Jan-Mar Apr-Jun Jul-Sep
E A E A E A E A E
1 2 3 4 5 6 7 8 9 10 11
1. Overall Business Situation Better 39.8 18.7 35.2 17.7 33.6 26.5 34.9 18.3 30.6
2. Overall Financial Situation Better 30.6 11.7 26.3 11.2 25.2 18.5 27.7 14.2 23.6
3. Availability of Finance Improve 24.2 12.1 20.2 10.4 19.0 15.8 22.9 15.0 20.4
4. Cost of External Finance Decrease -39.7 -50.2 -41.0 -50.6 -38.8 -37.4 -22.7 -30.5 -24.0
5. Production Increase 40.6 22.6 39.9 25.3 40.4 33.1 34.7 20.3 33.6
6. Order Books Increase 35.9 20.3 33.4 18.4 31.3 24.8 29.5 16.9 29.9
7. Capacity Utilisation Increase 25.0 9.9 22.2 10.8 24.3 16.7 19.9 8.6 18.4
8. Cost of Raw Material Decrease -51.7 -58.1 -49.7 -61.2 -50.1 -59.4 -49.0 -63.1 -51.4
9. Employment in the Company Increase 19.4 15.6 16.5 11.3 13.6 12.9 14.6 10.0 12.3
10. Exports Increase 25.8 13.1 22.1 11.5 18.6 14.2 20.7 10.8 20.5
11. Imports Increase 19.0 15.7 16.9 11.6 15.5 14.4 15.7 11.6 15.5
12. Selling Price Increase 18.3 10.7 16.0 8.9 14.7 13.5 19.0 17.5 18.8
13. Profit Margin Increase 2.5 -17.1 -1.6 -17.3 -2.9 -11.3 -1.2 -17.9 -3.6
*	Net response is measured as the percentage share differential between the companies reporting optimistic (positive) and
pessimistic (negative) responses; responses indicating status quo (no change) are not reckoned. Higher ‘net response’ indicates
higher level of optimism and vice versa.
E:	Expectation. A: Assessment.
org.in/CCS9), conducted in June 2012,
indicates that although the majority of
respondents perceive current household
circumstances to have improved, there has been
a rise in the proportion of respondents reporting
otherwise. This led to a fall in consumer
confidence for the current period. However, the
future expectations of households remained
almost constant at the level observed in the last
round (Chart VII.2).
Macroeconomic Outlook
49
External agencies see moderation in
growth ahead
VII.20	 The revised GDP growth estimate for
2011-12 at 6.5 per cent came in sharply lower
than the conservative estimates by external
agencies (7.0-7.6 per cent). Stuttering global
growth coupled with domestic concerns on
multiplefronts,viz.,weakIIPgrowthmomentum,
persistent inflation, and high fiscal and current
account deficits, without much being done on
the reform front, have led to further downward
revisions in the growth outlook for 2012-13 by
0.2-0.8 percentage points. At this juncture,
however, the consensus forecasts on growth
seem to be placed lower than the 7.3 per cent
projected by the Reserve Bank in its Monetary
Policy Statement 2012-13 (Table VII.3).
Table VII.3: Agencies’ Projections for 2012-13
Agency Latest Projection Earlier Projection
GDP
Growth
(Per cent)
Month GDP
Growth
(Per cent)
Month
1 2 3 4 5
Economic Advisory
Council to the PM 7.6 Feb-12 - -
Finance Ministry 7.6 (+/0.25) Feb-12 - -
IMF* (calendar year) 6.1 July-12 6.9 Apr-12
World Bank 6.9 Jun-12 7.5 Mar-12
OECD* 7.3 May-12 7.5 Nov-11
ADB 6.5 Jul-12 7.0 Apr-12
NCAER 7.3 Apr-12 - -
* GDP at market rates.
Survey of professional forecasters1
VII.21	 The results of the 20th round of the
‘Survey of Professional Forecasters’ (http://
www.rbi.org.in/SPF20) conducted by the
1
The forecasts reflect the views of professional forecasters and not of the Reserve Bank.
Table VII.4: Median Forecasts of Select Macroeconomic Indicators by
Professional Forecasters 2012-13 and 2013-14
Actual
2011-12
Annual Forecast Quarterly Forecast
2012-13 2013-14 2012-13 2013-14
Q1 Q2 Q3 Q4 Q1
E L E L E L E L E L E L E L
1 2 3 4 5 6 7 8 9 10 11 12 13 14 15 16
1.	Real GDP growth rate at
factor cost (in per cent)
6.5# 7.2 6.5 - 7.0 6.6 5.5 7.1 6.3 7.4 6.6 7.5 7.0 - 7.1
a.	 Agriculture & Allied
Activities
2.8# 3.0 3.0 - 3.0 3.0 2.7 3.2 3.0 3.1 2.7 3.0 2.9 - 2.8
b.	Industry 2.6# 6.0 4.0 - 5.7 4.6 1.5 5.5 3.7 6.3 5.0 6.2 5.5 - 6.0
c.	Services 8.5# 8.8 8.0 - 8.6 8.4 7.5 8.5 7.8 8.8 8.1 8.6 8.4 - 8.4
2.	Gross Domestic Saving
(per cent of GDP at current
market price)
- 32.8 31.3 - 32.2 - - - - - - - - - -
3.	Average WPI-Inflation 8.9 6.9 7.3 - 6.8 6.6 7.4&
6.9 7.6 6.7 7.4 6.7 7.2 - 6.5
4.	Exchange Rate
(INR/1USD end period)
51.2 48.3 53.0 - 51.0 49.5 56.3&
48.8 55.0 48.0 54.5 47.8 53.0 - 52.5
5.	T-Bill 91 days Yield
(per cent-end period)
8.7 7.9 8.0 - 7.5 - - - - - - - - - -
6.	10-year Govt. Securities
Yield (per cent-end period)
8.6 8.2 8.1 - 7.8 - - - - - - - - - -
7.	Export
(growth rate in per cent)@
23.7* 13.2 12.0 - 17.0 - - - - - - - - - -
8.	Import
(growth rate in per cent)@
31.1* 15.0 8.3 - 14.3 - - - - - - - - - -
9.	Trade Balance (US$ billion) -189.8* - - - - -50.2 -46.0 -47.7 -45.5 -44.8 -46.2 -48.0 -47.3 - -45.6
E: Previous Round Projection.	 L: Latest Round Projection.	 #: Revised Estimate.	 *: Preliminary.
- : Not Available.	 &: Actual. 	 @: US$ on BoP basis.
Note :	 The latest round refers to Twentieth round for the quarter ended June 2012, while previous round refers to Nineteenth round for the
quarter ended March 2012.
Source :	 Survey of Professional Forecasters, First Quarter 2012-13.
Macroeconomic and Monetary Developments First Quarter Review 2012-13
50
Reserve Bank shows a downward revision in
the median growth forecast for 2012-13 to 6.5
per cent. The industry and service sector median
growth forecasts have turned low, but are
expected to pick-up beginning Q2 of 2012-13.
The average inflation outlook has been revised
upward to 7.3 per cent for 2012-13 and
moderation is expected from Q3 of 2012-13
onwards (Table VII.4).
Inflation expectations stay sticky
VII.22	 The Inflation Expectations Survey of
Households (IESH) (http://www.rbi.org.in/
IESH28), conducted among 4,000 households
across 12 cities and 7 occupational categories
in June 2012, indicates that the median inflation
perception for the current quarter (i.e., April-
June 2012) as well as the median inflation
expectations going forward remained at the
same level. However, the mean perception and
expectation of inflation moved up marginally
compared with the previous round. The
percentage of respondents expecting higher
inflation in next quarter/year has also increased
compared with the last round.
Inflation and macro risks to condition
growth-enabling policy actions
VII.23	 Domestic growth declined to its lowest
in 29 quarters during Q4 of 2011-12. Early
indications for Q1 of 2012-13 suggest that
growth is likely to remain subdued. While
growth risks are significant, policy choices have
been complicated as inflation remains above the
comfort level. Further, inflation risks have
increased and continue to constitute significant
risk to growth sustainability, thus making it
imperative to not allow monetary conditions to
aggravate these risks. Also, the wide CAD and
high fiscal deficit continue to limit the monetary
space and pose major challenges for
macroeconomic policy. Though adjustments in
the exchange rate could contribute to bridging
the current account deficit, excessive volatility,
particularly the risks of a downward spiral in
the rupee, needs monitoring. Going forward,
improved liquidity and monetary conditions
suggest the possibility of a slow recovery in
industrial growth.
VII.24	 Additional rounds of accommodative
monetary policy across the globe, if sustained
through 2012-13, can reverse the trend of falling
commodity prices at some stage. Global food
inflation is also likely in the face of widespread
drought in US and elsewhere. Besides, monsoon
shortfall also weigh heavily on the inflation
outlook in India. Rising input costs have fed
into output prices, though further pass-through
may be limited. On the other hand, corporates
are likely to raise prices to protect themselves
against margin pressures in sectors where
competitive structures are not in place and
mark-ups can be protected.
VII.25	 The economy is now at a critical
juncture where revival can be supported by
restoring confidence through policy actions to
encourage investment. Removing constraints
on FDI and improving the investment climate
by moving quickly to address bottlenecks in
infrastructure space are important. Also,
speeding up fiscal consolidation by putting in
place an investment stimulus through large
capital spending by the government but
offsetting it by curtailing revenue spending by
revamping the subsidy schemes could go a long
way in reviving growth. Reviving infrastructure
investment while addressing increased risks to
lending to this sector is critical in this context.
VII.26	 In short, decisive policy action backed
by credible commitment to a long-term strategy
for correcting macroeconomic imbalances and
stimulating investment is crucial at this stage to
revive confidence as well as provide space for
monetary policy to help sustain growth while
keeping inflation under control.

MICRO ECONOMIC AND MONETARY DEVELOPMENT

  • 3.
    Macroeconomic and Monetary Developments FirstQuarter Review 2012-13 Reserve Bank of India Mumbai
  • 5.
    Contents Overview i- iii I. Output 1 - 9 II. Aggregate Demand 10 - 16 III. The External Sector 17 - 22 IV. Monetary and Liquidity Conditions 23 - 29 V. Financial Markets 30 - 36 VI. Price Situation 37 - 44 VII. Macroeconomic Outlook 45 - 50
  • 7.
    Overview i 1. Monetary andliquidity conditions have eased during 2012-13 as cuts in cash reserve ratio (CRR) and policy rates worked through the system. The Reserve Bank cut CRR by 125 basis points (bps) and front-loaded the policy rate reduction by cutting the repo rate by 50 bps in April 2012. It, however, paused at its Mid- Quarter Review in June 2012 factoring in inflation persistence and macro-economic risks that emanated from lack of momentum in fiscal consolidation. Significantly, while there is slack in the economy, inflation remains persistent. Going forward, monetary policy space needs to be created through fiscal adjustment and structuralmeasurestoimprovesupplyconditions and boost the investment climate, so that the revival is supported in a non-inflationary manner. 2. Growth in Q1 of 2012-13 is likely to have stayed low after having dropped to a 29-quarter low in the sequentially preceding quarter. While the slowdown has been primarily driven by investment, more recently and to a lesser extent, consumption has also slowed. Global growth prospects have worsened during Q1 of 2012-13, thus putting domestic recovery at greater risk. Inflation, after falling in Q4 of 2011-12 has turned sticky. Price pressures remain with significant suppressed inflation in domestic energy prices and rupee depreciation, which have partly off-set the gains from lower global commodity prices. Global Economic Conditions Global growth prospects worsen with growth also slowing in EDEs 3. Debt overhang and persistent euro area problems coupled with still incomplete adjustment of the US economy from the 2008 financial crisis are keeping growth in Advanced Economies (AEs) low. Deceleration in growth in BRICS economies, which have so far been the drivers of growth in Emerging and Developing Economies (EDEs), has worsened global growth prospects further. Financial market stress accentuates 4. Global financial market stress eased significantly during Q1 of 2012 after ECB made a large liquidity injection, but was accentuated again by the deepening crisis in the euro area, especially in Greece and Spain. The recent Libor fixing case has also added to the uncertainty by drawing attention to how a few large global financial institutions allegedly manipulated one of the most commonly used market rates. Meanwhile, falling commodity prices and subdued inflation in large economies provided additional space for monetary easing. This fresh round of monetary easing has, however, increased the risks of inflation in EDEs even while inflation is likely to remain subdued in most AEs. Indian Economy: Developments and Outlook Output Growth risks accentuate, negative output gap likely to persist during 2012-13 5. Economic activity slowed down considerably during Q4 of 2011-12 and has likely stayed weak during Q1 of 2012-13. Growth in 2012-13 is likely to remain below potential. Newer risks to growth have arisen from slowing global trade, domestic supply MACROECONOMIC AND MONETARY DEVELOPMENTS FIRST QUARTER REVIEW 2012-13 Overview
  • 8.
    Macroeconomic and MonetaryDevelopments First Quarter Review 2012-13 ii bottlenecks of industrial inputs, coal and electricity and less-than-satisfactory monsoon so far. Services growth is also showing signs of slowing in line with slowing industrial growth and weak global economy. Aggregate Demand Needforcurtailingsubsidiesandpropelling a government investment stimulus to address investment slack 6. Aggregate demand weakened further during Q4 of 2011-12. The investment slowdown seen since H2 of 2010-11 has extended to Q4 of 2011-12.Apart from the sharp fall in investment, private consumption moderated during Q4 of 2011-12. Fiscal and monetary space to stimulate the economy remain limited in the presence of an already large fiscal deficit and persistent inflation. The fiscal deficit target for 2012-13 is at a risk of being breached due to likely overshooting of subsidies and shortfall in receipts. To address this risk, fiscal space needs to be created by curtailing subsidies and significantly boosting government capital expenditures to provide an investment stimulus to the economy, which would help crowd-in private investment. External Sector CADrisksandconcernsaboutsustainability persist 7. Softening of global crude oil prices and moderation of gold imports may bring some relief to the balance of payments, but Current Account Deficit (CAD) risks remain significant for 2012-13. Slowing global growth and trade are likely to keep expansion in exports of goods and services low. Services exports net of services imports have declined notably in Q1 of 2012-13. With lower growth, the sustainable level of CAD has also come down to around 2.5 per cent of GDP. Financing a large CAD may pose difficulties in face of slowing foreign investment flows. External debt is likely to rise as increased debt flows bridge financing gap. As a result, external vulnerability indicators may deteriorate and would make economy susceptible to external shocks unless trade balance is compressed and FDI flows improve. Monetary and Liquidity Conditions Monetary and liquidity conditions ease during 2012-13 8. A 50 basis points (bps) rate cut, following a 125 bps CRR reduction, coupled with active open market operation purchases have significantly eased monetary and liquidity conditions during 2012-13 so far. While these measures are supportive of growth, the rate of deposit expansion has slowed which could adversely affect liquidity. Credit growth has picked up in the current financial year and is in line with the indicative projections. The flow of resources from non-bank sources has also been good. In spite of a relative improvement in monetary and liquidity conditions during Q1 of 2012-13, the Reserve Bank would need to closely monitor the liquidity and monetary conditions ahead so that they remain consistent with the evolving growth-inflation mix. Financial Markets Currency and equity markets remained under pressure 9. Spillovers from global financial market uncertainties and waning investor confidence amidstdeterioratingmacroeconomicconditions, kept domestic currency and equity markets under pressure. The rupee depreciated by nearly 10 per cent during Q1 of 2012-13, before staging some recovery in July 2012. Equity markets remained range bound, with sharp gains in May 2012 being nullified during June 2012. Money market rates and G-sec yields eased reflecting improved liquidity and falling global commodity prices. However, going forward, financial stress is likely to remain with falling earnings and high leverage for non- financial firms.
  • 9.
    Overview iii Price Situation Inflation pressurespersist despite weakening growth momentum 10. Headline WPI inflation persisted above 7 per cent, while consumer price inflation, as per the new CPI, remains in double-digits. Inflationary pressures have persisted, with significant contribution from food and energy segments. Going forward, the decline in global commodity prices will provide some relief, but the gains have been partly offset by rupee depreciation. While core inflationary pressures are currently muted, a continued rise in real wages could spill over to core inflation. Persistence of inflation, even as growth is slowing, has emerged as a major challenge for monetary policy. Macroeconomic Outlook Outlook remains weak, need to support recovery in a non-inflationary manner 11. Growth risks in 2012-13 have been amplified by decelerating global trade and domestic supply constraints. At the same time, inflation risks remain significant due to suppressed inflation, poor supply responses and deficit monsoon conditions. Various surveys suggest that business and consumer confidence remain low. Revival of investor confidence would, therefore, need to be supported by addressing concerns over policy stasis, while putting in place complimentary actions that address macro-economic weaknesses.
  • 11.
    Output 1 I. OUTPUT The Indianeconomy grew at a slower pace than its potential in 2011-12. Growth slowed down in all three sectors of the economy through the course of the year. Moderation in industrial growth persisted in the midst of domestic supply constraints, a clouded domestic policy environment and a deteriorating external outlook. The services sector also under-performed given its inter-linkages with the industrial sector. The available information suggests that slowdown has extended into Q1 of 2012-13, and output expansion in 2012-13 is likely to stay below the potential. Persistent euro area problems and weakening growth in EDEs may drag global growth in 2012 I.1 Global growth, which was better than expected during Q1 of 2012, weakened sharply during Q2 mainly due to increased uncertainties in the euro area and dampened demand conditions in emerging and developing economies (EDEs). Global growth projection for the year 2012 by the IMF (World Economic Outlook Update, July 2012) is 3.5 per cent. The growth projection for the EDEs has been revised downward (by 0.1 per cent from the earlier projection in WEO,April 2012) to 5.6 per cent. I.2 The deceleration in growth in the BRICS nations, which have so far been drivers of EDEs’ growth, has added a new dimension to the global slowdown, making near-term recovery difficult. Growth in China, India, Brazil and SouthAfrica has decelerated since 2011, while that in Russia has been low since 2008. I.3 The euro area crisis has strongly affected the global economic outlook through effects on confidence as well as trade and capital flows. While economic activity in the euro area diminished or stagnated in Q4 of 2011 and Q1 of 2012, the US economy grew at a modest pace (Chart I.1). As per advance estimates, US growth decelerated to 1.5 per cent in Q2 of 2012. Even though the Japanese economy expanded at an annualised rate of 4.7 per cent in Q1 of 2012, it may slow down ahead as the impact of reconstruction spending wears off. I.4 The Institute for Supply Management (ISM) report on US manufacturing suggests a contraction in economic activity in the manufacturing sector in June 2012 (PMI of 49.7), the first time since July 2009. The uncertainty over the path of fiscal policy, which is set to tighten abruptly at the beginning of 2013 or what is termed the ‘fiscal cliff’, could further weaken the US growth later this year. Even though Germany recorded 0.5 per cent q-o-q growth in Q1 of 2012 (as against a contraction in Q4 of 2011), business sentiment fell for the second consecutive month in June to a two-year low. The UK economy witnessed its third consecutive quarterly contraction as the preliminary estimates indicate 0.7 per cent q-o-q decline in GDP in Q2 of 2012. I.5 IntheUS,theuptickintheunemployment rate to 8.2 per cent since May 2012 has compounded the sense that the economy is
  • 12.
    Macroeconomic and MonetaryDevelopments First Quarter Review 2012-13 2 going through a sluggish patch. The unemployment rate across the euro area rose to a new high of 11.1 per cent in May 2012, the highest level since records began in January 1995 (Chart I.2). The unemployment rate for people below the age of 25 was even higher at 22.6 per cent. According to the OECD, the unemployment rate in the advanced economies (AEs) will stay high till the end of 2013. I.6 The weak economic activity in the AEs is impacting the EDEs. The reduced demand for exports and weak capital flows combined with their own domestic policy shortcomings has resulted in subdued economic performance in the EDEs, especially in the case of India and Brazil. China’s growth in Q2 of 2012 fell to a three-year low of 7.6 per cent. Dampening trade volume growth is affecting EDEs exports I.7 The slowing growth of theAEs and EDEs hasresultedinsignificantcoolingofinternational trade in Q2 of 2012 after a modest rebound in Q1 of 2012. World trade growth decelerated from its peak of 20 per cent (CPB World Trade Monitor Index) in May 2010 to as low as 2.3 per cent inApril 2012 (Chart I.3). The downturn in Europe and resultant fall in import demand has adversely affected the EDEs as the EU constitutes their single largest market. There was a sharp deceleration in both China’s exports and imports during H1 of 2012 to 9.2 per cent and 6.6 per cent, respectively (23.9 per cent and 27.9 per cent in H1 of 2011). Continued deceleration of imports into China does not augur well for other EDEs. Growth slowdown persists during Q4 of 2011-12 in India I.8 The sequential slowdown in growth witnessed in the first three quarters of 2011-12 persisted with the fourth quarter registering growth of 5.3 per cent (Table I.1). This was the lowest y-o-y growth in any quarter of the previous seven years, including the crisis year of 2008-09. The sharp slowdown in growth in Q4 of 2011-12 is largely attributable to the contraction in value added in the manufacturing sub-sector and deceleration in most services sub-sectors.The downturn reflects the continued high inflation as well as the impact of other adverse global and domestic macro-economic factors. For 2011-12 as a whole, growth decelerated sharply to 6.5 per cent from 8.4 per cent in the previous two years. I.9 The potential growth rate, which is the maximum rate of growth that the economy can sustain without creating macroeconomic imbalances, moderated during 2009-10 to 2011- 12 from around 8.0 per cent to around 7.5 per cent (Chart I.4). The output gap was positive during 2009-10 and 2010-11. With the growth rate declining by nearly 2 percentage points in 2011-12, reflecting the impact of both cyclical
  • 13.
    Output 3 as well asstructural factors, the output gap turned negative during 2011-12. Growth momentum remains weak as is evident from low q-o-q SAAR numbers (Chart I.5). Deficient monsoon likely to impact kharif crops I.10 Foodgrain production in 2011-12 rose by 5.2 per cent from the previous year to an all-time high of 257.4 million tonnes. As per the fourth advance estimates of foodgrain production, there was record output of rice, wheat, cotton and sugarcane. In 2012-13, even though the Table 1.1: Sectoral Growth Rates of GDP (2004-05 prices) (Per cent) Item 2010-11* 2011-12# 2010-11 2011-12 Q1 Q2 Q3 Q4 Q1 Q2 Q3 Q4 1 2 3 4 5 6 7 8 9 10 11 1. Agriculture & allied activities 7.0 2.8 3.1 4.9 11.0 7.5 3.7 3.1 2.8 1.7 2. Industry 6.8 2.6 8.2 5.6 7.2 6.3 6.5 2.7 0.9 0.7 2.1 Mining & quarrying 5.0 -0.9 6.9 7.3 6.1 0.6 -0.2 -5.4 -2.8 4.3 2.2 Manufacturing 7.6 2.5 9.1 6.1 7.8 7.3 7.3 2.9 0.6 -0.3 2.3 Electricity, gas & water supply 3.0 7.9 2.9 0.3 3.8 5.1 7.9 9.8 9.0 4.9 3. Services 9.2 8.5 9.8 8.7 7.8 10.4 9.3 8.5 8.7 7.5 3.1 Trade, hotels, transport, storage & communication etc. 11.1 9.9 12.6 10.6 9.7 11.6 13.8 9.5 10.0 7.0 3.2 Financing, insurance, real estate & business services 10.4 9.6 10.0 10.4 11.2 10.0 9.4 9.9 9.1 10.0 3.3 Community, social & personal services 4.5 5.8 4.4 4.5 -0.8 9.5 3.2 6.1 6.4 7.1 3.4 Construction 8.0 5.3 8.4 6.0 8.7 8.9 3.5 6.3 6.6 4.8 4. GDP at factor cost (Total 1 to 3) 8.4 6.5 8.5 7.6 8.2 9.2 8.0 6.7 6.1 5.3 *: Quick Estimates. #: Revised Estimates. Source: Central Statistics Office.
  • 14.
    Macroeconomic and MonetaryDevelopments First Quarter Review 2012-13 4 south-west monsoon arrived on time along the coast of Kerala during the first week of June 2012, its progress to the rest of the country has been slow and uneven. In view of this, the India Meteorological Department (IMD) revised its forecast of rainfall for the period (June- September 2012) from 99 per cent of the long period average (LPA) in May 2012 to 96 per cent of LPA in June 2012 and further down to 92 per cent of LPA in July 2012. The latest information (till July 26, 2012) shows that the south-west monsoon has now covered the entire country but the cumulative rainfall is still 21 per cent below the LPA as against 3 per cent below LPA during the corresponding period in the previous year. I.11 Spatially, rainfall across the four main regions of the country is in deficit with the highest deficiency observed in north-west India (38 per cent below LPA). Overall, rainfall has been deficient/scanty across 63 per cent of the total geographical area of the country covering 22 of the 36 sub-divisions and normal/excess across the rest. In contrast, during the corresponding period last year, rainfall was excess/normal across 85 per cent of the geographical area covering 30 sub-divisions. The deficiency in monsoon as gauged from the Reserve Bank’s production-weighted rainfall index (PRN) is higher with the PRN on July 27, 2012 being 76 compared with a reading of 79 for the IMD index (Chart I.6). I.12 The unsatisfactory performance of the south-west monsoon so far in terms of quantum and spatial/temporal distribution resulted in the slow progress in sowing of kharif crops during June 2012. However, there has been significant improvement in sowing during July 2012 for most crops. Notwithstanding this improvement, area sown under pulses and coarse cereals declined sharply (Table I.2). The crop situation is likely to worsen further if El Nino conditions emerge during the later part of the season. Deficit rainfall has also affected the level of water in the 84 reservoirs under the Central Water Commission (CWC). The storage was 24 per cent of capacity on July 26, 2012 as against 43 per cent during the corresponding period last year. Table I.2: Kharif Sowing: 2012-13  (Million hectares) Crop   Normal area as on date Area sown Percentage variations July 27, 2012 July 29, 2011 over 2011 over normal as on date 1 2 3 4 5 6 Rice 20.0 19.1 21.0 -9.0 -4.5 Coarse Cereals 16.1 11.7 15.2 -23.0 -27.3 Pulses 8.0 6.3 7.4 -14.9 -21.3 Oilseeds 13.4 13.8 15.0 -8.0 3.0 Sugarcane 4.7 5.3 5.2 1.9 12.8 Cotton 9.4 9.7 10.6 -8.5 3.2 Jute and mesta 0.8 0.8 0.9 -10.1 0.0 All Crops 72.4 66.7 75.2 -11.3 -7.9 Source: Ministry of Agriculture, GoI.
  • 15.
    Output 5 Contingency measures arerequired should monsoon fail I.13 Indian agriculture’s dependence on the monsoon has come down over the years and in recent episodes of deficient monsoons the output impact has been limited. The current level of stock of foodgrains is comfortable should foodgrains output be adversely impacted. At around 80.6 million tonnes in June 2012 (82 million tonnes in May 2012), stocks continue to remain one of the highest ever (Chart I.7). In fact, record stocks necessitate augmentation of storage capacity to avoid wastage of foodgrains. A short-term strategy to protect open stocks is being put in place. The government has also prepared contingency plans in the event of monsoon failure. This entails ensuring sufficient availability of all seeds, fodder, power and diesel, additional wage allocation under MGNREGA and sufficient funds under the National Disaster Relief Fund. An Inter- Ministerial Group has been constituted to review the situation on a weekly basis. On current assessment, rainfall during this year’s monsoon season has been slightly better than that during the drought year of 2009. I.14 Frequent price shocks with respect to high-value food items such as meat, fish, eggs, milk, and fruit and vegetables in the recent period reflect the persistence of supply-demand imbalances. To secure food and nutritional security, apart from increased production of these food items, an increased efficiency in post-harvest handling is essential. The development of vegetable clusters, terminal market complexes, cold chains, and warehouses under the public-private partnership model and operationalising warehouse receipts system are significant steps that hold immense potential for better post-harvest management and price discovery. I.15 To improve efficiency and develop a nation-wide agricultural market, 18 states/union territories have amended their Agriculture Produce Market Committee (APMC) Acts so far. Further reforms such as a single-point market fee system that facilitates the free movement of produce, reduction in price differences between the producer and the consumer market segments and popularising the practice of cleaning, grading, and packaging of the produce are expected to facilitate better market access by farmers, reduce transportation costs and increase the income of farmers. Industrial slowdown intensifies I.16 Growth in the index of industrial production (IIP) moderated sharply to 0.8 per cent during April-May 2012 as compared with 5.7 per cent duringApril-May 2011 (Table I.3). The slowdown in growth is reflected across all sectors. The mining sector continued to decline mainly due to regulatory and environmental
  • 16.
    Macroeconomic and MonetaryDevelopments First Quarter Review 2012-13 6 issues affecting coal mining and the low output of natural gas from the Krishna-Godavari (KG) basin. I.17 The recent contraction in mining is constraining the growth in the manufacturing sector. Mining output has been contracting since Q2 of 2011-12 impacting manufacturing output adversely, despite increasing imports of industrial inputs such as coal and steel substituting for domestic supply of industrial inputs. An empirical analysis of monthly data from April 2010 onwards reveals that a one per cent increase in mining output, on an average, resultsina0.6percentincreaseinmanufacturing output two periods ahead. Robust performance of the domestic mining sector which provides critical industrial inputs such as coal, natural gas and iron ore is, therefore, necessary for sustaining manufacturing growth. I.18 There has been a sharp moderation in manufacturing which was affected by sluggish investment activity, waning global demand and high input costs. While the industrial slowdown has been pervasive, it is compounded by the volatility in capital goods output (Chart I.8). Excluding the volatile items, the truncated IIP (96 per cent of IIP) growth in April-May 2012 is 3.0 per cent compared with 0.8 per cent growth in the general IIP (Chart I.9). Also, the growth pattern is skewed, with eight of the 22 industry groups showing negative growth during April-May 2012. I.19 By the use-based classification, moderation in growth is seen in all categories except consumer durables. The output of consumer non-durables has been declining since January 2012. The production of capital goods Table I.3: Index of Industrial Production: Sectoral and Use-Based Classification of Industries (Per cent) Industry Group Weight in the IIP Growth Rate Weighted Contribution# Apr-Mar 2011-12 April-May Apr-Mar 2011-12 April-May 2011-12 2012-13 P 2011-12 2012-13 P 1 2 3 4 5 6 7 8 Sectoral Mining 14.2 -1.9 1.6 -2.0 -7.8 3.3 -29.8 Manufacturing 75.5 3.0 6.0 0.6 83.2 83.3 66.5 Electricity 10.3 8.2 8.5 5.2 24.6 13.3 64.8 Use-Based Basic Goods 45.7 5.5 7.3 3.1 75.0 50.9 166.3 Capital Goods 8.8 -4.0 6.4 -13.8 -20.7 15.2 -250.6 Intermediate Goods 15.7 -0.8 2.0 0.6 -3.7 4.8 10.0 Consumer Goods (a+b) 29.8 4.4 5.2 4.0 49.2 29.2 171.7 a) Consumer Durables 8.5 2.6 3.3 7.2 13.3 8.5 140.1 b) Consumer Non-durables 21.3 5.9 6.8 1.3 35.8 20.7 31.6 General 100 2.9 5.7 0.8 100 100 100 P : Provisional # : Figures may not add up to 100 due to rounding off. Source: Central Statistics Office.
  • 17.
    Output 7 declined in April-May2012. The declining domestic production of capital goods has been partly substituted by increase in capital goods imports. However, domestic production of capital goods has also suffered in the backdrop of weak investment environment. As these conditions persist, investment activity is likely to remain subdued. The modest performance of basic and intermediate goods has also added to the overall moderation in industrial activity. I.20 Revival of global growth is significant for industrial recovery. Domestic industrial growth has a strong correlation with global industrial growth. The correlation coefficient between domestic and global IIP during April 2008 to May 2012 is 0.75 (Chart I.10). Input bottlenecks and capacity constraints impacting core industries I.21 Growth of eight core industries decelerated to 3.4 per cent during April-May 2012 compared to 5.0 per cent during the corresponding period in the previous year. Output of crude oil, natural gas and fertilisers contracted while that of refinery products and electricity decelerated during April-May 2012. Deficit rainfall during the period also affected the generation of hydro power. The output of coal, cement and steel, however, showed improvement during the period (Chart 1.11). I.22 The government has initiated several measures to augment the production potential of core industries, in particular, mining, in the
  • 18.
    Macroeconomic and MonetaryDevelopments First Quarter Review 2012-13 8 recent period. The improved performance of the coal industry could be partly attributed to this. However, several bottlenecks still afflict the mining sector output and a lot more needs to be done to remove structural constraints that have brought mining activity to a near standstill. I.23 The 17th round of the Order Books, Inventories and Capacity Utilisation Survey (http://www.rbi.org.in/OBICUS17) of the Reserve Bank for Q4 of 2011-12 indicates an improvement in the growth of new orders over the previous quarter, though the y-o-y growth was lower than in Q4 of the previous two years. Capacity utilisation level also improved in Q4 of 2011-12. The improvement is partly on account of seasonality but the level of capacity utilisation in the fourth quarter is fairly close to the peak level observed in the corresponding quarter of the previous year (Chart I.12). As expected, capacity utilisation has a strong co- movement with IIP-manufacturing. Employment growth slows down I.24 Thequarterlyquicksurveyofemployment conducted by the Labour Bureau in select sectors of the economy indicates that employment growth slowed considerably during Q4 of 2011-12 compared to the previous quarter and the corresponding quarter of the previous year. The quarter recorded the lowest rate of employment creation in two years, with all sectors barring IT/BPO and transport witnessing a decline in employment during the quarter. However, the employment of direct workers increased while that of contract workers declinedduringthequarter.Overall,employment generation in eight major industries during 2011-12 was lower than in the previous year by 14.3 per cent (Table I.4). Services sector likely to moderate I.25 The slowdown in the industrial sector and the muted demand conditions have impacted the growth of the services sector. Various lead indicators of the services sector point towards deceleration in growth (Table I.5).Addition to the wireless subscriber base is moderating. This could be partly on account of Table I.4: Changes in Estimated Employment (in millions) Industry/Group 2010-11 2011-12 2010-11 Q4 2011-12 Q3 2011-12 Q4 1 2 3 4 5 6 1. Textiles including apparels 0.100 0.090 -0.120 0.080 0.000 2. Leather 0.030 -0.020 -0.010 -0.010 -0.003 3. Metals 0.090 0.080 0.020 0.000 -0.007 4. Automobiles 0.110 0.030 0.010 -0.010 -0.001 5. Gems and jewellery -0.004 0.030 -0.002 0.010 -0.003 6. Transport -0.003 0.040 0.010 0.030 0.016 7. IT/BPO 0.670 0.580 0.290 0.110 0.104 8. Handloom / Powerloom -0.010 -0.003 -0.020 0.010 -0.026 Overall 0.980 0.840 0.170 0.220 0.080 Source: 14th Quarterly Quick Employment Survey, January-March 2012, Labour Bureau.
  • 19.
    Output 9 mobile number portabilityreducing the need for multiple connections. A services sector composite indicator based on growth in indicators of construction, trade and transport, and finance, developed by the Reserve Bank shows continuation of slowdown in services in Q1 of 2012-13 (Chart I.13). The outlook for the services sector depends to a large extent on the revival in industrial growth and an improvement in the global economic conditions. Growth in 2012-13 likely to be below potential I.26 Going forward, the outlook for growth looks weak and substantially affected by global headwinds, inflation and policy uncertainty. Although the south-west monsoon has been forecasted to be normal during 2012-13, its weak progress so far is a concern. The services sector is also showing signs of slowing down. Growth in communication services is likely to be low. The industrial sector, though improved in May, does not seem to be on course for sustained recovery. With growth slowing down, inflation is expected to moderate but demand- supply imbalances in respect of a number of items are limiting the price adjustment. Rupee depreciation in the recent period, however, is expected to support industrial and services sector activity through improved export competitiveness. Table I.5: Indicators of Services Sector Activity (Growth in Per cent) Services Sector Indicators 2009-10 2010-11 2011-12 April-June 2011-12 April-June 2012-13 1 2 3 4 5 6 Tourist arrivals 5.8 9.5 8.6 10.7 4.2 Cement 10.5 4.5 6.7 -0.6# 9.7# Steel 6.0 13.2 7.0 5.5# 5.8# Cell phone connections (in millions)$ 192.5 227.3 107.6 15.3* 6.1* Automobile sales 24.4 16.8 11.2 10.7 10.0 Railway revenue-earning freight traffic 6.6 3.8 5.2 7.0 4.8 Cargo handled at major ports 5.8 1.6 -1.7 5.2 -5.5 Civil aviation Domestic cargo traffic 24.3 23.8 -4.8 0.5* 2.0* International cargo traffic 10.5 17.7 -1.9 10.3* -6.0* Domestic passenger traffic 15.6 18.1 15.1  14.1* 8.3* International passenger traffic 8.8 10.3 7.6 14.0* 5.6* *: Data pertains to April 2012. #: Data refers to April-May 2012. $: Refers to wireless subscriber additions in actual numbers. Source: Ministry of Statistics and Programme Implementation, Ministry of Tourism and CMIE.
  • 20.
    10 Macroeconomic and MonetaryDevelopments First Quarter Review 2012-13 II. AGGREGATE DEMAND* Reflecting the slowdown in the domestic economy, growth in aggregate demand weakened further during Q4 of 2011-12. The decline in investment, particularly private corporate investment, has emerged as a major drag on demand. From a long-term perspective, the sustained fall in investment so far has impacted India’s growth potential. Some moderation in private consumption is also taking place, partly due to the impact of inflation on purchasing power. Corporate sales decelerated along with continued decline in profits and could adversely impact investments ahead. In this situation, crowding-in of private investment demand by public investment spending stimulus while aggressively cutting expenditure on subsidies hold the key to growth revival. Expenditure side of GDP continued to show weak demand II.1 The expenditure side aggregates, based on the revised estimates of national income released by the CSO in end-May 2012, are indicative of slackening demand conditions in the economy (Table II.1). This assessment however, is strongly influenced by the ‘statistical discrepancy’ in the data. For example, the sum of the contribution-weighted growth rates of the different expenditure components in Q4 of 2011-12 works out to 9 per cent, which is much Table II.1: Expenditure Side GDP (2004-05 prices) (Per cent) Item 2010-2011* 2011-12# 2010-11 2011-12 Q1 Q2 Q3 Q4 Q1 Q2 Q3 Q4 1 2 3 4 5 6 7 8 9 10 11 Growth Rates (y-o-y) I. GDP at market prices 9.6 6.9 9.5 8.9 10.0 9.7 9.0 6.9 6.2 5.6 II. Total Consumption Expenditure 8.1 5.4 9.4 8.8 6.9 7.4 4.9 4.9 6.1 5.8 (i) Private 8.1 5.5 9.1 8.6 7.3 7.6 4.9 4.6 6.4 6.1 (ii) Government 7.8 5.1 11.1 10.5 4.7 6.7 4.9 7.2 4.7 4.1 III. Gross Fixed Capital Formation 7.5 5.5 8.8 6.9 11.1 3.7 14.7 5.0 -0.3 3.6 IV. Change in Stocks 37.4 2.4 39.4 35.5 37.7 37.1 7.1 2.8 0.4 -0.4 V. Net Exports 5.5 -30.7 -35.4 -14.6 29.5 33.4 -23.2 -46.7 -117.9 117.8 VI. Discrepancies 38.9 -112.7 -1.0 11.1 91.1 7.3 -51.8 -119.6 -152.0 -124.0 Relative shares I. Total Consumption Expenditure 70.1 69.1 72.8 72.1 72.7 63.5 70.1 70.8 72.7 63.6 (i) Private 58.7 57.9 61.9 61.7 60.3 51.9 59.5 60.3 60.4 52.2 (ii) Government 11.4 11.2 11.0 10.5 12.5 11.6 10.6 10.5 12.3 11.4 II. Gross Fixed Capital Formation 32.5 32 32.2 34.0 32.3 31.4 33.9 33.4 30.3 30.9 III. Change in Stocks 3.7 3.5 3.7 3.8 3.5 3.6 3.7 3.6 3.4 3.4 IV. Net Exports -6.0 -7.4 -7.6 -8.2 -5.4 -3.4 -8.6 -11.3 -11.1 0.6 V. Discrepancies -2.5 0.3 -3.8 -4.3 -5.4 2.7 -1.7 0.8 2.6 -0.6 Memo: (` Billion) Real GDP at market prices 52368 56277 12087 12265 13533 14484 13174 13111 14377 15296 * : Quick Estimates. # : Revised Estimates. Note: As only major items are included in the table, data will not add up to 100. Source: Central Statistics Office. * Despite its well-known limitations, expenditure-side GDP data are being used as proxies for components of aggregate demand. However, in view of these limitations, which are amply reflected in the data for Q4 of 2011-12, supplementary information, including anecdotal data and judgements have been used to draw inferences.
  • 21.
    Aggregate Demand 11 higher thanthe growth rate of 5.6 per cent derived from the supply side after adjusting for net indirect taxes (Table II.2). Such ‘statistical discrepancy’ is also reflected in the incorrect manifestation of external demand through positive net exports in Q4 of 2011-12 in contrast to the record current account deficit posted in the data that were released by the Reserve Bank in end-June 2012. II.2 Keeping aside the apparent statistical weaknesses in the data, the moderation in expenditure persisted in Q4 of 2011-12, which was reflected across private and government final consumption expenditure and subdued growth in capital formation. Growth slowdown is reflected in weaker growth in private consumption and investment II.3 The growth in private final consumption expenditure, which accounts for around 60 per cent of GDP, decreased in Q4 of 2011-12. The subdued levels of gross fixed capital formation (GFCF), which accounts for around 30 per cent of GDP, can be partly attributed to high interest rates but non-monetary factors have also played a significant role. In this context, it may be mentioned that real interest rates in the recent period are lower than their levels in the pre- crisis years when investment rates were much higher. The moderation of investment in the recent period, therefore, suggests that there are factors other than interest rate at play. Empirical estimates in a recent Reserve Bank Working Paper show that the real interest (lending) rates explain only around one-third of real GDP growth. In the post crisis period, the slackening of investment is mainly related to the private corporate sector. In addition, the share of public investment in GDPhas declined.Apart from the erosion in corporate profit margins and already high leverage, other domestic and global factors have contributed to weakening investment activity. Investment outlook remained insipid in Q4 of 2011-12 II.4 Corporateinvestmentintentionsremained depressed. The aggregate project cost envisaged from the new projects sanctioned financial assistance by banks/FIs, have continued to moderate through 2011-12 aggregating `2.1 Table II.2: Contribution-Weighted Growth Rates of Expenditure-Side GDP (2004-05 Prices)* (Per cent) Item 2010-11 2011-12 Q1 Q2 Q3 Q4 Q1 Q2 Q3 Q4 1 2 3 4 5 6 7 8 9 1. Private final consumption expenditure 5.6 5.3 4.5 4.0 3.0 2.8 3.9 3.2 2. Government final consumption expenditure 1.2 1.1 0.6 0.8 0.5 0.8 0.6 0.5 3. Gross fixed capital formation 2.9 2.4 3.6 1.2 4.7 1.7 -0.1 1.1 4. Changes in stocks 1.2 1.1 1.1 1.1 0.3 0.1 0.0 0.0 5. Valuables 0.8 0.7 0.6 0.5 0.3 0.2 0.1 0.2 6. Net Export (i-ii) -2.2 -1.1 2.5 1.9 -1.8 -3.8 -6.4 4.0 (i) Exports 2.6 3.7 6.0 6.3 3.9 4.4 1.5 4.6 (ii) Less Imports 4.8 4.8 3.5 4.4 5.7 8.2 7.9 0.6 7. Sum 1 to 6 9.5 9.3 12.9 9.5 7.0 1.8 -2.0 9.0 8. Discrepancies 0.0 -0.5 -2.8 0.2 2.0 5.1 8.2 -3.4 9. GDP at market prices (7+8) 9.5 8.9 10.0 9.7 9.0 6.9 6.2 5.6 *: Contribution-weighted growth rate of a component of expenditure side GDP is obtained as follows: (Year-on-Year change in the component ÷ Year-on-Year change in GDP at constant market prices) × Year-on-Year growth rate of GDP at constant market prices. Source: Central Statistics Office
  • 22.
    12 Macroeconomic and MonetaryDevelopments First Quarter Review 2012-13 trillion in 2011-12, down from `3.9 trillion in the previous year (Table II.3). Industry-wise analysis revealed that the share of the power sector in the total envisaged project cost remained the highest in Q4 of 2011-12 followed by metal & metal products and textiles (Chart II.1). II.5 The time-phasing details of projects that have been sanctioned institutional assistance for various years up to 2011-12 indicate that total intendedcapitalexpenditurebyprivatecorporate (non-financial) firms declined in 2011-12 and can be expected to decline further during 2012-13 as planned investment in new projects is likely to remain low (Table II.4). Overall, declining trend in investment demand from the private corporate sector has emerged as the major drag on overall investment. Moderation in sales growth coupled with high input cost pressures led to declining corporate profits II.6 Sales growth for select Non-Government, Non-Financial (NGNF) listed companies by and large held up during 2011-12, though there was a perceptible drop in the last quarter (Table II.5, II.6). However, persistent pressure from input costs and rising interest outgo, led to decline in net profits (PAT). Operating and net profit margins declined during 2011-12 indicating a weakening pricing power for Indian corporates. Table II.3: Institutionally Assisted Projects and Their Envisaged Cost (Quarter-wise) Period Number of Projects Project Cost (` billion) 1 2 3 2009-10 Q1 146 908 Q2 189 1,327 Q3 175 1,194 Q4 231 827 2010-11 Q1 181 1,250 Q2 202 1,067 Q3 160 787 Q4 167 821 2011-12 Q1 154 787 Q2 194 572 Q3 151 506 Q4 169 255 Note: Based on data reported by 39 banks/FIs. Table II.4: Phasing of Capital Expenditure of Projects Sanctioned Assistance by Banks/FIs (` billion) Capital Expenditure in the Year Up to 2007-08 2008-09 2009-10 2010-11 2011-12 2012-13 Beyond 2013-14 Grand Total 1 2 3 4 5 6 7 8 9 Year of Sanction Up to 2007-08 1,826 1,317 583 376 98 47 - 4,247 2008-09 265 1,029 864 568 366 84 46 3,223 2009-10 2 444 1,359 1,216 804 320 111 4,255 2010-11 - 3 320 1,101 1,095 823 584 3,926 2011-12 - - 39 254 746 638 443 2,120 Grand Total # 2,093 2,793 3,165 3,515 3,109 1,912 1,184 - #: The estimates are ex ante, incorporating only the envisaged investment, and thus are different from those actually realised/ utilised.
  • 23.
    Aggregate Demand 13 Table II.5:Corporate Sector- Financial Performance per cent Item Annual: 2010-11 Annual: 2011-12 2010-11 2011-12 Q1 Q2 Q3 Q4 Q1 Q2 Q3 Q4 1 2 3 4 5 6 7 8 9 10 11 No. of Companies 2273 Growth Rates (y-o-y) Sales 20.0 18.6 25.1 19.2 17.1 20.7 22.6 19.1 19.5 15.5 Change in stock 80.4 -23.0 391.7 -55.5 108.5 124.0 -41.7 3.4 99.2 -55.9 Expenditure, of which 22.3 20.9 29.6 20.3 19.0 22.9 23.0 22.7 25.4 16.5 Raw Material 26.3 22.7 37.8 22.3 20.3 25.2 27.6 23.1 26.1 17.0 Staff Cost 19.3 17.6 16.5 20.5 21.2 19.5 19.9 17.4 18.8 14.4 Power & fuel 18.1 27.2 17.5 12.8 19.6 26.6 27.2 26.2 30.4 25.3 Operating Profits (PBDIT) 12.3 1.7 15.2 7.3 11.0 16.5 12.5 -1.1 -6.0 -1.4 Other Income* 2.0 41.4 -26.2 55.1 6.1 -14.6 45.4 28.3 70.6 47.6 Depreciation 16.2 10.5 20.2 17.6 14.7 14.6 9.7 9.7 10.3 11.2 Gross Profits (PBIT) 10.0 4.2 8.1 9.0 9.5 11.9 16.5 -0.4 -3.2 2.5 Interest 20.5 35.8 27.0 6.3 24.1 30.6 22.3 46.2 41.9 34.4 Tax Provision 11.3 11.3 5.2 8.3 4.8 2.7 22.1 4.3 -3.1 4.5 Net Profits (PAT) 9.0 -11.8 5.5 9.6 8.9 13.2 6.9 -15.6 -32.2 -7.7 Select Ratios Change in stock# to Sales 1.8 1.3 2.6 0.7 1.3 2.4 1.2 0.5 2.3 1.1 Interest Burden 19.7 27.9 20.9 19.5 19.8 19.0 22.0 28.8 28.9 27.3 Interest Coverage 5.1 3.6 4.8 5.1 5.1 5.3 4.6 3.5 3.5 3.7 PBDIT to Sales 15.8 13.6 16.3 15.6 16.1 15.4 15.0 13.0 12.6 13.1 PBIT to Sales 13.6 12.1 13.6 13.5 13.6 13.4 13.0 11.3 11.0 12.2 PAT to Sales 8.5 6.3 8.6 8.6 8.4 8.6 7.5 6.1 4.8 6.9 *: Other income excludes extraordinary income/expenditure if reported explicitly. #: For companies reporting this item explicitly. Note: Growth rates are percentage changes in the level for the period under reference over the corresponding period of the previous year for common set of companies. Table II.6: Corporate Sector- Financial Performance (Sequential Growth) Q-on-Q, per cent Indicator Number of Companies 2273 2010-11 Q1 2010-11 Q2 2010-11 Q3 2010-11 Q4 2011-12 Q1 2011-12 Q2 2011-12 Q3 2011-12 Q4 1 2 3 4 5 6 7 8 9 Sales -3.6 5.7 5.1 12.4 -1.8 2.7 5.5 8.6 Change in Stock 89.0 -70.6 98.5 137.8 -58.0 -47.9 282.5 -47.3 Expenditure, of which -2.9 4.7 5.2 15.0 -2.9 4.5 7.5 6.8 Raw Material -3.6 4.9 6.0 18.9 -3.5 1.2 8.5 10.4 Staff Cost 3.5 7.3 2.8 4.9 3.6 5.0 4.1 1.0 Power & Fuel 11.9 0.6 4.5 9.4 10.6 -0.2 8.0 5.1 Operating Profits (PBDIT) -1.1 1.2 8.2 7.3 -4.2 -11.1 2.9 12.6 Other Income* -47.1 43.5 -22.9 74.2 -24.6 26.6 2.6 50.7 Depreciation 1.2 2.1 3.0 7.7 -3.1 2.1 3.6 8.5 Gross Profits (PBIT) -9.2 4.9 5.7 13.5 -7.4 -10.3 2.6 20.2 Interest 16.5 -1.4 5.8 20.0 -2.3 17.9 2.7 13.6 Tax Provision -9.6 3.5 2.8 7.3 7.0 -11.5 -4.6 15.7 Net Profits (PAT) -9.9 5.6 3.8 14.1 -14.6 -16.5 -16.7 55.4 *: Other income excludes extraordinary income/expenditure if reported explicitly Note: Growth rates are percentage changes in the level for the period under reference over the previous quarter for common set of companies. II.7 Growth in sales (y-o-y) remained strong in the first three quarters of 2011-12 before moderating in Q4 of 2011-12. On a sequential basis, however, sales picked up in the latter half of the year. During Q4 of 2011-12, there was also some decline in the rate of growth of input
  • 24.
    14 Macroeconomic and MonetaryDevelopments First Quarter Review 2012-13 costs as well as interest outgo on a year-on-year basis. The build-up in inventory, however, was lower in Q4 of 2011-12 partly neutralising the higher built-up observed during the previous quarter. II.8 Along with the decline in sales growth, the stock-in-trade to sales ratio has also declined in Q4 of 2011-12 (Chart II.2). This decline points towards a pessimistic corporate outlook for demand conditions ahead. High deficits limit fiscal space for reviving private investment II.9 The centre’s gross fiscal deficit (GFD) rose sharply to 5.8 per cent in 2011-12 from 4.9 per cent in 2010-11, with revenue deficit constituting over three-fourths of GFD as against 67.5 per cent a year ago. The widening of revenue deficit in 2011-12 reflected the impact of the economic slowdown on tax revenues with the revenue receipts-GDP ratio in 2011-12 turning out to be lower than even the crisis years of 2008-09 and 2009-10. Although the revenue expenditure-GDP ratio declined in 2011-12, this was at the cost of development revenue expenditure. Notably, subsidies increased to 2.5 per cent of GDP. With the large and growing revenue deficit constraining the fiscal space for investment expenditure, the capital outlay to GDP ratio declined to 1.6 per cent, well below the pre- crisis level of over 2 per cent. Table II.7: Key Fiscal Indicators (As per cent to GDP) Year Primary Deficit Revenue Deficit Gross Fiscal deficit Outstanding Liabilities@ 1 2 3 4 5 Centre 2010-11 1.8 3.3 4.9 52.8 2011-12 RE 2.8 4.5 5.9 51.9 (2.7) (4.3) (5.8) 2012-13 BE 1.9 3.4 5.1 – States* 2010-11 0.5 -0.0 2.1 23.3 2011-12 RE 0.8 -0.1 2.3 22.3 2012-13 BE 0.6 -0.4 2.1 21.0 Combined* 2010-11 2.4 3.2 6.9 65.8 2011-12 RE 3.6 4.4 8.2 65.4 2012-13 BE 2.6 3.1 7.1 – RE: Revised Estimates. BE: Budget Estimates. @: Includes external debt at current exchange rates. *: Data in respect of States pertains to 26 State Governments. Note: Figures in parentheses are provisional accounts. Source: Budget documents of the Central and State Governments. II.10 Preliminary data indicates that the combined revenue and fiscal deficits of the centre and states as a proportion of GDP increased by 1.2 percentage points and 1.3 percentage points, respectively, in 2011-12 over the previous year, with over 80 per cent of the increase contributed by the centre (Table II.7). Combined development expenditure-GDP ratio increased in 2011-12 on account of the states (Table II.8). Table II.8: Combined Finances of Central and State Governments Item Per cent to GDP 2010-11 2011-12 (RE) 2012-13 BE 1 2 3 4 1. Total expenditure 27.8 28.3 27.8 2. Revenue Expenditure 23.7 24.0 23.3 3. Capital Expenditure 4.1 4.3 4.5 Of which: Capital Outlay 3.7 3.7 4.1 4. Non-Developmental Expenditure 11.1 11.1 11.1 5. Development expenditure 16.4 16.8 16.3 6. Revenue Receipts 20.5 19.6 20.2 i) Tax Revenue (net) 16.3 16.4 16.9 ii) Non Tax Revenue 4.2 3.2 3.4 RE: Revised Estimates. BE: Budget Estimates. Note: Data in respect of States pertains to 26 State Governments. Source: Budget documents of the Central and State Governments.
  • 25.
    Aggregate Demand 15 Likely overshootingof subsidies pose fiscal risks during 2012-13 II.11 Achieving fiscal consolidation as envisaged in the budget for 2012-13 would hinge on the realisation of budgeted tax buoyancies and capping of subsidies to below 2 per cent of GDP. The compensation to oil marketing companies for under-recoveries budgeted at `400 billion for 2012-13, however, appears inadequate, given the spillover in compensation of `385 billion in Q4 of 2011-12 and under-recoveries of `478 billion reported by oil marketing companies for Q1 of 2012-13, in spite of some softening of global crude oil prices. Capping the subsidies within the budgeted limits would necessitate steps to allow the pass-through of international crude oil prices to domestic prices, failing which it would be difficult to achieve the overall deficit targets. II.12 Besides the fiscal slippage on account of fuel subsidies, moderation in growth from the assumed 7.6 per cent for 2011-12 in the Union budget could be another risk factor for revenue receipts. II.13 Available data show that during April- May 2012 key deficits in terms of percentages to budget estimates improved over the corresponding period of the previous year mainly on account of higher tax revenue, particularly under income and services tax collections. Direct taxes continued to exhibit buoyant growth in Q1 of 2012-13, although the increase partly reflects the lower tax refunds compared with the previous year. Indirect tax collections under Union excise and customs duties during Q1 of 2012-13 shows marked slippage from budgeted growth. II.14 Aggregate expenditure growth in the first two months of 2012-13 was higher than a year ago, attributable to higher non-plan revenue expenditure, with interest payments accounting for over 29 per cent of the increase. State finances budgeted to improve further in 2012-13 II.15 In contrast to the centre, the consolidated revenue account of the states (excluding Mizoram and Manipur) showed a marginal surplus in 2011-12 as compared with the revenue balance in 2010-11.Although there was an increase in the GFD-GDPratio, this was used to fund higher capital outlays. On the revenue front, despite the economic slowdown, the tax- GDP ratio of the states increased over the previous year, aided in large part by higher VAT/ sales tax collections on petroleum products. In fact, for the first time tax collections of state governments on petroleum products in 2011-12 were higher than those of the centre. The quality of expenditure also improved in 2011-12, with increases in development and social sector expenditures as well as capital outlay in proportion to GDP. II.16 The key deficit indicators of the states are budgeted to improve further in 2012-13. The consolidated revenue surplus of the state governments is budgeted to increase in 2012-13, mainly on account of an increase in the revenue receipts-GDPratio, which is to be supplemented by reduction in the revenue expenditure-GDP ratio. The budgeted increase in revenue surplus would enable a higher capital outlay-GDP ratio for the states in 2012-13, even while reducing their consolidated GFD-GDP ratio. II.17 The majority of the states have budgeted to meet the targets set by the Thirteenth Finance Commission (ThFC) for deficit/debt indicating their commitment to the fiscal consolidation process. The challenge for the states is to refrain from sacrificing the quality of fiscal adjustment in their endeavour to meet the incentivised quantitative targets. Need to create fiscal space, spur investment to revive growth II.18 Recovery of investment is critical in reviving growth but depends on fiscal consolidation and improvement in overall
  • 26.
    16 Macroeconomic and MonetaryDevelopments First Quarter Review 2012-13 macroeconomic scenario. The major challenges to growth recovery at the current juncture emanate from the weak investment demand. Even a modest recovery in economic growth during 2012-13 is contingent on the recovery of investment. However, the capacity of investment to respond to monetary policy actions to stimulate growth is conditional on an improvement in non-monetary factors that have impacted investment in the current cycle. On the other hand, persistent inflation, limits the space for monetary policy to revive growth. II.19 The slowdown in consumption demand also points towards the impact of high and persistent inflation on purchasing power. This also indicates the need for keeping inflation under check to maintain consumption demand at levels consistent with the overall growth objective. Therefore, monetary policy has to continue to remain guarded against a build-up of inflationary risks as well as to sustain the growth potential. II.20 Given the deterioration in the fiscal situation, the option of using fiscal policy to stimulateaggregatedemandremainsunavailable unlike in 2008-09 when the previous period of fiscal consolidation helped to provide the necessary fiscal space. As higher deficits could lead to pressures on yields, affecting the already weak private investment demand, it is critical to return to a credible and durable fiscal consolidation path.As such, fiscal space would need to be created by controlling revenue expenditure to provide more resources for capital expenditure which could crowd-in private investment.
  • 27.
    The External Sector 17 III.THE EXTERNAL SECTOR The weakness in the external sector observed in 2011-12 continued during the first quarter of 2012-13, mainly reflecting uncertainty in global economic and financial conditions coupled with weak domestic macroeconomic conditions. The rupee witnessed renewed pressures and depreciated against the US dollar in Q1 of 2012-13, in line with the trend registered by major EDE currencies. Capital flows have remained subdued and volatile. Notwithstanding various policy measures initiated by the Reserve Bank, significant depreciation of the rupee, softening commodity prices and moderation in gold imports, improvement in the trade deficit will continue to hinge upon global macroeconomic conditions and therefore, upside risks remain. With services exports likely to decelerate during 2012-13, the risks of CAD going above its sustainable rate, and difficulties in financing it, persist. Global factors continue to weigh on India’s exports III.1 India’s merchandise exports, which had decelerated in 2011-12, contracted in Q1 of 2012-13 mainly reflecting subdued demand conditions in key global markets, particularly the EU and the US (Table III.1). In particular, exports of engineering goods, petroleum products, gems and jewellery and readymade garments have been affected. Evidently the significant depreciation in the rupee since H2 of 2011-12 could not sufficiently offset the impact of the slowdown in global demand. In recent years, due to export diversification efforts, the share of developing economies in India’s total exports witnessed a gradual increase. However, as the sluggish economic conditions in advanced economies (AEs) slowly spilled over to other emerging and developing economies (EDEs), diversification did not yield results similar to those seen in previous years. Going forward, economic conditions especially in EU are likely to remain muted for some time. As a result, growth in global trade volume, including exports from EDEs, is likely to be lower in 2012. Indian exports are likely to reflect this general trend. Table III.1: India’s Merchandise Trade (US$ billion) Item April-March April-June 2010-11 R 2011-12 P 2011-12 R 2012-13 P Value Growth (%) Value Growth (%) Value Growth (%) Value Growth (%) 1 2 3 4 5 6 7 8 9 Exports 251.1 40.5 304.6 21.3 76.5 36.4 75.2 –1.7 Of which: Oil 41.5 47.1 55.6 34.0 15.3 76.2 12.9 –15.6 Non-oil 209.7 39.3 249.0 18.8 61.2 29.1 62.3 1.8 Imports 369.8 28.2 489.4 32.4 122.7 36.3 115.3 –6.1 Of which : Oil 106.0 21.6 154.9 46.2 39.4 52.5 41.5 5.3 Non-oil 263.8 31.1 334.5 26.8 83.3 29.7 73.8 –11.5 Gold 40.5 41.6 56.2 38.8 16.1 109.1 8.5 –47.5 Non-Oil Non-Gold 223.3 29.3 278.3 24.6 67.2 18.9 65.3 –2.9 Trade Deficit –118.6 –184.8 –46.2 –40.1 Of which: Oil –64.5 –99.3 –24.1 –28.6 Non-oil –54.1 –85.5 –22.1 –11.5 R: Revised. P: Provisional. Source: DGCI&S.
  • 28.
    Macroeconomic and MonetaryDevelopments First Quarter Review 2012-13 18 Softening of international commodity prices narrowed the trade deficit III.2 The weakness in India’s external position in 2011-12 stemmed partly from the import-induced surge in the current account deficit (CAD). Given the inelastic nature of India’s imports of petroleum, oil and lubricants (POL) and gold, the rise in international prices of these commodities led to overall high imports. This trend, however, reversed in Q1 of 2012-13. The decline in imports in the quarter was sharper than that in exports (Chart III.1a). Import moderation was mainly on account of a modest contraction in POL imports and a significant contraction in gold and silver imports. The lower growth in POL reflects the softening of international crude oil prices, while the decline in gold and silver imports appears to reflect the impact of policy measures taken in January and March 2012 (Chart III.1b). Growth moderation in non-oil imports in recent months appears to be on account of confluence of various factors, viz., domestic slowdown, global uncertainty, moderation in global commodity prices and the possible impact of rupee depreciation in some sectors. As a result, the trade deficit narrowed somewhat in Q1 of 2012-13 compared with the corresponding period of the previous year. Upside risks to trade deficit persist III.3 Recent trend of faster deceleration in imports than exports has given rise to the possibility that CAD could improve in 2012-13. However, current assessment suggests that such improvement could be insufficient to ensure CAD sustainability. The upside risk to CAD remain significant. The response of exports to depreciation of rupee has so far remained muted due to subdued global demand. Downside risks to export growth are large in view of worsening global conditions. Exchange rate sensitivity of India’s import is also limited. Slowdown in global IT spending may dampen growth in software exports III.4 Despite the challenges in global market conditions, services exports, in general and software exports in particular sustained the growth momentum in 2011-12 (Table III.2). However, net services exports earnings at US$14 billion in Q1 of 2012-13, have declined by about 12 per cent y-o-y, suggesting loss of momentum. Services exports in gross terms expanded by 3 per cent, while imports increased by 19 per cent in this quarter. Going forward, NASSCOM projection of 11-14 per cent growth in software exports in 2012-13, suggests deceleration. Current indications, borne out by dollar revenue guidance of IT majors, suggest that software export earnings may even be lower than projected by NASSCOM. The risk of lower software exports may arise from reduced spending on technology by US corporations, continued uncertainty in the euro area countries and likely euro depreciation. As
  • 29.
    The External Sector 19 softwareexports account for nearly 63 per cent of net receipts of invisibles, any deceleration in these exports may aggravate the already high CAD recorded in recent quarters. Capital flows may remain volatile due to global uncertainties III.5 The exacerbation in CAD during 2011- 12 led to depletion of reserves notwithstanding improved capital flows (Table III.3). Since Q1 of 2012-13, concerns about the growth and financial health of euro area countries have further intensified. In addition, signs of weakness in the US and China have also made investors more cautious and driven up global financial market volatility. These factors, combined with weakening domestic macroeconomic conditions, led to a net FII outflow of US$ 1.7 billion in Q1 of 2012-13. Concerns about the domestic business environment appear to be weighing on FDI inflows as well. NRI deposits, however, have picked up in recent months (Table III.4). Since concerns about the growth outlook forAEs seem to have prompted investors to reconsider the resilience of emerging market growth as well, the outlook for capital flows to EDEs including India remains subdued. Rupee gains in Q4 of 2011-12 dissipated in Q1 of 2012-13 III.6 The rupee gained by 4.1 per cent in Q4 of 2011-12, partly reflecting the favourable impact of policy measures by the Reserve Bank to improve capital flows and curb speculative pressure in foreign exchange market. The intervention in the foreign exchange market also helped in containing the depreciation. However, Table III.2: Major Items of India’s Balance of Payments (US$ billion) 2010-11 (PR) 2011-12 (P) 2011-12 2010-11 Q1 (PR) Q2 (PR) Q3 (PR) Q4 (P) Q4 (PR) 1 2 3 4 5 6 7 8 1. Goods Exports 250.6 309.8 78.8 79.6 71.5 80.0 77.4 2. Goods Imports 381.1 499.5 123.7 124.1 120.1 131.7 107.4 3. Trade Balance (1–2) –130.5 –189.7 –44.9 –44.5 –48.6 –51.7 –30.0 4. Services Exports 131.7 140.9 33.7 32.3 37.3 37.7 35.3 5. Services Imports 83.0 76.9 17.4 18.3 21.1 20.0 20.7 6. Net Services (4–5) 48.7 64.0 16.3 14.0 16.2 17.7 14.6 7. Goods & Services Balances (3+6) –81.8 –125.7 –28.6 –30.5 –32.4 –34.0 –15.4 8. Primary Income (Net) –17.3 –16.0 –3.6 –4.0 –3.8 –4.6 –4.5 9. Secondary Income (Net) 53.1 63.5 14.8 15.6 16.2 16.9 13.6 10. Net Income (8+9) 35.8 47.5 11.2 11.6 12.4 12.3 9.1 11. Current Account Balance (7+10) –46.0 –78.2 –17.4 –18.9 –20.2 –21.7 –6.3 12. Capital Account Balance 0.04 –0.1 –0.3 0.2 0.1 –0.2 –0.02 13. Financial Account Balance 48.9 80.7 18.7 19.0 20.6 22.4 7.1 of which: Change in Reserves (increase-/decrease+) –13.1 12.8 –5.4 –0.3 12.8 5.7 –2.0 14. Errors & Omissions (-) (11+12+13) –3.0 –2.4 –0.9 –0.4 –0.5 –0.6 –0.8 Memo: As ratio to GDP 15. Trade Balance –7.7 –10.3 –9.8 –9.9 –10.7 –10.6 –6.2 16. Net Services 2.9 3.5 3.6 3.1 3.5 3.6 3.0 17. Net Income 2.1 2.6 2.4 2.6 2.7 2.5 1.9 18. Current Account Balance –2.7 –4.2 –3.8 –4.2 –4.4 –4.5 –1.3 19. Capital and Financial Account, Net 3.7 3.7 5.2 4.4 1.7 3.4 1.9 (Excl. changes in reserves) P: Preliminary; PR: Partially Revised Note: Total of subcomponents may not tally with aggregate due to rounding off.
  • 30.
    Macroeconomic and MonetaryDevelopments First Quarter Review 2012-13 20 the rupee started weakening from the first week of April 2012 as portfolio capital inflows dried up. The large trade deficit, domestic policy uncertainty and growing apprehensions about the euro area affected the overall investment sentiment. As a result, the rupee reached a low of 57.2 on June 27, 2012 and the real effective exchange rate (i.e., the REER based on 6, 30 and 36 currency baskets) recorded a depreciation (Table III.5). Increasing external debt is a concern III.7 Since equity flows dwindled, various measures were taken to encourage other capital flows into the country.These include an increase Table III.3: Disaggregated Items of Financial Account (US$ billion) 2010-11 (PR) 2011-12 (P) 2011-12 2010-11 Q4 (PR) Q1 (PR) Q2 (PR) Q3 (PR) Q4 (P) 1 2 3 4 5 6 7 8 1. Direct Investment (net) 9.4 22.1 9.3 6.5 5.0 1.4 1.1 1.a Direct Investment to India 25.9 33.0 12.4 9.5 6.9 4.2 5.5 1.b Direct Investment by India –16.5 –10.9 –3.1 –3.0 –1.9 –2.9 –4.4 2. Portfolio Investment 28.2 16.6 2.3 –1.4 1.8 13.9 –0.01 2.a Portfolio Investment in India 29.4 16.8 2.5 –1.6 1.9 14.1 –0.03 2.b Portfolio Investment by India –1.2 –0.2 –0.2 0.2 –0.04 –0.2 0.02 3. Other investment 24.4 29.2 12.6 14.2 1.0 1.4 8.1 3.a Other equity (ADRs/GDRs) 2.0 0.6 0.3 0.2 0.1 0.03 0.2 3.b Currency and deposits 3.8 12.1 1.2 3.1 3.2 4.6 2.0 Deposit-taking corporations, except the central bank: (NRI Deposits ) 3.2 11.9 1.2 2.8 3.3 4.7 0.9 3.c Loans* 18.6 16.8 14.9 9.5 –7.7 –0.03 1.0 3.c.i Loans to India 18.3 15.7 14.9 8.9 –8.1 –0.02 0.7 Deposit-taking corporations, except the central bank 1.2 4.1 11.5 3.9 –8.7 –2.6 –2.7 General government (External Assistance) 5.0 2.5 0.4 0.3 1.4 0.3 0.8 Other sectors (ECBs) 12.2 9.1 3.0 4.7 –0.8 2.3 2.7 3.c.iiLoans by India 0.3 1.0 –0.02 0.6 0.5 –0.01 0.3 General government (External Assistance) –0.03 –0.2 –0.04 –0.04 –0.04 –0.04 –0.01 Other sectors (ECBs) 0.3 1.2 0.02 0.6 0.5 0.03 0.3 3.d Trade credit and advances 11.0 6.7 3.1 2.9 0.6 0.2 2.7 3.e Other accounts receivable/payable - other –11.1 –6.9 –6.8 –1.5 4.9 –3.3 2.2 4. Reserve assets (increase-/decrease+) –13.1 12.8 –5.4 –0.3 12.8 5.7 –2.0 Financial Account (1+2+3+4) 48.9 80.7 18.7 19.0 20.6 22.4 7.1 P: Preliminary; PR: Partially Revised *: Includes External Assistance, ECBs, non-NRI Banking Capital and short term trade credit. Note: Total of subcomponents may not tally with aggregate due to rounding off. Table III.4: Capital Flows in 2011-12 and 2012-13 So Far (US$ billion) Component 2011-12 2012-13 Apr.- Jun. Jul.- Sep. Oct.- Dec. Jan.- Mar. Apr.- Jun. Average of the monthly flows 1 2 3 4 5 6 FDI in India 4.1 3.1 2.3 1.5 2.2* FDI by India 1.0 1.0 0.6 1.0 0.5 FIIs (Net) 0.8 –0.5 0.6 4.7 –0.6 ADRs/GDRs 0.1 0.1 0.03 0.01 0.01 ECB Inflows 1.0 1.6 0.9 0.8 –0.4 NRI Deposits (Net) 0.4 0.9 1.1 1.6 2.4* *April-May.
  • 31.
    The External Sector 21 inFII investment in debt securities (both government and corporate debt), enhancing all-in-cost ceiling for ECBs and trade credit and the deregulation of interest rates on rupee- denominated NRI deposits, i.e., NRE and NRO accounts. On account of the greater recourse to such debt creating flows in financing CAD, India’s external debt increased significantly during Q4 of 2011-12 (Table III.6). Further, the repayment of commercial borrowings of about US$ 15 billion (including FCCBs of about US$ 4.7 billion) is due during 2012-13. Thus, there is a pressing need to improve the equity flows to finance CAD and maintain the external debt at a manageable level. Sustainability of CAD and its financing remain concerns III.8 External sector vulnerability indicators showed mixed trend in Q4 of 2011-12 (Table III.7). There has been a marginal improvement in the ratio of short-term debt to total debt. While debt GDP ratio and debt service ratio remained same, other indicators such as ratio Table III.5: Nominal and Real Effective Exchange Rates-Trade Based (Base: 2004-05=100) (Per cent, appreciation+/depreciation-) Index July 20, 2012 P Year-on-Year Variation (Average) 2011-12 (March 2012 over January 2012 ) 2012-13 (July 20, 2012 over March 2012) 2009-10 P 2010-11P 2011-12 1 2 3 4 5 6 7 36-REER 91.4 –3.2 8.0 –3.2 2.3 –7.2 36-NEER 78.6 –2.6 3.1 –6.4 1.2 –9.7 30-REER 83.5 –4.6 4.8 –2.9 2.3 –7.2 30-NEER 80.3 –2.2 1.1 –5.4 1.0 –9.6 6-REER 104.6 –0.3 13.0 –6.8 2.5 –7.1 6-NEER 76.4 –3.7 5.7 –7.9 1.4 –9.9 `/US$ (Average) 54.5# –3.2 4.0 –4.9 2.0 –7.7# `/US$ (end-March) 55.9* 12.9 1.1 –12.7 –2.9 –8.6* P: Provisional. NEER: Nominal Effective Exchange Rate. REER: Real Effective Exchange Rate. *: As on July 26, 2012. #: April-July 26, 2012 over March 2012. Note: Rise in indices indicates appreciation of the rupee and vice versa. Table III.6: India’s External Debt (US $ billion) Item End-Mar 2011 PR End-Jun 2011 PR End-Sep 2011 PR End-Dec 2011 PR End-Mar 2012 QE Variation (End-Mar 2012 over End-Dec 2011) Amount Per cent 1 3 4 5 6 7 8 9 1. Multilateral 48.5 49.4 49.1 49.9 50.5 0.5 1.1 2. Bilateral 25.7 26.2 27.1 27.1 26.8 –0.3 –1.1 3. International Monetary Fund 6.3 6.4 6.2 6.1 6.1 0.1 0.9 4. Trade Credit (above 1 year) 18.6 18.7 19.5 19.8 19.9 0.1 0.6 5. External Commercial Borrowings 88.6 92.9 96.3 98.7 104.4 5.7 5.8 6. NRI Deposits 51.7 52.9 52.3 52.5 58.6 6.1 11.6 7. Rupee Debt 1.6 1.6 1.4 1.3 1.3 0.0 0.0 8. Long-term (1 to 7) 240.9 247.9 252.0 255.4 267.6 12.3 4.8 9. Short-term 65.0 68.5 71.5 76.0 78.2 2.2 2.9 Total (8+9) 305.9 316.4 323.5 331.4 345.8 14.5 4.4 PR: Partially Revised. QE: Quick Estimates.
  • 32.
    Macroeconomic and MonetaryDevelopments First Quarter Review 2012-13 22 of foreign exchange reserves to total debt and the short-term debt to foreign exchange reserves, deteriorated as at end-March 2012 compared with end-December 2011. India’s Net International Investment Position (NIIP) also weakened (Table III.8). Rising vulnerability to external shocks III.9 The CAD-GDP ratio was high at 4.5 per cent in Q4 of 2011-12, taking the full year ratio to an all time high of 4.2 per cent. Such high level of CAD, especially against the backdrop of volatile global macroeconomic conditions and volatile capital flows, raise grave concerns about its sustainability. A recent analysis shows that with GDP growth of 7 per sustainable. The estimate is based on analysis of threshold level of India’s net external liability to GDPratio to work out sustainable CAD-GDP ratio in various growth scenarios. With an increase in deficit beyond this level, financing could be a constraint and the external sector vulnerability may rise further. High external debt, along with a deterioration in the net international investment position and a moderate decline in forex reserves also weakened the resilience of India’s external sector in Q4 of 2011-12. Going forward, the trend in CAD will largely depend on the global macroeconomic and trade environment. The trend in capital flows will depend on global liquidity conditions, as well as the domestic investment and policy environment. Table III.7: External Sector Vulnerability Indicators (Per cent) Indicator End-Mar 2010 End-Jun 2010 End-Mar 2011 End-Jun 2011 End-Sep 2011 End-Dec 2011 End-Mar 2012 1 2 3 4 5 6 7 8 1. Ratio of Total Debt to GDP 18.0 - 17.8 15.9 17.8 20.0 20.0 2. Ratio of Short-term to Total Debt (Original Maturity ) 20.0 20.9 21.2 21.6 22.1 22.9 22.6 3. Ratio of Short-term to Total Debt (Residual Maturity) 41.2 42.5 42.2 43.3 43.4# 43.5# 42.6 4. Ratio of Concessional Debt to Total Debt 16.8 15.9 15.5 15.1 14.8 14.4 13.9 5. Ratio of Reserves to Total Debt 106.9 98.0 99.6 99.8 96.3 89.5 85.1 6. Ratio of Short-term Debt to Reserves 18.8 21.0 21.3 21.7 23.0 25.6 26.6 7. Reserves Cover of Imports (in months) 11.1 10.7 9.6 9.2 8.5 7.7 7.1 8. Reserves Cover of Imports and Debt Service Payments (in months) 10.5 10.1 9.1 8.8 8.0 7.3 6.8 9. Debt Service Ratio (Debt Service Payments to Current Receipts) 5.8 4.1 4.3 4.8 4.7 5.6 5.6 10. External Debt (US$ billion) 260.9 270.3 305.9 316.4 323.5 331.4 345.8 -: Not available. #: RBI Estimate. Table III.8: Overall International Invest- ment Position of India (US$ billion) Period Mar-11 (PR) Jun-11 (PR) Sep-11 (PR) Dec-11 (P) Mar-12 (P) 1 2 3 4 5 6 NIIP -203.6 -216.5 -196.6 -204.8 -244.8 Assets 439.8 450.0 453.9 431.6 437.1 Liabilities 643.4 666.5 650.5 636.5 682.0 NIIP-GDP Ratio* -12.1 -11.9 -11.0 -11.3 -13.2 PR: Partially Revised P: Preliminary. * Based on annualised GDP. cent, CAD-GDP ratio of around 2.5 per cent is
  • 33.
    Monetary and LiquidityConditions 23 While continuing to manage the growth-inflation trade-off, the Reserve Bank reduced the repo rate by 50 basis points in April 2012. Monetary conditions have gradually eased in 2012-13 so far as a result of the two-stage reduction in the cash reserve ratio in Q4 of 2011-12, the repo rate cut and significant depreciation of the exchange rate. Active liquidity management by the Reserve Bank by way of sizeable open market purchases and other policy measures has helped correct the excessively tight liquidity that prevailed during the latter part of 2011-12. Besides the gradual pick-up in growth in monetary aggregates in 2012-13 so far, there has been a pick-up in non-food credit which as of mid-July 2012 was growing marginally above the indicative projection for 2012-13. Reserve Bank front-loads rate cut using the available monetary policy space IV.1 In April 2012, the Reserve Bank reduced the repo rate for the first time in three years. Even as inflation remained the main concern, the policy rate was reduced by 50 basis points on account of moderation in growth below its post-crisis trend (Table IV.1). While it was recognised that the deviation in growth from its trend was modest, the slowdown, nevertheless, was expected to contribute to some moderation in core inflation. The cumulative impact of past monetary tightening was expected to moderate inflation further through slower growth. IV.2 Inflation has, however, persisted above the level consistent with sustainable growth. When the Reserve Bank undertook the front- loaded rate cut action in April 2012, it clearly enunciated that upside risks to inflation persisted and space for further reduction in policy rates was limited. This space was further constrained by lack of credible action to curtail subsidies and related expenditure by the government. Also, there were a number of factors other than monetary policy actions behind the growth slowdown in 2011-12. IV.3 Apart from the rate cut, monetary conditions eased as a result of softening impact on interest rates of the 125 basis points reduction in the cash reserve ratio (CRR) during Q4 of 2011-12 and the significant exchange rate depreciation (about 10 per cent in Q1 of 2012- 13 and about 20 per cent cumulative since August 2011). The monetary easing during Q1 of 2012-13 has significantly corrected the tightness in monetary and liquidity conditions witnessed during Q4 of 2011-12. M3 expansion during 2011-12 at 13.1 per cent was below the indicative projection of 15.5 per cent. Low reserve money expansion at 9.6 per cent (adjusted for CRR changes) contributed to lower expansion of money supply. Reserve money creation has improved during 2012-13 so far, and deposit creation and consequently, monetary expansion is within sight of indicative projections for the year (Table IV.2). IV. MONETARYAND LIQUIDITYCONDITIONS Table IV.1: Movements in Key Policy Variables (Per cent) Effective since Repo Rate Cash Reserve Ratio 1 2 3 May 3, 2011 7.25 (+0.50) 6.00 June 16, 2011 7.50 (+0.25) 6.00 July 26, 2011 8.00 (+0.50) 6.00 September 16, 2011 8.25 (+0.25) 6.00 October 25, 2011 8.50 (+0.25) 6.00 January 28, 2012 8.50 5.50 (-0.50) March 10, 2012 8.50 4.75 (-0.75) April 17, 2012 8.00 (-0.50) 4.75 Note: Figures in parentheses indicate change in percentage points.
  • 34.
    Macroeconomic and MonetaryDevelopments First Quarter Review 2012-13 24 Liquidity deficit eases in response to active management and measures taken by the Reserve Bank IV.4 There was a significant easing of liquidity deficit in Q1 of 2012-13, and the extent of deficit returned to the Reserve Bank’s comfort level of one per cent of net demand and time liabilities (NDTL) in July 2012 (Chart IV.1). This was primarily on account of large scale open market purchases by the Reserve Bank as also measures such as enhancing of the limit of export credit refinance (ECR). IV.5 There was a distinct period of liquidity tightness that prevailed from November 2011 to early April 2012. The liquidity squeeze started in November 2011 on account of large scale forex intervention by the Reserve Bank as well as the usual high currency demand during the festive season. The squeeze on liquidity persisted into Q4 of 2011-12 as the government built up large balances with the Reserve Bank. There was continued intervention in the forex market while the drain on account of currency persisted due to seasonal factors as well as elections in a few states (Chart IV.2). Moreover, Table IV.2: Monetary Indicators Item Outstanding Amount (` billion) July 13, 2012 Financial year to date variations (Per cent) Y-o-y variations (Per cent) 2011-12 2012-13 July 15, 2011 July 13, 2012 1 2 3 4 5 6 Reserve Money (M0 )* 14,810.1 -1.8 3.8 13.3 9.5 Reserve Money (Adjusted) -1.8 3.6 13.5 15.7 Broad Money (M3 ) 77,301.2 4.0 5.0 16.9 14.3 Main Components of M3 Currency with the Public 10,798.0 4.5 5.2 14.9 13.4 Aggregate Deposits 66,463.9 4.0 5.0 17.3 14.4 of which: Demand Deposits 6,603.5 -13.7 -6.3 -5.2 5.8 Time Deposits 59,860.4 6.6 6.4 20.7 15.4 Main Sources of M3 Net Bank Credit to Government 25,558.2 7.7 7.9 22.3 19.6 Bank Credit to Commercial Sector 50,751.6 2.0 2.3 19.3 17.4 Net Foreign Assets of the Banking Sector 16,377.6 1.2 6.1 5.8 16.2 Memo: NetNon-monetaryLiabilitiesoftheBankingSector 15,531.7 -0.3 1.7 20.8 38.8 Note: 1. Data are provisional. 2. *: Data pertain to July 20, 2012.
  • 35.
    Monetary and LiquidityConditions 25 the spread between the pace of credit growth and deposit growth, which had narrowed in the first three quarters of 2011-12 and had in fact turned negative in December 2011, widened again during the fourth quarter. This added a structural dimension to the liquidity deficit (Chart IV.3). The Reserve Bank responded by injecting liquidity through outright open market operations of `1.3 trillion between November 2011 and March 2012 as also CRR cuts that released about `0.8 trillion into the system. Despite the active management, the liquidity deficit persisted at a high level. IV.6 Since April 2012, however, there has been an easing of the liquidity stress in the system. The significant easing was brought about by the Reserve Bank actively managing liquidity through the liquidity adjustment facility (LAF) and open market operations (OMO). The Reserve Bank injected liquidity through outright OMO purchases of `0.8 trillion in the financial year so far, of which `0.6 trillion was through auction route. Also, there was some narrowing of the wedge between the pace of growth of deposit and credit in Q1 of 2012-13. IV.7 In order to provide greater liquidity cushion to banks, the borrowing limit of scheduled commercial banks (SCBs) under the Marginal Standing Facility (MSF) has been raised from one per cent of their NDTL to two per cent since April 17, 2012. This has further helped in steering the monetary policy operating target, the weighted average overnight call money rate, within the formal corridor (Chart IV.4). The movements in the operating target of monetary policy mostly mirror the liquidity position in the system.As noted above, there was a systemic liquidity deficit from November 2011 to earlyApril 2012. This period coincided with the call rate mainly staying above the mid-point of the corridor (i.e., the repo rate) and at times hovering close to the ceiling set by the MSF rate. As liquidity eased in Q1 of 2012-13, the call rate gradually eased back to the mid-point of the corridor. IV.8 To further augment liquidity and encourage banks to increase credit flow to the export sector, the Reserve Bank increased the limit of ECR from 15 per cent of outstanding export credit to 50 per cent with effect from the fortnight beginning June 30, 2012. This amounted to release of additional liquidity support of over `300 billion, equivalent to about 50 basis points reduction in the CRR. The daily average amount of ECR availed increased from `70 billion in June 2012 to `177 billion in July 2012 (up to July 26) . IV.9 As regards the autonomous factors that drive liquidity – currency with the public, intervention in the foreign exchange market and government’s cash position – the first two were largely adverse during the Q1 of 2012-13. There
  • 36.
    Macroeconomic and MonetaryDevelopments First Quarter Review 2012-13 26 is typically strong demand for currency inApril and May coinciding with the rabi marketing season. Also, as there was extreme volatility in the exchange rate, the Reserve Bank sold foreign exchange to authorised dealers in May and June. However, as a large part of the intervention was also in the forward/swap market, drain on rupee liquidity was not very significant. The liquidity stress from the above two autonomous factors was partly addressed by the net drawdown of balances by the government.As noted earlier, the large build-up in the government balance with the Reserve Bank in Q4 of 2011-12 had compounded the liquidity deficit in that quarter. As government spending increased significantly in the first quarter of 2012-13, there was concomitant easing of liquidity. The net effect of government spending during the quarter (June 30, 2012 over March 31, 2012) was release of `549 billion into the system. Reserve money expansion improves in Q1 of 2012-13 IV.10 There was a sharp deceleration in the pace of expansion of reserve money during Q4 of 2011-12. While this was predominantly on account of the CRR cuts, even adjusting for the first-round impact of CRR cut, the adjusted reserve money growth showed a deceleration. As seen earlier, active management of liquidity through OMO, LAF and MSF transactions led to a gradual rise in the rate of reserve money expansion in Q1 of 2012-13 as against the steady deceleration observed in the previous quarters (Chart IV.5). On the liabilities side of the Reserve Bank balance sheet, the growth is explained by the increased demand for currency. Deceleration in broad money growth arrested in Q1 of 2012-13 IV.11 Given the significant primary liquidity injection through OMO purchases and CRR cuts, there has been a pick-up in growth rates of monetary aggregates in 2012-13 so far as against the steady deceleration observed in the fourth quarter of 2011-12 (Chart IV.6). On a y-o-y basis, the growth rate as on July 13, 2012 was lower than the previous year. IV.12 There was a pick-up in demand for currency during the first quarter of 2012-13 as is usually observed in Q1. The y-o-y growth rate was lower than that of the previous year on account of the base effect (Chart IV.7). IV.13 The mobilisation of deposits during the first quarter of 2012-13 was higher than in comparable period of recent years. The y-o-y deposit growth of SCBs at 14.7 per cent on July 13, 2012 is below the indicative projection of 16 per cent for 2012-13 (Chart IV.8). The
  • 37.
    Monetary and LiquidityConditions 27 increase in deposit across the bank groups has, however, been skewed (Table IV.3). Monetary expansion improves with rise in money multiplier IV.14 With the CRR cuts effected in January 2012 and March 2012, there has been a reduction in the ratio of bankers’ deposits with the Reserve Bank to aggregate deposits in the banking system (the reserves deposit ratio). However, monetary expansion remained subdued during Q4 of 2011-12 as increase in money multiplier was not commensurate to the CRR cut as currency demand was high. The relatively higher pace of deposit mobilisation in 2012-13 so far has resulted in lowering both the behavioural ratios. Thus, with the rise in the Table IV.3: Aggregate Deposits of Scheduled Commercial Banks (Amount in ` billion) Bank Group Out- standing as on July 13, 2012 Y-o-y variation as on July 15, 2011 July 13, 2012 Amount Per cent Amount Per cent 1 2 3 4 5 6 1. Public Sector Banks* 46,453.6 6,458.6 18.9 5,897.2 14.5 of which: SBI and Associates 14,076.4 1,650.9 15.7 1,898.6 15.6 Nationalised Banks 32,377.1 4,807.8 20.4 3,998.6 14.1 2. Foreign Banks 2,697.6 114.7 5.0 276.8 11.4 3. Private Banks 11,294.3 1,485.1 18.2 1,645.6 17.1 4. All Scheduled Commercial Banks 62,217.5 8,259.0 18.0 7,991.3 14.7 Note: 1) Data as on July 13, 2012 are provisional. 2) * Excluding Regional Rural Banks.
  • 38.
    Macroeconomic and MonetaryDevelopments First Quarter Review 2012-13 28 money multiplier, there has been a gradual pick- up in money supply in 2012-13 so far (Chart IV.9). Credit growth in line with the indicative trajectory for 2012-13 IV.15 The y-o-y growth rate in non-food credit increased to 17.4 per cent in mid-July 2012 from 16.8 per cent at end-March 2012 (Chart IV.10). Hence, credit growth is in line with the indicative trajectory of 17 per cent for the year. Anecdotal evidence from bankers suggests that there may be some deceleration ahead. IV.16 Analysis of the sectoral deployment of credit (based on data from select banks which cover 95 per cent of total non-food credit extended by all SCBs) for Q1 of 2012-13 reveals that industries, services and personal loans accounted for 36.1 per cent, 28.6 per cent and 28.6 per cent, respectively, of the incremental credit flow during the quarter. Within industries, nearly two-thirds of the credit flow was to mining and quarrying, rubber, plastic and their products, beverage and tobacco, vehicle, vehicle parts and transport equipment and wood and wood products. Increase in the flow of resources to the commercial sector IV.17 There has been a 41 per cent increase in the total flow of financial resources to the commercial sector during 2012-13 so far, compared to the corresponding period of previous year (data on banks is available till July 13, 2012 while that for most non-bank sources is for up to June only). Unlike the previous year, banks as well as non-banks had a near equal contribution to funding in the economy during the period (Table IV.4). There was about two-fold increase in funding from non-bank domestic sources. The marked increase was on account of higher issuances of commercial papers (CPs), accommodation from all Indian financial institutions (AIFIs), net credit by housing finance companies and LIC’s net investment. Foreign sources of funding, however, declined compared to the corresponding period of the previous year. This is consistent with the slowdown in capital flows during the year so far. Monetary and liquidity conditions are not significantly impinging on growth IV.18 While there has been some rise in nominal and real interest rates during 2011-12, computation of real weighted average lending rates (WALR) suggest that they are currently much lower than the pre-crisis period of 2003-04 to 2007-08 when the investment boom took place. In nominal terms, the WALR averaged 12.4 per cent in the pre-crisis period,
  • 39.
    Monetary and LiquidityConditions 29 but fell to 10.5 per cent in 2009-10. After marginal hardening for two years, the nominal rate stood at 12.7 per cent for 2011-12. The real WALR calculated as nominal rate less WPI inflation fell from an average of 7.0 per cent in the pre-crisis period to 4.0 per cent in the post- crisis period, and was as low as 3.8 per cent in 2011-12 (Table IV.5). The fall is less sharp if GDP deflator is used to calculate inflation instead of WPI. IV.19 A negative relationship between real output growth and real interest rates does exist, and as such real interest rate matters for growth and investment. In spite of the rate hikes, real interest rates are lower than in the pre-crisis period. In this context, there is a need to look at non-monetary factors that are constraining growth as current monetary and liquidity Table IV.5: Real Lending Rate based on Weighted Average Lending Rate (WALR) Year (March-end) WALR Real Lending Rate calculated using WPI GDP-deflator 1 2 3 4 2003-08* 12.4 7.0 7.3 2008-09 11.5 3.4 3.0 2009-10 10.5 6.7 4.6 2010-11 11.4 1.8 3.0 2011-12^ 12.7 3.8 4.7 WALR: Weighted average nominal lending rate, estimated based on Basic Statistical Returns of Scheduled Commercial Banks. * Average of the years 2003-04, 2004-05, 2005-06, 2006-07 and 2007-08. ^ WALR for 2011-12 is based on data for 21,452 branches of 16 banks. Table IV.4: Flow of Financial Resources to the Commercial Sector (` billion) Item April-March April-July 13 2010-11 2011-12 2011-12 2012-13 1 2 3 4 5 A. Adjusted Non-food Bank Credit (NFC) 7,110.3 6,764.4 526.3 984.7 i) Non-Food Credit 6,815.0 6,525.2 601.5 911.3 of which: petroleum and fertiliser credit -243.2 171.4 41.8 -28.7 # ii) Non-SLR Investment by SCBs 295.3 239.2 -75.2 73.4 B. Flow from Non-banks (B1+B2) 5,341.1 5,745.8 846.3 944.8 B1. Domestic Sources 3,010.9 3,441.8 255.9 556.4 1. Public issues by non-financial entities 285.2 74.0 7.5 5.1 # 2. Gross private placements by non-financial entities 674.4 558.1 - - 3. Net issuance of CPs subscribed to by non-banks 67.9 100.2 234.3 355.0 # 4. Net credit by housing finance companies 427.9 530.1 19.8 68.5 $ 5. Total gross accommodation by the four RBI regulated AIFIs - NABARD, NHB, SIDBI & EXIM Bank 400.1 469.2 -66.8 37.6 # 6. Systemically important non-deposit taking NBFCs (net of bank credit) 794.7 1,290.8 P - - 7. LIC's gross investment in corporate debt, infrastructure and social sector 360.8 419.4 61.1 90.2 # B2. Foreign Sources 2,330.3 2,304.0 590.4 388.4 1. External Commercial Borrowings / FCCBs 555.0 421.0 136.0 102 # 2. ADR/GDR Issues excluding banks and financial institutions 92.5 27.0 12.4 2.4 # 3. Short-term credit from abroad 501.8 306.0 - - 4. FDI to India 1,181.0 1,550.0 442.0 284.0 $ C. Total Flow of Resources (A+B) 12,451.5 12,510.2 1,372.6 1,929.5 Memo Item: Net resource mobilisation by Mutual Funds through Debt (non-Gilt) Schemes -367.1 185.2 101.9  210.2  #  $: Up to May 2012. #: Up to June 2012. P: Provisional. -: Data not Available. conditions are not impinging upon growth significantly.
  • 40.
    Macroeconomic and MonetaryDevelopments First Quarter Review 2012-13 30 V. FINANCIAL MARKETS Global financial conditions deteriorated further during Q1 of 2012-13 as Greece and Spain came near flashpoint, requiring further bailouts to contain the contagion. The LIBOR-fixing case further demonstrated the fragilities in the banking and financial market space. Subdued global growth is increasing spillover risks, even as fresh rounds of austerity measures have been put in place to tackle the sovereign debt crisis. The financial markets in India also remained under pressure with increased volatility in the currency and equity markets, in line with the other emerging economies. The Reserve Bank undertook a slew of measures to boost capital flows and also to ensure adequate liquidity in the domestic money markets. Optimism for euro area recovery fades as uncertainties re-emerge V.1 Euro area difficulties increased sharply in Q1 of 2012-13, first as political parties in Greece failed to form a new government necessitating re-elections, and later with the deepening banking crisis in Spain. Prior to the re-elections in Greece, markets viewed Greece’s exit from the euro area as imminent. Even after the pro-euro coalition of parties came to power in the Greece re-elections, market uncertainty prevails on how long Greece may stay as part of the euro area.Aheightened Spanish banking problem has increased the risks to euro area financial stability. The risks associated with sovereign debt indicated by spreads of credit default swaps (CDS) has, in general, increased over end-March 2012 levels (Chart V.1 a, b). V.2 The subdued economic outlook and increased risk aversion drove investors to safe assets such as US and German sovereign bonds leading to lower yields. On the other hand, the G-sec yields of countries perceived as riskier rose significantly (Chart V.1 c). V.3 Increased funding pressures and regulatory requirements, compounded by the uncertainties in the euro area, have intensified deleveraging by European banks since H2 of 2011-12. The impact of deleveraging was also evident as international claims by European
  • 41.
    Financial Markets 31 banks inBRICS countries declined in the second half of 2011 (Chart V.1d). Going forward, the pace of deleveraging may slow down. However, the ongoing regulatory reforms and proposed implementation of Basel III recommendations in 2013 may lead to continued tightening of lending conditions. V.4 Since Q3 of 2011-12, the euro area economy has either contracted or remained stagnant. The difficulties in the euro area have triggered an austerity versus growth debate, reflecting the perception that austerity-focused policies have contributed to economic hardship while failing to eliminate the existential threat to the euro. Despite the two Long-Term Refinancing Operations (LTROs) conducted by the ECB that infused more than €1 trillion into the system, credit off-take has remained subdued. Much of the liquidity found its way back to the ECB’s overnight deposit facility, while the growth in private sector lending turned negative in May 2012 (Chart V.2). Policy Response to Slowing Growth and Sovereign Debt Concerns V.5 Significant headwinds from the euro area have compounded the global slowdown, prompting widespread growth-enabling policy measures towards the end of Q1 of 2012-13. Recent initiatives by the European Council to alleviate economic and financial pressures in the euro area include proposals to establish a single supervisory mechanism involving the ECB, the European Stability Mechanism (ESM) and plausible direct recapitalisation of banks. However, a robust long term solution is pending.This is highlighted by the return of stress in the financial markets following Moody’s decision to attach a negative outlook on theAaa sovereign rating of Germany, Netherlands and Luxembourg and the debt rollover difficulties being faced by Spain and Italy. Thereafter, the Spanish yields firmed up. Capital inflows into emerging markets decline as growth moderates V.6 Subdued growth in the advanced economies (AEs) and euro area concerns coupled with moderation in domestic growth conditioned the financial markets of emerging and developing economies (EDEs), with FII inflows turning negative for most EDEs (Chart V.3). However, following the slew of monetary easing measures in mostAEs towards the end of Q1 and early Q2 of 2012-13, the trend is expected to reverse moderately. Declining equity market trends as well as the depreciation of EDE currencies against the US dollar underscore the damp investor sentiments. Indian financial markets impacted by lower growth, decline in capital inflows and euro area uncertainty V.7 Lower growth, persistent inflation and concerns over fiscal and current account deficits, in addition to the global economic weakness and the re-emergence of the euro area crisis,
  • 42.
    Macroeconomic and MonetaryDevelopments First Quarter Review 2012-13 32 conditioned the Indian financial markets in Q1 of 2012-13. Money market rates declined during 2012-13 so far, reflecting improved liquidity conditions in the system and the 50 bps reduction in the repo rate announced in the Monetary Policy Statement 2012-13. The G-sec yields declined reflecting the lower growth expectations, global risk aversion driven flight to safe-haven government securities and purchase of securities through OMO. Funding strains kept deposit rates sticky, nevertheless, the base rate of banks showed a slight moderation. In line with other Asian countries, the Indian rupee depreciated, but by a higher magnitude on account of exacerbated concerns on current account and fiscal deficits. Equity markets declined led by a weak investment climate, muted domestic growth and FII outflows in Q1 of 2012-13. Call rate eased reflecting improved liquidity conditions V.8 With liquidity conditions remaining significantly tight in March 2012 on account of quarterly advance tax outflows and rise in currency in circulation, all segments of the money market witnessed an increase in rates. However, during Q1 of 2012-13, the liquidity conditions eased with the average daily LAF injection showing a declining trend (Table V.1). Supported by the cut in policy rate and improved liquidity conditions (partly due to the OMOs by the Reserve Bank), the call rate declined subsequently (Chart V.4). V.9 The rates in the collateralised segments moved in tandem with the call rate, but have generally remained below it during 2012-13 so far. Banks and primary dealers remain the major Table V.1: Average Daily Volume in Domestic Financial Markets (` billion) Money Market Bond Market Forex Market Inter-bank (US$ mn) Stock Market ## LAF Call Money Market Repo CBLO Commercial Paper* Certificates of Deposit* G-Sec** Corporate Bond # 1 2 3 4 5 6 7 8 9 10 11 Mar-12 -1574.3 175.1 111.8 379.8 911.9 4195.3 98.6 26.1 20.6 151.9 Apr-12 -1028.6 249.5 143.2 376.8 1310.0 4447.5 141.1 20.0 23.1 120.1 May-12 -985.5 184.5 151.3 339.1 1498.0 4394.1 151.8 17.5 20.9 117.3 Jun-12 -913.0 151.8 180.4 375.9 1258.1 4251.7 257.6 29.5 18.4 117.1 Jul-12(P) -476.5^ 149.9^ 172.1^ 411.6^ - - - 28.8@ - 112.8@ *: Outstanding position. **: Average daily outright trading volume in central government dated securities. #: Average daily trading in corporate bonds. ##: Average daily turnover in BSE and NSE. P: Provisional ^: Average daily data up to July 26, 2012. @ : Up to July 24, 2012. Note: In col. 2, (-) ve sign indicates injection of liquidity while (+) ve sign indicates absorption of liquidity.
  • 43.
    Financial Markets 33 groups ofborrowers in the collateralised segments, while mutual funds (MFs) continue as the major group of lenders. V.10 CD rates spiked during March 2012, reflecting overall tight liquidity conditions in the money markets and the reluctance of MFs to rollover bank CDs after asset management companies were made accountable for fair valuations on a mark-to-market basis. CP rates firmed up similarly. However, since then the weighted average effective interest rates (WAEIR) on CDs and the weighted average discount rate (WADR) of commercial paper (CP) declined, following improved liquidity conditions. G-sec yields declined, reflecting the domestic economic situation, declining crude oil prices V.11 Driven by expectations of a rate cut in theAnnual Policy of the Reserve Bank, and also by concerns of weakening industrial and export growth, G-sec yields softened at the beginning of Q1 of 2012-13. However, S&P’s revision of India’s long term rating outlook to negative led yields to temporarily firm up towards the end of April 2012. The declining trend in crude oil prices, general risk aversion and purchase of securities through OMO caused the yields to ease thereafter (Chart V.5). V.12 Yields continued to soften during the first half of June 2012 following the disappointing growth figure for Q4 of 2011-12 at 5.30 per cent. On the whole, in Q2 of 2012-13 so far, the yields exhibited a softening bias. According to SEBI data, FIIs made investments in debt worth `51.5 billion in 2012-13 so far (up to July 23, 2012). MFs also bought debt worth `1,535.5 billion during the same period. V.13 The markets remain cautious about the reduction in fiscal deficit. Gross market borrowings of the government through dated securities during 2012-13 were `2.3 trillion (net borrowings `1.6 trillion) up to July 23, 2012 compared with `1.6 trillion (net borrowings `1.1 trillion) during the corresponding period of the previous year (Table V.2). During 2012- 13 (up to July 23, 2012), 20 states raised `420 billion on a gross basis (net `370 billion) compared with `370 billion on a gross basis (net `303 billion) raised by 14 states during the Table V.2: Issuances of Central and State Government Dated Securities Item 2011-12 2012-13* 1 2 3 Central government Gross amount raised (` billion) 5,100.0 2,340.0 Devolvement on primary dealers (` billion) 121.1 12.0 Bid-cover ratio (range) 1.4-5.1 1.5-3.6 Weighted average maturity (years) 12.7 13.6 Weighted average yield (per cent) 8.5 8.5 State government Gross amount raised (` billion) 1,586.3 419.8 Cut-off yield range (per cent) 8.4-9.5 8.7-9.3 Weighted average yield (per cent) 8.8 9.0 *Up to July 23, 2012.
  • 44.
    Macroeconomic and MonetaryDevelopments First Quarter Review 2012-13 34 corresponding period of 2011-12. The weighted average yield firmed up to 9.0 per cent up to July 23, 2012 from 8.6 per cent for the same period in the previous year. Deposit rates of banks stay sticky, reflecting higher costs and inflation V.14 The modal deposit rates for scheduled commercial banks (SCBs) declined marginally by 2 bps to 7.40 per cent across all maturities during Q1 of 2012-13, while the modal base rate of SCBs declined by 25 bps to 10.50 per cent (Table V.3). Banks’ response on deposit rates remain rather muted so far, reflecting the interplay of factors such as tight liquidity conditions in Q1 of 2012-13 and high inflation. Rupee depreciated sharply amid concerns of widening current account and fiscal deficit and global uncertainty V.15 In Q4 of 2011-12, the Indian rupee reversed its falling streak exhibited during most of the year and recorded some gains. Owing to the interplay of a mix of domestic and global factors (see para III.6 page 19), the rupee started weakening from April 2012. Subsequently however, the rupee gained due to improved FII flows coupled with the lower trade deficit partly aided by policy initiatives. The distinct phases and primary drivers of the rupee movement over the course of the year have been mapped in Chart V.6. V.16 The depreciation of the exchange rate in Q1 of 2012-13 is not specific to India; most EDE currencies have also depreciated. However, the depreciation of Indian rupee is large reflecting growing current account deficit unlike other major Asian economies who have current account surpluses (Table V.4). Equity markets turned cautious on concerns about the investment climate V.17 The slow recovery in Q4 of 2011-12 reversed for most part of Q1 of 2012-13, on the Table V.3: Deposit and Lending Rates of Banks (Per cent) Items Mar-11 Jun-11 Sep-11 Dec-11 Mar-12 Jun-12 1 2 3 4 5 6 7 1. Domestic Deposit Rate (1 - 3 year tenor) i) Public Sector Banks 8.00-9.75 8.25-9.75 8.55-9.75 8.55-9.75 9.00-9.75 8.75-9.50 ii) Private Sector Banks 7.75-10.10 8.00-10.50 8.00-10.50 8.00-10.50 8.00-10.50 8.00-10.00 iii) Foreign Banks 3.50-9.10 3.50-10.00 3.50-9.75 3.50-9.75 3.50-9.75 3.50-9.75 Modal Deposit Rate (all tenors) 6.65 7.08 7.44 7.46 7.42 7.40 2. Base Rate i) Public Sector Banks 8.25-9.50 9.25-10.00 10.00-10.75 10.00-10.75 10.00-10.75 10.00-10.50 ii) Private Sector Banks 8.25-10.00 8.50-10.50 9.70-11.00 10.00-11.25 10.00-11.25 9.75-11.25 iii) Foreign Banks 6.25-9.50 6.25-9.50 6.25-10.75 6.25-10.75 7.38-11.85 7.38-11.85 Modal Base Rate 9.50 10.00 10.75 10.75 10.75 10.50 3. Median Lending Rate* i) Public Sector Banks 8.88-14.00 9.50-14.50 10.50-15.25 10.25-15.25 10.60-15.35 - ii) Private Sector Banks 9.00-14.50 9.25-15.00 9.00-15.25 10.00-15.50 10.50-15.50 - iii) Foreign Banks 7.70-14.05 7.70-14.50 9.13-14.75 9.50-14.38 10.00-14.50 - * : Median range of interest rate at which at least 60 per cent business has been contracted. - : Not available.
  • 45.
    Financial Markets 35 backdrop ofdeceleration in IIP growth, weak revenue outlook for major Indian IT companies and concerns over the implementation of retrospective tax and general anti-avoidance rules (GAAR). Euro area crisis, the downgrade of India’s long term rating outlook to negative from stable and the rupee slide also affected the market sentiment. However, the later part of June 2012 saw the market turnaround from low levels on account of a pick-up in FII investment in the equity market, clarifications by the government on retrospective tax, GAAR and the government decision to boost investments in infrastructure, and, on the global front, the European Council’s decision to support stressed euro area sovereigns and banks. SEBI data indicate that FIIs sold shares worth `9.8 billion in Q1 of 2012-13, while MFs sold shares worth `6.4 billion during the same period (Chart V.7). V.18 In Q2 of 2012-13 so far (up to July 23, 2012), the equity market recovered aided by FII investments (`78.7 billion), moderation in the depreciation of the rupee and the easy monetary policy pursued globally. The primary market remained subdued V.19 The low risk appetite of investors coupled with a weak secondary market and negative returns on IPOs led to low resource mobilisation Table V.4: Movements in Select EDE Currencies against the US Dollar Appreciation (+)/Depreciation (-) in per cent (y-o-y)  Currency 2010-11 2011-12 Apr-Jul 26, 2012 1 2 3 4 Current Account Deficit Countries 1. Brazil 9.7 -10.8 -10.1 2. India 1.1 -12.7 -8.6 3. Mexico 4.3 -7.0 -4.6 4. South Africa 8.0 -11.5 -7.5 5. Turkey -4.8 -10.5 -1.7 Current Account Surplus Countries 1. Argentina* -4.3 -7.5 -4.2 2. China 4.1 4.2 -0.7 3. Indonesia 4.7 -5.1 -3.3 4. Malaysia 8.2 -1.4 -3.2 5. Russia 3.4 -2.8 -10.1 6. South Korea 2.2 -2.7 -1.1 7. Thailand 6.7 -1.8 -2.6 *: Current account balance turned into deficit from 2011. Table V.5: Resource Mobilisation from Capital Market (` billion) Category 2011-12 2011-12 (Apr-Jun) 2012-13 (Apr-Jun) 1 2 3 4 A. Prospectus and Rights Issues* 129 70 5 1. Private Sector (a+b) 83 24 5 a) Financial 9 17 0 b) Non-financial 74 7 5 2. Public Sector 46 46 0 B. Euro Issues 27 12 2 C. Mutual Fund Mobilisation(net)@ -220 730 -4,995 1. Private Sector -154 644 -3,985 2. Public Sector # -66 86 -1,010 * Excluding offer for sale. @: Net of redemptions. #: Including UTI MF. Source: Mutual Fund data are sourced from SEBI and exclude funds mobilised under Fund of Funds Schemes.
  • 46.
    Macroeconomic and MonetaryDevelopments First Quarter Review 2012-13 36 in the primary segment in 2011-12. During 2012-13 so far (up to end-June 2012), the primary market continued to remain muted, with only `5 billion mobilised through six public issues (four IPO and two rights issues) (Table V.5). Housing prices increased in most cities despite lower volumes V.20 AccordingtotheReserveBank’squarterly House Price Index (HPI) during Q4 of 2011-12 housing prices in all cities, except Kolkata, showed an increase on a y-o-y basis. Compared to the previous quarter, housing prices show a moderation for Bengaluru, Lucknow and Chennai (Table V.6). The number of housing transactions on an annual basis shows mixed trends,withtheaverageall-IndiaIndexremaining almost unchanged. While Mumbai, Delhi, Ahmedabad and Bengaluru report a decline in transaction volumes on an annual basis, the quarterly decline in five out of nine cities has led to a decline in the all-India transaction volume index growth. Despite transaction volumes moderating in the later part of 2011-12, housing prices seem to have firmed up. Stressedfinancialconditionslikelytopersist V.21 Financial conditions are likely to remain uncertain in the near-term with the stress likely to persist for some time, given both global and domestic conditions. The recent LIBOR fixing controversy has also added to the uncertainty by drawing attention to how a few large global financial institutions allegedly manipulated one of the most commonly used market rates. The episode has also reduced market confidence in key benchmark rates. Cases of inattention to money laundering have also dented market confidence. These events add to the already existing pressures arising from euro area fragilities. V.22 On the domestic front, falling corporate earnings at a time when corporate positions are already leveraged, could keep equity markets under pressure. As such, there is a need to improve the investment climate to drive the economy out of its slowdown and improve market sentiments. While currency pressures have currently abated, uncertainty remains ahead with global risk aversion being high and the external sector weakening. Table V.6: House Price and Transactions Volume Indices (Base Q4:2008-09 = 100) Quarter Mumbai Delhi Bengaluru Ahmedabad Lucknow Kolkata Chennai* Jaipur Kanpur All India 1 2 3 4 5 6 7 8 9 10 11 House Price Index Q4: 2010-11 172.3 135.2 113.6 128.7 140.3 171.9 106.8 155.3 135.7 141.7 Q1:2011-12 191.6 152.8 116.9 152.3 149.3 157.0 106.3 161.1 135.4 152.0 Q2:2011-12 206.1 153.0 116.0 162.8 159.2 159.0 113.9 165.1 138.3 157.8 Q3:2011-12 191.7 168.6 146.1 171.8 172.3 155.0 120.3 163.5 140.0 164.1 Q4:2011-12 224.7 195.3 140.6 177.2 169.7 158.4 117.0 164.4 148.7 176.9 Growth in per cent Y-o-Y 30.4 44.4 23.7 37.7 21.0 -7.9 9.5 5.9 9.5 24.8 Q-o-Q 17.2 15.8 -3.8 3.1 -1.5 2.2 -2.7 0.5 6.2 7.8 House Transactions Volume Index Q4: 2010-11 111.9 151.5 102.2 153.8 108.4 91.1 81.6 218.7 156.2 126.3 Q1:2011-12 89.5 149.4 100.8 134.3 93.9 107.9 80.3 243.1 208.4 123.2 Q2:2011-12 79.0 165.5 123.5 154.1 106.7 139.2 85.5 239.1 131.1 129.1 Q3:2011-12 75.9 195.9 84.6 131.2 165.1 108.9 130.9 222.0 120.6 128.9 Q4:2011-12 108.6 149.8 70.8 122.2 153.0 128.5 99.0 247.5 172.1 126.5 Growth in per cent Y-o-Y -2.9 -1.1 -30.7 -20.5 41.1 41.1 21.3 13.2 10.2 0.2 Q-o-Q 43.1 -23.5 -16.3 -6.9 -7.3 18.0 -24.4 11.5 42.7 -1.9 Note: * Chennai index is based on both residential and commercial properties. All India index is a weighted average of city indices, weights based on population proportion.
  • 47.
    37 Price Situation Addedmonetaryeasingbymajoreconomies as fallinginflation provides space VI.1 Continuing uncertainty about how the sovereign debt crisis might play out along with newer indications of weakening growth, both in Advanced Economies (AEs) as well as Emerging and Developing Economies (EDEs) resulted in a decline in global commodity prices and moderation of global inflation. Demand pressures in theAEs are likely to remain muted for an extended period of time due to negative output gaps and subdued wages in the face of continued high unemployment in most economies. Inflation is also edging lower in mostEDEs,largelyhelpedbylowerinternational primary commodity prices, given the higher share of primary commodities in their overall consumption. However, the ultimate impact of falling commodity prices on the EDEs is also conditioned by the exchange rate movements of their currencies. Volatility in commodity prices and exchange rate movements are likely to impart greater volatility in inflation for EDEs as compared with AEs. VI.2 In view of the amplified risks to growth and weakening inflationary pressures, many central banks undertook further monetary policy easing, although most of them remained wary VI. PRICE SITUATION Headline inflation persisted above 7 per cent during Q1 of 2012-13 due to a rebound in food inflation as well as high fuel inflation even as non-food manufactured products inflation declined to below 5 per cent. The softening impact of growth moderation on inflation was partly offset by structural rigidities in the supply of food as well as the exchange rate depreciation. The benefits from the decline in global commodity prices were also partly offset by the falling rupee. The near-term inflation trajectory could remain sticky and conditioned by a number of risks that emanate from the unsatisfactory progress and distribution of the south-west monsoon, higher MSPs announced for kharif crops and the impact of the exchange rate pass-through. The path of inflation could also be impacted by the timing and magnitude of administered price revisions even though such adjustments have become necessary to reduce pressure on the medium-term inflation from expansionary fiscal policy. Continued pressure from wages and the structural nature of protein-food inflation could also keep inflation high even with moderation in overall growth. of additional quantitative easing. The US Fed decided to extend “Operation Twist” till December 2012. The European Central Bank in June 2012 broadened the collateral acceptable at its window and in July 2012 reduced its policy rate. However, the Bank of England decided to increase its quantitative easing asset purchase programme. The People’s Bank of China reduced the reserve requirements ratio in May 2012 and further cut its policy rate in June and July 2012. CPI inflation in all these countries has fallen and is currently below 3 per cent, thus providing monetary space to address growth risks (Table VI.1). Global commodity prices declined on amplified risks to global growth and improved supply prospects VI.3 International prices of most commodities weakened during Q1 of 2011-12 due to growing economic uncertainties and weakening growth (Chart VI.1). Though the benefit from lower global commodity prices to India was partly offset by the depreciation of the rupee, as in the case of many EDEs, overall it has had a softening impact on global inflation. Global crude oil prices moderated on sovereign debt fears and the continued rise in production and build-up of inventories. Brent crude prices
  • 48.
    Macroeconomic and MonetaryDevelopments First Quarter Review 2012-13 38 fell by about 25 per cent during Q1 of 2012-13. Compared with the average price of US$ 111.9 per barrel during 2011-12, the average Indian basket crude oil prices moderated to US$ 106.9 Table VI.1: Global Inflation Indicators Country/ Region Key Policy Rate Policy Rate (as on July 27, 2012) Changes in Policy Rates (basis points) CPI Inflation (y-o-y, Per cent) Sep. 2009 to Dec. 2011 Jan. 2012 to Jul. 2012 (as on 27th ) Jun-11 Jun-12  1 2 3 4 5 6 7 Advanced Economies Australia Cash Rate 3.50 (Jun. 6, 2012) 125 (-) 75 3.6# 1.2# Canada Overnight Rate 1.00 (Sep. 8, 2010) 75 0 3.1 1.5 Euro area Interest Rate on Main Refinancing Operations 0.75 (Jul. 6, 2012) 0 (-) 25 2.7 2.4 Israel Key Rate 2.25 (Jul. 1, 2012) 225 (-) 50 4.2 1.0 Japan Uncollateralised Overnight Call Rate 0.0 to 0.10* (Oct. 5, 2010) (-) 10 0 -0.4$ 0.2$ Korea Base Rate 3.00 (Jul. 12, 2012) 125 (-) 25 4.2 2.2 UK Official Bank Rate 0.50 (Mar. 5,2009) 0 0 4.2 2.4 US Federal Funds Rate 0.0 to 0.25* (Dec. 16,2008) 0 0 3.6 1.7 Emerging and Developing Economies  Brazil Selic Rate 8.00 (Jul. 7, 2012) 225 (-)300 6.7 4.9 China Benchmark 1-year Deposit Rate 3.00 (Jul. 6, 2012) 125 (-)50 6.4 2.2   Benchmark 1-year Lending Rate 6.00 (Jul. 6, 2012) 125 (-)56         (600) (-150)     India Repo Rate 8.00 (Apr. 17, 2012) 375 (-) 50 8.7$ 10.2$       (100) (-125)     Indonesia BI Rate 5.75 (Feb. 9, 2012) (-) 50 (-) 25 5.5 4.5 Philippines Reverse Repurchase Rate 3.75 (Jul. 26, 2012) 50 (-) 75 5.2 2.8   Repurchase Rate 5.75 (Jul. 26, 2012) 50 (-) 75     Russia Refinancing Rate 8.00 (Dec. 26 2011) (-) 275 0 9.4 4.3 South Africa Repo Rate 5.00 (Jul. 20, 2012) (-) 150 (-) 50 5.0 5.5 Thailand 1-day Repurchase Rate 3.00 (Jan. 25, 2012) 200 (-) 25 4.1 2.6  *: Change is worked out from the minimum point of target range. #: Q2 (April-June). $: May. Note: Figures in parentheses in column (3) indicate the effective dates when the policy rates were last revised. Figures in parentheses in columns (4), (5) and (6) indicate the variation in the cash reserve ratio during the period. For India, data on inflation pertain to CPI for Industrial Workers (CPI-IW). Source: Websites of respective central banks/statistical agencies.
  • 49.
    39 Price Situation per barrelduring Q1 of 2012-13. Prices declined to US$92 per barrel during the second fortnight of June 2012 before recovering to US$102.3 per barrel as on July 26, 2012. The recent increase has been both on account of aggravated geo-political tensions and monetary policy stimulus to revive growth by a number of central banks. VI.4 Metal prices declined on concerns about moderation in global demand with the focus on Europe and China. Global food prices also moderated in recent months as is evident from the decline of the Food and Agricultural Organisation (FAO) food price index by about 7 per cent during Q1 of 2012-13. However, drought in the US and unfavourable weather conditions in Europe and other major crop producing countries are likely to impact food production negatively during 2012-13, which could put upward pressure on global food prices. Moreover, global commodity prices could come under further pressure if demand in the EDEs recover or excess global liquidity spills over to the commodity markets. Inflation pressures persist in India despite weakening of growth momentum VI.5 Headline wholesale price index (WPI) inflation declined from a high of 10 per cent in September 2011 to 7.2 per cent in January 2012. During Q1 of 2012-13, the average headline inflation was at 7.4 per cent (7.3 per cent, provisional, for June 2012) (Chart VI.2). The current headline inflation, though lower than the average inflation of above 9 per cent during the past two years, is much higher than the decadal average of 5.4 per cent during the 2000s. The WPI increased on a sustained basis and the 3-month moving average seasonally adjusted month-over-month changes since January 2012 indicate sustained price pressures with some moderation in April-May 2012 (Chart VI.2 d). VI.6 In terms of contribution to overall inflation, the share of food picked up sharply from February 2012. However, the contribution of manufactured non-food products recorded a consistent decline which was largely on account of deceleration in growth momentum in Q4 of
  • 50.
    Macroeconomic and MonetaryDevelopments First Quarter Review 2012-13 40 2011-12. The contribution of the fuel group remained high (Chart VI.3). Food inflation persists at high levels VI.7 Food inflation increased significantly in recent months, driven largely by the increase in vegetable prices following the seasonal decline. Apart from vegetables, inflation was also high in pulses and edible oils in recent months.Advance estimates of production show shortfalls in the production of pulses as well as oilseeds during 2011-12. While cereals inflation remained moderate in the recent past (3.6 per cent on average during October 2010-March 2012), it increased to 6.4 per cent in Q1 of 2012-13 despite record foodgrains production in the previous year.Also, inflation in protein-rich items like milk, eggs, fish and meat continued to be in the double digits since August 2011, reflecting both structural demand-supply imbalances and input cost pressures (Chart VI.4). While the volatility in food inflation was largely on account of the seasonal movements in the prices of vegetables, the sustained increase in the prices of protein- rich items imparted a structural character to food inflation. Uncertainty over monsoon and high MSP could put further pressure on food inflation VI.8 There could be a further build-up of food inflationary pressures during 2012-13. The slow progress of the south-west monsoon so far and the uncertainty about its quantum as well as spatial and temporal distribution has emerged as a major risk to food inflation in the near-term. For the marketing year 2012-13, the government has announced increase in the minimum support price (MSP) for various crops in the range of 15 to 53 per cent. The commodities for which MSP has been raised have a combined weight of 3.4 per cent in overall WPI and the average increase (using WPI weights) work out to 25.6 per cent. The impact of MSP on market prices could vary across different commodities. However, the price pressures from the MSP continue to remain a major risk to inflation as the increases in MSP tend to translate into increases in market prices for most commodities.
  • 51.
    41 Price Situation High fuelinflation continued as rupee depreciation partly offset lower crude prices VI.9 Fuel inflation remained in double digits, reflecting the increase in international crude oil prices over the past two years. Though global crude oil prices have declined since March 2012, lagged pass-through of past increases has led to further increase in fuel prices. The Oil Marketing Companies (OMC) raised petrol prices by `7.5 per litre on May 24, 2012 and subsequently adjusted the prices in line with changes in international prices. Also, the OMCs decided to implement the revised structure of ‘state specific cost’ with effect from July 24/25, 2012 to adjust for irrecoverable state taxes. This has led to changes in prices of petrol, diesel, kerosene and LPG across different states. While prices increased in some states, it declined in some other states reflecting the state specific tax structure. Since March 2012, the extent of crude oil prices decline in dollar terms has been substantial enough to reduce the price in Indian rupee terms despite depreciation of the rupee (Table VI.2). However, administered prices have not been revised for more than a year and therefore, risks to fuel inflation continue to remain significant (Chart VI.5). VI.10 Currently, the estimated under-recovery by domestic OMCs for diesel is `9.95 per litre, for PDS kerosene `27.20 per litre and `319.00 per cylinder for domestic LPG. Not adjusting administered prices in line with trends in international prices will further expand under- recoveries, which will lead to considerable fiscal strain. Though price adjustments will exert inflationary pressures in the near term, the risk to medium-term price stability from a widening fiscal deficit will be addressed by adjustment of prices in line with market conditions VI.11 Coal prices were increased in January 2012, with non-coking coal prices being hiked by 32.7 per cent. Increase in coal prices could lead to significant input cost pressures, particularly for electricity generation. Electricity price increases in the recent period have been much less than the increase in input costs. Therefore, State Electricity Boards (SEBs) need to catch up by the large hikes in prices at which they sell electricity to Discoms. Revision in power tariffs could become inevitable under such a scenario, which would add pressure to fuel inflation. Table VI.2: Comparative Movement of Oil Price and Exchange Rate since July 2011   July 2011 March 2012 July 26, 2012 Change in per cent July, 2011 to March, 2012 Since March, 2012 1 2 3 4 5 6 Crude Oil Indian Basket (US$/barrel) 112.5 123.61 102.3 9.9 -17.2 Exchange Rate (`/US$) 44.4 50.3 56.0 11.7* 10.1* Crude Oil Indian Basket (`/barrel) 4995.8 6220.1 5724.8 24.5 -8.0 * Indicates the depreciation of the rupee against dollar. Note: The composition of Indian Basket of Crude Oil represents average of Oman & Dubai for sour grades and Brent (Dated) for sweet grade in the ratio of 67.6:32.4. Source: Petroleum Planning and Analysis Cell.
  • 52.
    Macroeconomic and MonetaryDevelopments First Quarter Review 2012-13 42 Inflation in non-food manufactured products muted by decline in growth VI.12 Manufactured non-food products inflation, an indicator of generalised inflationary pressures, moderated to below 5 per cent by March 2012 after two years. Since then, manufactured non-food products inflation remained subdued (4.8 per cent, provisional, June 2012), though price pressures are still visible in some manufactured commodities such as metals, fertilisers, pesticides and paints. Even though non-food manufactured products inflation declined in recent months, it still remains higher than the decadal average of 4.0 per cent during the 2000s. Also, core inflation in India in the recent period has been much higher than in AEs and EDEs. VI.13 The month-over-month seasonally adjusted annualised changes (3-month moving average) showed moderation of price pressures, notwithstanding a marginal pick-up in the latest month (Chart VI.6). Within non-food manufactured products, the ‘basic metals and metals products’group, which has a substantial weight (10.7 per cent) in overall WPI, continued to have double digit inflation. Domestic metal prices have largely been following the global trends and therefore, the inflation in this category remained high as exchange rate depreciation partly offset the impact of moderating global prices (Chart VI.7). Apart from the pressure from global price trends and exchange rate movements, domestic constraints on supplies of key inputs like minerals and coal could also be a source of pressure on prices. These trends also indicate that the supply-side pressures do translate to generalised inflation through the input cost channel. These partly explain the lower than expected pace of moderation in non-food manufactured products inflation in the wake of significant slowdown in growth. VI.14 Input cost pressures continued to remain persistent as seen from the HSBC Markit Purchasing Managers Index (PMI) which indicates that the pace of expansion of input costs was much higher than increases in output prices (Chart VI.8). In an environment of
  • 53.
    43 Price Situation significant declinein profit margins (see Chapter II for details) this could force manufacturers to pass on prices even when demand remains moderate. This is corroborated by the output price index in PMI picking up significantly in recent months. Wage pressures remain significant and may constrain the moderation in core inflation VI.15 The persistence of inflation can also partly be attributed to labour market conditions. The increase in wages in rural areas continued to be much sharper than compared to the comparable rate of inflation (Chart VI.9). The divergent pattern of this relationship between wage growth and inflation across major states also points out to region specific factors that influenced the wage-price dynamics (Chart VI.10). Similarly, in the formal sector, analysis of company finance data suggests that growth in staff costs, despite a moderate decline in the recent period, remained elevated (Chart VI.11). Rising real wages during the period of high inflation do protect the working population from the adverse impacts of inflation. However, rising real wages in excess of the productivity growth may not be sustainable in the medium-term and run the risk of a wage-price spiral. New CPIs exhibit higher inflation VI.16 Inflation as per the newly introduced Consumer Price Index (CPI) remained significantly higher than the WPI inflation (Table VI.3). There was also substantial divergence in inflation in certain product groups such as condiments and spices and vegetables. Notably, the divergence in the new CPI and the WPI inflation after excluding the volatile items (food and fuel) continued to be high. A comparison of similar items under the WPI and the new CPI indicate that there is divergence even among common product group inflation (Chart VI.12). This divergence between the new CPI inflation and the headline WPI inflation has
  • 54.
    Macroeconomic and MonetaryDevelopments First Quarter Review 2012-13 44 raised concerns about the extent of the transmission of recent moderation in headline inflation to the consumers. VI.17 The difference in weighting pattern and coverage could also explain the divergence between inflation based on the CPI and the WPI. While food has a relatively larger weight in the new CPI, the WPI has more weight for manufactured products with items like metals and chemicals that do not enter the CPI directly. The new CPI includes housing and many services which are not covered under WPI. Comparable data for a relatively longer period of time is necessary to make a realistic assessment of the divergence between the new CPI and existing inflation measures. The new comprehensive CPI does not have adequate history to support data analysis and to be used as the sole headline measure of inflation. Risks to inflation remain even as growth slowdown eases demand pressures VI.18 Even though inflation declined during the latter part of 2011-12, the persistence of inflation in recent months above the 7 per cent mark points to the sticky nature of inflation, even as growth has slowed. Inflation in the non-food manufactured products category came down to below 5 per cent, partly reflecting the demand moderating impact of past monetary tightening and weakening of pricing power. However, high food inflation, especially in protein-rich items, and persistent fuel inflation kept headline inflation high. The near-term inflation outlook is conditioned on the spatial and temporal distribution of the south-west monsoon, the impact of exchange rate pass-through and likely trends in global commodity prices. While moderation in global commodity prices could ease the pressure from imported inflation, pass-through of rupee depreciation will partly offset the impact. The increases in MSP and sustained increases in wage levels could further exert pressure on overall inflation. The administered prices of fuel do not reflect the trends in global market prices and revision of these would be necessary to reduce the extent of suppressed inflation. The persistence of inflation in an environment of slowing growth is a major challenge for monetary policy. Table VI.3: WPI and New-CPI (Combined) Inflation   Food Fuel Excluding Food and Fuel Overall WPI New CPI WPI New CPI WPI New CPI WPI New CPI 1 2 3 4 5 6 7 8 9 Weight 24.3 47.6 14.9 9.5 60.8 42.9 100 100 Jan-12 1.5 3.9 17.0 13.0 7.5 10.6 7.2 7.5 Feb-12 5.9 6.7 15.1 12.8 6.3 10.4 7.6 8.8 Mar-12 8.7 8.1 12.8 11.8 5.8 10.2 7.7 9.4 Apr-12 9.3 10.1 12.1 11.2 5.4 10.2 7.5 10.3 May-12 9.0 10.5 11.5 10.7 5.7 10.1 7.5 10.4 June-12 9.0 10.8 10.3 10.3 5.6 9.1 7.3 10.0
  • 55.
    Macroeconomic Outlook 45 VII. MACROECONOMICOUTLOOK The outlook for the Indian economy remains weak. In an uncertain global economic environment, the interplay between growth slowdown, high inflation, wide current account, fiscal gaps and falling investment has weakened the economy. Surveys of business expectations confirm that confidence levels are low. On the other hand, inflation expectations remain sticky. The economy has reached a critical point, at which economic activity can spin up or down depending on how the policy uncertainty is addressed and supporting measures put in place. Leading indicators, especially credit growth and PMIs, suggest that a recovery is still possible with appropriate policy action. Growth prospects for 2012-13 stay weak VII.1 The Indian economy slowed significantly during 2011-12, with growth decelerating to 6.5 per cent. The growth prospects for 2012-13 remain weak due to a combination of global and domestic macro-economic factors. Global growth is turning weaker than anticipated. Along with the sovereign debt overhang and financial market uncertainties, it is impacting global trade. VII.2 The IMF in its July update of the World Economic Outlook has made significant downward revisions in its current year growth estimates for India, UK, Brazil and China. As fiscal adjustments take shape in advanced economies (AEs), shrinking deficits could keep AEs growth slow for an extended period. This could result in a significant drag on growth in India. VII.3 Recent indications suggest that global trade flows have ebbed again after some pick-up in Q4 of 2011-12. This trend could persist because of tight credit conditions, the adverse impact of deleveraging on trade finance and, moreimportantly,growthslowdowninemerging and developing economies (EDEs), including China. If global trade loses steam, it can have ramifications for recovery in India. VII.4 Growth in India has decelerated faster than envisaged. Some slowdown was inevitable as growth sacrifice was needed to combat the high inflation of the past two years. However, the lack of a quick policy response to address structuralbottlenecksandencourageinvestment, has exacerbated the slowdown. In view of the growth moderation, the Reserve Bank in its Monetary Policy Statement 2012-13 on April 17, 2012 frontloaded the policy rate reduction with a repo rate cut of 50 basis points on the premise that the process of fiscal consolidation critical for inflation management, would get under way along with other supply-side initiatives. However, the absence of movement on fiscal correction, along with other persistent risks to inflation during 2012-13, limit the space for monetary easing and the Reserve Bank decided to hold the policy rate in its Mid Quarter Policy Review on June 18, 2012. VII.5 On the domestic front, the macro- economic and structural factors that are impeding growth still remain to be addressed. At the current juncture, some uncertainty is arising from the temporal and spatial deficiency in the monsoon. Despite the recent revival, cumulative rainfall up to July 27, 2012 was 21 per cent deficient. The Reserve Bank’s production weighted rainfall index (PRN) showed a 39 per cent drop from the normal during June 2012. However, there has been some improvement since then and the PRN deficiency is now 24 per cent. The impact of the monsoon will emerge more clearly in the coming weeks.
  • 56.
    Macroeconomic and MonetaryDevelopments First Quarter Review 2012-13 46 VII.6 Monsoon risks to overall growth could turn out to be limited due to the declining share of rainfed agriculture with improved irrigation, as also the small share of total agriculture output in GDP. However, from a welfare standpoint, the impact may be significant because it affects the poor through inflation as well as income. This also has fiscal implications through drought relief, MGNREGA and other government welfare schemes. VII.7 The slowdown in industrial activity continues. Mining activity remains at a near standstill in the face of a lack of adequate regulatory environment to support good business. Manufacturing activity also remains sluggish in the face of a rise in input costs and slack domestic demand. High inflation has impacted consumption, at a time when investment activity is already weak, making the immediate revival of growth difficult. Subdued global demand amid weakening consumer confidence has weighed down on services growth, which may continue to experience some spillover from the slow industrial growth. While construction growth remains subdued, the ‘trade, hotels, transport and communications’ segment has also slowed down. VII.8 Taking into account the increased risks, the growth outlook in 2012-13 may turn out to be lower than anticipated. However, a recovery, even if modest, still appears possible if appropriate policy correctives are quickly put in place. Credit expansion in Q1 of 2012-13 has picked-up and PMIs for manufacturing and services remain in expansion mode. This suggests that while growth has decelerated, a sharp dip can still be averted. Inflation risks remain significant VII.9 Headline inflation has moderated from near double-digit levels and remained in the range of 7-8 per cent for the past seven months. The extent of moderation, in spite of the negative output gap, has been constrained by a number of off-setting factors such as rupee depreciation and sustained pressures from input costs and wages. Typically, episodes of high inflation have been marked by inflation persisting for 2-3 years and have required sustained efforts to lower inflation expectations and inflation. VII.10 The near-term outlook on inflation continues to be marked by a number of upside risks, despite the significant slowdown in growth. Both persistent headline WPI inflation and retail inflation, even as the core inflation remains moderate, indicate continued supply- side pressures on overall inflation. These are unlikely to be mitigated in the near term. The progress of the monsoon so far has been unsatisfactory. Some price pressures could emerge in coarse cereals, pulses and edible oils. The short-term trajectory of food inflation could shift upwards impacted by the adverse monsoon, large increases in the Minimum Support Prices (MSP) and structural pressures on protein inflation that can further be reinforced if feed costs increase due to poor rainfall. The impact of the rupee depreciation against the US dollar will limit the favourable impact from a fall in globalcrudeoilandmetalprices.Thesuppressed inflation of the past is likely to show up in electricity, coal and fuels during 2012-13. On the whole, in spite of core inflation pressures moderating and some deceleration in wage inflation, upside risks to inflation projections for 2012-13 remain significant. Business expectations indices suggest subdued business confidence VII.11 Various surveys portray weakening optimism about business prospects. The NCAER Business Confidence Index, which registered an improvement in business environment duringApril 2012, slid back during July 2012. Private sector firms appear apprehensive about the investment climate and their financial positions, even though capacity utilisation levels remain relatively high.
  • 57.
    Macroeconomic Outlook 47 VII.12 Thelatest Dun & Bradstreet Business Optimism Index for July–September 2012, conducted in June 2012 amid renewed domestic and global economic pressures, indicates increased pessimism, with a q-o-q decline in volume of sales, net profits, new orders, inventory and employee levels. Weak demand conditions are observed across sectors, especially in the intermediate and capital goods sectors. The demand for finished goods also shows a significant moderation, pointing to a further slowdown in capital expenditure by firms. VII.13 The CII business confidence index, however, registered moderate recovery, with almost three-fourth of the respondents expecting a 7 or higher per cent growth in 2012-13, with the primary concern being stagnancy in reforms. The survey indicates optimism about overall sales, new orders and pre-tax profits in Q1 of 2012-13, as results indicate a corresponding rise in the last quarter as well. VII.14 Across surveys, higher input costs seem to be the major deterrent to business confidence (Table VII.1). The seasonally adjusted HSBC Markit Purchasing Managers’ Indices (PMI) for both manufacturing and services (June 2012) suggest improved business conditions and rising output. Despite the increasing input costs, higher employment levels and rising output prices point to some optimism about growth revival. Business expectations remain positive. Industrial Outlook Survey points to moderation in both demand and financial conditions VII.15 The Reserve Bank’s 58th round of the Industrial Outlook Survey (http://www.rbi.org. in/IOS58), conducted during Q1 of 2012-13 with a sample of 1,404 manufacturing companies, showed a deterioration in business sentiments both in the assessment quarter Q1 and the expectations quarter Q2 of 2012-13. VII.16 The Business Expectation Index (BEI), a composite indicator based on several business parameters, shows moderation for assessment (Q1 of 2012-13) as well as expectation (Q2 of 2012-13) quarters (Chart VII.1). The fall in assessment index has been much sharper than the expectation index, indicating that the perceived plateauing was not realised. However, these indices remained in the positive growth zone (i.e., above 100, which is the threshold separating contraction from expansion). Table VII.1: Business Expectations Surveys Period Index NCAER- Business Confidence Index July 2012 FICCI Overall Business Confidence Index Q2:2011-12 Dun & Bradstreet Business Optimism Index Q3: 2012 CII Business Confidence Index Q1: 2012-13 1 2 3 4 5 Current level of the Index 126.6 51.5 136.1 55.0 Index as per previous survey 134.9 51.6 150.0 52.9 Index levels one year back 145.2 76.2 143.6 62.5 % change (q-on-q) sequential -6.2 -0.2 -9.2 4.0 % change (y-on-y) -12.8 -32.3 -5.2 -12.0
  • 58.
    Macroeconomic and MonetaryDevelopments First Quarter Review 2012-13 48 VII.17 Net response of major demand side parameters, viz., production, order books, capacity utilisation, exports and imports for Q1of 2012-13, remained positive, albeit, lower when compared on a y-o-y as well as a q-o-q basis.Theoutlookresponseshowssimilarresults. VII.18 The results also point to lower optimism in the overall financial situation through H1 of 2012-13. The net response for availability of finance was positive, although marginally lower than the previous quarter. ‘Cost of external finance’ is perceived to rise further, but by a lower percentage of respondents. The majority still expect the cost of raw material to rise further in Q2 of 2012-13. While a higher percentage of respondents (on a net basis) assessed that the profit margin declined over the last quarter, the outlook for Q2 of 2012-13 remains more or less balanced (Table VII.2). Consumer Confidence Survey indicates static future expectations VII.19 The Reserve Bank’s 9th round of the Consumer Confidence Survey (http://www.rbi. Table VII.2: Reserve Bank’s Industrial Outlook Survey Parameter Optimistic Response Net Response* 2011 2012 Jul-Sep Oct-Dec Jan-Mar Apr-Jun Jul-Sep E A E A E A E A E 1 2 3 4 5 6 7 8 9 10 11 1. Overall Business Situation Better 39.8 18.7 35.2 17.7 33.6 26.5 34.9 18.3 30.6 2. Overall Financial Situation Better 30.6 11.7 26.3 11.2 25.2 18.5 27.7 14.2 23.6 3. Availability of Finance Improve 24.2 12.1 20.2 10.4 19.0 15.8 22.9 15.0 20.4 4. Cost of External Finance Decrease -39.7 -50.2 -41.0 -50.6 -38.8 -37.4 -22.7 -30.5 -24.0 5. Production Increase 40.6 22.6 39.9 25.3 40.4 33.1 34.7 20.3 33.6 6. Order Books Increase 35.9 20.3 33.4 18.4 31.3 24.8 29.5 16.9 29.9 7. Capacity Utilisation Increase 25.0 9.9 22.2 10.8 24.3 16.7 19.9 8.6 18.4 8. Cost of Raw Material Decrease -51.7 -58.1 -49.7 -61.2 -50.1 -59.4 -49.0 -63.1 -51.4 9. Employment in the Company Increase 19.4 15.6 16.5 11.3 13.6 12.9 14.6 10.0 12.3 10. Exports Increase 25.8 13.1 22.1 11.5 18.6 14.2 20.7 10.8 20.5 11. Imports Increase 19.0 15.7 16.9 11.6 15.5 14.4 15.7 11.6 15.5 12. Selling Price Increase 18.3 10.7 16.0 8.9 14.7 13.5 19.0 17.5 18.8 13. Profit Margin Increase 2.5 -17.1 -1.6 -17.3 -2.9 -11.3 -1.2 -17.9 -3.6 * Net response is measured as the percentage share differential between the companies reporting optimistic (positive) and pessimistic (negative) responses; responses indicating status quo (no change) are not reckoned. Higher ‘net response’ indicates higher level of optimism and vice versa. E: Expectation. A: Assessment. org.in/CCS9), conducted in June 2012, indicates that although the majority of respondents perceive current household circumstances to have improved, there has been a rise in the proportion of respondents reporting otherwise. This led to a fall in consumer confidence for the current period. However, the future expectations of households remained almost constant at the level observed in the last round (Chart VII.2).
  • 59.
    Macroeconomic Outlook 49 External agenciessee moderation in growth ahead VII.20 The revised GDP growth estimate for 2011-12 at 6.5 per cent came in sharply lower than the conservative estimates by external agencies (7.0-7.6 per cent). Stuttering global growth coupled with domestic concerns on multiplefronts,viz.,weakIIPgrowthmomentum, persistent inflation, and high fiscal and current account deficits, without much being done on the reform front, have led to further downward revisions in the growth outlook for 2012-13 by 0.2-0.8 percentage points. At this juncture, however, the consensus forecasts on growth seem to be placed lower than the 7.3 per cent projected by the Reserve Bank in its Monetary Policy Statement 2012-13 (Table VII.3). Table VII.3: Agencies’ Projections for 2012-13 Agency Latest Projection Earlier Projection GDP Growth (Per cent) Month GDP Growth (Per cent) Month 1 2 3 4 5 Economic Advisory Council to the PM 7.6 Feb-12 - - Finance Ministry 7.6 (+/0.25) Feb-12 - - IMF* (calendar year) 6.1 July-12 6.9 Apr-12 World Bank 6.9 Jun-12 7.5 Mar-12 OECD* 7.3 May-12 7.5 Nov-11 ADB 6.5 Jul-12 7.0 Apr-12 NCAER 7.3 Apr-12 - - * GDP at market rates. Survey of professional forecasters1 VII.21 The results of the 20th round of the ‘Survey of Professional Forecasters’ (http:// www.rbi.org.in/SPF20) conducted by the 1 The forecasts reflect the views of professional forecasters and not of the Reserve Bank. Table VII.4: Median Forecasts of Select Macroeconomic Indicators by Professional Forecasters 2012-13 and 2013-14 Actual 2011-12 Annual Forecast Quarterly Forecast 2012-13 2013-14 2012-13 2013-14 Q1 Q2 Q3 Q4 Q1 E L E L E L E L E L E L E L 1 2 3 4 5 6 7 8 9 10 11 12 13 14 15 16 1. Real GDP growth rate at factor cost (in per cent) 6.5# 7.2 6.5 - 7.0 6.6 5.5 7.1 6.3 7.4 6.6 7.5 7.0 - 7.1 a. Agriculture & Allied Activities 2.8# 3.0 3.0 - 3.0 3.0 2.7 3.2 3.0 3.1 2.7 3.0 2.9 - 2.8 b. Industry 2.6# 6.0 4.0 - 5.7 4.6 1.5 5.5 3.7 6.3 5.0 6.2 5.5 - 6.0 c. Services 8.5# 8.8 8.0 - 8.6 8.4 7.5 8.5 7.8 8.8 8.1 8.6 8.4 - 8.4 2. Gross Domestic Saving (per cent of GDP at current market price) - 32.8 31.3 - 32.2 - - - - - - - - - - 3. Average WPI-Inflation 8.9 6.9 7.3 - 6.8 6.6 7.4& 6.9 7.6 6.7 7.4 6.7 7.2 - 6.5 4. Exchange Rate (INR/1USD end period) 51.2 48.3 53.0 - 51.0 49.5 56.3& 48.8 55.0 48.0 54.5 47.8 53.0 - 52.5 5. T-Bill 91 days Yield (per cent-end period) 8.7 7.9 8.0 - 7.5 - - - - - - - - - - 6. 10-year Govt. Securities Yield (per cent-end period) 8.6 8.2 8.1 - 7.8 - - - - - - - - - - 7. Export (growth rate in per cent)@ 23.7* 13.2 12.0 - 17.0 - - - - - - - - - - 8. Import (growth rate in per cent)@ 31.1* 15.0 8.3 - 14.3 - - - - - - - - - - 9. Trade Balance (US$ billion) -189.8* - - - - -50.2 -46.0 -47.7 -45.5 -44.8 -46.2 -48.0 -47.3 - -45.6 E: Previous Round Projection. L: Latest Round Projection. #: Revised Estimate. *: Preliminary. - : Not Available. &: Actual. @: US$ on BoP basis. Note : The latest round refers to Twentieth round for the quarter ended June 2012, while previous round refers to Nineteenth round for the quarter ended March 2012. Source : Survey of Professional Forecasters, First Quarter 2012-13.
  • 60.
    Macroeconomic and MonetaryDevelopments First Quarter Review 2012-13 50 Reserve Bank shows a downward revision in the median growth forecast for 2012-13 to 6.5 per cent. The industry and service sector median growth forecasts have turned low, but are expected to pick-up beginning Q2 of 2012-13. The average inflation outlook has been revised upward to 7.3 per cent for 2012-13 and moderation is expected from Q3 of 2012-13 onwards (Table VII.4). Inflation expectations stay sticky VII.22 The Inflation Expectations Survey of Households (IESH) (http://www.rbi.org.in/ IESH28), conducted among 4,000 households across 12 cities and 7 occupational categories in June 2012, indicates that the median inflation perception for the current quarter (i.e., April- June 2012) as well as the median inflation expectations going forward remained at the same level. However, the mean perception and expectation of inflation moved up marginally compared with the previous round. The percentage of respondents expecting higher inflation in next quarter/year has also increased compared with the last round. Inflation and macro risks to condition growth-enabling policy actions VII.23 Domestic growth declined to its lowest in 29 quarters during Q4 of 2011-12. Early indications for Q1 of 2012-13 suggest that growth is likely to remain subdued. While growth risks are significant, policy choices have been complicated as inflation remains above the comfort level. Further, inflation risks have increased and continue to constitute significant risk to growth sustainability, thus making it imperative to not allow monetary conditions to aggravate these risks. Also, the wide CAD and high fiscal deficit continue to limit the monetary space and pose major challenges for macroeconomic policy. Though adjustments in the exchange rate could contribute to bridging the current account deficit, excessive volatility, particularly the risks of a downward spiral in the rupee, needs monitoring. Going forward, improved liquidity and monetary conditions suggest the possibility of a slow recovery in industrial growth. VII.24 Additional rounds of accommodative monetary policy across the globe, if sustained through 2012-13, can reverse the trend of falling commodity prices at some stage. Global food inflation is also likely in the face of widespread drought in US and elsewhere. Besides, monsoon shortfall also weigh heavily on the inflation outlook in India. Rising input costs have fed into output prices, though further pass-through may be limited. On the other hand, corporates are likely to raise prices to protect themselves against margin pressures in sectors where competitive structures are not in place and mark-ups can be protected. VII.25 The economy is now at a critical juncture where revival can be supported by restoring confidence through policy actions to encourage investment. Removing constraints on FDI and improving the investment climate by moving quickly to address bottlenecks in infrastructure space are important. Also, speeding up fiscal consolidation by putting in place an investment stimulus through large capital spending by the government but offsetting it by curtailing revenue spending by revamping the subsidy schemes could go a long way in reviving growth. Reviving infrastructure investment while addressing increased risks to lending to this sector is critical in this context. VII.26 In short, decisive policy action backed by credible commitment to a long-term strategy for correcting macroeconomic imbalances and stimulating investment is crucial at this stage to revive confidence as well as provide space for monetary policy to help sustain growth while keeping inflation under control.