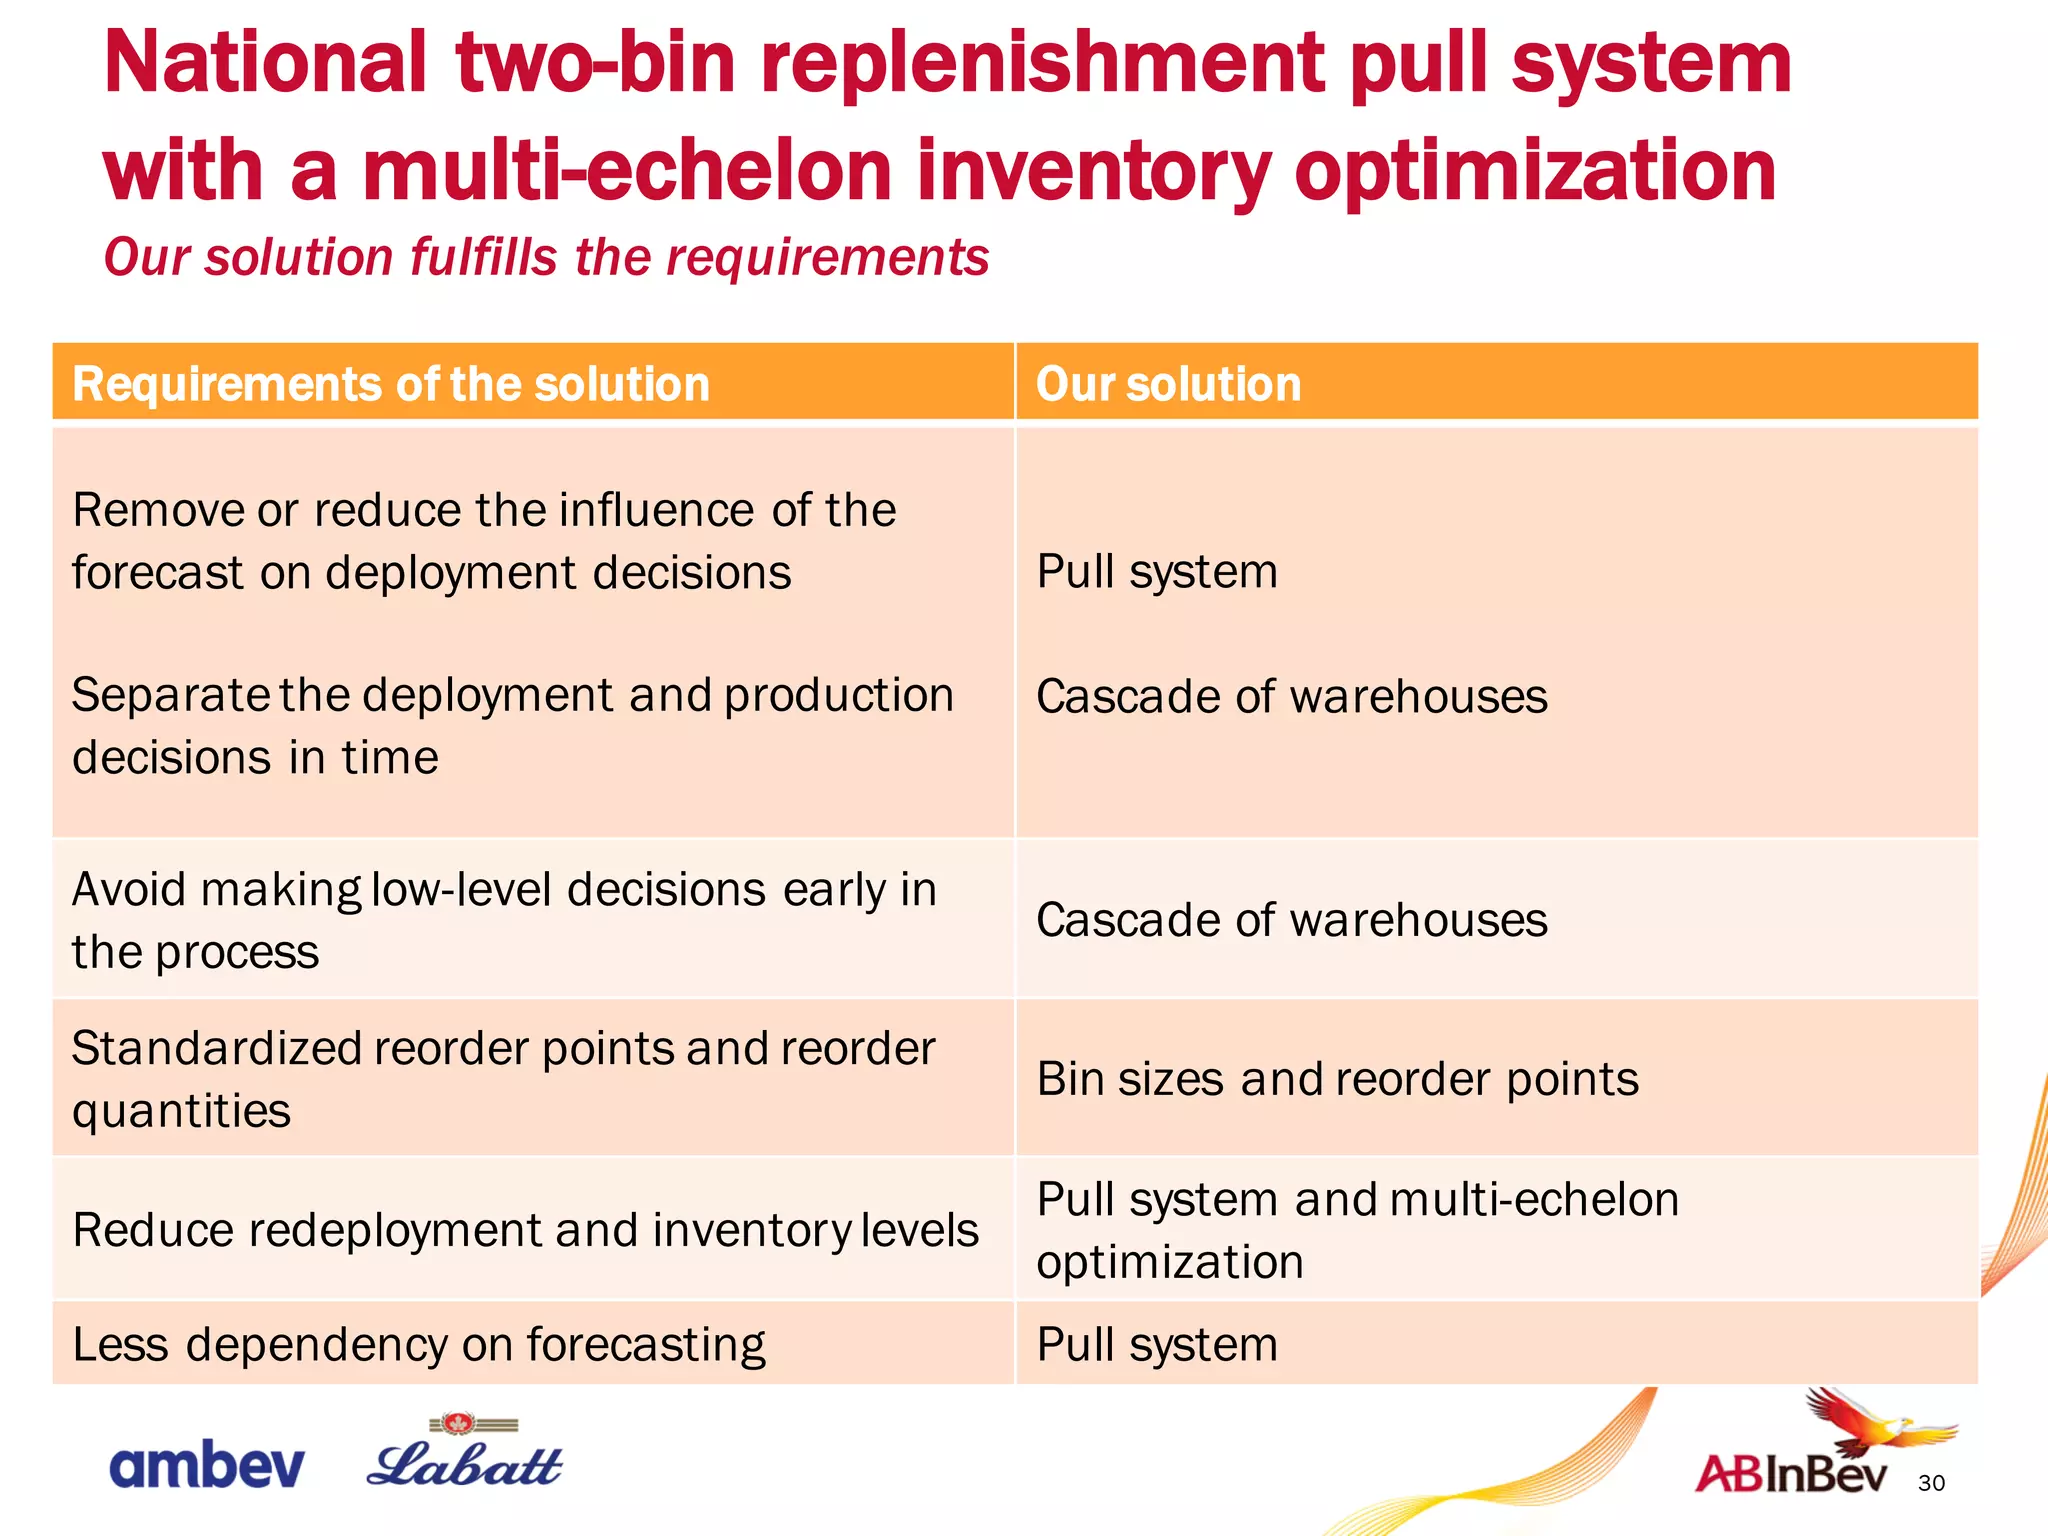
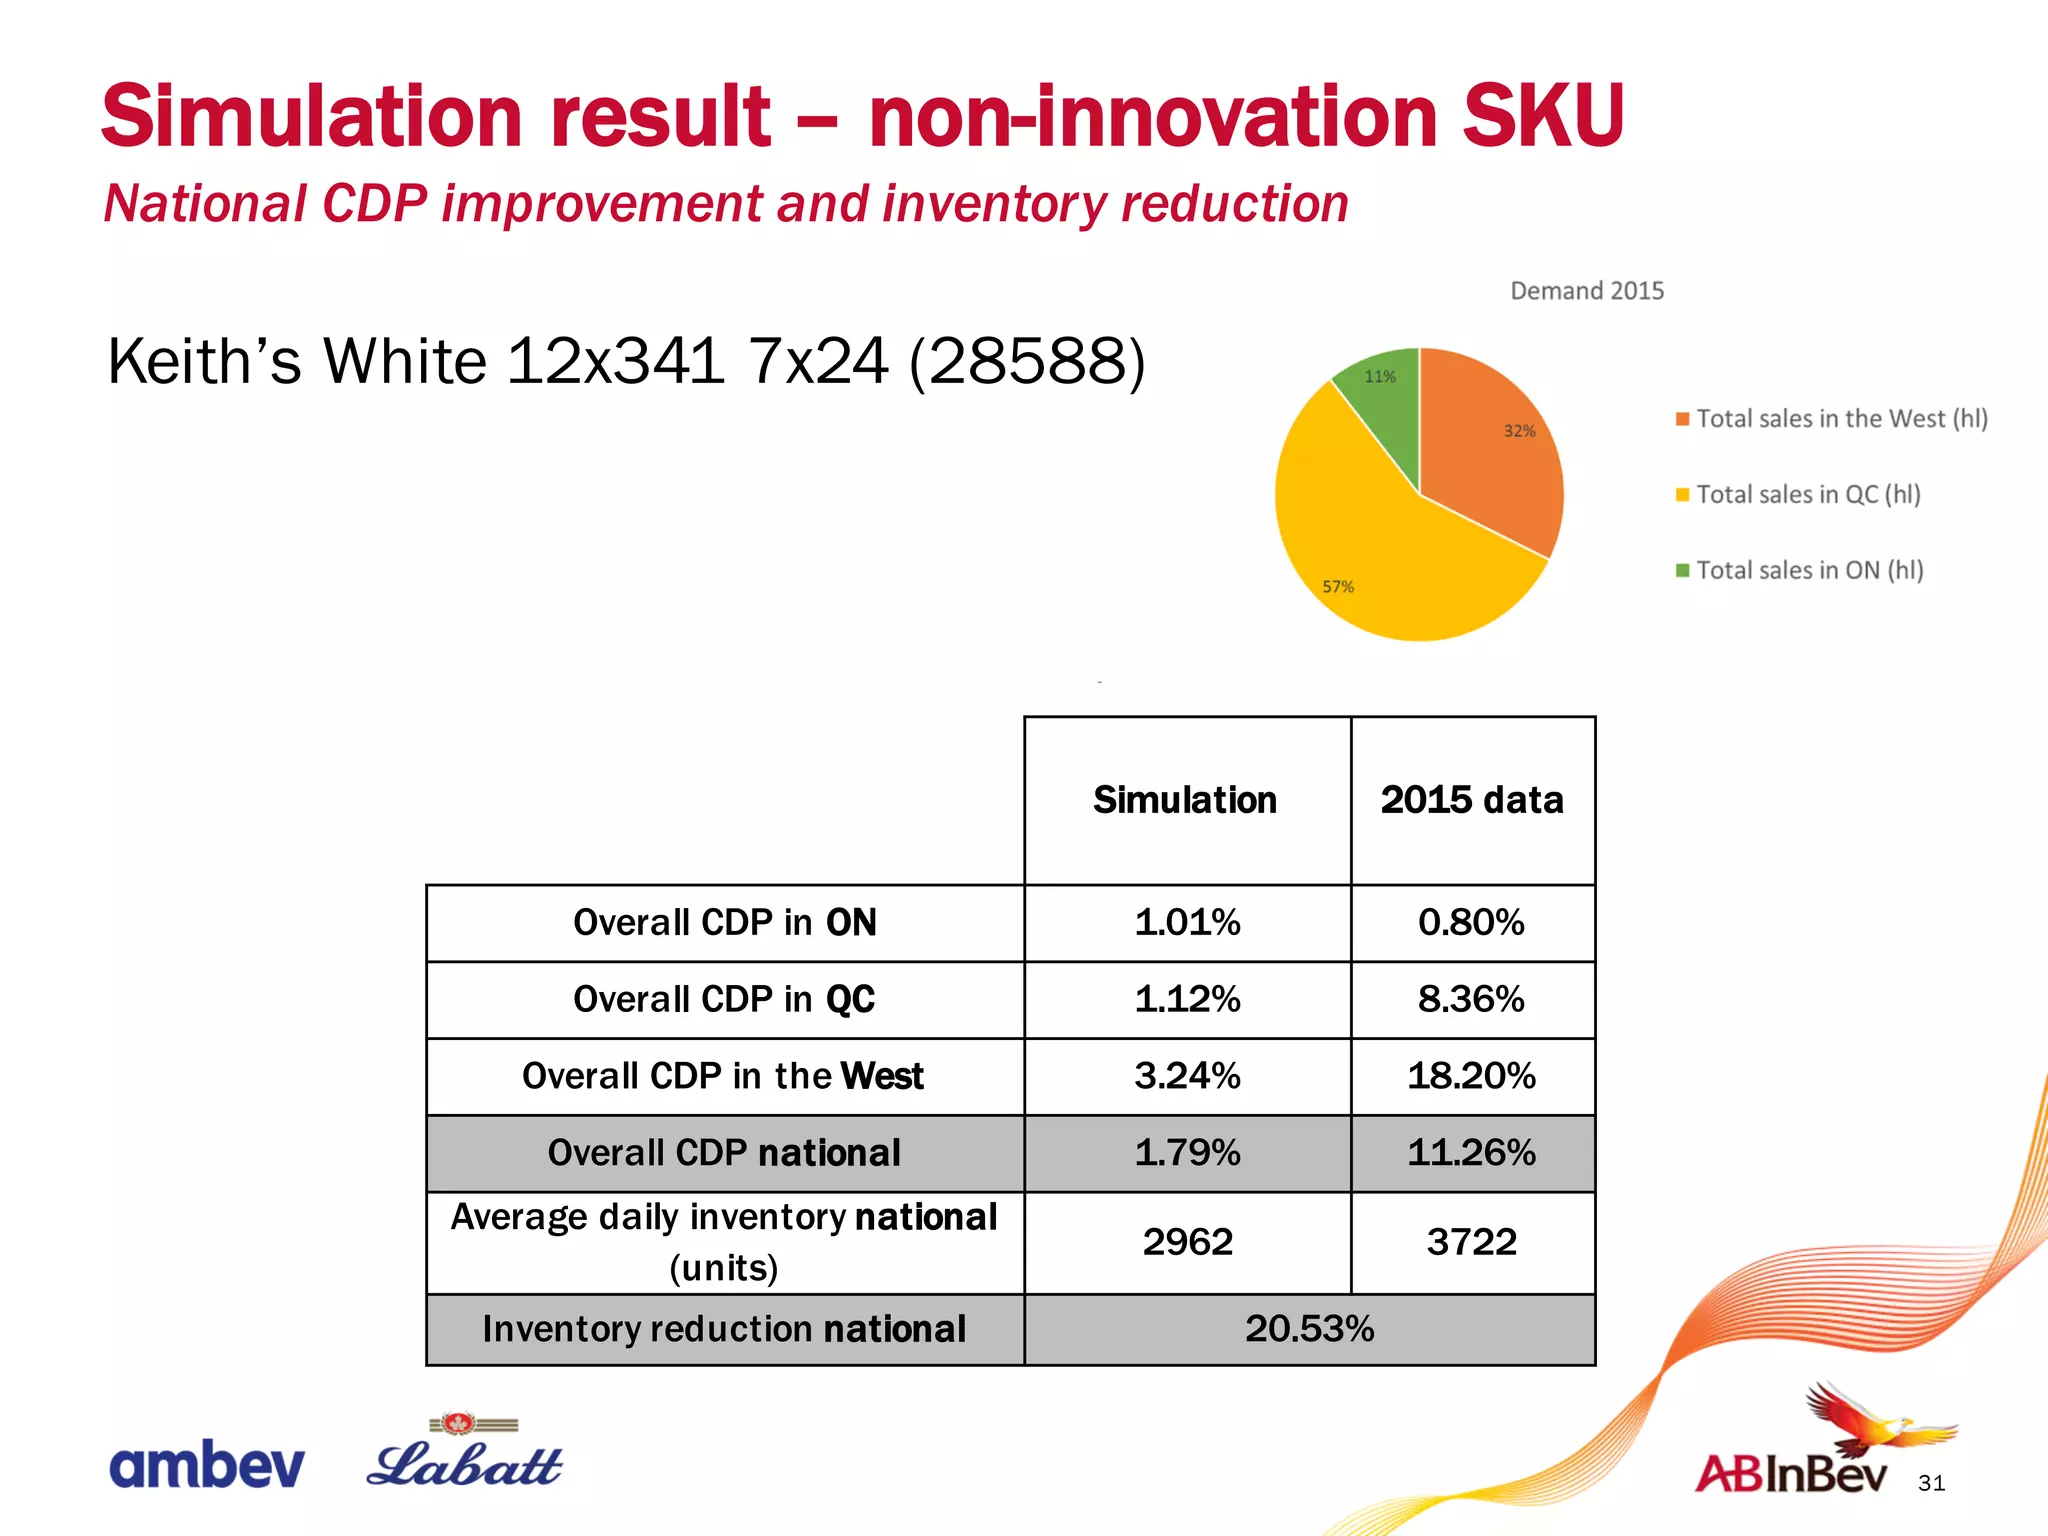
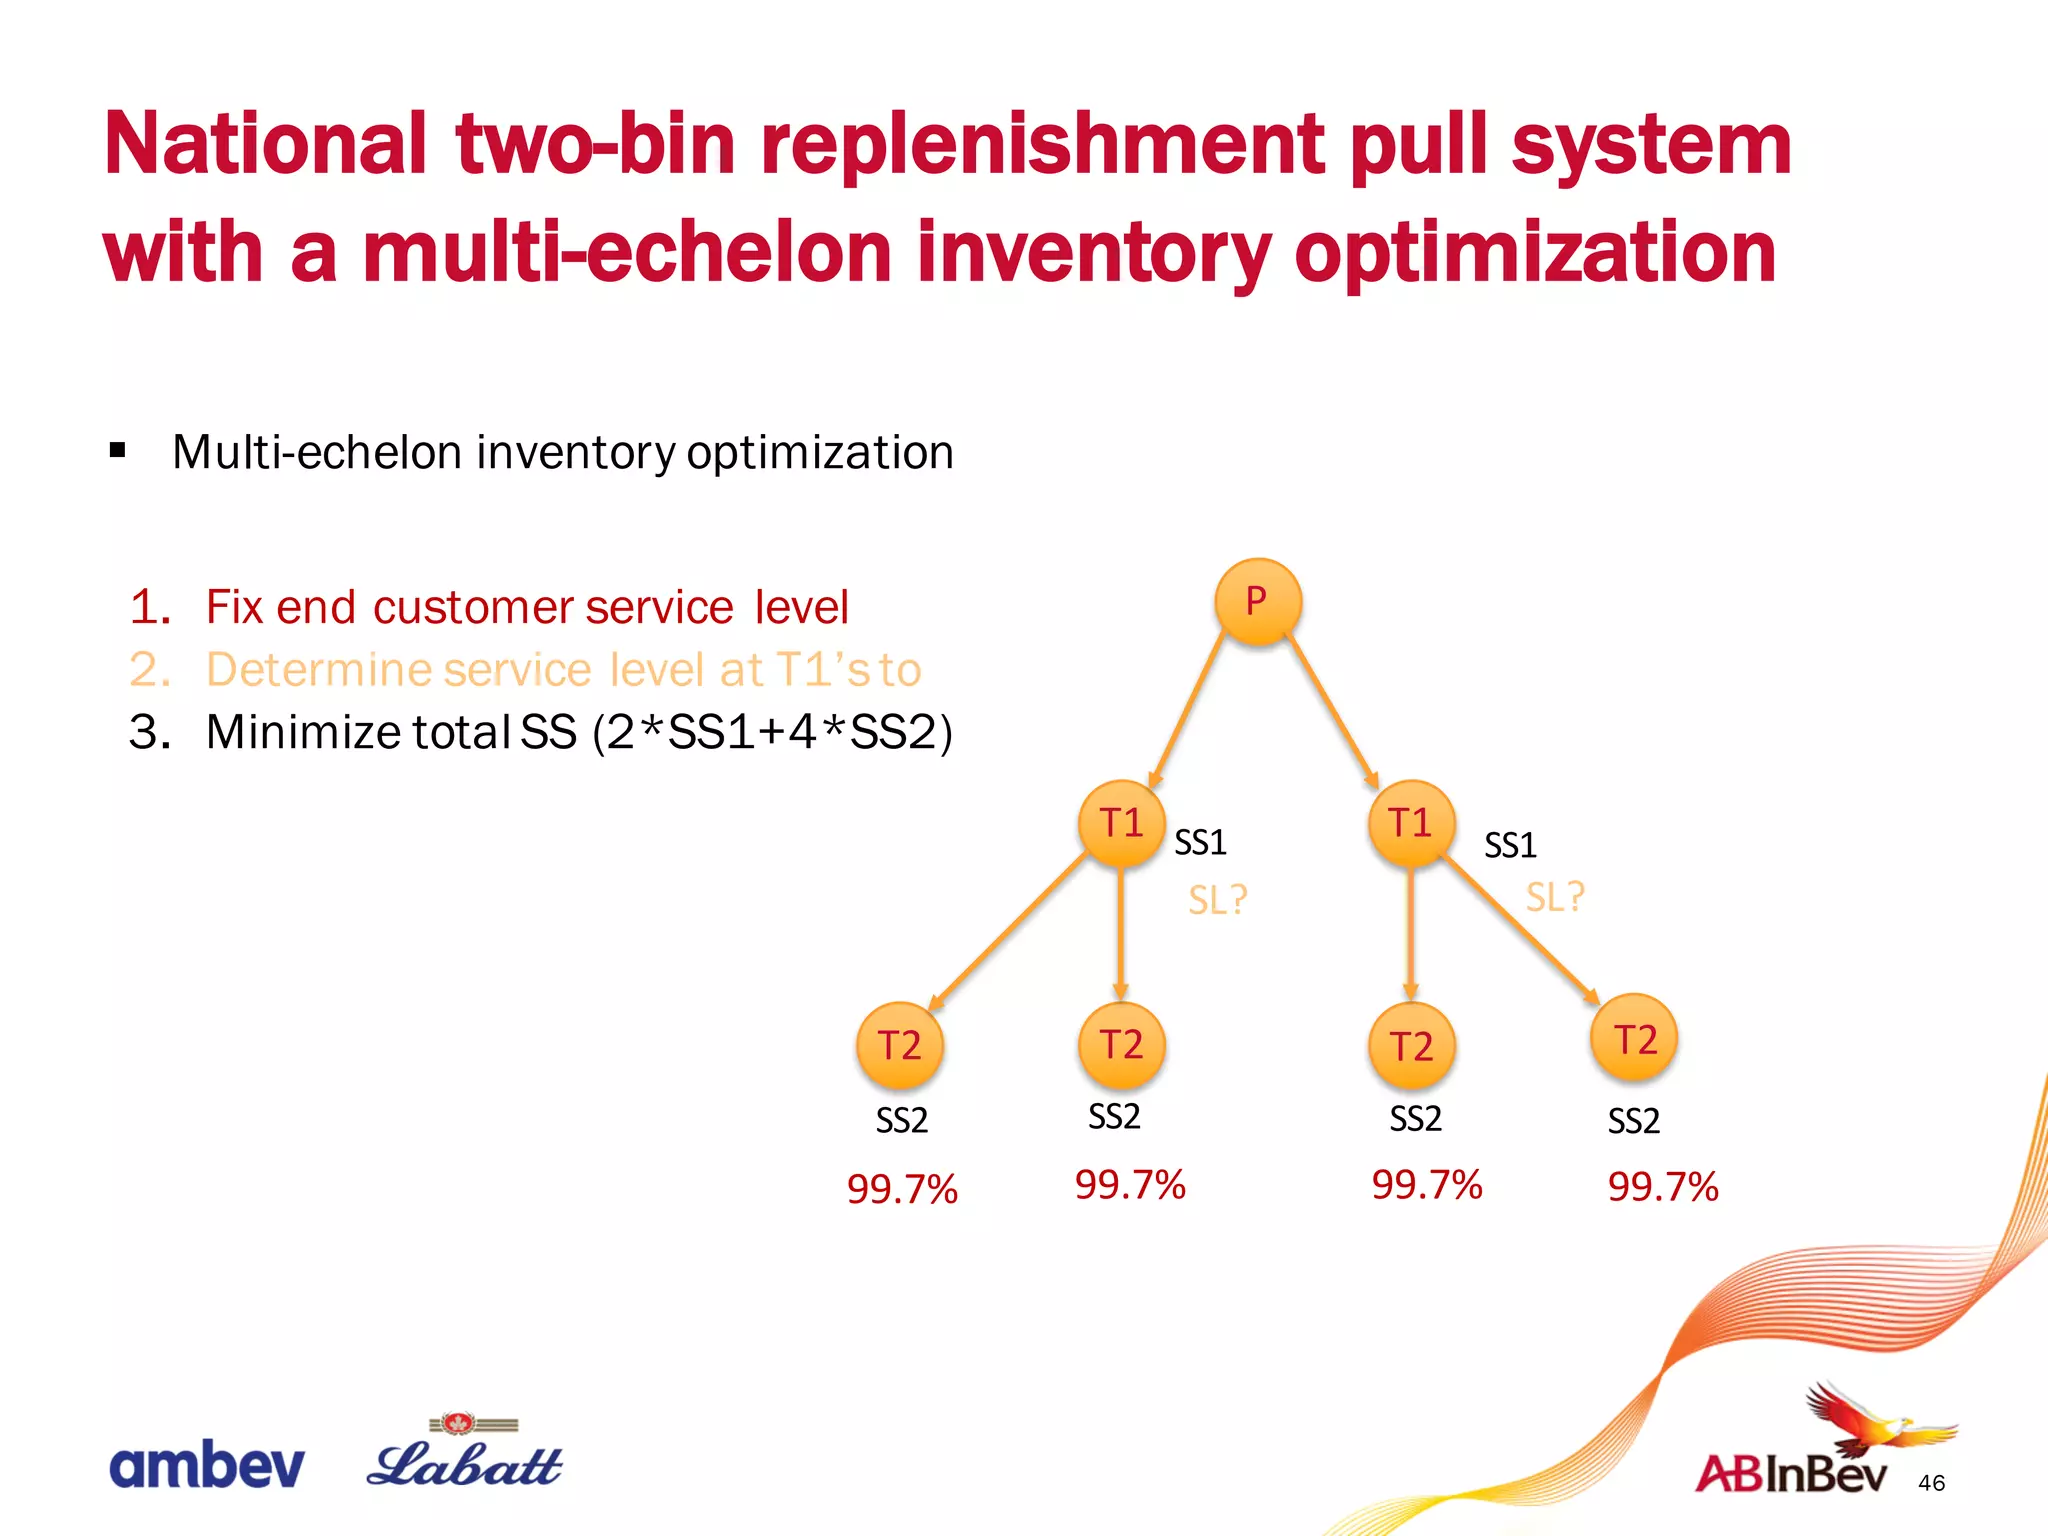
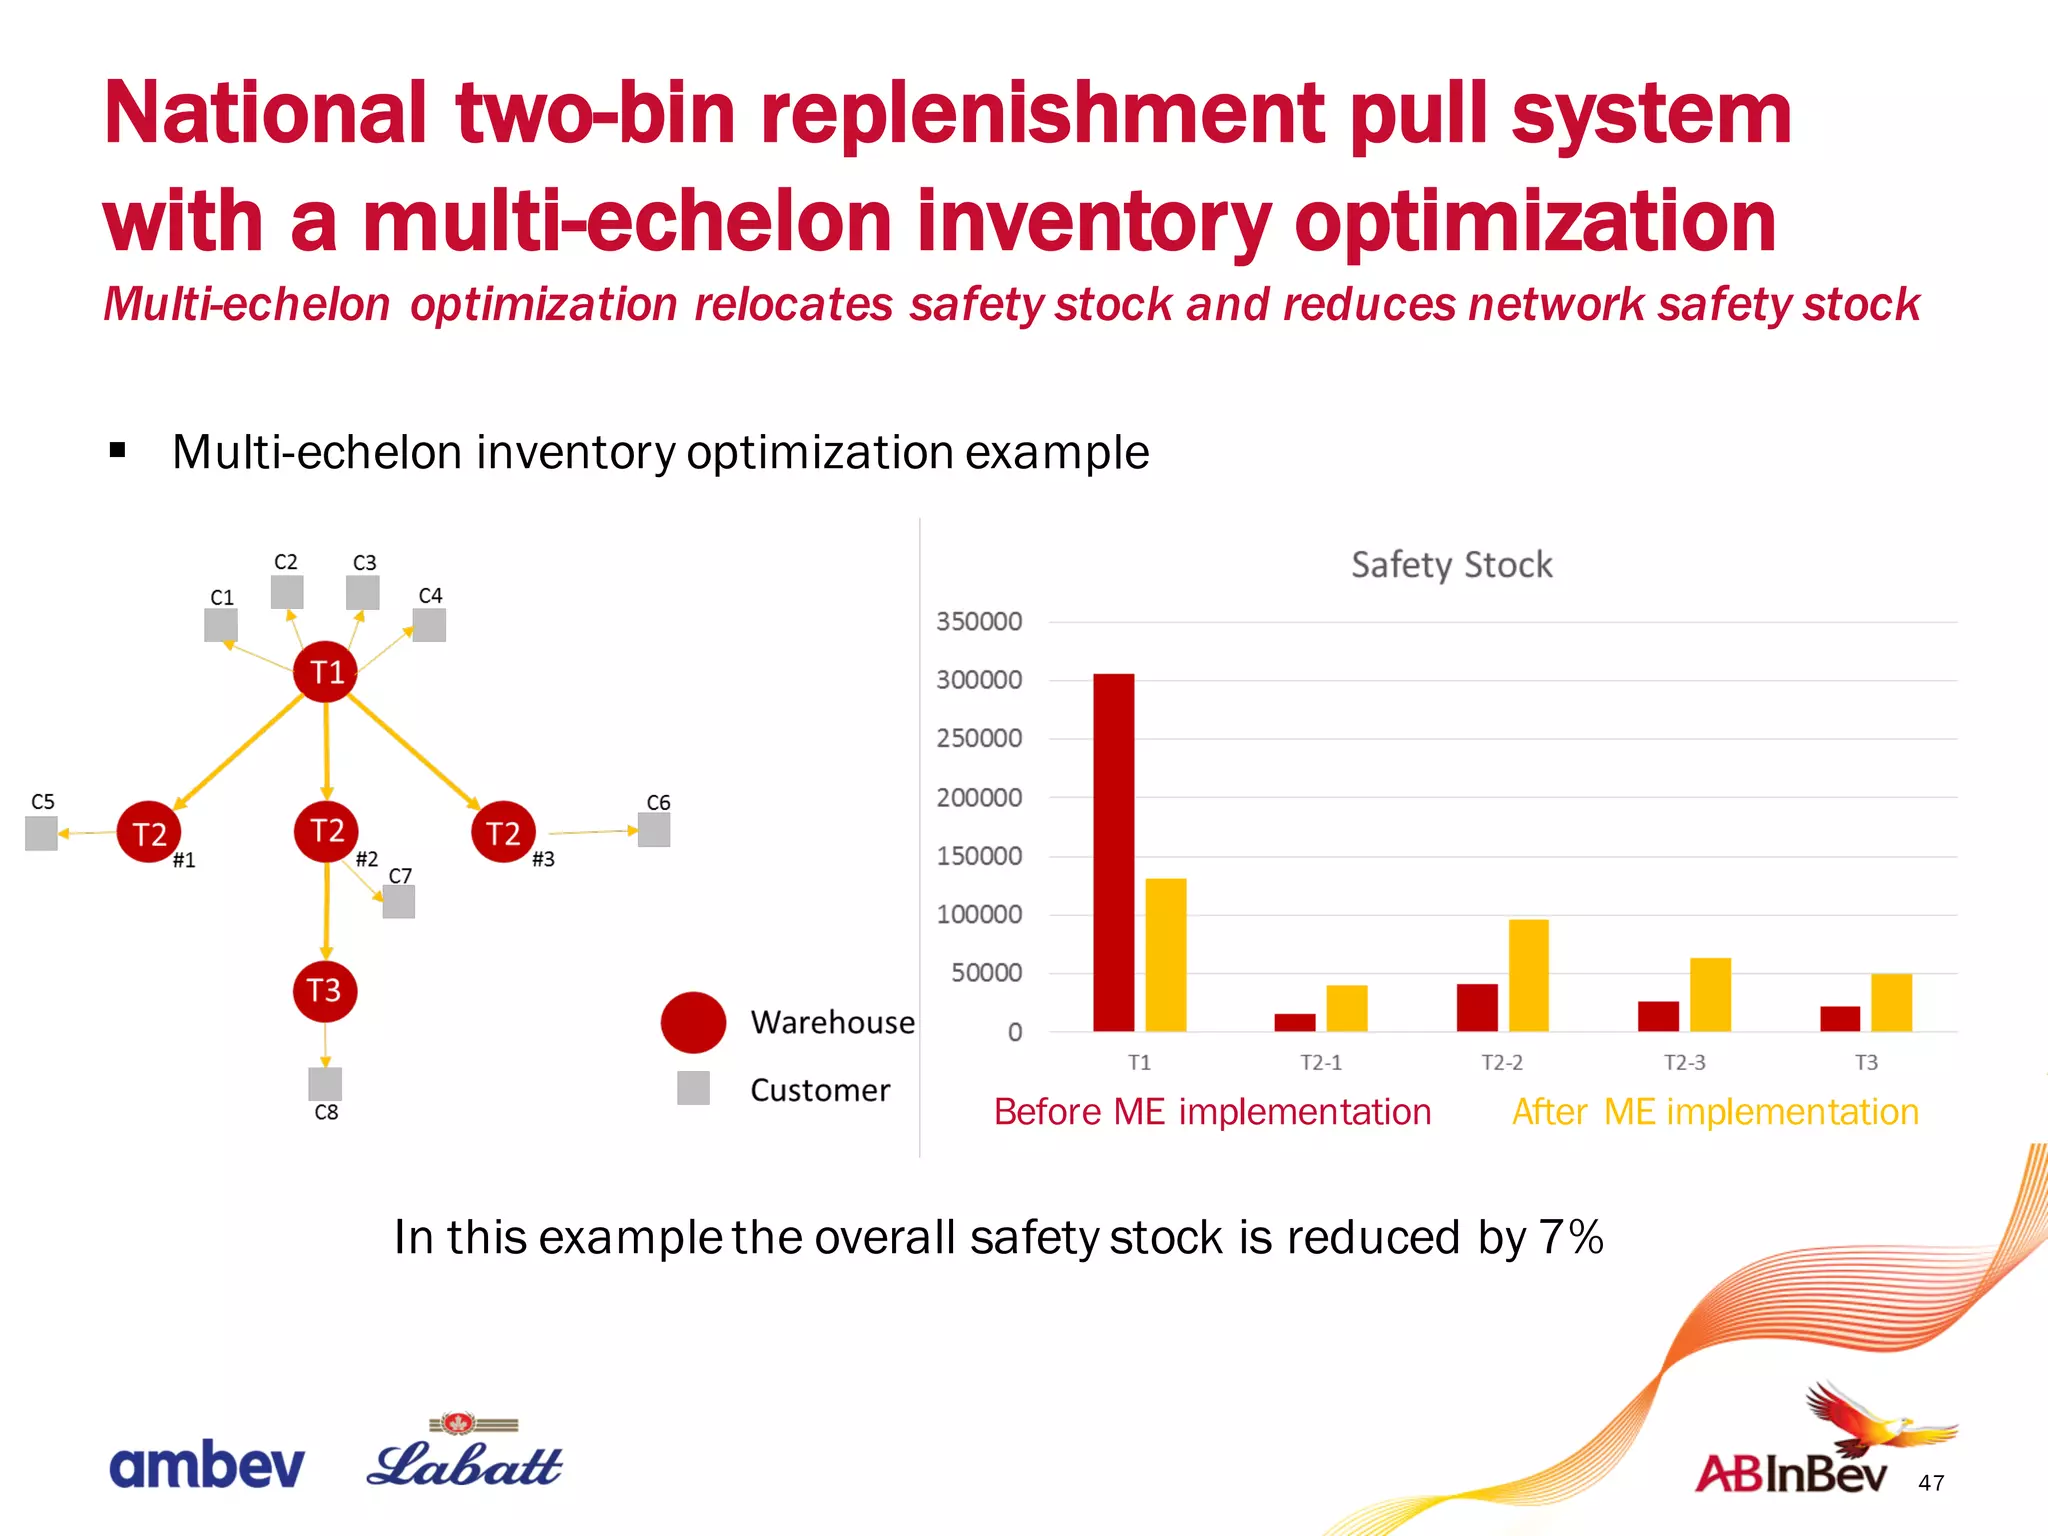
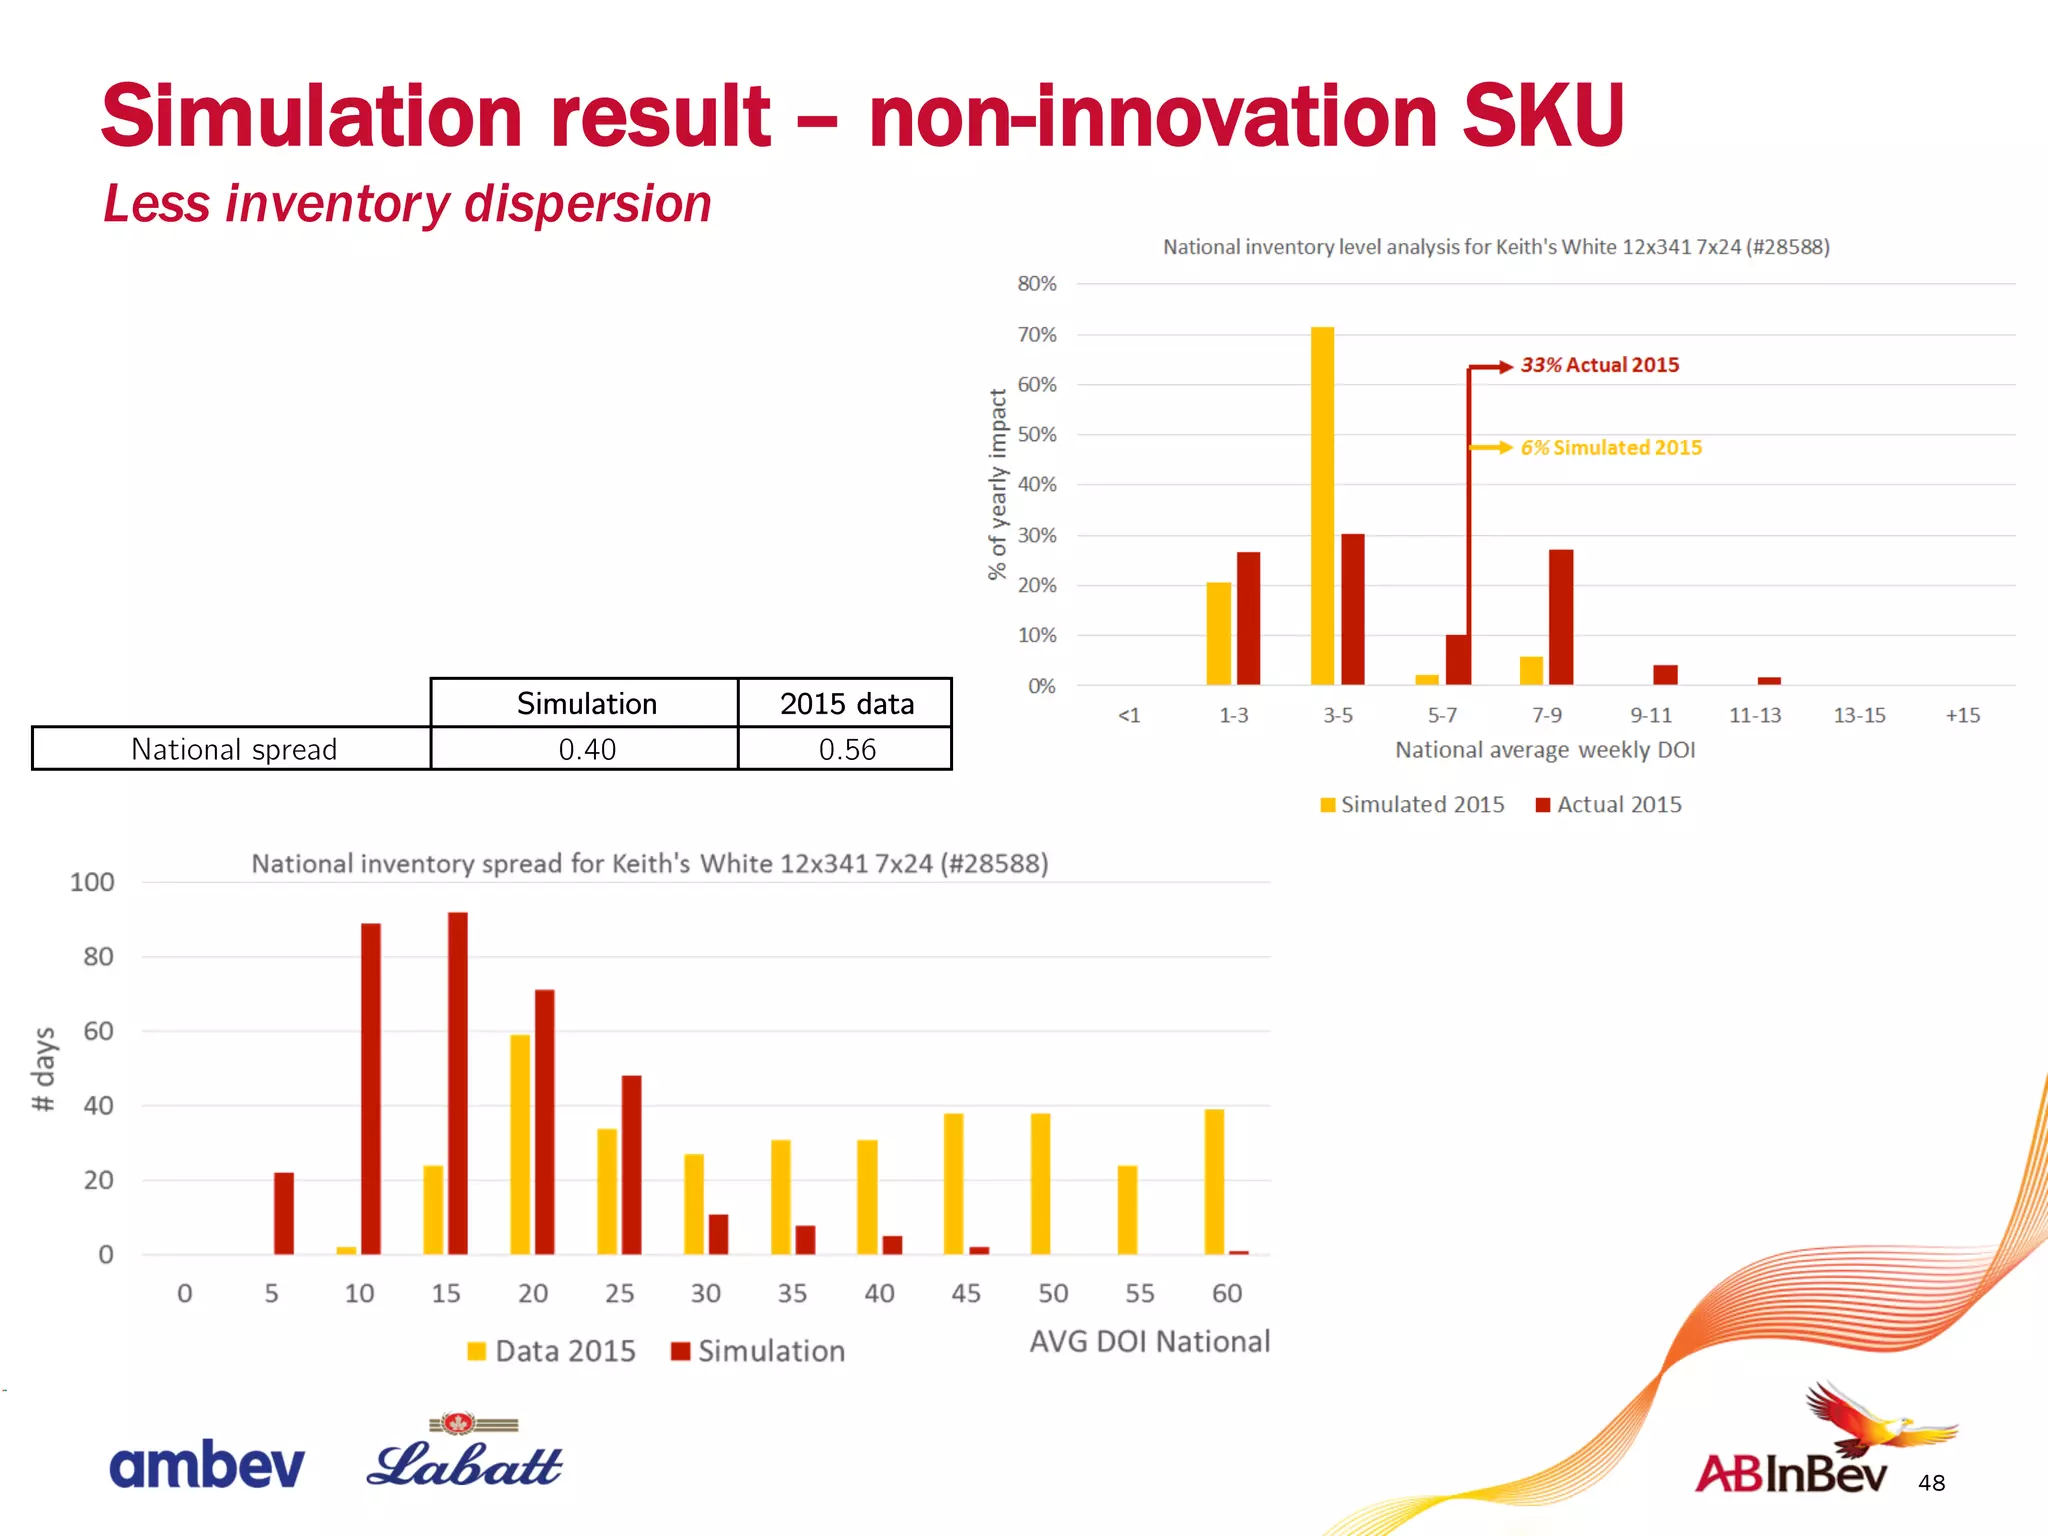
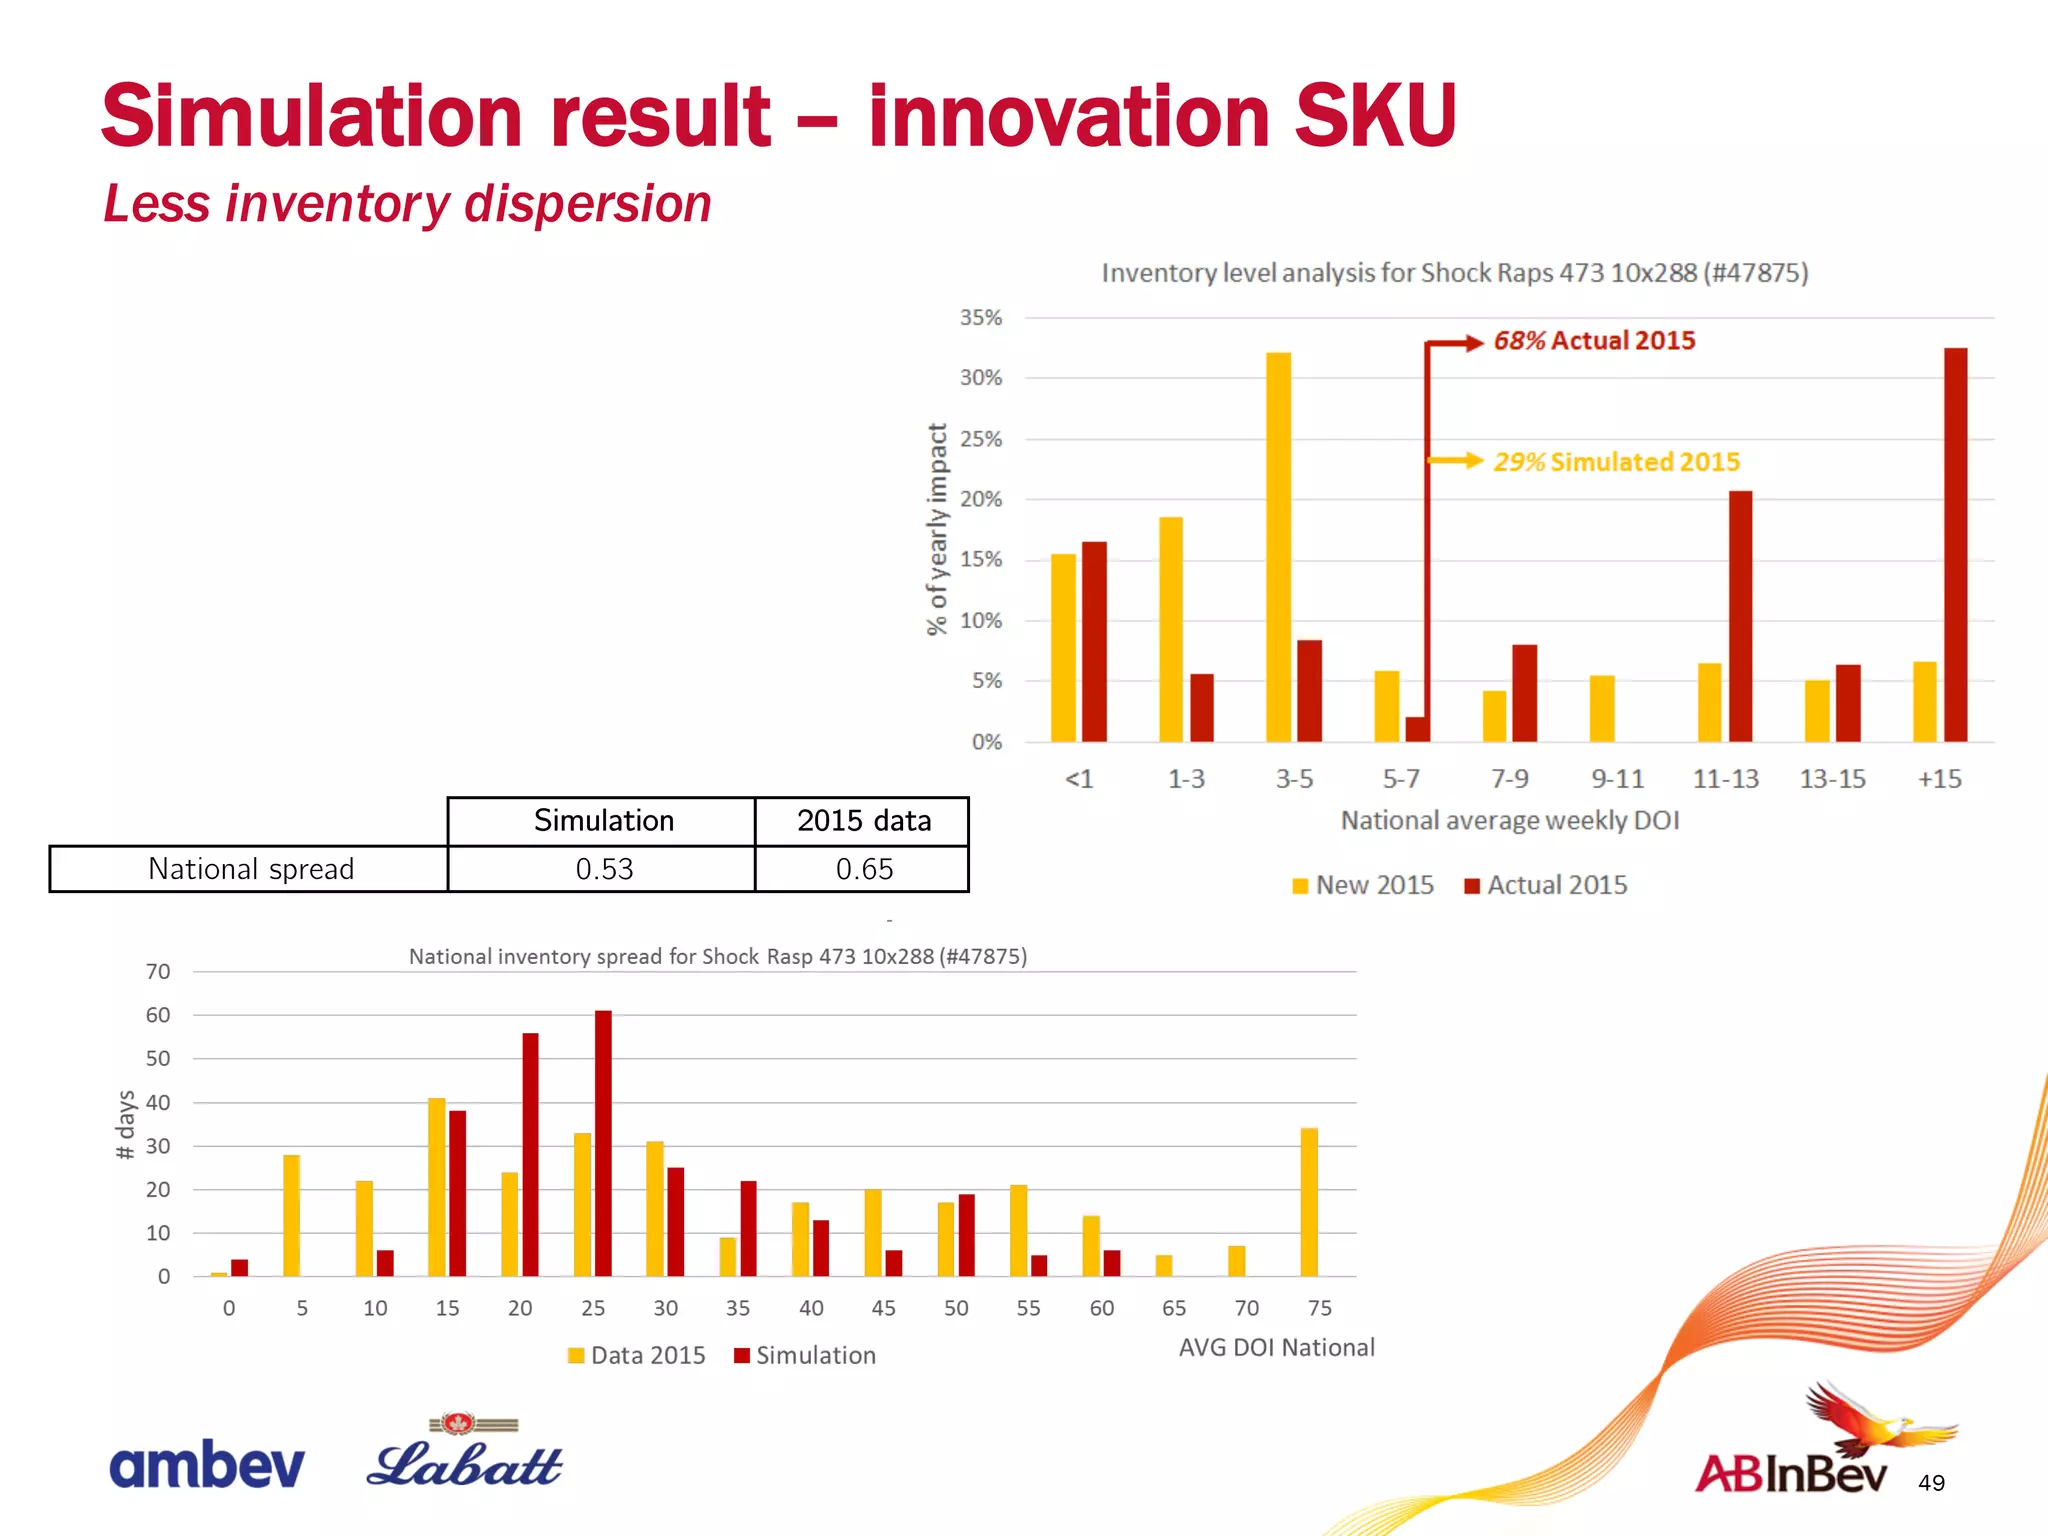
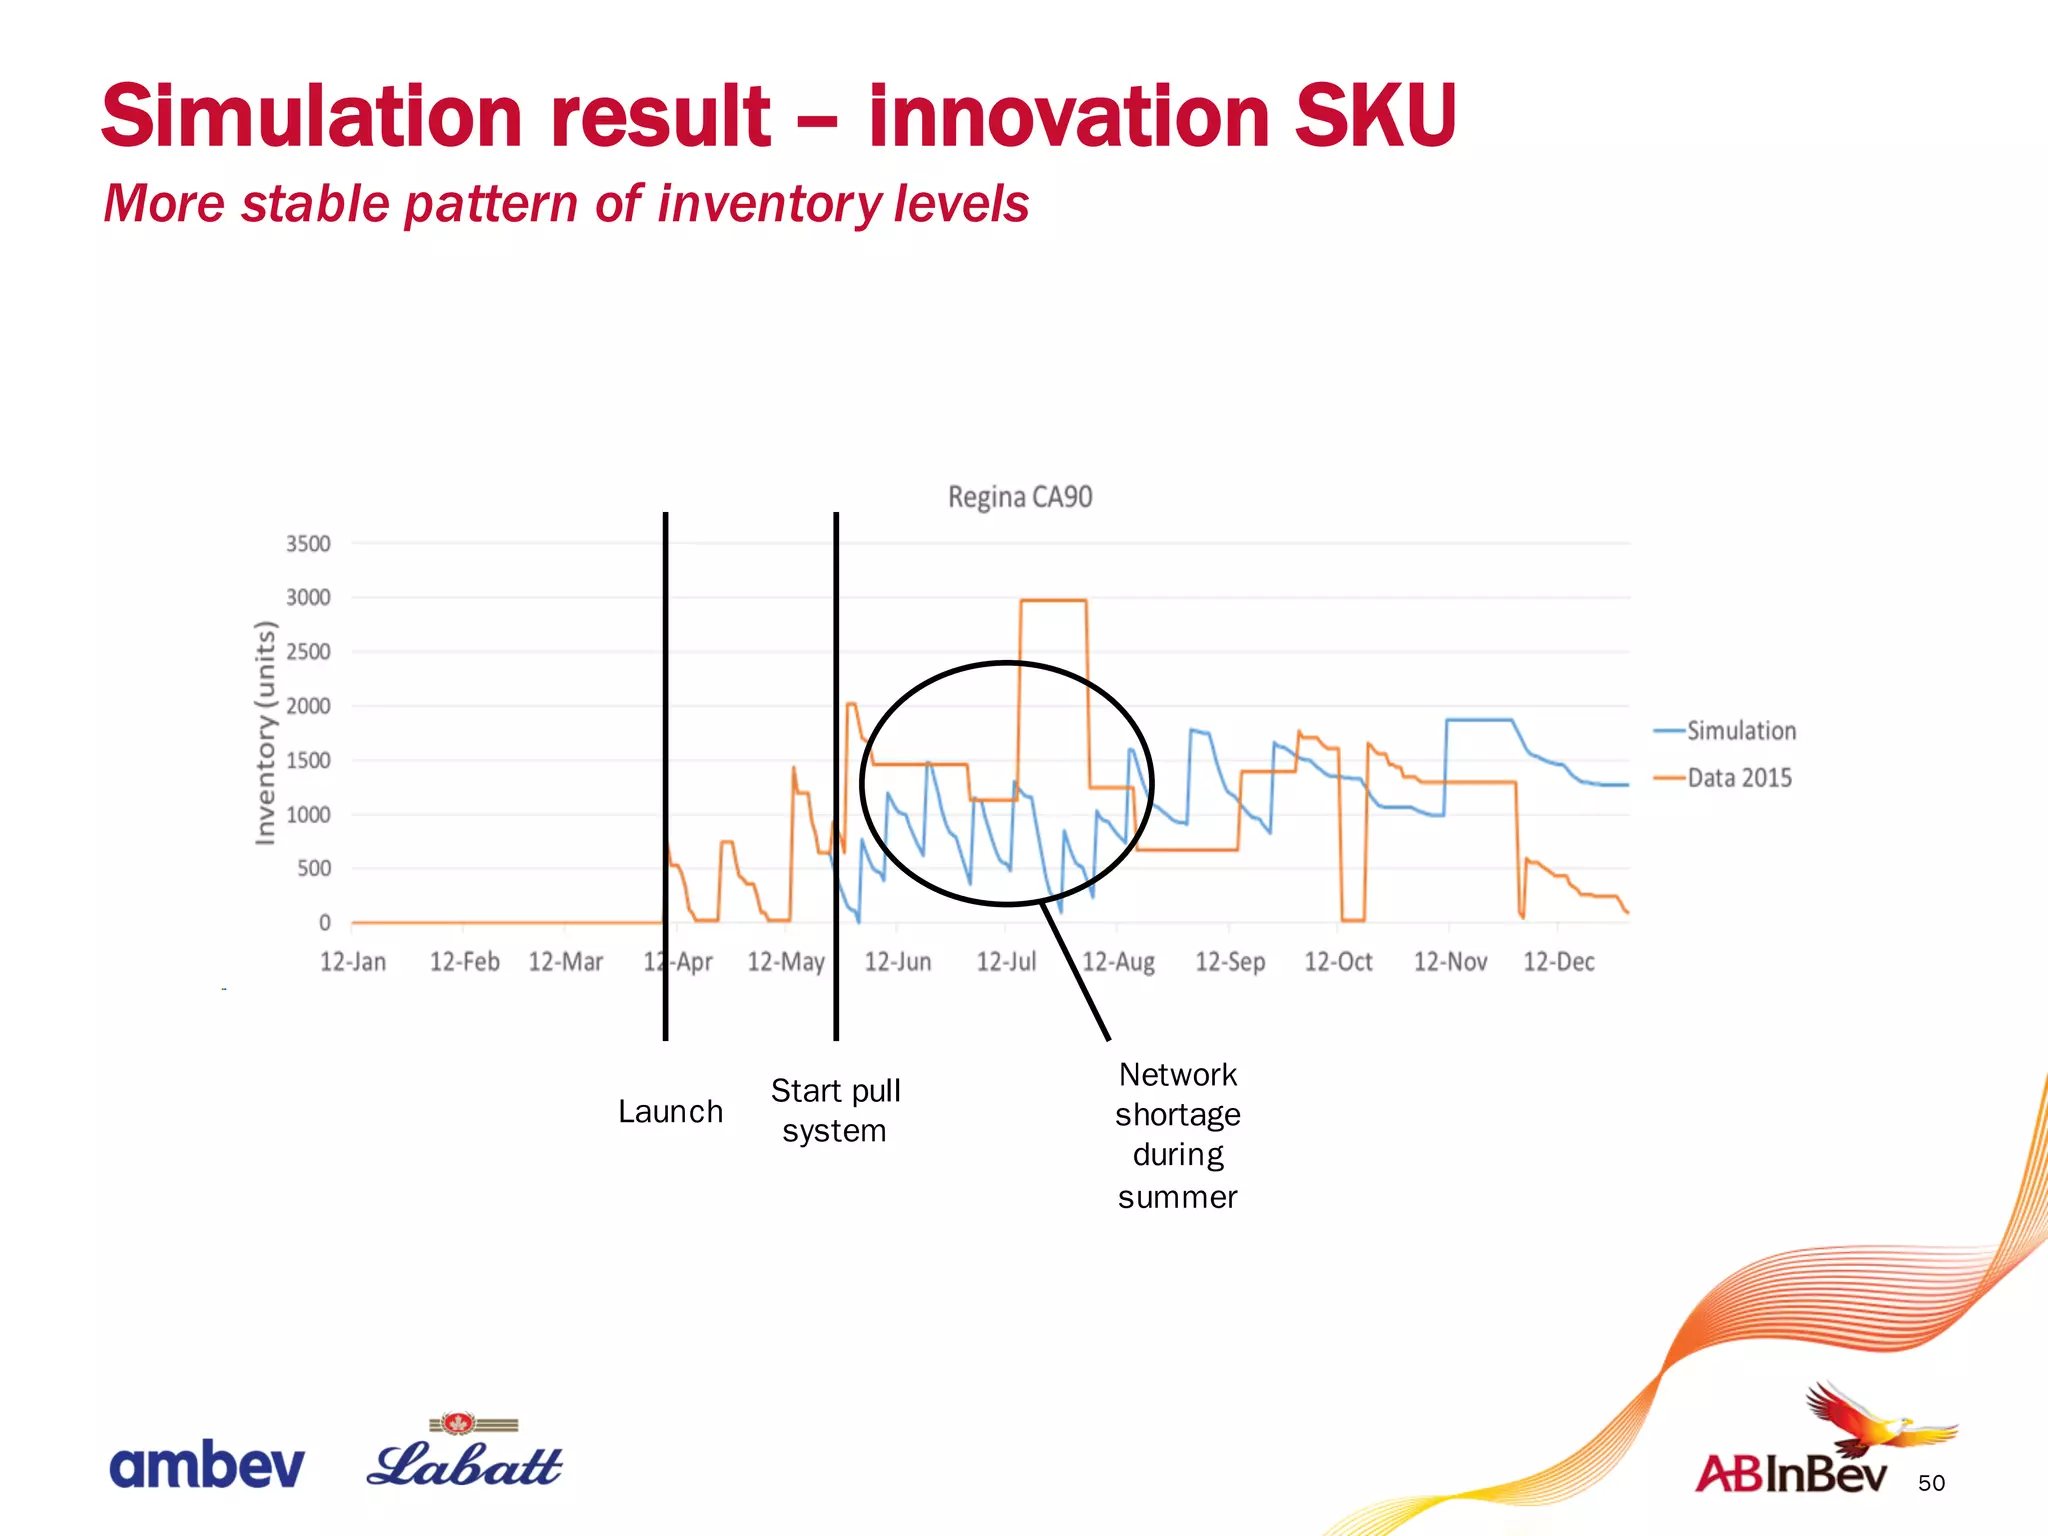
Improving service level of single source SKUs
June 24th
Matthias Van Kerkhove & Simon Wostyn
Overview
2
§ Problem statement
§ Background
§ Problem analysis and root causes
- Inventoryanalyses
- Product supply systems flow – supply planning and deployment
§ National pull system
- Definition and network configuration
- What-ifmodel for 2015
- Inventoryand deployment policies
- Test results (innovation vs. non-innovation SKUs)
§ Comments
§ Action plan and implementation
Problem statement & Objective
3
Problem statement
Labatt is witnessing growth in a lot of areas that can be considered “non-
traditional” to its core business. These strategically important areas are
characterized by many SKUs, they are single source (only produced in one
brewery) and represent small volumes. These SKUs traditionally receive lower
service levels than Labatt’score business.
Objective
Achieve core product service levels on national single source SKUs (SS SKUs)
while maintaining supply chain losses at a comparable/budgeted level. Design
the processes, rules and tools that will be embedded to the business to achieve
this goal.
Single source SKUs
§ 595 Single Source SKUs
- 50 innovation SKUs
less than 1 year on the market
- 504 non-innovation SKUs
more than 1 year on market
- 33 craft SKUs
- 8 overlap SKUs
§ Out of scope: import/export, co-packing
4
Service level within Labatt
5
§ Impact [hl] = demand [hl] – sales [hl]
§ Customer Delivery Performance = CDP [%]
§ CDP [%] =	
"#$%&'	[)*]
"#$%&'	 )* ,-%*.-	[)*]
Logistics overview
6
Logistics overview
7
London
Montreal
Problem analysis
8
CDP [%] for different SKU types and regions
Innovation SKUs are the biggest hitters
9
1.4%
0.9%
1.0%
0.2%
*CDP =
"#$%&'
"#$%&',-%*.-
Non-SS	SKUs
10
§ Stock-out due to network shortage
- Stock-outs in all/many DC’s due to too low forecast or
production issues
§ Stock-outs due to network dispersion
- Stock-outs in certain DC’s while enough/too much inventory in
other DC’s à inventory at the wrong location at the wrong time
Types of stock-outs
Two types of stock-outs are identified
11
§ Inventory level analysis
- Impact vs. average inventoryin network
- e.g. X% of yearly impact in weeks with Y DOI in the network
- Impact in weeks with more than 7 DOI à network dispersion
- Impact in weeks with less than 7 DOI à network shortage
§ Inventory spread analysis
- Dispersion =
34567	(59:	;<.=	%**	=.>";?%*	5@A-)
C76DCE6	(59:	;<.=	%**	=.>";?%*	5@A-)
- Dispersion > 0.5 è inventory at the wrong location at the wrong time
Identification of stock-outs
Two types of inventory analyses are used
Results National
SS SKUs more network shortages and more dispersed vs. non-SS SKUs
Inno SKUs more network shortages and equally dispersed vs. non-inno SKUs
12
SS vs. non-SS
Inno vs. non-inno
13
Conclusions of the inventory analysis
§ Single source SKUs experience more network shortages and are deployed
less efficiently than non-single source SKUs.
§ Innovation SKUs experience more network shortages than non-innovation
SKUs. Deployment is equally inefficient for innovation and non-innovation
SKUs.
è Single source SKUs’ inventoryshould be deployed differently
14
As-is process and issues
Significant room for improvement
As-is process Issues as-is process
Production and shipments decisions up to 8
weeks in advance
Decisions heavily depend on (inaccurate)
forecast
Deployment based on DC-level forecasts Forecast accuracy is very low at DC-level
No standard replenishment policy
Deployment heavily depends on supply
planner’sexpertise
Products are pushed out
High level of redeployment and SCL
High inventorylevels
Innovation SKUs
First 2 to 3 productions: based on sales
intelligence; afterwards: regular process
Innovation SKUs
Lower forecast accuracy for innovation
SKUs
Solution
15
16
Requirements of the solution
Issues as-is process Requirements of the solution
Decision heavily depends on (inaccurate)
forecast
Remove or reduce the influence of the forecast on
deployment decisions
Separate the deployment and production decisions
in time
Forecast accuracy is very low at DC-level
Avoid making low-level decisions early in the
process
Deployment heavily depends on supply
planner’s expertise
Standardized reorder points and reorder quantities
High level of redeployment and SCL
High inventory levels
Reduce redeployment and inventory levels
Lower forecast accuracy for innovation SKUs Less dependence on forecasting
17
National two-bin replenishment pull system
with a multi-echelon inventory optimization
§ National two-bin replenishment system
- Two-bin pull system
- Uses fixed order quantitiescalled “bins”
- When one bin is consumed, a signal is sent upstream to replenish it
§ National cascade of warehouses
- Reevaluatedeployment decisions at hubs in the network
18
Cascade system
Introduction of hubs in nation-wide network
19
Cascade system
Introduction of hubs in nation-wide network
20
National two-bin replenishment pull system
with a multi-echelon inventory optimization
§ 2-bin replenishment system
§ Cascade of warehouses
§ Multi-echelon inventory optimization
- Applying a pull system to a cascade of warehouses
- Minimizing total network safety stock
- By determining optimal service level in replenishment DC’s
- And keeping end customer service level fixed
Proof-of-concept by what-if model
21
“What would the results (stock outs, inventory, ...) have been in 2015
if our solution would have been used?”
§ Simulation of 2015 inventory, shipments, stock-outs, … based on input of 2014
§ Comparison with actual inventory levels, service levels, shipments,…
22
§ Input
§ Sales data 2014
§ Required service level to end customer
§ Lead times
§ Network configuration/product flow
§ Inventory and deployment policy
§ Output
§ Obtained service level
§ Inventorylevels
§ Inventoryspread
§ Constraint
§ 2015 production schedule implemented in model
Proof-of-concept by what-if model
Inventory policy
23
§ Bin sizes and safety stock
§ Re-order point and volume (#bins that are ordered)
§ How to treat backorders
§ Warehouse/region prioritization for shipments
24
𝑆𝑎𝑓𝑒𝑡𝑦	𝑠𝑡𝑜𝑐𝑘 = 𝑘	 ∗ 𝐿𝑒𝑎𝑑	𝑇𝑖𝑚𝑒V.X
	∗ 𝐷𝑎𝑖𝑙𝑦	𝑆𝑎𝑙𝑒𝑠	𝑆𝑡𝑎𝑛𝑑𝑎𝑟𝑑	𝐷𝑒𝑣𝑖𝑎𝑡𝑖𝑜𝑛
𝐵𝑖𝑛	𝑆𝑖𝑧𝑒 = 𝐴𝑣𝑒𝑟𝑎𝑔𝑒	𝐷𝑎𝑖𝑙𝑦	𝑆𝑎𝑙𝑒𝑠	 ∗ 𝐿𝑒𝑎𝑑	𝑇𝑖𝑚𝑒 +	
𝑆𝑎𝑓𝑒𝑡𝑦	𝑠𝑡𝑜𝑐𝑘
2
A realistic model only uses 2014 data toestimate these parameters
Inventory policy
Calculation of bin sizes and safety stock
2014 data
25
§ First 3 monthsof the year à use daily sales of 2014
§ After 3 months à resize bin sizes based on sales data of 2015
α =	
defgh	ijkgli	ml	nglogpq	fe	rgpst	uVvw
defgh	ijkgli	ml	nglogpq	fe	rgpst	uVvx
2015
Bin sizes based on
2014 data
April
Revised bin sizes
based on α
Inventory policy
Rules for bin sizes and safety stock for non-innovation SKUs
26
§ First 3 monthsafter launch à unchanged process
§ After 3 months à bin sizes based on innovation SKUs in 2014
à rescaled to reflect the volume of the given SKU
𝛼 =	
𝑇𝑜𝑡𝑎𝑙	𝑑𝑒𝑚𝑎𝑛𝑑	𝑖𝑛	3	𝑚𝑜𝑛𝑡ℎ𝑠	𝑎𝑓𝑡𝑒𝑟	𝑙𝑎𝑢𝑛𝑐ℎ	𝑖𝑛	2015
𝑇𝑜𝑡𝑎𝑙	𝑑𝑒𝑚𝑎𝑛𝑑	𝑜𝑓	𝑎𝑣𝑒𝑟𝑎𝑔𝑒	𝑖𝑛𝑛𝑜𝑣𝑎𝑡𝑖𝑜𝑛	𝑆𝐾𝑈	𝑖𝑛	3	𝑚𝑜𝑛𝑡ℎ𝑠	𝑎𝑓𝑡𝑒𝑟	𝑙𝑎𝑢𝑛𝑐ℎ	𝑖𝑛	2014
2015
No pull implementation
3 months after launch
Bin size based on
averageinnovation
in 2014 and α
Inventory policy
Rules for bin sizes and safety stock for innovation SKUs
27
§ If inventory level < reorder point à order 1 bin
§ If inventory level = 0 à order 2 bins
§ If forecasted sales in 1 week > 3 bins à order sufficient bins to anticipate
for huge sales
Inventory policy
Rules for reordering
28
§ If order cannot be delivered à order becomes backorder
§ Backorder is planned for the next dayuntil order is delivered
Inventory policy
Rules for backorders
29
§ Criteria 1: first backorders
§ Criteria 2: number of bins requested
§ Criteria 3: size of bins requested (DC importance)
Inventory policy
Rules for shipment prioritization
30
National two-bin replenishment pull system
with a multi-echelon inventory optimization
Our solution fulfills the requirements
Requirements of the solution Our solution
Remove or reduce the influence of the
forecast on deployment decisions
Separatethe deployment and production
decisions in time
Pull system
Cascade of warehouses
Avoid making low-level decisions early in
the process
Cascade of warehouses
Standardized reorder points and reorder
quantities
Bin sizes and reorder points
Reduce redeployment and inventorylevels
Pull system and multi-echelon
optimization
Less dependency on forecasting Pull system
31
Simulation result – non-innovation SKU
National CDP improvement and inventory reduction
Simulation 2015 data
Overall CDP in ON 1.01% 0.80%
Overall CDP in QC 1.12% 8.36%
Overall CDP in the West 3.24% 18.20%
Overall CDP national 1.79% 11.26%
Average daily inventory national
(units)
2962 3722
Inventory reduction national 20.53%
Keith’s White 12x341 7x24 (28588)
32
Simulation result – non-innovation SKU
More stable pattern of inventory levels
Simulation 2015 data
Overall CDP in ON 0.37% 3.27%
Overall CDP in QC - -
Overall CDP in the West 7.32% 1.07%
Overall CDP national 1.85% 2.82%
Average daily inventory national
(units)
13278 20260
Inventory reduction national 34.46%
Shock Rasp 473 10x288 (47875)
Simulation result – innovation SKU
National CDP improvement and inventory reduction
34
Comments
§ Multi-echelon
- Complexity vs. added value
- Full application requires specialized software
§ National network shortages
§ Two-bin replenishment system
- Large sales variability
- Lead times exceeding time required to empty a bin
§ Supply chain losses
- But: less lost sales, delay production, inventory reduction
§ Seasonality
- Refine bin size definition for different periods in the year
35
Action plan
1. Further refinement and testing model through scenario analyses
2. Aggregateresult for all single source SKUs
3. Development of model for Montreal brewery
4. Incorporation in daily operations
5. Development of a cost model
6. Trial phase evaluated with relevant KPI’s
7. Introduceto other types of SKUs
Conclusion
36
Objective
Achieve core product service levels on national single source SKUs (SS SKUs)
while maintaining supply chain losses at a comparable/budgeted level. Design
the processes, rules and tools that will be embedded to the business to achieve
this goal.
Achievements
Proof of service level improvement
Proof of inventory level reduction
Proof of inventory spread reduction
Proof of practical feasibility
Logistics overview
38
Route to markets
§ West
- Brewery > 8 DC’s of Beer Distribution Ltd (BDL) > Retail + on-trade
- BDL is a joint venture (non-profit with one competitor)
§ Ontario
- Brewery > 1 central T1 > beer store/LCBO
- Labatt owns the store (together with two competitors)
§ Quebec
- Brewery > 1 central T1 > 20 small T2’s> directly to more than 20,000
stores/pubs on-tradeor off-trade
- We own the entire network
§ Atlantic
- Out of scope
- Small volumes
39
Inventory level vs. inventory spread
40
Inventory spread vs.
level
Impact when inventory > 7 DOI Impact when inventory < 7 DOI
Inventory spread >
0.5
Impact occurred when there
was on average a lot of inventory
left in the network. However, the
spread indicates that some DC’s
have a lot of inventory while
others have very little.
à Stock-outs due to
inventory dispersion, hence
poor deployment.
Impact occurred when there was little
inventory left in the network. However,
the spread is still large indicating poorly
maintained inventory levels. Hence, if
product would be available, distribution
would still be deficient.
à Stock-outs due to network
shortages. On top ofthat, deployment
is inadequate.
Inventory spread <
0.5
N.A.
Little inventory was left in the
network when impact occurred and all
DC’s have more or less the same DOI
left.
à Stock-outs due to a network
shortage. Inventory deploymentis
less of an issue.
41
Results in The West
SS SKUs more network shortages and more dispersed vs. non-SS SKUs
Inno SKUs more network shortages and more dispersed vs. non-inno SKUs
SS vs. non-SS
Inno vs. non-inno
Results in Quebec
SS SKUs more dispersed vs. non-SS SKUs
Inno SKUs more network shortages and more dispersed vs. non-inno SKUs
42
SS vs. non-SS
Inno vs. non-inno
Results National
SS SKUs more network shortages and more dispersed vs. non-SS SKUs
Inno SKUs more network shortages and equally dispersed vs. non-inno SKUs
43
SS vs. non-SS
Inno vs. non-inno
Possible Directions of solutions
§ Improving forecast accuracy
- Root cause of CDP hits
- Either incorrect or (must be) used too soon in the supply chain
§ Hold more overall inventory
- Negative impact supply chain losses and warehouse costs
§ Deploy differently à postponement
- Mitigatethe effects of (low) forecast accuracy
- Room for improvement confirmed by inventoryanalysis
44
45
Low	payoff High	payoff
Easy	to	implement
- Premium	safety
stock
Difficult	to	implement
- Increase	number	
of deliveries or	
productions
- Cascade	of	warehouses	– tier	as	
function	of	brewery	distance
- Pull/EOQ/Kanban	from national	to	
regional	(and	down)
- Fixed	time	period	EOQ
Solutions – PICK chart
46
National two-bin replenishment pull system
with a multi-echelon inventory optimization
§ Multi-echelon inventory optimization
P
T1 T1
T2 T2 T2
SS2 SS2 SS2
SS1 SS1
T2
SS2
1. Fix end customer service level
2. Determine service level at T1’sto
3. Minimize total SS (2*SS1+4*SS2)
99.7% 99.7% 99.7% 99.7%
SL? SL?
47
National two-bin replenishment pull system
with a multi-echelon inventory optimization
Multi-echelon optimization relocates safety stock and reduces network safety stock
§ Multi-echelon inventory optimization example
In this examplethe overall safety stock is reduced by 7%
Before ME implementation After ME implementation
48
Simulation 2015 data
National spread 0.40 0.56
Simulation result – non-innovation SKU
Less inventory dispersion
49
Simulation 2015 data
National spread 0.53 0.65
Simulation result – innovation SKU
Less inventory dispersion
50
Launch
Start pull
system
Network
shortage
during
summer
Simulation result – innovation SKU
More stable pattern of inventory levels
51
Incorporation in daily operations
Plan for everyday utilization
Steps in the process Responsibilities
Demand planning/forecasting Remains as-is – forecasting for coming 8 weeks
Supply planning
National production based on national forecast
and inventory levels – lock-in brewing plan 2
weeks before production
No shipment decisions
Sequencing
Remains as-is – lock-in 1 week before
production
Deployment
Actual shipments based on pull orders
independent of production schedule
52
Incorporation in daily operations
Treatment of non-innovation SKUs
Bin sizes based on
2014 data
April
Revised bin sizes
2015
Timing Action
First 3 monthsof the year Use daily sales of 2014
After 3 months Resize bin sizes based on sales data of 2015
53
Incorporation in daily operations
Treatment of brand new SKUs
Timing Action
First 3 monthsafter launch Unchanged process
After 3 months
Resize bin sizes based on sales data of innovation
SKUs in 2014
2015
No pull implementation
3 months after launch
Bin size based on
averageinnovation
in 2014 and α

Final_presentation_MatthiasVanKerkhove_SimonWostyn

  • 1.
    Improving service levelof single source SKUs June 24th Matthias Van Kerkhove & Simon Wostyn
  • 2.
    Overview 2 § Problem statement §Background § Problem analysis and root causes - Inventoryanalyses - Product supply systems flow – supply planning and deployment § National pull system - Definition and network configuration - What-ifmodel for 2015 - Inventoryand deployment policies - Test results (innovation vs. non-innovation SKUs) § Comments § Action plan and implementation
  • 3.
    Problem statement &Objective 3 Problem statement Labatt is witnessing growth in a lot of areas that can be considered “non- traditional” to its core business. These strategically important areas are characterized by many SKUs, they are single source (only produced in one brewery) and represent small volumes. These SKUs traditionally receive lower service levels than Labatt’score business. Objective Achieve core product service levels on national single source SKUs (SS SKUs) while maintaining supply chain losses at a comparable/budgeted level. Design the processes, rules and tools that will be embedded to the business to achieve this goal.
  • 4.
    Single source SKUs §595 Single Source SKUs - 50 innovation SKUs less than 1 year on the market - 504 non-innovation SKUs more than 1 year on market - 33 craft SKUs - 8 overlap SKUs § Out of scope: import/export, co-packing 4
  • 5.
    Service level withinLabatt 5 § Impact [hl] = demand [hl] – sales [hl] § Customer Delivery Performance = CDP [%] § CDP [%] = "#$%&' [)*] "#$%&' )* ,-%*.- [)*]
  • 6.
  • 7.
  • 8.
  • 9.
    CDP [%] fordifferent SKU types and regions Innovation SKUs are the biggest hitters 9 1.4% 0.9% 1.0% 0.2% *CDP = "#$%&' "#$%&',-%*.- Non-SS SKUs
  • 10.
    10 § Stock-out dueto network shortage - Stock-outs in all/many DC’s due to too low forecast or production issues § Stock-outs due to network dispersion - Stock-outs in certain DC’s while enough/too much inventory in other DC’s à inventory at the wrong location at the wrong time Types of stock-outs Two types of stock-outs are identified
  • 11.
    11 § Inventory levelanalysis - Impact vs. average inventoryin network - e.g. X% of yearly impact in weeks with Y DOI in the network - Impact in weeks with more than 7 DOI à network dispersion - Impact in weeks with less than 7 DOI à network shortage § Inventory spread analysis - Dispersion = 34567 (59: ;<.= %** =.>";?%* 5@A-) C76DCE6 (59: ;<.= %** =.>";?%* 5@A-) - Dispersion > 0.5 è inventory at the wrong location at the wrong time Identification of stock-outs Two types of inventory analyses are used
  • 12.
    Results National SS SKUsmore network shortages and more dispersed vs. non-SS SKUs Inno SKUs more network shortages and equally dispersed vs. non-inno SKUs 12 SS vs. non-SS Inno vs. non-inno
  • 13.
    13 Conclusions of theinventory analysis § Single source SKUs experience more network shortages and are deployed less efficiently than non-single source SKUs. § Innovation SKUs experience more network shortages than non-innovation SKUs. Deployment is equally inefficient for innovation and non-innovation SKUs. è Single source SKUs’ inventoryshould be deployed differently
  • 14.
    14 As-is process andissues Significant room for improvement As-is process Issues as-is process Production and shipments decisions up to 8 weeks in advance Decisions heavily depend on (inaccurate) forecast Deployment based on DC-level forecasts Forecast accuracy is very low at DC-level No standard replenishment policy Deployment heavily depends on supply planner’sexpertise Products are pushed out High level of redeployment and SCL High inventorylevels Innovation SKUs First 2 to 3 productions: based on sales intelligence; afterwards: regular process Innovation SKUs Lower forecast accuracy for innovation SKUs
  • 15.
  • 16.
    16 Requirements of thesolution Issues as-is process Requirements of the solution Decision heavily depends on (inaccurate) forecast Remove or reduce the influence of the forecast on deployment decisions Separate the deployment and production decisions in time Forecast accuracy is very low at DC-level Avoid making low-level decisions early in the process Deployment heavily depends on supply planner’s expertise Standardized reorder points and reorder quantities High level of redeployment and SCL High inventory levels Reduce redeployment and inventory levels Lower forecast accuracy for innovation SKUs Less dependence on forecasting
  • 17.
    17 National two-bin replenishmentpull system with a multi-echelon inventory optimization § National two-bin replenishment system - Two-bin pull system - Uses fixed order quantitiescalled “bins” - When one bin is consumed, a signal is sent upstream to replenish it § National cascade of warehouses - Reevaluatedeployment decisions at hubs in the network
  • 18.
    18 Cascade system Introduction ofhubs in nation-wide network
  • 19.
    19 Cascade system Introduction ofhubs in nation-wide network
  • 20.
    20 National two-bin replenishmentpull system with a multi-echelon inventory optimization § 2-bin replenishment system § Cascade of warehouses § Multi-echelon inventory optimization - Applying a pull system to a cascade of warehouses - Minimizing total network safety stock - By determining optimal service level in replenishment DC’s - And keeping end customer service level fixed
  • 21.
    Proof-of-concept by what-ifmodel 21 “What would the results (stock outs, inventory, ...) have been in 2015 if our solution would have been used?” § Simulation of 2015 inventory, shipments, stock-outs, … based on input of 2014 § Comparison with actual inventory levels, service levels, shipments,…
  • 22.
    22 § Input § Salesdata 2014 § Required service level to end customer § Lead times § Network configuration/product flow § Inventory and deployment policy § Output § Obtained service level § Inventorylevels § Inventoryspread § Constraint § 2015 production schedule implemented in model Proof-of-concept by what-if model
  • 23.
    Inventory policy 23 § Binsizes and safety stock § Re-order point and volume (#bins that are ordered) § How to treat backorders § Warehouse/region prioritization for shipments
  • 24.
    24 𝑆𝑎𝑓𝑒𝑡𝑦 𝑠𝑡𝑜𝑐𝑘 = 𝑘 ∗ 𝐿𝑒𝑎𝑑 𝑇𝑖𝑚𝑒V.X ∗ 𝐷𝑎𝑖𝑙𝑦 𝑆𝑎𝑙𝑒𝑠 𝑆𝑡𝑎𝑛𝑑𝑎𝑟𝑑 𝐷𝑒𝑣𝑖𝑎𝑡𝑖𝑜𝑛 𝐵𝑖𝑛 𝑆𝑖𝑧𝑒 = 𝐴𝑣𝑒𝑟𝑎𝑔𝑒 𝐷𝑎𝑖𝑙𝑦 𝑆𝑎𝑙𝑒𝑠 ∗ 𝐿𝑒𝑎𝑑 𝑇𝑖𝑚𝑒 + 𝑆𝑎𝑓𝑒𝑡𝑦 𝑠𝑡𝑜𝑐𝑘 2 A realistic model only uses 2014 data toestimate these parameters Inventory policy Calculation of bin sizes and safety stock 2014 data
  • 25.
    25 § First 3monthsof the year à use daily sales of 2014 § After 3 months à resize bin sizes based on sales data of 2015 α = defgh ijkgli ml nglogpq fe rgpst uVvw defgh ijkgli ml nglogpq fe rgpst uVvx 2015 Bin sizes based on 2014 data April Revised bin sizes based on α Inventory policy Rules for bin sizes and safety stock for non-innovation SKUs
  • 26.
    26 § First 3monthsafter launch à unchanged process § After 3 months à bin sizes based on innovation SKUs in 2014 à rescaled to reflect the volume of the given SKU 𝛼 = 𝑇𝑜𝑡𝑎𝑙 𝑑𝑒𝑚𝑎𝑛𝑑 𝑖𝑛 3 𝑚𝑜𝑛𝑡ℎ𝑠 𝑎𝑓𝑡𝑒𝑟 𝑙𝑎𝑢𝑛𝑐ℎ 𝑖𝑛 2015 𝑇𝑜𝑡𝑎𝑙 𝑑𝑒𝑚𝑎𝑛𝑑 𝑜𝑓 𝑎𝑣𝑒𝑟𝑎𝑔𝑒 𝑖𝑛𝑛𝑜𝑣𝑎𝑡𝑖𝑜𝑛 𝑆𝐾𝑈 𝑖𝑛 3 𝑚𝑜𝑛𝑡ℎ𝑠 𝑎𝑓𝑡𝑒𝑟 𝑙𝑎𝑢𝑛𝑐ℎ 𝑖𝑛 2014 2015 No pull implementation 3 months after launch Bin size based on averageinnovation in 2014 and α Inventory policy Rules for bin sizes and safety stock for innovation SKUs
  • 27.
    27 § If inventorylevel < reorder point à order 1 bin § If inventory level = 0 à order 2 bins § If forecasted sales in 1 week > 3 bins à order sufficient bins to anticipate for huge sales Inventory policy Rules for reordering
  • 28.
    28 § If ordercannot be delivered à order becomes backorder § Backorder is planned for the next dayuntil order is delivered Inventory policy Rules for backorders
  • 29.
    29 § Criteria 1:first backorders § Criteria 2: number of bins requested § Criteria 3: size of bins requested (DC importance) Inventory policy Rules for shipment prioritization
  • 30.
    30 National two-bin replenishmentpull system with a multi-echelon inventory optimization Our solution fulfills the requirements Requirements of the solution Our solution Remove or reduce the influence of the forecast on deployment decisions Separatethe deployment and production decisions in time Pull system Cascade of warehouses Avoid making low-level decisions early in the process Cascade of warehouses Standardized reorder points and reorder quantities Bin sizes and reorder points Reduce redeployment and inventorylevels Pull system and multi-echelon optimization Less dependency on forecasting Pull system
  • 31.
    31 Simulation result –non-innovation SKU National CDP improvement and inventory reduction Simulation 2015 data Overall CDP in ON 1.01% 0.80% Overall CDP in QC 1.12% 8.36% Overall CDP in the West 3.24% 18.20% Overall CDP national 1.79% 11.26% Average daily inventory national (units) 2962 3722 Inventory reduction national 20.53% Keith’s White 12x341 7x24 (28588)
  • 32.
    32 Simulation result –non-innovation SKU More stable pattern of inventory levels
  • 33.
    Simulation 2015 data OverallCDP in ON 0.37% 3.27% Overall CDP in QC - - Overall CDP in the West 7.32% 1.07% Overall CDP national 1.85% 2.82% Average daily inventory national (units) 13278 20260 Inventory reduction national 34.46% Shock Rasp 473 10x288 (47875) Simulation result – innovation SKU National CDP improvement and inventory reduction
  • 34.
    34 Comments § Multi-echelon - Complexityvs. added value - Full application requires specialized software § National network shortages § Two-bin replenishment system - Large sales variability - Lead times exceeding time required to empty a bin § Supply chain losses - But: less lost sales, delay production, inventory reduction § Seasonality - Refine bin size definition for different periods in the year
  • 35.
    35 Action plan 1. Furtherrefinement and testing model through scenario analyses 2. Aggregateresult for all single source SKUs 3. Development of model for Montreal brewery 4. Incorporation in daily operations 5. Development of a cost model 6. Trial phase evaluated with relevant KPI’s 7. Introduceto other types of SKUs
  • 36.
    Conclusion 36 Objective Achieve core productservice levels on national single source SKUs (SS SKUs) while maintaining supply chain losses at a comparable/budgeted level. Design the processes, rules and tools that will be embedded to the business to achieve this goal. Achievements Proof of service level improvement Proof of inventory level reduction Proof of inventory spread reduction Proof of practical feasibility
  • 38.
  • 39.
    Route to markets §West - Brewery > 8 DC’s of Beer Distribution Ltd (BDL) > Retail + on-trade - BDL is a joint venture (non-profit with one competitor) § Ontario - Brewery > 1 central T1 > beer store/LCBO - Labatt owns the store (together with two competitors) § Quebec - Brewery > 1 central T1 > 20 small T2’s> directly to more than 20,000 stores/pubs on-tradeor off-trade - We own the entire network § Atlantic - Out of scope - Small volumes 39
  • 40.
    Inventory level vs.inventory spread 40 Inventory spread vs. level Impact when inventory > 7 DOI Impact when inventory < 7 DOI Inventory spread > 0.5 Impact occurred when there was on average a lot of inventory left in the network. However, the spread indicates that some DC’s have a lot of inventory while others have very little. à Stock-outs due to inventory dispersion, hence poor deployment. Impact occurred when there was little inventory left in the network. However, the spread is still large indicating poorly maintained inventory levels. Hence, if product would be available, distribution would still be deficient. à Stock-outs due to network shortages. On top ofthat, deployment is inadequate. Inventory spread < 0.5 N.A. Little inventory was left in the network when impact occurred and all DC’s have more or less the same DOI left. à Stock-outs due to a network shortage. Inventory deploymentis less of an issue.
  • 41.
    41 Results in TheWest SS SKUs more network shortages and more dispersed vs. non-SS SKUs Inno SKUs more network shortages and more dispersed vs. non-inno SKUs SS vs. non-SS Inno vs. non-inno
  • 42.
    Results in Quebec SSSKUs more dispersed vs. non-SS SKUs Inno SKUs more network shortages and more dispersed vs. non-inno SKUs 42 SS vs. non-SS Inno vs. non-inno
  • 43.
    Results National SS SKUsmore network shortages and more dispersed vs. non-SS SKUs Inno SKUs more network shortages and equally dispersed vs. non-inno SKUs 43 SS vs. non-SS Inno vs. non-inno
  • 44.
    Possible Directions ofsolutions § Improving forecast accuracy - Root cause of CDP hits - Either incorrect or (must be) used too soon in the supply chain § Hold more overall inventory - Negative impact supply chain losses and warehouse costs § Deploy differently à postponement - Mitigatethe effects of (low) forecast accuracy - Room for improvement confirmed by inventoryanalysis 44
  • 45.
    45 Low payoff High payoff Easy to implement - Premium safety stock Difficult to implement -Increase number of deliveries or productions - Cascade of warehouses – tier as function of brewery distance - Pull/EOQ/Kanban from national to regional (and down) - Fixed time period EOQ Solutions – PICK chart
  • 46.
    46 National two-bin replenishmentpull system with a multi-echelon inventory optimization § Multi-echelon inventory optimization P T1 T1 T2 T2 T2 SS2 SS2 SS2 SS1 SS1 T2 SS2 1. Fix end customer service level 2. Determine service level at T1’sto 3. Minimize total SS (2*SS1+4*SS2) 99.7% 99.7% 99.7% 99.7% SL? SL?
  • 47.
    47 National two-bin replenishmentpull system with a multi-echelon inventory optimization Multi-echelon optimization relocates safety stock and reduces network safety stock § Multi-echelon inventory optimization example In this examplethe overall safety stock is reduced by 7% Before ME implementation After ME implementation
  • 48.
    48 Simulation 2015 data Nationalspread 0.40 0.56 Simulation result – non-innovation SKU Less inventory dispersion
  • 49.
    49 Simulation 2015 data Nationalspread 0.53 0.65 Simulation result – innovation SKU Less inventory dispersion
  • 50.
    50 Launch Start pull system Network shortage during summer Simulation result– innovation SKU More stable pattern of inventory levels
  • 51.
    51 Incorporation in dailyoperations Plan for everyday utilization Steps in the process Responsibilities Demand planning/forecasting Remains as-is – forecasting for coming 8 weeks Supply planning National production based on national forecast and inventory levels – lock-in brewing plan 2 weeks before production No shipment decisions Sequencing Remains as-is – lock-in 1 week before production Deployment Actual shipments based on pull orders independent of production schedule
  • 52.
    52 Incorporation in dailyoperations Treatment of non-innovation SKUs Bin sizes based on 2014 data April Revised bin sizes 2015 Timing Action First 3 monthsof the year Use daily sales of 2014 After 3 months Resize bin sizes based on sales data of 2015
  • 53.
    53 Incorporation in dailyoperations Treatment of brand new SKUs Timing Action First 3 monthsafter launch Unchanged process After 3 months Resize bin sizes based on sales data of innovation SKUs in 2014 2015 No pull implementation 3 months after launch Bin size based on averageinnovation in 2014 and α