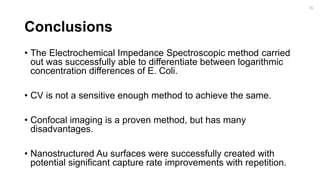
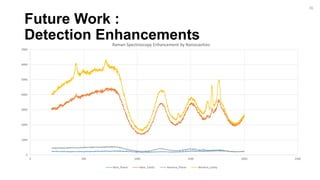
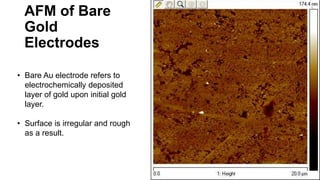
The document outlines a project focused on the electrochemical impedance detection of pathogens, particularly E. coli, under the supervision of Professor Robert J. Forster. It includes various experimental methods, such as cyclic voltammetry and confocal fluorescence microscopy, to study the detection efficacy of different concentrations of bacteria using nanostructured gold surfaces. The findings highlight the effectiveness of electrochemical impedance methods over cyclic voltammetry, potential improvements in capture rates, and suggestions for future detection enhancements.
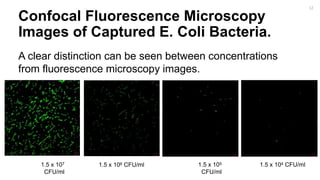
![Project Overview
[1]
2](https://image.slidesharecdn.com/finalpresentation-160819205127/85/Final-Year-Project-Presentation-2-320.jpg)
![Project
Overview
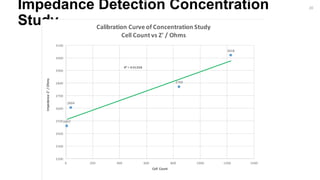
3018
2769
2604
2457
2200
2300
2400
2500
2600
2700
2800
2900
3000
3100
0 200 400 600 800 1000 1200 1400
ImpedanceZ'/Ohms
Cell Count
Calibration Curve of Concentration Study
Cell Count vs Z' / Ohms
-3.00
-2.00
-1.00
0.00
1.00
2.00
3.00
4.00
5.00
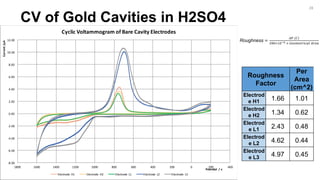
-0.3-0.2-0.100.10.20.30.40.50.60.70.80.911.11.21.31.41.51.6
Current/µA
Potential / V
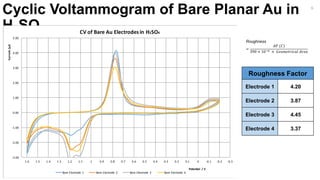
CV of Bare Au Electrodes in H2SO4
Bare Electrode 1 Bare Electrode 2 Bare Electrode 3 Bare Electrode 4 Potential/V
-1400.00
-1200.00
-1000.00
-800.00
-600.00
-400.00
-200.00
0.00
0.00 500.00 1000.00 1500.00 2000.00 2500.00 3000.00 3500.00
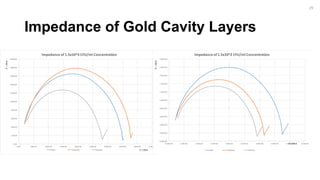
Z'/Ohm
Z' / Ohm
Nyquest Plot of E. Coli Concentration Study
Bare Antibody Bacteria [Highest Concentration] Bacteria [Medium Concentration]
Bacteria [Low Concentration] Bacteria [Lowest Concentration] Thiol
3](https://image.slidesharecdn.com/finalpresentation-160819205127/85/Final-Year-Project-Presentation-3-320.jpg)
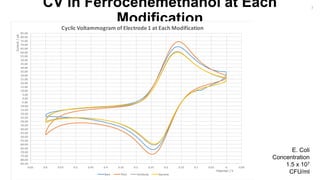
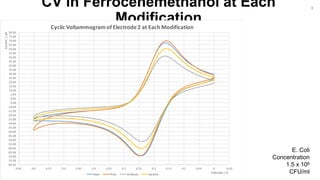
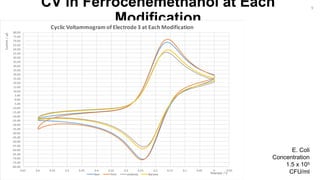
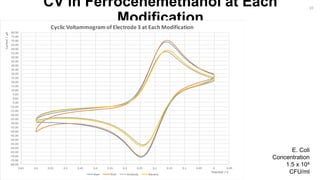
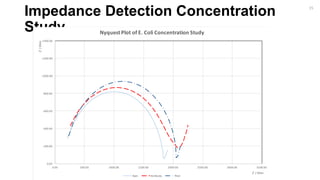
![Impedance Detection Concentration
Study
-1400.00
-1200.00
-1000.00
-800.00
-600.00
-400.00
-200.00
0.00
0.00 500.00 1000.00 1500.00 2000.00 2500.00 3000.00 3500.00
Z'/Ohm
Z' / Ohm
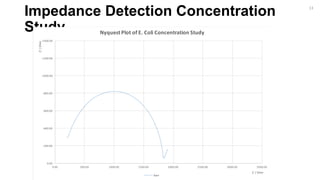
Nyquest Plot of E. Coli Concentration Study
Bare Antibody Bacteria [Lowest Concentration] Thiol
16](https://image.slidesharecdn.com/finalpresentation-160819205127/85/Final-Year-Project-Presentation-16-320.jpg)
![Impedance Detection Concentration
Study
-1400.00
-1200.00
-1000.00
-800.00
-600.00
-400.00
-200.00
0.00
0.00 500.00 1000.00 1500.00 2000.00 2500.00 3000.00 3500.00
Z'/Ohm
Z' / Ohm
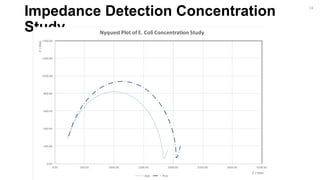
Nyquest Plot of E. Coli Concentration Study
Bare Antibody Bacteria [Low Concentration] Bacteria [Lowest Concentration] Thiol
17](https://image.slidesharecdn.com/finalpresentation-160819205127/85/Final-Year-Project-Presentation-17-320.jpg)
![Impedance Detection Concentration
Study
-1400.00
-1200.00
-1000.00
-800.00
-600.00
-400.00
-200.00
0.00
0.00 500.00 1000.00 1500.00 2000.00 2500.00 3000.00 3500.00
Z'/Ohm
Z' / Ohm
Nyquest Plot of E. Coli Concentration Study
Bare Antibody Bacteria [Medium Concentration] Bacteria [Low Concentration] Bacteria [Lowest Concentration] Thiol
18](https://image.slidesharecdn.com/finalpresentation-160819205127/85/Final-Year-Project-Presentation-18-320.jpg)
![Impedance Detection Concentration
Study
-1400.00
-1200.00
-1000.00
-800.00
-600.00
-400.00
-200.00
0.00
0.00 500.00 1000.00 1500.00 2000.00 2500.00 3000.00 3500.00
Z'/Ohm
Z' / Ohm
Nyquest Plot of E. Coli Concentration Study
Bare Antibody Bacteria [Highest Concentration] Bacteria [Medium Concentration]
Bacteria [Low Concentration] Bacteria [Lowest Concentration] Thiol
19](https://image.slidesharecdn.com/finalpresentation-160819205127/85/Final-Year-Project-Presentation-19-320.jpg)
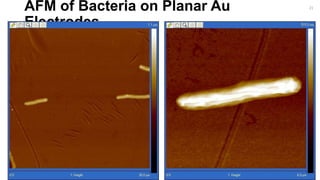
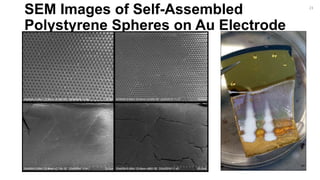
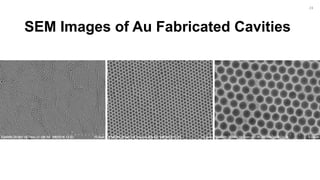
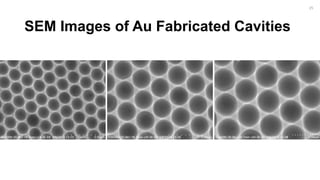
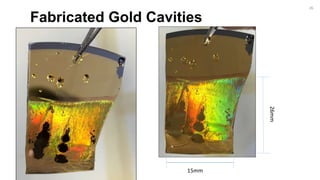
![Fabrication of Nanostructures to
Improve Bacteria Capture.
[2]
22](https://image.slidesharecdn.com/finalpresentation-160819205127/85/Final-Year-Project-Presentation-22-320.jpg)