Download as PDF, PPTX
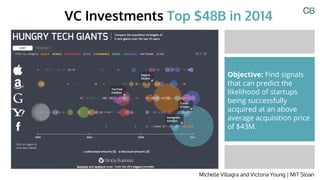
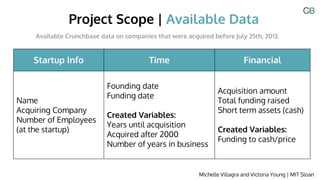
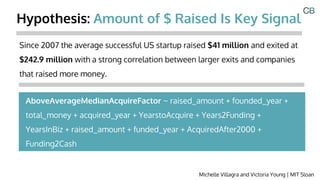
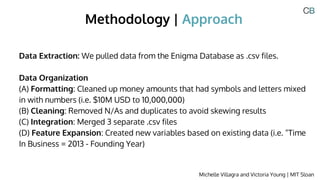
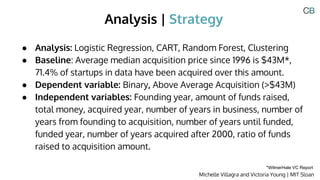
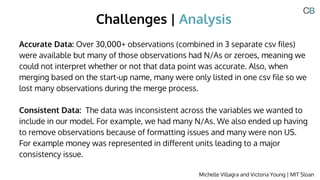
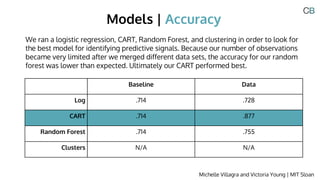
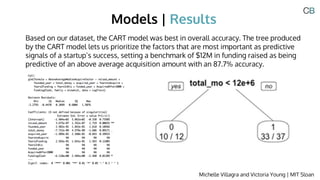
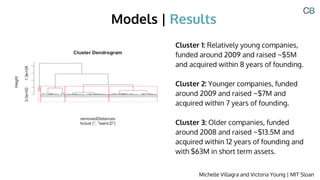
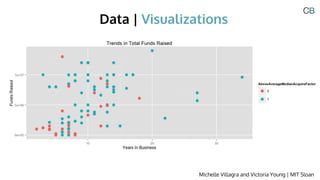
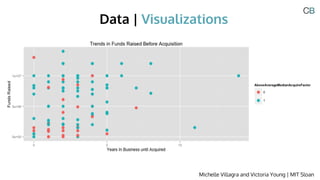
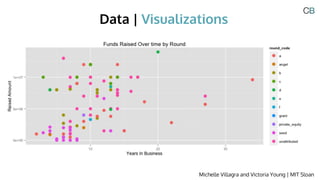


The document discusses signals that can predict if a startup will be acquired at an above average price of $43 million. The authors analyzed data on startups from Crunchbase and found the amount raised, year founded, total money raised, and year acquired were predictive. A classification and regression tree (CART) model had the best accuracy, showing $12 million raised as a predictor of above average acquisition. Clustering also grouped startups by traits like funding year, amount raised, and years to acquisition. The authors recommend expanding the data and variables to improve the models.


![[IJCAI2023] Using Deep Learning to Find the Next Unicorn: A Practical Synthes...](https://cdn.slidesharecdn.com/ss_thumbnails/ijcai-finnlp-muffin-ssp-240610092533-4bf6b418-thumbnail.jpg?width=640&height=640&fit=bounds)


![Getting Started with Apache Spark: Big Data Made Simple [Free Meetup]](https://cdn.slidesharecdn.com/ss_thumbnails/apachesparkgettingstarted-260203175547-8361bcc3-thumbnail.jpg?width=640&height=640&fit=bounds)


