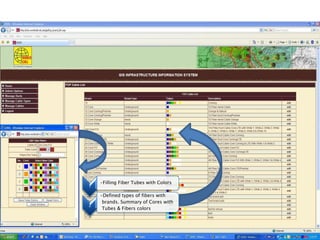
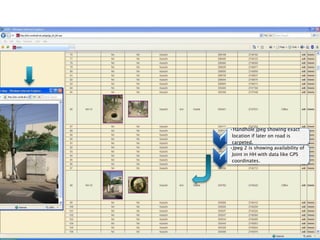
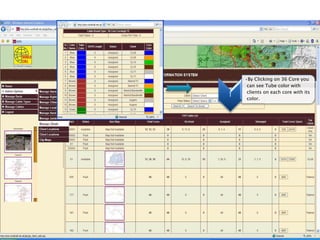
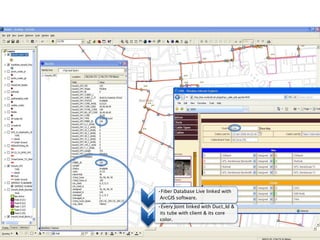
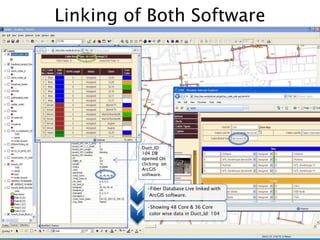
Introduction
The goal was to create databases for Fiber Optics operational updates,
information gathering, structuring, infrastructure managing, reporting and
finally mapping or linking with appropriate GIS related tool (Arc GIS).
Worldcall GIS & Software team developed GIS Fiber Optics software which is not
only FO information maintaining web-based software but have different databases
linked in such way that have Geographical views with it. This milestone
achievement is build according to WTL infrastructure & its environment which
saved companies costs in millions and will bring forth the Fiber & GIS expertise
knowledge that shares a common platform to operate more efficiently and produce
more value.
Next thirteen pictorial slides only covers major databases Summary pages that are
filled with actual data & linked with ArcGIS
Duct Entry
1
•Shows summary of new Duct entry with
linked Joints database.
2
•City complete duct route map with
Duct_Ids labeled. Click to enlarge
1
•Filling all Menus
2
•Filling Handhole data like, GPS
coordinates, visible/carpeted
status with 2 images option.
1
•Filling Fiber Tubes with Colors
2
•Defined types of fibers with
brands. Summary of Cores with
Tubes & Fibers colors
1
•Summary of Joints with related
information.
2
•Filling Joints data like, GPS
coordinates, with linked
Handhole database etc.
1
•Handhole jpeg showing exact
location if later on road is
carpeted.
2
•Jpeg 2 is showing availability of
Joint in HH with data like GPS
coordinates.
1
•Filling each tube color wise with
client on each fiber color wise.
2
•Fiber Assigned, Spare Damage
status with ODTR length option.
1
•Jpeg of that specific Duct_Id
highlighting its route.
2
•Summary of all Databases on all
Duct_Id’s with view of linked
data on same page.
1
•By Clicking on 36 Core you
can see Tube color with
clients on each core with its
color.
1
•You can see Spare / Damaged
cores with colors.
2
•On same page you can see HH
data with pics for that particular
Duct_Id.
Database
1
•Fiber Database Live linked with
ArcGIS software.
2
•Every Joint linked with Duct_Id &
its tube with client & its core
color.
Linking of Both Software
1
•Fiber Database Live linked with
ArcGIS software.
2
•Showing 48 Core & 36 Core
color wise data in Duct_Id: 104
Duct_ID
104 DB
opened On
clicking on
ArcGIS
software.
Comparison Between WTL & Original M&M Software
Fiber_GIS_Software2010

Fiber_GIS_Software2010

  • 1.
    Introduction The goal wasto create databases for Fiber Optics operational updates, information gathering, structuring, infrastructure managing, reporting and finally mapping or linking with appropriate GIS related tool (Arc GIS). Worldcall GIS & Software team developed GIS Fiber Optics software which is not only FO information maintaining web-based software but have different databases linked in such way that have Geographical views with it. This milestone achievement is build according to WTL infrastructure & its environment which saved companies costs in millions and will bring forth the Fiber & GIS expertise knowledge that shares a common platform to operate more efficiently and produce more value.
  • 2.
    Next thirteen pictorialslides only covers major databases Summary pages that are filled with actual data & linked with ArcGIS
  • 3.
    Duct Entry 1 •Shows summaryof new Duct entry with linked Joints database. 2 •City complete duct route map with Duct_Ids labeled. Click to enlarge
  • 4.
    1 •Filling all Menus 2 •FillingHandhole data like, GPS coordinates, visible/carpeted status with 2 images option.
  • 5.
    1 •Filling Fiber Tubeswith Colors 2 •Defined types of fibers with brands. Summary of Cores with Tubes & Fibers colors
  • 6.
    1 •Summary of Jointswith related information. 2 •Filling Joints data like, GPS coordinates, with linked Handhole database etc.
  • 7.
    1 •Handhole jpeg showingexact location if later on road is carpeted. 2 •Jpeg 2 is showing availability of Joint in HH with data like GPS coordinates.
  • 8.
    1 •Filling each tubecolor wise with client on each fiber color wise. 2 •Fiber Assigned, Spare Damage status with ODTR length option.
  • 9.
    1 •Jpeg of thatspecific Duct_Id highlighting its route. 2 •Summary of all Databases on all Duct_Id’s with view of linked data on same page.
  • 10.
    1 •By Clicking on36 Core you can see Tube color with clients on each core with its color.
  • 11.
    1 •You can seeSpare / Damaged cores with colors. 2 •On same page you can see HH data with pics for that particular Duct_Id.
  • 12.
  • 13.
    1 •Fiber Database Livelinked with ArcGIS software. 2 •Every Joint linked with Duct_Id & its tube with client & its core color.
  • 14.
    Linking of BothSoftware 1 •Fiber Database Live linked with ArcGIS software. 2 •Showing 48 Core & 36 Core color wise data in Duct_Id: 104 Duct_ID 104 DB opened On clicking on ArcGIS software.
  • 16.
    Comparison Between WTL& Original M&M Software