Presentation on status of Oceanic Blue Carbon science and knowledge gaps. Presented at the Global Ocean Commission's High Seas Symposium, 12 November 2015.
This plain English fact sheet outlines the work done by the EPA in monitoring Ireland’s rivers.
Ireland has more than 73,000 km of river channels. If placed end-to-end, they could encircle the Earth almost twice. Three-quarters of these channels are very small streams that typically flow into larger rivers.
Biological monitoring has been carried out in Irish rivers since 1971. The current national river monitoring programme covers more than 13,000 km of river channel.
The national monitoring programme is run by the EPA and focuses on the main river channels rather than the smaller streams. The programme includes more than 2,800 sites sampled for biology, with almost half of these being sampled for physical and chemical parameters.
This plain English fact sheet outlines the work done by the EPA in monitoring phytoplankton in Ireland's marine environment.
The EPA and the Marine Institute sample phytoplankton in estuaries and coastal waters around Ireland. They carry out sampling three times during the summer and once during winter. At each location, they take water samples just below the surface and above the seabed. They use the samples to assess how much phytoplankton is in the water and what species are present.
Phytoplankton are tiny, free-floating plants found suspended in the world’s oceans. Their name comes from Greek and means ‘plant drifter’. They are carried along by ocean currents and are usually found floating near the surface of the water. Like all plants they need sunlight to grow.
The main sources of nutrients around Ireland’s coast are discharges from wastewater treatment plants and run off from agricultural land. Phytoplankton in the estuaries and coastal waters around Ireland are monitored by the EnvironmentalProtection Agency (EPA) and the Marine Institute. They monitor phytoplankton to assess the quality (status) of our marine environment. They must do this as part of the requirements of the European Water Framework Directive.
The oceans are getting acidified! How? Why? What can we do?
For answers... Check the Presentation out
(Just a bit more informative than my previous one)
This plain English fact sheet outlines the work done by the EPA in monitoring Ireland’s lakes.
A total of 225 lakes are currently included as part of the national surface waters monitoring programme run by the EPA, this covers around 80% of the surface area of all lakes in Ireland.
This includes:
• all lakes greater than 50 hectares
• lakes that are used for supplying drinking water
• lakes that are of regional, local or scientific interest
This Plain English fact sheet outlines the work done by the EPA in monitoring aquatic plants in Irish lakes.
Aquatic plants are good at showing if the quality of the water is good or bad and play an important role in lake ecology by providing food and a habitat for many smaller plants, animals and birds.
They also:
• provide shelter for young fish
• help to improve the clarity of the water
• help stabilise lake shore banks
• reduce the amount of sediment being suspended in the water
The Environmental Protection Agency (EPA) monitors these aquatic plants at more than 10,000 sites in over 200 lakes once every three years.
OCEAN ACIDIFICATION IS HUGE PROBLEM.
IT IS POLUTING OCEAN AND EFFECTS SEA LIFE.
PEOPLE HAVE TO GIVE ATTENTION ON IT. THIS PPT IS
SPECIALLY FOR DESCRIBE THIS PROBLEM AND GIVE AN
EXPLAINATION TO ALL. BY THE END OF 2100TH CENTURY
IT WILL BECOME MORE CRITICAL AND DESTROY OCEAN
LIFE.
This is a small presentation on ocean acidification.It is a compilation of all materials(including present information) I collected related to it, any new information beside this or concerning it please comment.
Anderson et al. SEAC 2014 "Linking Archaeological Data At A Large Scale"dinaa_proj
A crucial challenge facing archaeologists is using the vast quantities of data we are generating for research, management, and public education. The DINAA project provides online methods for linking non-sensitive archaeological data from a wide array of sources, to explore questions of human-environmental interaction at multiple geospatial and temporal scales, in the past, present, and future. A multi-institutional collaborative effort, DINAA provides a framework for distributed linked open data initiatives in North American archaeology; promotes greater interaction between data generators, managers, and users; and helps promote a greater appreciation for archaeology among researchers, resource managers, and the general
public.
Lead accumulation in White-Mangrove, Avicenniaalba (Blume), inhabiting densel...Innspub Net
Coastal area of East Java Sea has long been threatened by industrial source pollution, mangrove conversion into shrimp culture, over fishing, destructive fishing, sedimentation, and coastal settlement. Heavy-metal is probably the most threat that directly influencing human health. This study was carried out in two coastal areas considered central to the threat, Kedawang and GunungAnyar. Lead concentration was measured in the water, sediments, and white-mangrove, Avicenniaalba. It showed that heavy-metal has been accumulated in the sediments. Root of mangrove tree can up take and bio-concentrating this lead heavy metal up to 5.74 mg kg-1 dry weight. The concentration in the leaves and seeds were significantly lower as it frequently exuviate, drop down, and regenerated. This metal concentration was higher than the allowable concentration (Ministerial Decree of State Environment No. 51 year 2004). Measures have to be taken in order to maintain coastal area healthy for human population.
Get the full articles at: http://www.innspub.net/volume-6-number-5-may-2015-jbes/
1. Heavy Metal Mining and the Potential Contamination of
Sensitive Marine Habitats in Coastal Alaska
Justin Fehntrich
Stony Brook University
Abstract:
Alaska has a thriving mining industry that supplies
many useful commodities to industry including heavy
metals. Elements such as mercury, arsenic, lead and
cadmium are among those commodities mined in
Alaska that have a direct correlation with marine life by
being the most common contaminants found in fish
consumed by humans such as Chinook salmon. Mine
spills and accidents account for a proportion of those
materials that become marine pollutants when they
make their way into ground water and rivers leading to
pristine marine environments. For this research project
I utilized ArcMap Version 10.3.1 along with data from
the United States Geological Survey (USGS) and the
Alaska State Geo-Spatial Data Clearinghouse (ASGDC).
The purpose of this project was to assess heavy metal
contamination and potential risks to biological systems
by conduction trends analysis for areas which are
regularly fished commercially around Alaska’s coastline.
The Cook Inlet is the area most susceptible to
contamination due to the Susitna River mouth. This
research is important for public health awareness as
well as a guide for the Alaskan fishing industry by
providing information about which areas are safest to
fish. This project can also generate awareness about
serious environmental threats that can be remediated
by making improvements to mine safety protocols and
providing educational outreach to potential consumers
of the Alaskan fishery.
Figure 1: Mine Proximity to Rivers. This map shows the locations of
mines in Alaska that produce heavy metals as commodity. The
different elements are color coded.
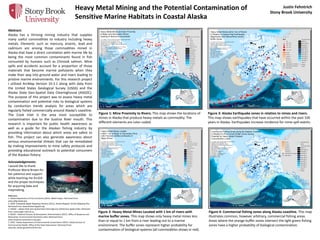
Figure 2: Heavy Metal Mines Located with 1 km of rivers with
marine buffer zones. This map shows only heavy metal mines less
than or equal to 1 km from a river leading out to a marine
environment. The buffer zones represent higher probability for
contamination of biological systems (all commodities shows in red).
Figure 3: Alaska Earthquake zones in relation to mines and rivers.
This map shows earthquakes that have occurred within the past 100
years in Alaska. Earthquakes increase incidence for mine-spill events.
Figure 4: Commercial fishing zones along Alaska coastline. This map
illustrates common, however arbitrary, commercial fishing areas.
Areas where the orange buffer zones intersect the light green fishing
zones have a higher probability of biological contamination.
Chinook Salmon. Photo: www.wildretreat.com
Acknowledgements:
I would like to thank
Professor Maria Brown for
her patience and support
while teaching me ArcGIS
and the proper techniques
for acquiring data and
mapmaking.
References:
1. Alaska Department of Fish and Game (2015). MESA Project. Retrieved from:
www.adfg.alaska.gov.
2. SDMI: Statewide Digital Mapping Initiative (2012). Alaska Mapped: ArcGIS Mapping Files
Retrieved from: www.alaskamapped.org
3. ASGDC – Alaska State Geo-Spatial Data Clearinghouse (2010) Geo-Spatial Data. Retrieved
from: www.asgdc.state.ak.us.
4. NOAA – National Oceanic & Atmospheric Administration (2015). Office of Response and
Restoration. Environmental Sensitivity Index. Retrieved from:
www.response.restoration.noaa.gov
5. ADEC: Alaska Department of Environmental Conservation (2015). Alaska Division of
Environmental Health, Office of the State Veterinarian. Retrieved from:
www.dec.alaska.gov/eh/vet/fish.htm