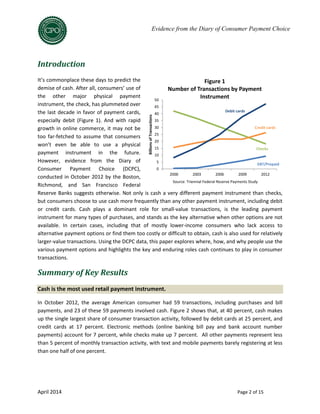
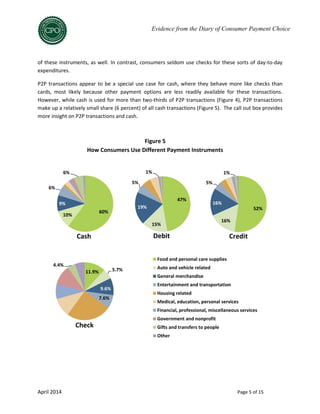
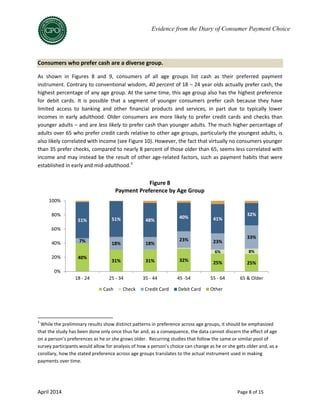
1) Cash continues to play a dominant role in consumer spending, accounting for 40% of all consumer transactions based on number, though only 14% based on value.
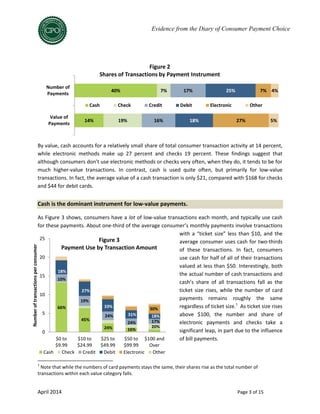
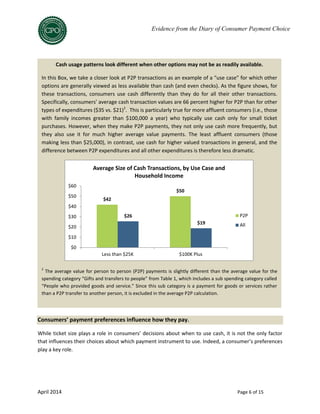
2) Cash is used most frequently for small-value transactions under $50, accounting for half of such transactions on average.
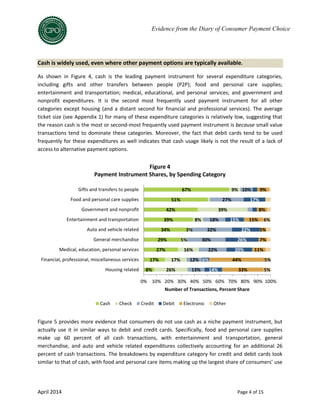
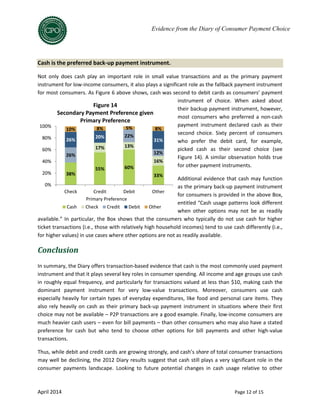
3) Cash remains widely used across various spending categories, including food, entertainment, and services, even where alternative payment options are typically available.
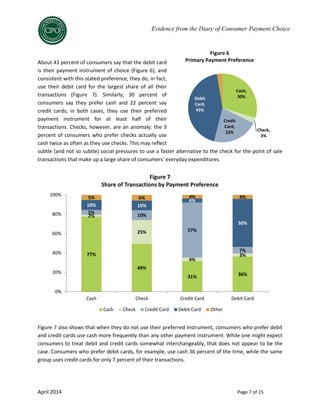
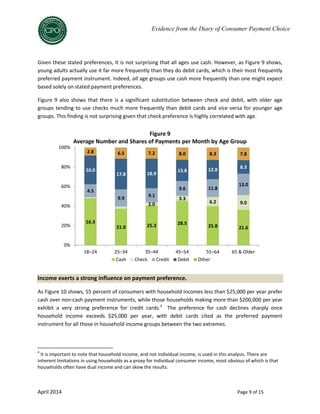
4) Consumer payment preferences strongly influence payment choice, with those preferring cash using it for about half their transactions on average, while preferences also correlate with factors like age, income level, and access to financial products.
FIS Research - Accelerating Paper Check MigrationPaul McAdam
Recent research conducted by FIS with 3,205 consumers reveals that migration away from paper checks to debit card, credit card, automated clearing house and other electronic payment services could be accelerated through a combination of motivators and removal of barriers especially for consumer-to-consumer payments. The demise of paper checks would represent a substantial expense reduction for financial institutions as well as revenue enhancement opportunity through shifting check volume to card payments, which generate interchange revenue. However, checks won’t disappear overnight and likely won’t decline much at all among some consumers without significant intervention.
The payments landscape has changed significantly and bankers must adapt or be disintermediated by those changes. Check volume will continue to diminish, remote
deposit capture will continue to proliferate, and coin and currency are here to stay.
Online and mobile banking, coupled with increased ATM functionality, will drive consumer banking while non-bank payments and digital wallet services such as Apple Pay are becoming more widely accepted among both consumers and their financial institutions.
New regulations and increased regulatory scrutiny will continue to drive up banks’ costs, while new risks will necessitate improved governance, risk management,
automation, and compliance systems. Banks must re-engineer their commercial deposit products, operations, risk management and cost structures in order to remain competitive and profitable. All of this affects the way that businesses interface with their banks and the costs they bear as customers.
[Abstract] Demonetisation: Push Towards a Digital EconomyShreyas Kamath
Presented at Guru Nanak College of Arts, Science & Commerce.
The paper identified the required infrastructure for sustaining the impacts of demonetisation on financial technology and consumer behavior.
Overcoming the Demographic Disadvantages of Community Banking (jan 2012)Paul McAdam
Community banks are at a disadvantage in terms of customer relationship expansion, mostly because the community bank customer base has less income and future earnings potential. The affluence gap between the community bank customer and the average bank customer results in community bank customers holding lower-than-average investable assets and loans overall, with correspondingly less opportunity. This article examines the degree to which customer demographics and geographic location influence both the composition and the financial behaviors of community bank customers and points out where community banks are really missing out.
By Paul McAdam
SVP, Research & Thought Leadership
Fidelity National Information Services
The Drive to Electronic Remittance Exchange in Business-to Business Payment A...Nasreen Quibria
The white paper explores the current state of B2B remittance exchange processes in the U.S. and Europe, spotlights shifting dynamics of key geographies, and highlights recent developments in remittance data standards that will shape the future for stakeholders in the financial value chain.
The Fintech industry which is the backbone of all economies has also been impacted because of Covid. What are the implications of Covid to an important sector?
Reference: Mobile payment industry in china 2012-2015 C. Keiko Funahashi
Referenced in presentation, "The Seven Wonders of China's Mobile World"
http://www.slideshare.net/ckeikofunahashi/m-learncon-session-907-ckeikofunahashi
Alternative lending options have grown rapidly over the past 10 years. This deck offers an overview of digital credit and key takeaways from contexts around the world.
For 1000's of years across the globe the physical exchange of money has dominated. Within a decade cash has become virtually invisible, digital transactions dominate, then it's without a doubt in my mind; critical that I sit up and take heed of the wave of crypto-currency. Even more so, with the unstoppable develop and deployment of the Blockchain technology!
Payments innovation is Critical for Every Global EnterpriseXTRMAccount
As fintech software and service innovations continue to disrupt the Financial Services market, even non-financial firms need to think about how to take advantage of this trend to improve
their payments processes for the benefit of the company, their customers and their partners.
The fourth industrial revolution which is characterized by highly digitalized system, has
changed the way we do almost everything. That includes the financial system that has exerted pressure
to go on-line as in the case of electronic money. One of the variants of e-money is the use of Card
Loading System. In card loading system, the accountholder opens an account and given the card that
stores the value loaded into it.
Digital Payments: Level the Playing Field to Leverage the PotentialCUTS International
The digital payments sector in India is facing tectonic shifts. Entities with divergent business models, subject to diverse regulations, are competing for a pie in the market share.
This report takes a stock of the existing business models in the digital payments sectors and reviews the applicable regulatory framework to such business models.
The objective is to ascertain if level playing field exists for the market players in the sector to compete efficiently. The report takes a step further and analyses reasons for lack of level playing field in the sector, highlights adverse impacts of such situation on consumer welfare.
The report concludes with providing specific recommendations to level the playing field for leveraging the potential of digital payments in the sector.
eWallets
Easy and secure to use, this
is quickly growing payment
method becoming
increasingly popular across
all sectors. Consumers can
either use stored value or
take funds from a payment
type linked to their eWallet,
giving them choice and
convenience.
eInvoices
When using eInvoices,
consumers can pay for
goods after delivery,
without sharing credit card
or bank details.
It can be as simple as
entering their email
address and postcode to
make a payment.
Fear and favoring of digital currency
The Economist Intelligence Unit, commissioned by Crypto.com, exploring the extent to which digital payments are trusted by consumers and what barriers may exist to basic monetary functions becoming predominantly electronic or digital.
Bill paying habits among accounting and accounts payable professionals are far more advanced at home, where they use a number of electronic payment methods, than at work, where they overwhelmingly rely on paper checks.
The Fiserv Consumer Trends Survey is one of the industry's longest running surveys of consumer financial habits. It highlights opportunities for financial institutions to better understand and expand their digital reach to all consumer segments.
Even before the pandemic struck, the payment industry was quite dynamic over the past few years. Double-digit growth rates, dizzy valuations, and technological advancements at an unprecedented rate are some of the indicators that prove it. However, one must not underestimate the small volume decline due to COVID-19.
The Future of Mobile Payments – Role of mobile wallets in consumer purchase j...Data N Charts
This report will look into why US consumers aren’t warming up to mobile payment services and how mobile wallets can integrate shopping and peer-to-peer transfers to make payments relevant with smartphone owners for wider adoption.
Beyond Payment - E-Commerce Trends and Payment Challenges for Online Merchant...Lawrence Cheok
Written with e-commerce finance professionals in mind, this paper provides insights and recommendations for businesses interested in expanding their e-commerce operations internationally. It relates to online merchants needing to look beyond the web front-end and consider additional factors like back-office operations and banking infrastructure. Payment options discussed include e-wallets and mobile wallets, e-banking, and escrow payments, which are gaining favor in developing markets like China
UK Water Billing | A Consumer Research Report (2019)EchoMarketing
1,000 UK consumers share their views on water bills and billing processes including billing preferences, billing experiences and the improvements they'd like to see from their water suppliers.
Personal Brand Statement:
As an Army veteran dedicated to lifelong learning, I bring a disciplined, strategic mindset to my pursuits. I am constantly expanding my knowledge to innovate and lead effectively. My journey is driven by a commitment to excellence, and to make a meaningful impact in the world.
VAT Registration Outlined In UAE: Benefits and Requirementsuae taxgpt
Vat Registration is a legal obligation for businesses meeting the threshold requirement, helping companies avoid fines and ramifications. Contact now!
https://viralsocialtrends.com/vat-registration-outlined-in-uae/
Kseniya Leshchenko: Shared development support service model as the way to ma...Lviv Startup Club
Kseniya Leshchenko: Shared development support service model as the way to make small projects with small budgets profitable for the company (UA)
Kyiv PMDay 2024 Summer
Website – www.pmday.org
Youtube – https://www.youtube.com/startuplviv
FB – https://www.facebook.com/pmdayconference
Cracking the Workplace Discipline Code Main.pptxWorkforce Group
Cultivating and maintaining discipline within teams is a critical differentiator for successful organisations.
Forward-thinking leaders and business managers understand the impact that discipline has on organisational success. A disciplined workforce operates with clarity, focus, and a shared understanding of expectations, ultimately driving better results, optimising productivity, and facilitating seamless collaboration.
Although discipline is not a one-size-fits-all approach, it can help create a work environment that encourages personal growth and accountability rather than solely relying on punitive measures.
In this deck, you will learn the significance of workplace discipline for organisational success. You’ll also learn
• Four (4) workplace discipline methods you should consider
• The best and most practical approach to implementing workplace discipline.
• Three (3) key tips to maintain a disciplined workplace.
Unveiling the Secrets How Does Generative AI Work.pdfSam H
At its core, generative artificial intelligence relies on the concept of generative models, which serve as engines that churn out entirely new data resembling their training data. It is like a sculptor who has studied so many forms found in nature and then uses this knowledge to create sculptures from his imagination that have never been seen before anywhere else. If taken to cyberspace, gans work almost the same way.
Skye Residences | Extended Stay Residences Near Toronto Airportmarketingjdass
Experience unparalleled EXTENDED STAY and comfort at Skye Residences located just minutes from Toronto Airport. Discover sophisticated accommodations tailored for discerning travelers.
Website Link :
https://skyeresidences.com/
https://skyeresidences.com/about-us/
https://skyeresidences.com/gallery/
https://skyeresidences.com/rooms/
https://skyeresidences.com/near-by-attractions/
https://skyeresidences.com/commute/
https://skyeresidences.com/contact/
https://skyeresidences.com/queen-suite-with-sofa-bed/
https://skyeresidences.com/queen-suite-with-sofa-bed-and-balcony/
https://skyeresidences.com/queen-suite-with-sofa-bed-accessible/
https://skyeresidences.com/2-bedroom-deluxe-queen-suite-with-sofa-bed/
https://skyeresidences.com/2-bedroom-deluxe-king-queen-suite-with-sofa-bed/
https://skyeresidences.com/2-bedroom-deluxe-queen-suite-with-sofa-bed-accessible/
#Skye Residences Etobicoke, #Skye Residences Near Toronto Airport, #Skye Residences Toronto, #Skye Hotel Toronto, #Skye Hotel Near Toronto Airport, #Hotel Near Toronto Airport, #Near Toronto Airport Accommodation, #Suites Near Toronto Airport, #Etobicoke Suites Near Airport, #Hotel Near Toronto Pearson International Airport, #Toronto Airport Suite Rentals, #Pearson Airport Hotel Suites
Business Valuation Principles for EntrepreneursBen Wann
This insightful presentation is designed to equip entrepreneurs with the essential knowledge and tools needed to accurately value their businesses. Understanding business valuation is crucial for making informed decisions, whether you're seeking investment, planning to sell, or simply want to gauge your company's worth.
Memorandum Of Association Constitution of Company.pptseri bangash
www.seribangash.com
A Memorandum of Association (MOA) is a legal document that outlines the fundamental principles and objectives upon which a company operates. It serves as the company's charter or constitution and defines the scope of its activities. Here's a detailed note on the MOA:
Contents of Memorandum of Association:
Name Clause: This clause states the name of the company, which should end with words like "Limited" or "Ltd." for a public limited company and "Private Limited" or "Pvt. Ltd." for a private limited company.
https://seribangash.com/article-of-association-is-legal-doc-of-company/
Registered Office Clause: It specifies the location where the company's registered office is situated. This office is where all official communications and notices are sent.
Objective Clause: This clause delineates the main objectives for which the company is formed. It's important to define these objectives clearly, as the company cannot undertake activities beyond those mentioned in this clause.
www.seribangash.com
Liability Clause: It outlines the extent of liability of the company's members. In the case of companies limited by shares, the liability of members is limited to the amount unpaid on their shares. For companies limited by guarantee, members' liability is limited to the amount they undertake to contribute if the company is wound up.
https://seribangash.com/promotors-is-person-conceived-formation-company/
Capital Clause: This clause specifies the authorized capital of the company, i.e., the maximum amount of share capital the company is authorized to issue. It also mentions the division of this capital into shares and their respective nominal value.
Association Clause: It simply states that the subscribers wish to form a company and agree to become members of it, in accordance with the terms of the MOA.
Importance of Memorandum of Association:
Legal Requirement: The MOA is a legal requirement for the formation of a company. It must be filed with the Registrar of Companies during the incorporation process.
Constitutional Document: It serves as the company's constitutional document, defining its scope, powers, and limitations.
Protection of Members: It protects the interests of the company's members by clearly defining the objectives and limiting their liability.
External Communication: It provides clarity to external parties, such as investors, creditors, and regulatory authorities, regarding the company's objectives and powers.
https://seribangash.com/difference-public-and-private-company-law/
Binding Authority: The company and its members are bound by the provisions of the MOA. Any action taken beyond its scope may be considered ultra vires (beyond the powers) of the company and therefore void.
Amendment of MOA:
While the MOA lays down the company's fundamental principles, it is not entirely immutable. It can be amended, but only under specific circumstances and in compliance with legal procedures. Amendments typically require shareholder
"𝑩𝑬𝑮𝑼𝑵 𝑾𝑰𝑻𝑯 𝑻𝑱 𝑰𝑺 𝑯𝑨𝑳𝑭 𝑫𝑶𝑵𝑬"
𝐓𝐉 𝐂𝐨𝐦𝐬 (𝐓𝐉 𝐂𝐨𝐦𝐦𝐮𝐧𝐢𝐜𝐚𝐭𝐢𝐨𝐧𝐬) is a professional event agency that includes experts in the event-organizing market in Vietnam, Korea, and ASEAN countries. We provide unlimited types of events from Music concerts, Fan meetings, and Culture festivals to Corporate events, Internal company events, Golf tournaments, MICE events, and Exhibitions.
𝐓𝐉 𝐂𝐨𝐦𝐬 provides unlimited package services including such as Event organizing, Event planning, Event production, Manpower, PR marketing, Design 2D/3D, VIP protocols, Interpreter agency, etc.
Sports events - Golf competitions/billiards competitions/company sports events: dynamic and challenging
⭐ 𝐅𝐞𝐚𝐭𝐮𝐫𝐞𝐝 𝐩𝐫𝐨𝐣𝐞𝐜𝐭𝐬:
➢ 2024 BAEKHYUN [Lonsdaleite] IN HO CHI MINH
➢ SUPER JUNIOR-L.S.S. THE SHOW : Th3ee Guys in HO CHI MINH
➢FreenBecky 1st Fan Meeting in Vietnam
➢CHILDREN ART EXHIBITION 2024: BEYOND BARRIERS
➢ WOW K-Music Festival 2023
➢ Winner [CROSS] Tour in HCM
➢ Super Show 9 in HCM with Super Junior
➢ HCMC - Gyeongsangbuk-do Culture and Tourism Festival
➢ Korean Vietnam Partnership - Fair with LG
➢ Korean President visits Samsung Electronics R&D Center
➢ Vietnam Food Expo with Lotte Wellfood
"𝐄𝐯𝐞𝐫𝐲 𝐞𝐯𝐞𝐧𝐭 𝐢𝐬 𝐚 𝐬𝐭𝐨𝐫𝐲, 𝐚 𝐬𝐩𝐞𝐜𝐢𝐚𝐥 𝐣𝐨𝐮𝐫𝐧𝐞𝐲. 𝐖𝐞 𝐚𝐥𝐰𝐚𝐲𝐬 𝐛𝐞𝐥𝐢𝐞𝐯𝐞 𝐭𝐡𝐚𝐭 𝐬𝐡𝐨𝐫𝐭𝐥𝐲 𝐲𝐨𝐮 𝐰𝐢𝐥𝐥 𝐛𝐞 𝐚 𝐩𝐚𝐫𝐭 𝐨𝐟 𝐨𝐮𝐫 𝐬𝐭𝐨𝐫𝐢𝐞𝐬."
What is the TDS Return Filing Due Date for FY 2024-25.pdfseoforlegalpillers
It is crucial for the taxpayers to understand about the TDS Return Filing Due Date, so that they can fulfill your TDS obligations efficiently. Taxpayers can avoid penalties by sticking to the deadlines and by accurate filing of TDS. Timely filing of TDS will make sure about the availability of tax credits. You can also seek the professional guidance of experts like Legal Pillers for timely filing of the TDS Return.
The world of search engine optimization (SEO) is buzzing with discussions after Google confirmed that around 2,500 leaked internal documents related to its Search feature are indeed authentic. The revelation has sparked significant concerns within the SEO community. The leaked documents were initially reported by SEO experts Rand Fishkin and Mike King, igniting widespread analysis and discourse. For More Info:- https://news.arihantwebtech.com/search-disrupted-googles-leaked-documents-rock-the-seo-world/
Search Disrupted Google’s Leaked Documents Rock the SEO World.pdf
Fed notes evidence_from_dcpc
1. Cash Continues to Play a Key Role in Consumer Spending:
Evidence from the Diary of Consumer Payment Choice
By: Barbara Bennett, Douglas Conover,
Shaun O’Brien, and Ross Advincula
April 2014
The views in this paper are solely the responsibility of the authors and should not be interpreted as reflecting the
views of the Federal Reserve Bank of San Francisco or the Board of Governors of the Federal Reserve System.
2. April 2014 Page 2 of 15
Evidence from the Diary of Consumer Payment Choice
Introduction
It’s commonplace these days to predict the
demise of cash. After all, consumers’ use of
the other major physical payment
instrument, the check, has plummeted over
the last decade in favor of payment cards,
especially debit (Figure 1). And with rapid
growth in online commerce, it may not be
too far-fetched to assume that consumers
won’t even be able to use a physical
payment instrument in the future.
However, evidence from the Diary of
Consumer Payment Choice (DCPC),
conducted in October 2012 by the Boston,
Richmond, and San Francisco Federal
Reserve Banks suggests otherwise. Not only is cash a very different payment instrument than checks,
but consumers choose to use cash more frequently than any other payment instrument, including debit
or credit cards. Cash plays a dominant role for small-value transactions, is the leading payment
instrument for many types of purchases, and stands as the key alternative when other options are not
available. In certain cases, including that of mostly lower-income consumers who lack access to
alternative payment options or find them too costly or difficult to obtain, cash is also used for relatively
larger-value transactions. Using the DCPC data, this paper explores where, how, and why people use the
various payment options and highlights the key and enduring roles cash continues to play in consumer
transactions.
Summary of Key Results
Cash is the most used retail payment instrument.
In October 2012, the average American consumer had 59 transactions, including purchases and bill
payments, and 23 of these 59 payments involved cash. Figure 2 shows that, at 40 percent, cash makes
up the single largest share of consumer transaction activity, followed by debit cards at 25 percent, and
credit cards at 17 percent. Electronic methods (online banking bill pay and bank account number
payments) account for 7 percent, while checks make up 7 percent. All other payments represent less
than 5 percent of monthly transaction activity, with text and mobile payments barely registering at less
than one half of one percent.
Source: Triennial Federal Reserve Payments Study0
5
10
15
20
25
30
35
40
45
50
2000 2003 2006 2009 2012
BillionsofTransactions
Figure 1
Number of Transactions by Payment
Instrument
Debit cards
Credit cards
Checks
EBT/Prepaid
Source: Triennial Federal Reserve Payments Study
3. April 2014 Page 3 of 15
Evidence from the Diary of Consumer Payment Choice
By value, cash accounts for a relatively small share of total consumer transaction activity at 14 percent,
while electronic methods make up 27 percent and checks 19 percent. These findings suggest that
although consumers don’t use electronic methods or checks very often, when they do, it tends to be for
much higher-value transactions. In contrast, cash is used quite often, but primarily for low-value
transactions. In fact, the average value of a cash transaction is only $21, compared with $168 for checks
and $44 for debit cards.
Cash is the dominant instrument for low-value payments.
As Figure 3 shows, consumers have a lot of low-value transactions each month, and typically use cash
for these payments. About one-third of the average consumer’s monthly payments involve transactions
with a “ticket size” less than $10, and the
average consumer uses cash for two-thirds
of these transactions. In fact, consumers
use cash for half of all of their transactions
valued at less than $50. Interestingly, both
the actual number of cash transactions and
cash’s share of all transactions fall as the
ticket size rises, while the number of card
payments remains roughly the same
regardless of ticket size.1
As ticket size rises
above $100, the number and share of
electronic payments and checks take a
significant leap, in part due to the influence
of bill payments.
1
Note that while the numbers of card payments stays the same, their shares rise as the total number of
transactions within each value category falls.
14%
40%
19%
7%
16%
17%
18%
25%
27%
7%
5%
4%
Value of
Payments
Number of
Payments
Figure 2
Shares of Transactions by Payment Instrument
Cash Check Credit Debit Electronic Other
0
5
10
15
20
25
$0 to
$9.99
$10 to
$24.99
$25 to
$49.99
$50 to
$99.99
$100 and
Over
Numberoftransactionsperconsumer
Figure 3
Payment Use by Transaction Amount
Cash Check Credit Debit Electronic Other
66%
45%
24%
18%
3
10%
19%
24%
27%
33%
31% 18%
24% 17%
16%
30%
20%
4. April 2014 Page 4 of 15
Evidence from the Diary of Consumer Payment Choice
Cash is widely used, even where other payment options are typically available.
As shown in Figure 4, cash is the leading payment instrument for several expenditure categories,
including gifts and other transfers between people (P2P); food and personal care supplies;
entertainment and transportation; medical, educational, and personal services; and government and
nonprofit expenditures. It is the second most frequently used payment instrument for all other
categories except housing (and a distant second for financial and professional services). The average
ticket size (see Appendix 1) for many of these expenditure categories is relatively low, suggesting that
the reason cash is the most or second-most frequently used payment instrument is because small value
transactions tend to dominate these categories. Moreover, the fact that debit cards tend to be used
frequently for these expenditures as well indicates that cash usage likely is not the result of a lack of
access to alternative payment options.
Figure 5 provides more evidence that consumers do not use cash as a niche payment instrument, but
actually use it in similar ways to debit and credit cards. Specifically, food and personal care supplies
make up 60 percent of all cash transactions, with entertainment and transportation, general
merchandise, and auto and vehicle related expenditures collectively accounting for an additional 26
percent of cash transactions. The breakdowns by expenditure category for credit and debit cards look
similar to that of cash, with food and personal care items making up the largest share of consumers’ use
8%
17%
27%
29%
34%
39%
42%
51%
67%
26%
17%
16%
5%
3%
8%
39%
9%
13%
12%
22%
30%
32%
18%
27%
10%
14%
6%
20%
26%
22%
15%
17%
33%
44%
11%
7%
5%
15%
8%
9%
5%
5%
6%
0% 10% 20% 30% 40% 50% 60% 70% 80% 90% 100%
Housing related
Financial, professional, miscellaneous services
Medical, education, personal services
General merchandise
Auto and vehicle related
Entertainment and transportation
Government and nonprofit
Food and personal care supplies
Gifts and transfers to people
Number of Transactions, Percent Share
Figure 4
Payment Instrument Shares, by Spending Category
Cash Check Credit Debit Electronic Other
5. April 2014 Page 5 of 15
Evidence from the Diary of Consumer Payment Choice
of these instruments, as well. In contrast, consumers seldom use checks for these sorts of day-to-day
expenditures.
P2P transactions appear to be a special use case for cash, where they behave more like checks than
cards, most likely because other payment options are less readily available for these transactions.
However, while cash is used for more than two-thirds of P2P transactions (Figure 4), P2P transactions
make up a relatively small share (6 percent) of all cash transactions (Figure 5). The call out box provides
more insight on P2P transactions and cash.
60%
10%
9%
6%
6%
Cash
47%
15%
19%
5%
1%
Debit
52%
16%
16%
5%
1%
Credit
11.9% 5.7%
9.6%
7.6%
4.4%
Food and personal care supplies
Auto and vehicle related
General merchandise
Entertainment and transportation
Housing related
Medical, education, personal services
Financial, professional, miscellaneous services
Government and nonprofit
Gifts and transfers to people
Other
Check
Figure 5
How Consumers Use Different Payment Instruments
akljaf
6. April 2014 Page 6 of 15
Evidence from the Diary of Consumer Payment Choice
Consumers’ payment preferences influence how they pay.
While ticket size plays a role in consumers’ decisions about when to use cash, it is not the only factor
that influences their choices about which payment instrument to use. Indeed, a consumer’s preferences
play a key role.
Cash usage patterns look different when other options may not be as readily available.
In this Box, we take a closer look at P2P transactions as an example of a “use case” for which other
options are generally viewed as less available than cash (and even checks). As the figure shows, for
these transactions, consumers use cash differently than they do for all their other transactions.
Specifically, consumers’ average cash transaction values are 66 percent higher for P2P than for other
types of expenditures ($35 vs. $21)2
. This is particularly true for more affluent consumers (i.e., those
with family incomes greater than $100,000 a year) who typically use cash only for small ticket
purchases. However, when they make P2P payments, they not only use cash more frequently, but
they also use it for much higher average value payments. The least affluent consumers (those
making less than $25,000), in contrast, use cash for higher valued transactions in general, and the
difference between P2P expenditures and all other expenditures is therefore less dramatic.
2
The average value for person to person (P2P) payments is slightly different than the average value for the
spending category “Gifts and transfers to people” from Table 1, which includes a sub spending category called
“People who provided goods and service.” Since this sub category is a payment for goods or services rather
than a P2P transfer to another person, it is excluded in the average P2P calculation.
$42
$50
$26
$19
$0
$10
$20
$30
$40
$50
$60
Less than $25K $100K Plus
Average Size of Cash Transactions, by Use Case and
Household Income
P2P
All
7. April 2014 Page 7 of 15
Evidence from the Diary of Consumer Payment Choice
Cash,
30%
Check,
3%
Credit
Card,
22%
Debit
Card,
43%
Figure 6
Primary Payment PreferenceAbout 43 percent of consumers say that the debit card
is their payment instrument of choice (Figure 6), and
consistent with this stated preference, they do, in fact,
use their debit card for the largest share of all their
transactions (Figure 7). Similarly, 30 percent of
consumers say they prefer cash and 22 percent say
credit cards; in both cases, they use their preferred
payment instrument for at least half of their
transactions. Checks, however, are an anomaly: the 3
percent of consumers who prefer checks actually use
cash twice as often as they use checks. This may reflect
subtle (and not so subtle) social pressures to use a faster alternative to the check for the point of sale
transactions that make up a large share of consumers’ everyday expenditures.
Figure 7 also shows that when they do not use their preferred instrument, consumers who prefer debit
and credit cards use cash more frequently than any other payment instrument. While one might expect
consumers to treat debit and credit cards somewhat interchangeably, that does not appear to be the
case. Consumers who prefer debit cards, for example, use cash 36 percent of the time, while the same
group uses credit cards for only 7 percent of their transactions.
77%
49%
31% 36%
2%
25%
4%
3%
5%
10%
57%
7%
10% 10%
4%
50%
5% 6% 4% 4%
0%
20%
40%
60%
80%
100%
Cash Check Credit Card Debit Card
Figure 7
Share of Transactions by Payment Preference
Cash Check Credit Card Debit Card Other
8. April 2014 Page 8 of 15
Evidence from the Diary of Consumer Payment Choice
Consumers who prefer cash are a diverse group.
As shown in Figures 8 and 9, consumers of all age groups list cash as their preferred payment
instrument. Contrary to conventional wisdom, 40 percent of 18 – 24 year olds actually prefer cash, the
highest percentage of any age group. At the same time, this age group also has the highest preference
for debit cards. It is possible that a segment of younger consumers prefer cash because they have
limited access to banking and other financial products and services, in part due to typically lower
incomes in early adulthood. Older consumers are more likely to prefer credit cards and checks than
younger adults – and are less likely to prefer cash than younger adults. The much higher percentage of
adults over 65 who prefer credit cards relative to other age groups, particularly the youngest adults, is
also likely correlated with income (see Figure 10). However, the fact that virtually no consumers younger
than 35 prefer checks, compared to nearly 8 percent of those older than 65, seems less correlated with
income and may instead be the result of other age-related factors, such as payment habits that were
established in early and mid-adulthood.3
3
While the preliminary results show distinct patterns in preference across age groups, it should be emphasized
that the study has been done only once thus far and, as a consequence, the data cannot discern the effect of age
on a person’s preferences as he or she grows older. Recurring studies that follow the same or similar pool of
survey participants would allow for analysis of how a person’s choice can change as he or she gets older and, as a
corollary, how the stated preference across age groups translates to the actual instrument used in making
payments over time.
40%
31% 31% 32% 25% 25%
6% 8%
7% 18% 18%
23% 23%
33%
51% 51% 48%
40% 41%
32%
0%
20%
40%
60%
80%
100%
18 - 24 25 - 34 35 - 44 45 -54 55 - 64 65 & Older
Figure 8
Payment Preference by Age Group
Cash Check Credit Card Debit Card Other
9. April 2014 Page 9 of 15
Evidence from the Diary of Consumer Payment Choice
Given these stated preferences, it is not surprising that all ages use cash. However, as Figure 9 shows,
young adults actually use it far more frequently than they do debit cards, which is their most frequently
preferred payment instrument. Indeed, all age groups use cash more frequently than one might expect
based solely on stated payment preferences.
Figure 9 also shows that there is a significant substitution between check and debit, with older age
groups tending to use checks much more frequently than debit cards and vice versa for younger age
groups. This finding is not surprising given that check preference is highly correlated with age.
Income exerts a strong influence on payment preference.
As Figure 10 shows, 55 percent of consumers with household incomes less than $25,000 per year prefer
cash over non-cash payment instruments, while those households making more than $200,000 per year
exhibit a very strong preference for credit cards.4
The preference for cash declines sharply once
household income exceeds $25,000 per year, with debit cards cited as the preferred payment
instrument for all those in household income groups between the two extremes.
4
It is important to note that household income, and not individual income, is used in this analysis. There are
inherent limitations in using households as a proxy for individual consumer income, most obvious of which is that
households often have dual income and can skew the results.
16.3
21.0 25.3 28.5
25.8 21.6
2.0
3.3
6.2 9.0
4.5
9.9
9.1
9.6 11.8
13.0
10.0
17.8 18.9
13.8 12.8 8.3
2.8 6.5 7.2 8.0 8.3 7.8
0%
20%
40%
60%
80%
100%
18–24 25–34 35–44 45–54 55–64 65 & Older
Figure 9
Average Number and Shares of Payments per Month by Age Group
Cash Check Credit Debit Other
10. April 2014 Page 10 of 15
Evidence from the Diary of Consumer Payment Choice
Consistent with payment preference, Figure 11 shows that the highest income group uses credit cards
for more than 40 percent of their monthly transactions – much more frequently than any other payment
option. This likely is due to the fact that more affluent consumers tend to have better access to credit
and financial services and can take advantage of the incentives card issuers offer for using credit cards.
At the same time, the lowest income group uses cash far more frequently than all other options
combined. What is surprising, however, is that, despite the declining preference for cash as income
rises, all income groups use cash for around 22 transactions per month.
55%
29% 22% 16% 16% 14% 10%
5%
15% 24% 35% 37% 37%
66%
31%
51% 49% 46% 43% 40%
15%
0%
20%
40%
60%
80%
100%
Less than
$25K
$25k to $50K $50k to $75K $75K to $100K $100K to
$125K
$125K to
$200K
$200K Plus
Figure 10
Payment Preference by Household Income
Cash Check Credit Debit Other
0
10
20
30
40
50
60
70
80
Less than
$25K
$25K to $50K $50K to $75K $75K to
$100K
$100K to
$125K
$125K to
$200K
$200K Plus
AverageNumberofPaymentsperMonth
Figure 11
Payment Use by Household Income
Cash Check Credit Debit Electronic Other
57% 41% 38% 33% 33% 35% 33%
12% 18% 25% 25% 25%
41%
22%
28%
28% 25%
21%
20%
8%
11. April 2014 Page 11 of 15
Evidence from the Diary of Consumer Payment Choice
Low income consumers use cash differently.
Although all consumers use cash approximately the same number of times a month regardless of
income, those making less than $25,000 annually use cash for a much wider variety of transactions than
do those with higher household incomes. These consumers typically have a higher number of monthly
cash transactions with a ticket size valued at $25 or more than does any other household income group.
Specifically, those making less than $25,000 annually have an average of 5.1 such transactions a month
versus 3.2 for households earning more than $25,000. Consistent with this, the total value of low-
income consumers’ cash spending, at $558 per month, is much higher than any other income group’s
cash spending. Moreover, as Figures 12 and 13 show, low income consumers use cash much more
frequently for bill payments like housing than the average consumer. This likely is due, at least in part, to
a lack of access to banking and financial products. This finding is not surprising in light of various studies
of "unbanked and underbanked" U.S. consumers, many of whom also fall into the lower-income
category. For example, as a study by the FDIC found, low income consumers use cash because they view
most mainstream banking and financial products as too expensive or too difficult to obtain.5
5
FDIC National Survey of Unbanked and Underbanked Households – December 2009.
35%
11% 11%
28%
9%
24%
11%
5%
44%
26%
35%
16%
9%
22%
28%
39%
16% 18%
6%
0%
20%
40%
60%
80%
100%
Auto Housing Medical Financial
Figure 12
Payment Instrument Use for Bill
Payments by Low Income
Consumers
Cash Check Credit
Debit Electronic Other
14%
29% 29%
22%
5% 8%
12%
8%
14%
6%
64%
49%
38%
62%
6% 5% 8% 6%
0%
20%
40%
60%
80%
100%
Auto Housing Medical Financial
Figure 13
Payment Instrument Use for Bill
Payments Excluding Low Income
Consumers
Cash Check Credit
Debit Electronic Other
12. April 2014 Page 12 of 15
Evidence from the Diary of Consumer Payment Choice
Cash is the preferred back-up payment instrument.
Not only does cash play an important role in small value transactions and as the primary payment
instrument for low-income consumers, it also plays a significant role as the fallback payment instrument
for most consumers. As Figure 6 above shows, cash was second to debit cards as consumers’ payment
instrument of choice. When asked about
their backup payment instrument, however,
most consumers who preferred a non-cash
payment instrument declared cash as their
second choice. Sixty percent of consumers
who prefer the debit card, for example,
picked cash as their second choice (see
Figure 14). A similar observation holds true
for other payment instruments.
Additional evidence that cash may function
as the primary back-up payment instrument
for consumers is provided in the above Box,
entitled “Cash usage patterns look different
when other options may not be as readily
available.” In particular, the Box shows that the consumers who typically do not use cash for higher
ticket transactions (i.e., those with relatively high household incomes) tend to use cash differently (i.e.,
for higher values) in use cases where other options are not as readily available.
Conclusion
In summary, the Diary offers transaction-based evidence that cash is the most commonly used payment
instrument and that it plays several key roles in consumer spending. All income and age groups use cash
in roughly equal frequency, and particularly for transactions valued at less than $10, making cash the
dominant payment instrument for very low-value transactions. Moreover, consumers use cash
especially heavily for certain types of everyday expenditures, like food and personal care items. They
also rely heavily on cash as their primary back-up payment instrument in situations where their first
choice may not be available – P2P transactions are a good example. Finally, low-income consumers are
much heavier cash users – even for bill payments – than other consumers who may also have a stated
preference for cash but who tend to choose other options for bill payments and other high-value
transactions.
Thus, while debit and credit cards are growing strongly, and cash’s share of total consumer transactions
may well be declining, the 2012 Diary results suggest that cash still plays a very significant role in the
consumer payments landscape. Looking to future potential changes in cash usage relative to other
38%
55% 60%
33%
17% 13%
16%
26%
22%
12%
26%
20%
31%
10% 8% 5% 8%
0%
20%
40%
60%
80%
100%
Check Credit Debit Other
Primary Preference
Figure 14
Secondary Payment Preference given
Primary Preference
Cash Check Credit Debit Other
13. April 2014 Page 13 of 15
Evidence from the Diary of Consumer Payment Choice
payment instruments, the Federal Reserve will continue its work to understand how the continued
growth of debit cards, the expansion of prepaid cards among the unbanked, and novel P2P solutions
may influence how consumers use cash, and the potential effects on the Fed’s cash business.
About the Cash Product Office
As the nation’s central bank, the Federal Reserve ensures that cash is available when and where it is
needed, including in times of crisis and business disruption, by providing FedCash® Services to depository
institutions and, through them, to the general public. In fulfilling this role, the Fed’s primary
responsibility is to maintain public confidence in the integrity and availability of U.S. currency.
The Federal Reserve System’s Cash Product Office (CPO) provides strategic leadership for this key
function by formulating and implementing service level policies, operational guidance, and technology
strategies for U.S. currency and coin services provided by Federal Reserve Banks nationally and
internationally. In addition to guiding policies and procedures, the CPO establishes budget guidance for
FedCash® Services, provides support for Federal Reserve currency and coin inventory management, and
supports business continuity planning at the supply chain level. It also conducts market research and
works directly with financial institutions and retailers to analyze trends in cash usage.
14. April 2014 Page 14 of 15
Evidence from the Diary of Consumer Payment Choice
Appendix 1
Table 1: Average Purchases per Month, by Spending Category
Cash Check Credit Debit Electronic Other Total
Food and
Personal Care
Supplies
Average Number
of Purchases
14.3 0.5 4.8 7.5 0.0 1.1 28.2
Average
Transaction Value
$14 $53 $32 $29 $173 $25 $23
Auto and
Vehicle Related
Average Number
of Purchases
2.4 0.2 1.6 2.3 0.4 0.3 7.1
Average
Transaction Value
$31 $214 $51 $53 $357 $58 $65
General
Merchandise
Average Number
of Purchases
2.2 0.4 2.0 2.3 0.5 0.2 7.5
Average
Transaction Value
$22 $127 $71 $47 $107 $37 $54
Entertainment
Merchandise
Average Number
of Purchases
1.4 0.3 0.5 0.7 0.6 0.2 3.7
Average
Transaction Value
$22 $95 $92 $70 $128 $53 $64
Housing
Related
Average Number
of Purchases
0.3 1.0 0.5 0.5 1.2 0.2 3.7
Average
Transaction Value
$136 $271 $113 $117 $296 $229 $224
Medical,
Education, and
Personal
Service
Average Number
of Purchases
0.7 0.4 0.5 0.5 0.3 0.1 2.5
Average
Transaction Value
$26 $87 $127 $84 $168 $145 $89
Financial,
Professional,
and
Miscellaneous
Services
Average Number
of Purchases
0.3 0.3 0.1 0.2 0.8 0.1 1.8
Average
Transaction Value
$46 $319 $98 $101 $202 $146 $176
Government
and Non Profit
Average Number
of Purchases
0.5 0.4 0.0 0.0 0.1 0.0 1.1
Average
Transaction Value
$15 $128 $161 $78 $178 $233 $86
Gifts and
Transfers to
People
Average Number
of Purchases
1.3 0.2 0.1 0.2 0.2 0.0 1.9
Average
Transaction Value
$32 $128 $66 $39 $156 $264 $57
Other
Average Number
of Purchases
0.3 0.2 0.1 0.1 0.3 0.0 1.1
Average
Transaction Value
$35 $108 $79 $43 $208 $329 $116
Total
Average Number
of Purchases
23.7 3.9 10.1 14.4 4.4 2.3 58.7
Average
Transaction
Value
$21 $168 $56 $44 $216 $69 $59
15. April 2014 Page 15 of 15
Evidence from the Diary of Consumer Payment Choice
Appendix 2
Methodology
The DCPC was developed jointly by the Boston Fed’s Consumer Payments Research Center (CPRC), the
Federal Reserve’s Cash Product Office (CPO) in San Francisco, and the Payments Studies Group (PSG) at
the Richmond Fed. The Diary is being used to benchmark the CPRC’s Survey of Consumer Payment
Choice, for strategic planning by the CPO, and to enable economic analysis of the payments choices
consumers make. The CPO and the CPRC performed a joint review of the survey responses presented in
this paper.
The diary study is based on a random sample of 2,468 respondents from across the United States, based
on the American Life Panel administered by the Rand Corporation. Using the Census Bureau’s Current
Population Survey, responses were weighted to match national population estimates. October was
selected as a “typical month” to minimize seasonality effects in consumer spending patterns. The survey
was staggered over the month of October 2012 to ensure that there were nearly equal people
participating each day of the month.
Participants were asked to log all of their transactions for three days, including their purchases, bill
payments, cash withdrawals, and deposits. The diary also asked participants how much cash they had in
their wallets at the start of the study and at the end of each day. To track the detail of each payment
made for each day, participants were given a paper journal-like memory aid that also contained a
reference list of payment methods, merchant type, etc. to help respondents classify their payments.
Participants then logged into a website and entered their activity for the day.
Participants were also asked to identify and rank their preferred payment instruments at the outset of
their diary entries. This allowed insight into the relationship between the consumer’s preferences and
the actual payment instrument used in transactions.