The document provides a summary of data on debit card transactions in the United States in 2013. Some key findings include:
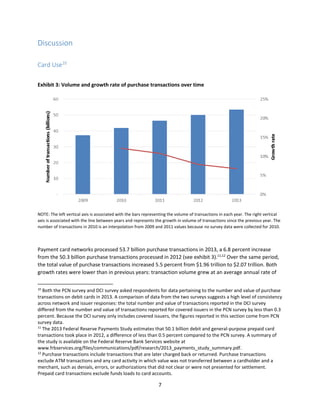
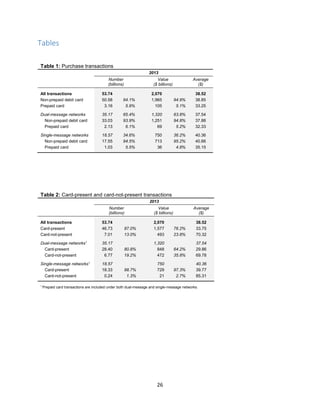
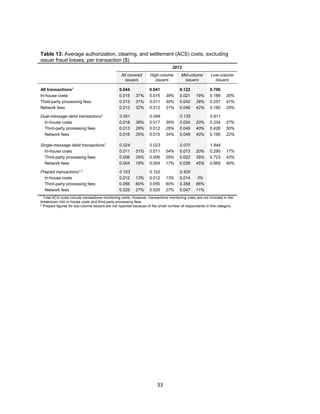
- Total debit card transaction volume grew 6.8% in 2013 to 53.7 billion transactions valued at $2.07 trillion.
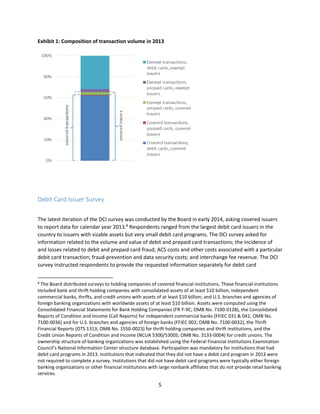
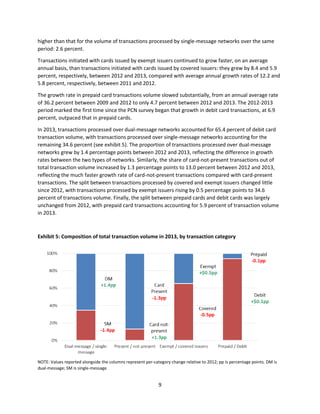
- Transactions processed over dual-message networks grew faster than those over single-message networks, at rates of 9.1% and 2.6% respectively.
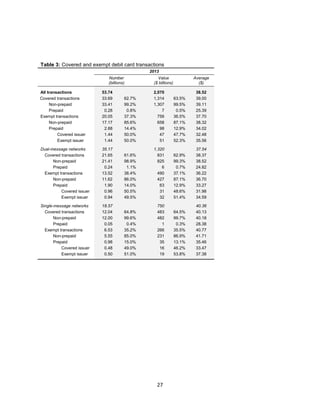
- Card-not-present transactions grew the fastest of any category at 18.1%, though they still only accounted for 13.0% of total transactions.
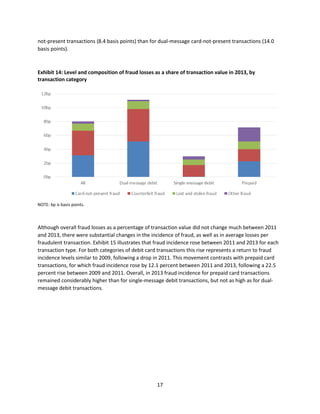
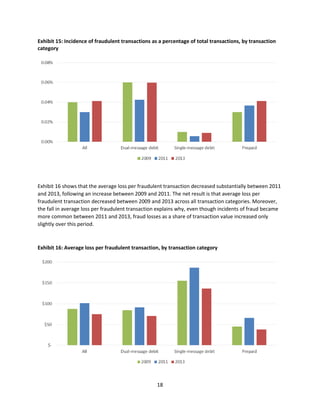
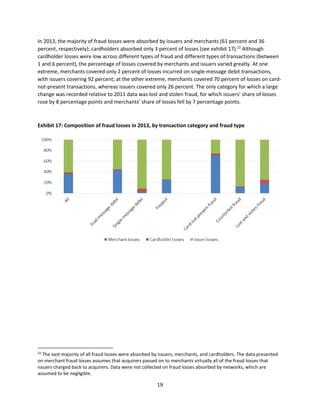
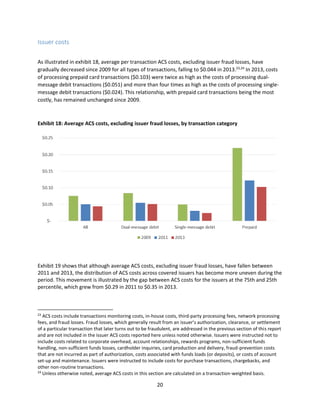
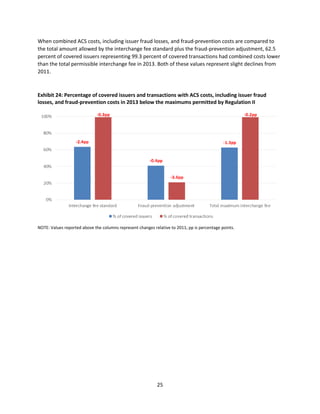
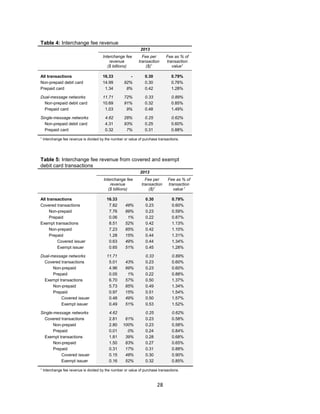
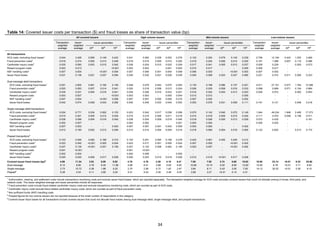
- Average interchange fees, network fees, and fraud losses remained relatively stable compared to previous years. The majority of covered issu


![[Abstract] Demonetisation: Push Towards a Digital Economy](https://cdn.slidesharecdn.com/ss_thumbnails/abstract-170128071113-thumbnail.jpg?width=640&height=640&fit=bounds)


