Underbanked and Unbanked Consumers in the U.S.: Successfully Targeting Consum...
Final Poster Chensen Wang
1. 300
600
900
1,200
2004 2005 2007 2009 20112006 2008 2010
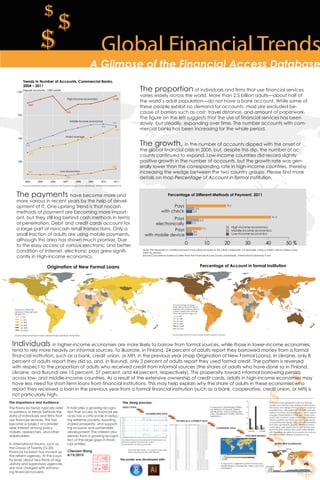
Deposit accounts, 1,000 adults
High income economics
Middle income economics
World average
Low economics
1057
536
417
137
120
207
747
786
766
962
1153
Trends in Number of Accounts, Commercial Banks,
2004 – 2011
Source:Calculations based on data from the Financial Access Survey (database), International Monetary Fund
Global Financial Trends$
$
$
$
$
$
$
$
The proportion of individuals and firms that use financial services
varies widely across the world. More than 2.5 billion adults—about half of
the world’s adult population—do not have a bank account. While some of
these people exhibit no demand for accounts, most are excluded be-
cause of barriers such as cost, travel distance, and amount of paperwork.
The figure on the left suggests that the use of financial services has been
slowly, but steadily, expanding over time. The number accounts with com-
mercial banks has been increasing for the whole period.
The growth, in the number of accounts dipped with the onset of
the global financial crisis in 2008, but, despite this dip, the number of ac-
counts continued to expand. Low-income countries did record slightly
positive growth in the number of accounts, but the growth rate was gen-
erally lower than the corresponding rate in high-income countries, thereby
increasing the wedge between the two country groups. Please find more
details on map Percentage of Account in formal Institution.
A Glimpse of the Financial Access Database
The Importance and Audience
The financial trends typically refer
to patterns or trends behinds the
data of individuals and firms that
use financial services. This has
become a subject of consider-
able interest among policy
makers, researchers, and other
stakeholders.
In international forums, such as
the Group of Twenty (G-20),
financial inclusion has moved up
the reform agenda. At the coun-
try level, about two-thirds of reg-
ulatory and supervisory agencies
are now charged with enhanc-
ing financial inclusion.
0 10 20 30 40 50 %
Pays
with check
Pays
electronically
Pays
with mobile device
High-income economics
Middle-income economics
Low-income economics
19.3
3.9
2.9
6.3
2.5
7.5
2.6
3.3
41.3
Source:Calculations based on data from the Financial Access Survey (database), International Monetary Fund
Note: The response on mobile payments may subsume some of the other categories. For example, using a credit card to make a pay-
ment by phone.
Percentage of Different Methods of Payment, 2011The payments have become more and
more various in recent years by the help of devel-
opment of IT. One uprising trend is that nocash
methods of payment are becoming more import-
ant, but they still lag behind cash methods in terms
of penetration. Debit and credit cards account for
a large part of noncash retail transactions. Only a
small fraction of adults are using mobile payments,
although this area has shown much promise. Due
to the easy access of various electronic and better
condition of Internet, electronic pays grew signifi-
cantly in High-income economics.
0−6%
6−12%
12−18%
18−24%
24−30%
No Data
Loan from a financial
institution in the past year
(% age 15+)
Source:Global Financial Inclusion (Global Findex) Database, World Bank.
Origination of New Formal Loans
0−20%
20−40%
40−60%
60−80%
80−100%
No Data
The percentage of respon-
dents with an account (self or
together with someone else) at
a bank, credit union, another
financial institution (age 15+)
Source:Global Financial Inclusion (Global Findex) Database, orld Bank.
Percentage of Account in formal Institution
Individuals in higher-income economies are more likely to borrow from formal sources, while those in lower-income economies
tend to rely more heavily on informal sources. To illustrate, in Finland, 24 percent of adults report they borrowed money from a formal
financial institution, such as a bank, credit union, or MFI, in the previous year (map Origination of New Formal Loans). In Ukraine, only 8
percent of adults report they did so, and, in Burundi, only 2 percent of adults report they used formal credit. The pattern is reversed
with respect to the proportion of adults who received credit from informal sources (the shares of adults who have done so in Finland,
Ukraine, and Burundi are 15 percent, 37 percent, and 44 percent, respectively). This propensity toward informal borrowing persists
across low- and middle-income countries. As a result of the extensive ownership of credit cards, adults in high-income economies may
have less need for short-term loans from financial institutions. This may help explain why the share of adults in these economies who
report they received a loan in the previous year from a formal financial institution (such as a bank, cooperative, credit union, or MFI) is
not particularly high.
It indicates a growing recogni-
tion that access to financial ser-
vices has a critical role in reduc-
ing extreme poverty, boosting
shared prosperity, and support-
ing inclusive and sustainable
development. The interest also
derives from a growing recogni-
tion of the large gaps in finan-
cial entities.
The poster was developed with:
Chensen Wang
4/15/2015
The desig process:
SELECT TOPIC
ACQUIRE RAW DATA
TECHNICALLY CORRECT DATA
CONSISTENT DATA
PLOT WITH RSTUDIO
REFINE WITH ILLUSTRATOR
The Global Financial Development Database is an
extensive dataset of financial system
characteristics for 203 economies
One example table of consistent data after
date cleaning process with Rstudio.
0 30
GFDD.AI.07
Adult Loan Percentage
0−6%
6−12%
12−18%
18−24%
24−30%
No Data
R original plot, Origination of New Formal Loans.
Used Illustrator to change title, refine color, fonts
and legend.
avg.checks avg.mobile
01020304050
R original plot, Percentage of Differ-
ent Methods of Payment. Refined
with Illlustrator, works including add
color, change fonts, rotate, add text
explanation.
GFDD.AI.05
Adult Account Percentage
0−20%
20−40%
40−60%
60−80%
80−100%
No Data
Plots and maps generated with R or Rstudio
usually can only flect the statistical information,
the layout and design of those charts could be
unsatisfactory. Although R and Rstudio provids
various functions and packages to allow user to
change characteristics of the plot, these work
could only conduct under command interface
which is painful and time-consuming. Illustrator,
as a professional design tool, provides powerful
tool and user-friendly graphic interface which
could allow user open r plot in pdf format and
reine the plots quickly. Also, plots after refined
with Illustrator are able to be saved into various
formats to satisfy diferent purpose of use.