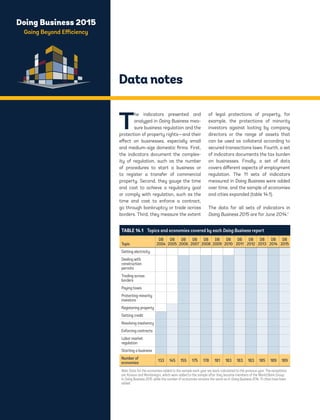
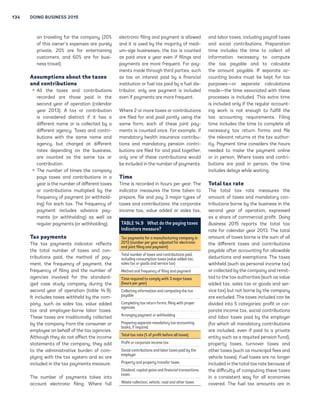
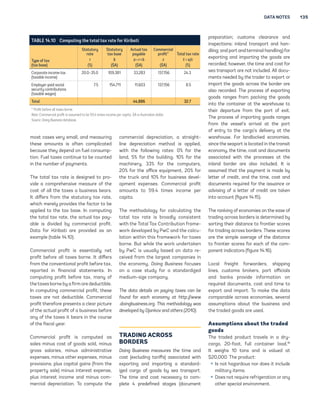
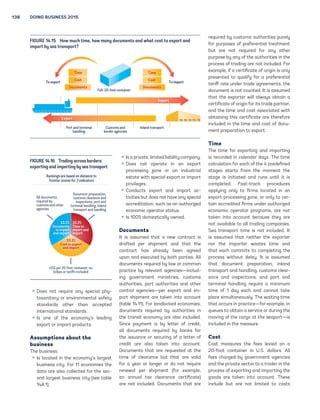
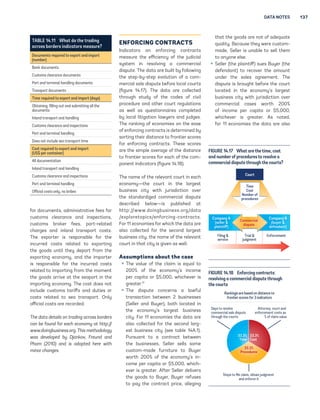
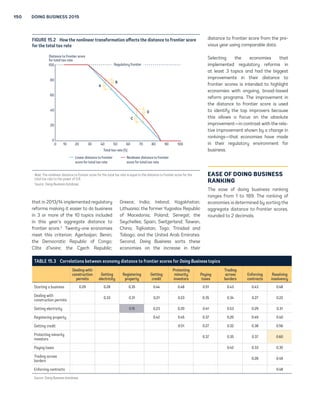
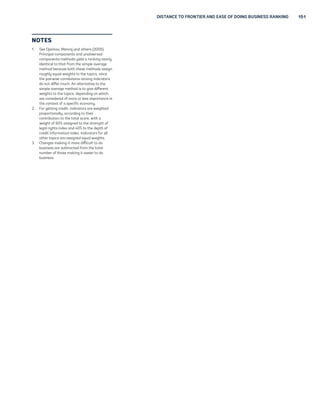
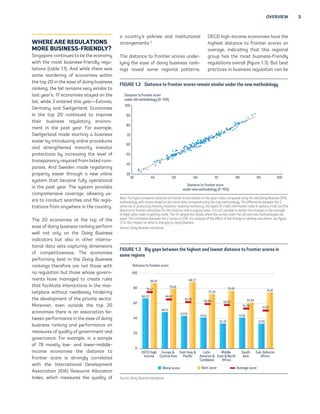
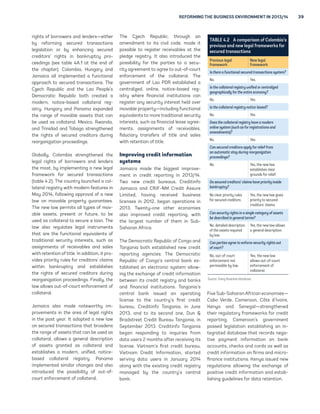
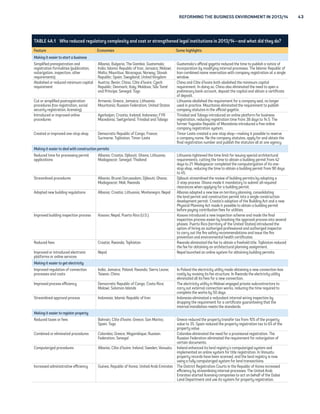
Doing Business 2015 
Going Beyond Efficiency 
Comparing Business Regulations for domestic firms in 189 Economies 
A World Bank Group Flagship Report 
12th edition
© 2014 International Bank for Reconstruction and Development / The World Bank 
1818 H Street NW, Washington DC 20433 
Telephone: 202-473-1000; Internet: www.worldbank.org 
Some rights reserved 
1 2 3 4 17 16 15 14 
This work is a product of the staff of The World Bank with external contributions. The findings, interpretations, and conclusions 
expressed in this work do not necessarily reflect the views of The World Bank, its Board of Executive Directors, or the governments 
they represent. The World Bank does not guarantee the accuracy of the data included in this work. The boundaries, colors, denomina-tions, 
and other information shown on any map in this work do not imply any judgment on the part of The World Bank concerning the 
legal status of any territory or the endorsement or acceptance of such boundaries. 
Nothing herein shall constitute or be considered to be a limitation upon or waiver of the privileges and immunities of The World Bank, 
all of which are specifically reserved. 
Rights and Permissions 
This work is available under the Creative Commons Attribution 3.0 IGO license (CC BY 3.0 IGO) http://creativecommons.org 
/licenses/by/3.0/igo. Under the Creative Commons Attribution license, you are free to copy, distribute, transmit, and adapt this work, 
including for commercial purposes, under the following conditions: 
Attribution—Please cite the work as follows: World Bank. 2014. Doing Business 2015: Going Beyond Efficiency. Washington, DC: World 
Bank. DOI: 10.1596/978-1-4648-0351-2. License: Creative Commons Attribution CC BY 3.0 IGO 
Translations—If you create a translation of this work, please add the following disclaimer along with the attribution: This translation 
was not created by The World Bank and should not be considered an official World Bank translation. The World Bank shall not be liable for any 
content or error in this translation. 
Adaptations—If you create an adaptation of this work, please add the following disclaimer along with the attribution: This is an 
adaptation of an original work by The World Bank. Views and opinions expressed in the adaptation are the sole responsibility of the author or 
authors of the adaptation and are not endorsed by The World Bank. 
Third-party content—The World Bank does not necessarily own each component of the content contained within the work. The 
World Bank therefore does not warrant that the use of any third-party-owned individual component or part contained in the work will 
not infringe on the rights of those third parties. The risk of claims resulting from such infringement rests solely with you. If you wish 
to re-use a component of the work, it is your responsibility to determine whether permission is needed for that re-use and to obtain 
permission from the copyright owner. Examples of components can include, but are not limited to, tables, figures, or images. 
All queries on rights and licenses should be addressed to the Publishing and Knowledge Division, The World Bank, 1818 H Street NW, 
Washington, DC 20433, USA; fax: 202-522-2625; e-mail: pubrights@worldbank.org. 
ISBN (paper): 978-1-4648-0351-2 
ISBN (electronic): 978-1-4648-0352-9 
DOI: 10.1596/978-1-4648-0351-2 
ISSN: 1729-2638 
Cover design: Corporate Visions, Inc.
Doing Business 2015 
Going Beyond Efficiency 
COMPARING BUSINESS REGULATIONS FOR DOMESTIC FIRMS IN 189 ECONOMIES 
A World Bank Group Flagship Report 
12TH EDITION
Doing Business 2015 
Going Beyond Efficiency 
Resources on the 
Doing Business website 
Current features 
News on the Doing Business project 
http://www.doingbusiness.org 
Rankings 
How economies rank—from 1 to 189 
http://www.doingbusiness.org/rankings 
Data 
All the data for 189 economies—topic 
rankings, indicator values, lists of 
regulatory procedures and details 
underlying indicators 
http://www.doingbusiness.org/data 
Reports 
Access to Doing Business reports as well 
as subnational and regional reports, 
reform case studies and customized 
economy and regional profiles 
http://www.doingbusiness.org/reports 
Methodology 
The methodologies and research papers 
underlying Doing Business 
http://www.doingbusiness.org/methodology 
Research 
Abstracts of papers on Doing Business 
topics and related policy issues 
http://www.doingbusiness.org/research 
Doing Business reforms 
Short summaries of DB2015 business 
regulation reforms, lists of reforms since 
DB2008 and a ranking simulation tool 
http://www.doingbusiness.org/reforms 
Historical data 
Customized data sets since DB2004 
http://www.doingbusiness.org/custom-query 
Law library 
Online collection of business laws and 
regulations relating to business 
http://www.doingbusiness.org/law-library 
Contributors 
More than 10,700 specialists in 189 
economies who participate in Doing 
Business 
http://www.doingbusiness.org 
/contributors/doing-business 
Entrepreneurship data 
Data on business density (number of 
newly registered companies per 1,000 
working-age people) for 139 economies 
http://www.doingbusiness.org/data 
/exploretopics/entrepreneurship 
Distance to frontier 
Data benchmarking 189 economies to 
the frontier in regulatory practice 
http://www.doingbusiness.org/data 
/distance-to-frontier 
Information on good practices 
Showing where the many good 
practices identified by Doing Business 
have been adopted 
http://www.doingbusiness.org/data 
/good-practice 
Doing Business iPhone app 
Doing Business at a Glance—presenting 
the full report, rankings and highlights 
for each topic for the iPhone, iPad and 
iPod touch 
http://www.doingbusiness.org 
/special-features/iphone
Doing Business 2015 
Going Beyond Efficiency 
Contents 
v Foreword 
1 Overview 
15 About Doing Business 
24 What is changing in Doing Business? 
33 Reforming the business environment in 2013/14 
Case studies 
47 Starting a business 
The growing efficiency of company registries 
53 Zoning and urban planning 
Understanding the benefits 
60 Registering property 
Measuring the quality of land administration systems 
67 Getting credit 
The importance of registries 
76 Protecting minority investors 
Going beyond related-party transactions 
83 Paying taxes 
Trends before and after the financial crisis 
90 Enforcing contracts 
How judicial efficiency supports freedom of contract 
96 Resolving insolvency 
Measuring the strength of insolvency laws 
102 Highlights from the Doing Business research conference 
109 References 
1 14 Data notes 
146 Distance to frontier and ease of doing business ranking 
152 Summaries of Doing Business reforms in 2013/14 
167 Country tables 
231 Labor market regulation data 
252 Acknowledgments 
Doing Business 2015 is the 12th in a 
series of annual reports investigating 
the regulations that enhance business 
activity and those that constrain it. 
Doing Business presents quantitative 
indicators on business regulations 
and the protection of property rights 
that can be compared across 189 
economies—from Afghanistan to 
Zimbabwe—and over time. 
Doing Business measures regulations 
affecting 11 areas of the life of a 
business. Ten of these areas are 
included in this year’s ranking on the 
ease of doing business: starting a 
business, dealing with construction 
permits, getting electricity, registering 
property, getting credit, protecting 
minority investors, paying taxes, 
trading across borders, enforcing 
contracts and resolving insolvency. 
Doing Business also measures labor 
market regulation, which is not included 
in this year’s ranking. 
Data in Doing Business 2015 are current 
as of June 1, 2014. The indicators are 
used to analyze economic outcomes 
and identify what reforms of business 
regulation have worked, where and why.
Doing Business 2015 
Going Beyond Efficiency 
Foreword 
How to use Doing Business indicators and how not to 
The public discourse on eco-nomic 
policy is overwhelmingly 
focused on fiscal measures, 
monetary interventions, welfare pro-grams 
and other such highly visible 
instruments of government action. 
Thus when an economy does poorly, a 
disproportionate amount of our debate 
centers on whether or not it needs a 
fiscal stimulus, whether there should be 
liquidity easing or tightening, whether 
its welfare programs have been too 
profligate or too paltry and so on. 
What gets much less attention but is 
equally—and, in some situations, even 
more—important for an economy’s 
success or failure is the nuts and 
bolts that hold the economy together 
and the plumbing that underlies the 
economy. 
The laws that determine how easily a 
business can be started and closed, 
the efficiency with which contracts are 
enforced, the rules of administration 
pertaining to a variety of activities— 
such as getting permits for electricity 
and doing the paperwork for exports 
and imports—are all examples of the 
nuts and bolts that are rarely visible 
and in the limelight but play a critical 
role. Their malfunctioning can thwart 
an economy’s progress and render 
the more visible policy instruments, 
such as good fiscal and monetary poli-cies, 
less effective. Just as the Space 
Shuttle Challenger broke apart on 
takeoff from Cape Canaveral, Florida, 
on January 28, 1986, not because (as 
was later realized) something major 
had gone wrong but because a joint 
held together by a circular nut called 
the O-ring had failed, an economy can 
be brought down or held back by the 
failure of its nuts and bolts. The World 
Bank Group’s Doing Business report 
is an annual statement of the state 
of the nuts and bolts of economies 
around the world and, as such, is one of 
the most important compendiums of 
information and analysis of the basis 
of an economy’s effective day-to-day 
functioning and development. 
Creating an efficient and inclusive 
ethos for enterprise and business 
is in the interest of all societies. An 
economy with an efficient bureaucracy 
and rules of governance that facilitates 
entrepreneurship and creativity among 
individuals, and provides an enabling 
atmosphere for people to realize 
their full potential, can enhance living 
standards and promote growth and 
shared prosperity. It can also help 
in creating an environment in which 
standard macroeconomic policies are 
more effective and course through the 
economy more easily. After decades 
of debate there is now some conver-gence 
in economics about the roles 
of the market and the state. To leave 
everything to the free market can lead 
to major economic malfunction and 
elevated levels of poverty, and have 
us be silent witnesses to, for instance, 
discrimination against certain groups. 
Moreover, there is a logical mistake that 
underlies the market fundamentalist 
philosophy. To argue that individuals 
and private businesses should have 
all the freedom to pursue what they
vi DOING BUSINESS 2015 
wish and that government should not 
intervene overlooks the fact that gov-ernment 
is nothing but the outcome 
of individual actions. Hence the edict 
is internally inconsistent. Fortunately, 
market fundamentalism has, for the 
most part, been relegated to the mar-gins 
of serious policy discourse. 
Turning to the other extreme, it is now 
widely recognized that to have the 
state try to do it all is a recipe for eco-nomic 
stagnation and cronyism. In any 
national economy there are too many 
decisions to be made, and too great a 
variety of skills and talents scattered 
through society, for any single author-ity 
to take effective charge. 
It is true that government should inter-vene 
in the market to help the disadvan-taged, 
to keep inequality within bounds, 
to provide public goods and to create 
correctives for market failures such 
as those stemming from externalities, 
information asymmetries and systemic 
human irrationalities.1 But over and 
above these, government also has the 
critical responsibility to provide a nimble 
regulatory setup that enables ordinary 
people to put their skills and talents 
to the best possible use and facilitates 
the smooth and efficient functioning 
of businesses and markets.2 It is this 
critical role of providing an enabling 
and facilitating ethos for individual tal-ent 
and enterprise to flourish—which 
includes an awareness of where not to 
intervene and interfere—that the Doing 
Business report tries to measure. There 
is no unique way of doing this, and there 
are plenty of open conceptual questions 
one has to contend with. In brief, by its 
very nature Doing Business has all the 
ingredients of being both important and 
controversial, and it has lived up to both 
qualities in ample measure. 
SWITCHING SIDES 
As an independent researcher and, 
later, as Chief Economic Adviser to the 
Indian government, I used, criticized, 
valued and debated the Doing Business 
report, unaware that I would be at the 
World Bank one day and hence be 
shifted from the side of the consumer 
to that of the manufacturer of this 
product. This shift has given me a 
360-degree view of Doing Business and, 
along with that, an awareness of its 
strengths and weaknesses, which oth-ers, 
luckier than I, may not have. 
Its greatest strength is its transpar-ency 
and adherence to clearly stated 
criteria. Doing Business takes the same 
set of hypothetical questions to 189 
economies and collects answers to 
these. Thus, for instance, when check-ing 
on an economy’s efficacy in “enforc-ing 
contracts,” it measures the time, 
cost and procedures involved in resolv-ing 
a hypothetical commercial lawsuit 
between 2 domestic firms through a 
local court. The dispute involves the 
breach of a sales contract worth twice 
the size of the income per capita of 
the economy or $5,000, whichever is 
greater. This meticulous insistence on 
using the same standard everywhere 
gives Doing Business a remarkable 
comparability across economies. 
However, this same strength is inevi-tably 
a source of some weaknesses. It 
means that, contrary to what some 
people believe, Doing Business is not 
based on sample surveys of firms. It is 
not feasible, at least not at this stage, 
to conduct such surveys in 189 econo-mies. 
A lot of the Doing Business data 
are based on careful collection of de jure 
information on what an economy’s laws 
and regulations require. Further, even 
when, based on a study of one economy 
or a cluster of economies, some measure 
is found to be an important determinant 
of the ease of doing business, it may not 
be possible to put this measure to use 
unless a way is found to collect informa-tion 
on it from all 189 economies. 
Nor does the fact that the same mea-sures 
are collected for all economies 
automatically mean that they are the 
right measures. The same measure 
may be more apt for one economy and 
less so for another. As Ken Arrow once 
pointed out, the medieval English law 
under which no one was allowed to sleep 
on park benches applied to both pau-pers 
and aristocrats, but since the latter 
typically did not consider the use of park 
benches for napping, it was amply clear 
that this horizontally anonymous law 
was actually meant for only one class of 
people, namely the poor.3 
Another problem arises from the fact 
that the overall ease of doing business 
ranking is an aggregation of 10 com-ponent 
indicators—measuring how 
easy it is (in the economy concerned) 
to start a business, deal with construc-tion 
permits, get electricity, register 
property, get credit, pay taxes, trade 
across borders, enforce contracts and 
resolve insolvency and how strong the 
protections for minority investors are. 
Further, each of these 10 component 
indicators is itself an amalgam of 
several even more basic measures. The 
way all this is aggregated is by giving 
each basic measure the same weight to 
get to each component indicator, and 
then giving an equal weight to each of 
the 10 component indicators to get to 
the final score. Questions may indeed 
be asked about whether it is right 
to give the same weight to different 
indicators.4 Is an economy’s speed at 
1. There is evidence that human beings are not just frequently irrational but have certain systematic propensities to this, which can be and has been used to 
exploit individuals (Akerlof and Shiller 2009; Johnson 2009). By this same logic, these irrationalities can be used to promote development and growth. The 
next World Development Report (World Bank, forthcoming), to be published in December 2014, is devoted to this theme. 
2. This convergent view can increasingly be found in microeconomics books, such as Bowles (2006); Basu (2010); and Ferguson (2013). 
3. Arrow 1963. 
4. There is a lot of research on the choice of weights when aggregating and on the algebra of ranking; see, for example, Sen (1977); Basu (1983); and Foster, 
McGillivray and Seth (2012).
FOREWORD vii 
giving an electricity connection to a 
new enterprise as important as its 
ability to enforce contracts efficiently? 
Further, the measures count both the 
time taken to get certain permits and 
clearances and also the number and 
intricacy of procedures. These also 
entail weights. 
There is a way of doing away with 
weights, an approach that involves 
declaring one economy to be ranked 
above another only if it dominates 
the other in all 10 indicators. This is 
referred to as the criterion of vector-dominance, 
and its properties have 
been studied and are well understood. 
The trouble with this criterion is that 
it leads to incompleteness in rankings. 
For many pairs of economies it will not 
be possible to treat either as ranked 
above the other; nor can we, in such 
cases, declare the 2 to be equally good 
in terms of the ease of doing business. 
This is illustrated in the figure, which 
ranks a small cluster of economies by 
using vector-dominance in terms of the 
10 indicators. A downward line between 
2 economies represents dominance, and 
2 economies that cannot be connected 
by a downward line cannot be compared 
with each other. Hence Singapore is 
unequivocally ranked above Ireland, 
which is ranked above Cyprus and so on. 
Singapore is also ranked above Latvia. 
Similarly, New Zealand is ranked above 
Latvia, which is above Morocco and 
Benin, and so on. Singapore and New 
Zealand, which are this year’s winner 
and runner-up in our ordinal ranking, 
cannot, however, be ranked in terms of 
vector-dominance; nor can we rank New 
Zealand and Ireland.5 
It is true that the figure shows only 
a small segment of the quasi-order 
over the 189 economies; but even if we 
showed the full set, the picture would 
be populated with pairs of economies 
that cannot be ranked. That is indeed 
the disadvantage of vector-dominance. 
When it pronounces judgment, it does 
so with great authority, but it achieves 
this at the cost of total reticence over 
large domains. 
What I suspected when I was a user 
of Doing Business, and now know, is 
that a significant number of the top 
30 economies in the ease of doing 
business ranking come from a tradition 
where government has had quite a 
prominent presence in the economy, 
including through the laying out of 
rules to regulate different dimensions 
of the activities of the private sector. 
However, all these economies have 
an excellent performance on the 
Doing Business indicators and in other 
international data sets capturing 
various dimensions of competitiveness. 
The top-performing economies in the 
ease of doing business ranking are 
therefore not those with no regulation 
but those in which governments have 
managed to create rules that facilitate 
interactions in the marketplace without 
needlessly hindering the development 
of the private sector.6 Ultimately, Doing 
Business is about smart regulations 
that only a well-functioning state can 
provide. The secret of success is to 
have the essential rules and regulations 
in place—but more importantly to have 
a good system of clearing decisions 
quickly and predictably, so that small 
and ordinary businesses do not feel 
harassed. 
To get to an evaluation of this, one has 
to make choices, such as what to include 
and what to exclude and what weights 
to use. This has been done in creating 
the Doing Business measures, and effort 
is being made to improve on these. 
Excessive taxation, for instance, can 
dampen incentives and adversely affect 
an economy’s functioning. But this 
does not mean that the lower the tax 
rates and collections, the better. There 
are economies where the tax revenue 
to GDP ratio is so low that it hampers 
the government’s ability to regulate 
efficiently, invest in infrastructure and 
provide basic health and education 
services to the poor. With that in mind, 
the Doing Business team changed the 
indicator that used to treat a lower 
tax rate as better. Three years ago a 
threshold was set such that economies 
with tax rates below this threshold are 
not rewarded. This has reduced the bias 
in favor of economies that choose not 
to levy even a reasonable tax on private 
companies. 
Our attention has been drawn to many 
critiques by the Independent Panel 
on Doing Business, chaired by Trevor 
Manuel, which submitted its report in 
2013.7 Following this report a decision 
was made to set a 2-year target to 
improve the methodology of Doing 
Business without damaging the overall 
integrity of this valuable publication. 
The Doing Business team is in the midst 
Ranking by vector-dominance 
Singapore 
Ireland 
Cyprus 
Senegal 
New Zealand 
Latvia 
Morocco 
Benin 
5. This example of vector-dominance is based only on the top 2 economies in this year’s ease of doing business ranking. The figure was constructed as 
follows: First, all economies were sorted by their ranking, and the first economy for which all 10 indicator rankings are lower than those of Singapore was 
identified: Ireland. The process was then repeated for Ireland, and so on for all 189 economies. Second, the analysis was replicated, this time starting 
with New Zealand. Third, all pairs of economies in the figure were compared (for example, the horizontal line between Singapore and Latvia means that 
Singapore vector-dominates Latvia and all economies connected with a vertical line under Latvia). 
6. See Besley and Burgess (2004). 
7. The report by the Independent Panel on Doing Business is available on its website at http://www.dbrpanel.org/.
viii DOING BUSINESS 2015 
of such an exercise, and it is hoped that 
independent researchers, wherever in 
the world they happen to be, will join in 
the task of refining and improving this 
important document. 
STRENGTHS AND 
WEAKNESSES 
While the 2-year task of improving the 
methodology continues, it is worth being 
clear that there is no such thing as the 
best, all-encompassing indicator. As 
a consequence, responsibility rests as 
much with the users of the ease of doing 
business ranking as with its producers 
to make sure that it is a valuable 
instrument of policy. Controversy has 
often arisen from reading more into 
the ranking or indicator than what it 
actually captures. It has been pointed 
out, critically, that there are economies 
that do poorly on the Doing Business 
indicators but that nevertheless get 
a lot of foreign direct investment 
(FDI) from global corporations. These 
examples are usually nothing more 
than a reminder that an economy has 
many more aspects than the features 
that are tracked and measured by the 
Doing Business report. The flow of FDI 
into an economy is facilitated by having 
a better doing business ethos, true, but 
FDI flows can be thwarted by other 
policy weaknesses; and, conversely, an 
economy with poor performance on the 
Doing Business indicators may make up 
for it in other ways so as to attract 
large FDI inflows. The fact that there 
are examples of economies that do not 
do well on the Doing Business indicators 
but continue to receive flows of FDI 
shows that private corporations do not 
make this mistake; they will decide on 
the basis of a range of factors. 
Another common criticism is implicit 
in the question, If economy x is grow-ing 
fast, why does it not rank high on 
the ease of doing business? First, if 
the ease of doing business ranking 
were constructed in such a way that 
it had a very high correlation with 
GDP or GDP growth, there would be 
little reason to have a new ranking. We 
would be able to get our result from 
looking at GDP or GDP growth tables. 
Second, this question is often rooted in 
the common mistake, already noted, 
of treating the ease of doing busi-ness 
ranking as an all-encompassing 
measure of an economy’s goodness. 
It is not. An economy can do poorly on 
Doing Business indicators but do well in 
macroeconomic policy or social welfare 
interventions. In the end, Doing Business 
measures a slender segment of the 
complex organism that any modern 
economy is. It attempts to capture a 
segment that is representative of other 
general features of the economy (and 
effort will be made to improve on this), 
but the fact remains that an economy 
can undo the goodness or badness of 
its performance on Doing Business indi-cators 
through other policies. 
Moreover, economic efficiency is not 
the only measure by which we evalu-ate 
an economy’s performance.8 Most 
of us value greater equality among 
people; the ease of doing business 
ranking is not meant to measure suc-cess 
on that scale. We value better 
health, better education, literature 
and culture; the ease of doing business 
ranking is not meant to capture these 
either. It is a mistake to treat this as a 
criticism of the ease of doing business 
ranking; it is simply a reminder that life 
is a many-splendored thing, and the 
Doing Business report tries to capture 
one aspect of the good life. The need is 
to resurrect that once-popular expres-sion, 
“ceteris paribus.” Other things re-maining 
the same, an economy should 
try to improve its score underlying the 
ease of doing business ranking. 
In putting the ease of doing business 
ranking to use in crafting policy, it 
is important to keep in mind these 
caveats, strengths and weaknesses. 
Ultimately, the Doing Business indicators 
are meant to simply hold up a mirror to 
economies. A poor score should alert a 
government that it ought to examine 
its regulatory structure. On the basis of 
this it may decide to change some regu-latory 
features and policies in ways that 
may not even directly affect its ease of 
doing business ranking but nevertheless 
improve the economy’s performance. If 
this happens, and there is some evidence 
that it does, the Doing Business report 
would be serving its purpose. There are 
governments that attract a lot of talent 
into their bureaucracy but nevertheless 
do not have an efficient administration 
because the bureaucrats get trapped in 
their arcane rules of engagement. This 
is a report that can be of great value to 
such governments. And it is gratifying 
that a large number of governments 
have put it precisely to such use. 
Promoting a well-functioning, competi-tive 
private sector is a major undertak-ing 
for any government, especially for 
one with limited resources and techni-cal 
capabilities. It requires long-term 
comprehensive policies targeting mac-roeconomic 
stability; investment in in-frastructure, 
education and health; and 
the building of technological and entre-preneurial 
capacity. A well-functioning 
political system—one in which the gov-ernment 
is perceived to be working in the 
public interest while managing scarce 
resources in a reasonably transparent 
way—plays a central role. Removing 
administrative barriers and strengthen-ing 
laws that promote entrepreneurship 
and creativity—both of which are within 
the power of governments to do—can 
set an economy on the path to greater 
prosperity and development. There is 
compelling evidence that excessively 
burdensome regulations can lead to 
large informal and less-productive sec-tors, 
less entrepreneurship and lower 
rates of employment and growth. 
8. See Stiglitz, Sen and Fitoussi (2009); World Bank (2014a); and World Bank and IMF (2014).
FOREWORD ix 
CARDINALITY, 
ORDINALITY, RANKINGS 
AND RATINGS 
One feature of the report that has 
received a lot of attention is its use of 
rankings. Ultimately, what the report 
does is to provide a table with a simple 
ordinal ranking of all 189 economies. 
After a lot of debate and discussion 
a decision was made to stay with the 
overall ranking, even though other, 
cardinal features of the exercise are at 
the same time being strengthened, as 
will be explained shortly. 
It was in 2005 that the World Bank 
Group management decided to start 
ranking economies on the ease of 
doing business because it recognized 
the value of benchmarking exercises 
in generating interest among policy 
makers in reform.9 In an area that 
had received little attention from 
policy makers before the publication 
of the first Doing Business report, the 
rankings proved to be an important 
catalyst in raising the profile of 
regulation as a central element of a 
good investment climate. The rank-ings 
also proved effective in moving 
issues of performance and progress 
in business regulation to the center of 
policy discussions in a large number 
of economies. By capturing complex, 
multidimensional realities in a simple 
quantified framework, the rankings 
also helped to facilitate communica-tion 
between different stakeholders 
and made possible meaningful inter-national 
comparisons of the regula-tory 
performance of economies, con-tributing, 
along the way, to increasing 
the accountability of political actors. 
Members of the business commu-nity, 
for instance, could point to the 
existence of less complex and costly 
procedures or better-functioning insti-tutions 
in other economies in the region 
in their dealings with governments, 
which, by and large, had been slow to 
see their own Doing Business data in an 
international perspective. The overall 
ranking has value in addition to the 
topic-level indicators. The overall rank-ing 
combines a wealth of information 
that serves as a summary measure 
and allows governments to benchmark 
their economy’s performance against 
that of other economies. 
Notwithstanding the important ben-efits 
of rankings, the disaggregated 
data are also a clear strength of the 
project. Policy makers frequently 
become aware of the measurements 
through the ranking but then use the 
disaggregated data to shape reform 
programs. The data identify best prac-tices 
globally and identify where each 
economy’s practices hold inefficiencies 
or inadequate legal protections. For 
example, governments find it useful 
to compare their own procedures lists 
for firm start-up with those of other 
economies that pursue the same goals 
with less procedural complexity and at 
lower cost. 
Having noted these advantages, we 
would be remiss if we did not point to 
some of the disadvantages of ordinal 
ranking. When an economy is given a 
rank, there is no sense of how far it is 
from its closest contenders. Consider 
an economy that is ranked at 95, 
with no other economy at that rank. 
We know that its closest contenders 
are at 94 and 96 and this would be 
unchanged no matter how far or how 
near those other economies are. This 
means that when economies are very 
densely packed, a small improvement 
can lead to a vast jump in ranking and 
a small worsening can lead to a large 
drop in ranking. To see this, consider 
an extreme case where 50 economies 
have exactly the same scores on the 
indicators underlying the ease of doing 
business ranking and so each of them 
has the same ranking, say 95. If one 
economy does slightly worse, with no 
change in the performance of all the 
other economies, it will drop not to 96 
in the ranking but to 145. On an ordinal 
ranking scale this will show up as a 
seemingly alarming drop, but noth-ing 
alarming has actually happened. 
Similarly, if an economy is far behind 
the economy ahead of it, it can make 
a large improvement and yet show no 
gain in the ordinal rank measure. 
In response to this, there are 2 
comments in defense of the methods 
used. First, the Doing Business team 
worked over the past 3 years to deepen 
the indices by adding a “distance to 
frontier” measure. This measure has 
certain cardinal qualities because it 
tries to capture the actual distance 
each economy has to go to reach the 
frontier of “best performance.” This 
puts on display how each economy 
performs not only vis-à-vis other 
economies but also in absolute terms. 
Further, the distance to frontier score 
can shed light on the progress made 
by individual economies over time in 
comparison with their own regulatory 
practices of previous years. This makes 
it transparent that an economy can 
make actual progress and still lose 
ground in the ranking when rank-neighboring 
economies do even better. 
Recent Doing Business reports have 
given increasing attention to long-term 
trends in the data—with an emphasis 
on economies’ performance with 
respect to their past performance—to 
balance the short-term perspective 
that the ranking provides. Further, for 
reasons of transparency Doing Business 
makes the disaggregated data 
available on its website. This allows 
users to construct alternative rankings 
with any set of weights they may wish 
to attach to individual indicators. 
Second, the ranking issue crops up 
for both the final aggregate score and 
the basic indicators that go into the 
9. See World Bank (2006).
x DOING BUSINESS 2015 
creation of this final score. Here, the 
use of ordinal ranks is more problem-atic 
because they get absorbed in the 
final measure and economies making 
small improvements or regressions 
in densely packed areas can have a 
disproportionate gain or loss in rank-ing. 
This information being buried in 
the basic indicators makes it harder to 
discern. For this reason from this year 
we decided to switch from using the or-dinal 
ranks of basic indicators to using 
absolute or cardinal measures before 
they are aggregated in the final rank-ing. 
There are also other options. One 
is to switch from rankings to ratings, 
which would have economies appear in 
clusters that are then ranked. But this 
method too comes with its own share 
of strengths and weaknesses. 
CONCLUSION 
The economy is a complex machine, be-yond 
the full comprehension of any per-son. 
Over the years meticulous research, 
collection of increasingly sophisticated 
data and the advance of economic 
theory and innovative modeling have 
given us a better understanding of this 
machine. Nevertheless, one has to ap-proach 
economic policy making with a 
certain humility, keeping an eye on the 
fact that what we, all this time, took to 
be an established feature of economics 
may be open to question. In brief, the 
discipline is evolving and we must be 
willing participants in the process. 
The World Bank Group’s Doing Business 
initiative is no exception to this. It tries 
to track and measure one of the most 
important features of an economy— 
the ease with which it is possible to 
do business, trade and exchange. It 
provides governments, administrators 
and researchers with valuable data and 
analysis to promote a better regula-tory 
framework for development, job 
creation and growth. There are econo-mies 
that have benefited greatly from 
this and it is hoped that Doing Business 
will continue to provide this service. At 
the same time, as this foreword has 
argued, we are aware that we still have 
some distance to go in our understand-ing 
of an economy. For that reason we 
welcome research and criticism and 
hope that this will lead to a better Doing 
Business report. This year’s report is a 
small, first step in that direction. 
Kaushik Basu 
Senior Vice President and 
Chief Economist 
The World Bank 
Washington, DC
Doing Business 2015 
Going Beyond Efficiency 
Overview 
Great ideas for new business 
ventures happen every day and 
everywhere. Some go far, while 
others never take off. Great ideas are 
at the heart of development; they allow 
economies to grow, and they improve 
people’s lives. So it is important to un-derstand 
why some great ideas never 
come to fruition even as others thrive. 
What do entrepreneurs need to pursue 
a great idea? First of all, they need the 
ability to give legal form to the idea— 
that is, to start a business—simply, 
quickly and inexpensively and with the 
certainty of limited liability. They also 
need the certainty of a well-designed 
insolvency system, in case the idea fails 
to work out. In addition, they will need 
to hire people to help realize the idea, 
will probably need to obtain financing 
(both equity and credit) and, in today’s 
increasingly interdependent global 
economy, may in many cases need a 
simple way to import and export. And 
they will need a straightforward way to 
pay their taxes. 
Sound business regulations are funda-mental 
to all this. The right business 
regulations enable good ideas to take 
root, leading to the creation of jobs 
and to better lives. But where business 
regulations make it difficult to start 
and operate a business, good ideas may 
never see the light of day and important 
opportunities may be missed. Budding 
entrepreneurs, daunted by burden-some 
regulations, may opt out of doing 
business altogether or, if they have the 
resources, take their ideas elsewhere. 
Doing Business looks at how business 
regulations determine whether good 
ideas can get started and thrive or will 
falter and wither away. Many other di-mensions 
of the business environment 
also matter but are outside the scope 
of Doing Business. For example, Doing 
Business does not capture such aspects 
as security, market size, macroeco-nomic 
stability and the prevalence of 
bribery and corruption. Nevertheless, 
improving in the areas measured by 
Doing Business is an important step 
toward a better business environment 
for all. 
WHAT DOES DOING 
BUSINESS MEASURE—AND 
HOW IS IT CHANGING? 
This year’s Doing Business report 
launches a 2-year process of introduc-ing 
important improvements in 8 of the 
10 sets of Doing Business indicators. 
These improvements provide a new 
conceptual framework in which the 
emphasis on the efficiency of regula-tion 
is complemented by an increased 
emphasis on its quality. In the area of 
dealing with construction permits, for 
example, Doing Business will measure 
the quality of building regulations and 
the qualifications of the people review-ing 
the building plans in addition to the 
efficiency of the process for completing 
all the formalities to build a warehouse. 
With a few exceptions, the original 
Doing Business indicators focused 
mainly on measuring efficiency, such as 
ƒ This year’s Doing Business report 
launches a 2-year process of 
introducing improvements in 8 of the 
10 Doing Business indicator sets—to 
complement the emphasis on the 
efficiency of regulation with a greater 
emphasis on its quality. 
ƒ New data show that efficiency and 
quality go hand in hand. Insolvency cases 
are resolved more quickly, and with 
better outcomes, where insolvency laws 
are well designed. Property transfers 
are faster and less costly in economies 
with good land administration 
systems. And commercial disputes 
are resolved more efficiently by courts 
using internationally recognized good 
practices. 
ƒ For the first time this year, Doing 
Business collected data for 2 cities 
in large economies. The data show 
few differences between cities within 
economies in indicators measuring the 
strength of legal institutions, which 
typically apply nationwide. Differences 
are more common in indicators 
measuring the complexity and cost 
of regulatory processes, where local 
jurisdictions play a larger role. 
ƒ Sub-Saharan Africa accounts for 5 of 
the 10 top improvers in 2013/14. The 
region also accounts for the largest 
number of regulatory reforms making 
it easier to do business in the past 
year—75 of the 230 worldwide. More 
than 70% of its economies carried out at 
least one such reform. 
ƒ Business regulations such as those 
measured by Doing Business are 
important for new business creation and 
for the performance of small firms.
2 DOING BUSINESS 2015 
by recording the procedures, time and 
cost to start a business or to transfer 
property. These are very important 
aspects to measure. But as the proj-ect’s 
importance grew, it became clear 
that there was a need to expand what 
was being measured to include more 
aspects of regulatory quality. Many of 
the improvements in methodology were 
inspired and informed by the report of 
the Independent Panel on Doing Business 
as well as by input from policy makers 
and data users.1 They also benefited 
from discussions at the Doing Business 
research conference held in Washington, 
DC, in February 2014. (For more details 
on the changes in methodology, see the 
chapter on what is changing in Doing 
Business.) 
Doing Business continues to focus on 
regulations that affect domestic small 
and medium-size enterprises, operat-ing 
in the largest business city of an 
economy, across 10 areas: starting a 
business, dealing with construction 
permits, getting electricity, registering 
property, getting credit, protecting 
minority investors, paying taxes, trad-ing 
across borders, enforcing contracts 
and resolving insolvency. Doing Business 
also measures labor market regulation, 
which is not included in any of the 
aggregate measures. The indicator 
sets for 3 of the 10 topics are being 
expanded in this year’s report; those 
for 5 others will be expanded in next 
year’s report (figure 1.1). 
In another change starting in this year’s 
report, Doing Business has extended its 
coverage to include the second larg-est 
business city in economies with a 
population of more than 100 million. 
These economies are Bangladesh, 
Brazil, China, India, Indonesia, Japan, 
Mexico, Nigeria, Pakistan, the Russian 
Federation and the United States. 
In addition, while Doing Business contin-ues 
to publish the ease of doing business 
ranking, this year’s report introduces a 
change in the basis for the ranking, from 
the percentile rank to the distance to 
frontier score. The distance to frontier 
score benchmarks economies with 
respect to a measure of regulatory best 
practice—showing the gap between 
each economy’s performance and the 
best performance on each indicator.2 
This measure captures more informa-tion 
than the simple rankings previously 
used as the basis for the ease of doing 
business ranking because it shows not 
only how economies are ordered on their 
performance on the indicators but also 
how far apart they are. 
The distance to frontier score also 
provides an important complement 
to the ease of doing business ranking 
in analyzing changes in an economy’s 
business regulatory environment. An 
example at the global level suggests 
why: the time series of the distance to 
frontier scores overwhelmingly shows 
improvements in business regulations 
around the world, while in the ease 
of doing business ranking, for every 
economy that goes up another must go 
down. (For more details on the differ-ences 
between the 2 measures, see the 
chapter on the distance to frontier and 
ease of doing business ranking.) 
While the changes being implemented 
this year are substantive, there is a 
strong correlation at the aggregate 
level between this year’s data under the 
old methodology and the same data 
under the new one (figure 1.2). This is not 
surprising, since changes are being in-troduced 
for only 3 of the 10 topics this 
year. But even with a high correlation 
there can still be relatively large shifts in 
ranking in some cases. This is particu-larly 
likely for economies in the middle 
of the distribution, in part because they 
are more closely bunched and small 
shifts in their distance to frontier scores 
will therefore tend to have a greater im-pact 
on their positions relative to other 
economies. Another reason is that these 
are the economies that historically have 
made more intense efforts to reform 
business regulation. 
The Doing Business website presents 
comparable data for this year and last, 
making it possible to assess the extent 
to which there has been an improve-ment 
in business regulation in any 
economy as tracked by the distance 
to frontier measure. Moreover, because 
most of the changes in methodology 
involve adding new indicators rather 
than revising existing ones, data for 
more than 90% of the previously exist-ing 
indicators remain comparable over 
time. The full series are available on the 
website. 
FIGURE 1.1 What Doing Business continues to cover and what it is adding 
What 
Doing Business 
continues 
to cover 
²ƀaŦͳÊÀƖŦÊŬ½ƀƃĊĥʽƀ³ĶŬƃƀĩÀƀŎĊÀĉĊĩƀĥĊĩĊĥƖĥƀ³ŎĊƃĚƀƃĶƀŬƃŦƃƀƀªƖŬĊĩÊŬŬ 
²ƀaŦͳÊÀƖŦÊŬ½ƀƃĊĥÊƀĩÀƀ³ĶŬƃƀƃĶƀ³ĶĥŎĚÊƃÊƀĚĚƀâĶŦĥĚĊƃĊÊŬƀƃĶƀªƖĊĚÀƀƀƦŦÊĆĶƖŬÊ 
²ƀaŦͳÊÀƖŦÊŬ½ƀƃĊĥÊƀĩÀƀ³ĶŬƃƀƃĶƀöÊƃƀ³ĶĩĩʳƃÊÀƀƃĶƀƃĆÊƀÊĚʳƃŦĊ³ĚƀöŦĊÀ 
²ƀaŦͳÊÀƖŦÊŬ½ƀƃĊĥÊƀĩÀƀ³ĶŬƃƀƃĶƀƃŦĩŬâÊŦƀƀŎŦĶŎÊŦƃƭ 
²ƀMĶƥªĚÊƀ³ĶĚ̏ƃÊŦĚƀ̏ƦŬƀĩÀƀ³ŦÊÀĊƃƀĊĩâĶŦĥƃĊĶĩƀŬƭŬƃÊĥŬ 
²ƀMĊĩĶŦĊƃƭƀŬƏŦÊĆĶĚÀÊŦŬŤƀŦĊöĆƃŬƀĊĩƀŦÊ̏ƃÊÀĉŎŦƃƭƀƃŦĩŬ³ƃĊĶĩŬ 
²ƀaƭĥÊĩƃŬ½ƀƃĊĥÊƀĩÀƀƃĶƃĚƀƃƫƀŦƃÊƀâĶŦƀƀæŦĥƀƃĶƀ³ĶĥŎĚƭƀƦĊƃĆƀĚĚƀƃƫƀŦÊöƖ̏ƃĊĶĩŬ 
²ƀͳƖĥÊĩƃŬ½ƀƃĊĥÊƀĩÀƀ³ĶŬƃƀƃĶƀÊƫŎĶŦƃƀĩÀƀĊĥŎĶŦƃƀªƭƀŬʏŎĶŦƃ 
²ƀaŦͳÊÀƖŦÊŬ½ƀƃĊĥÊƀĩÀƀ³ĶŬƃƀƃĶƀŦÊŬĶĚƥÊƀƀ³ĶĥĥÊŦ³ĊĚƀÀĊŬŎƖƃÊ 
²ƀnĊĥʽƀ³ĶŬƃ½ƀĶƖƃ³ĶĥÊƀĩÀƀŦʳĶƥÊŦƭƀŦƃÊƀâĶŦƀƀ³ĶĥĥÊŦ³ĊĚƀĊĩŬĶĚƥÊĩ³ƭ 
²ƀMĶŦÊƀâʏƃƖŦÊŬƀĶĩƀƃĆÊƀŬƃŦÊĩöƃĆƀĶâƀĚÊöĚƀŦĊöĆƃŬƀĩÀƀÀÊŎƃĆƀĶâƀ³ŦÊÀĊƃƀĊĩâĶŦĥƃĊĶĩ 
²ƀMĶŦÊƀâʏƃƖŦÊŬƀĶĩƀĥĊĩĶŦĊƃƭƀŬƏŦÊĆĶĚÀÊŦŬŤƀŦĊöĆƃŬ 
²ƀƀĥʏŬƖŦÊƀĶâƀƃĆÊƀŬƃŦÊĩöƃĆƀĶâƀƃĆÊƀĚÊöĚƀâŦĥÊƦĶŦėƀâĶŦƀĊĩŬĶĚƥÊĩ³ƭ 
²ƀĩƀÀÀĊƃĊĶĩĚƀ³ĊƃƭƀĊĩƀƃĆÊƀŀŀƀʳĶĩĶĥĊÊŬƀƦĊƃĆƀƀŎĶŎƖ̏ƃĊĶĩƀĶâƀĥĶŦÊƀƃƏĩƀŀƿƿƀĥĊĚĚĊĶĩ 
²ƀŬÊƀĶâƀÀĶĊĩöƀªƖŬĊĩÊŬŬƀŦĩėĊĩöƀªŬÊÀƀĶĩƀƃĆÊƀÀĊŬƃĩ³ÊƀƃĶƀâŦĶĩƃĊÊŦƀŬ³ĶŦÊ 
²ƀMʏŬƖŦÊŬƀĶâƀƃĆÊƀśƖĚĊƃƭƀĶâƀªƖĊĚÀĊĩöƀŦÊöƖ̏ƃĊĶĩŬ 
²ƀMʏŬƖŦÊŬƀĶâƀƃĆÊƀŦÊĚĊªĊĚĊƃƭƀĶâƀƃĆÊƀÊĚʳƃŦĊ³ĊƃƭƀŬƖŎŎĚƭ 
²ƀMʏŬƖŦÊŬƀĶâƀƃĆÊƀśƖĚĊƃƭƀĶâƀƃĆÊƀ̏ĩÀƀÀĥĊĩĊŬƃŦƃĊĶĩƀŬƭŬƃÊĥ 
²ƀMʏŬƖŦÊŬƀĶâƀƃĆÊƀŎĶŬƃæĚĊĩöƀŎŦͳÊŬŬƀĊĩƀŎƭĊĩöƀƃƫÊŬ 
²ƀMʏŬƖŦÊŬƀĶâƀƃĆÊƀśƖĚĊƃƭƀĶâƀƃĆÊƀĕƖÀĊ³ĊĚƀÀĥĊĩĊŬƃŦƃĊĶĩƀŬƭŬƃÊĥ 
What 
this year’s 
report adds 
What 
next year’s 
report will add
OVERVIEW 3 
WHERE ARE REGULATIONS 
MORE BUSINESS-FRIENDLY? 
Singapore continues to be the economy 
with the most business-friendly regu-lations 
(table 1.1). And while there was 
some reordering of economies within 
the top 20 in the ease of doing business 
ranking, the list remains very similar to 
last year’s: 17 economies stayed on the 
list, while 3 entered this year—Estonia, 
Germany and Switzerland. Economies 
in the top 20 continued to improve 
their business regulatory environ-ment 
in the past year. For example, 
Switzerland made starting a business 
easier by introducing online procedures 
and strengthened minority investor 
protections by increasing the level of 
transparency required from listed com-panies. 
And Sweden made registering 
property easier through a new online 
system that became fully operational 
in the past year. The system provides 
comprehensive coverage, allowing us-ers 
to conduct searches and file regis-trations 
from anywhere in the country. 
The 20 economies at the top of the 
ease of doing business ranking perform 
well not only on the Doing Business 
indicators but also in other interna-tional 
data sets capturing dimensions 
of competitiveness. The economies 
performing best in the Doing Business 
rankings therefore are not those with 
no regulation but those whose govern-ments 
have managed to create rules 
that facilitate interactions in the mar-ketplace 
without needlessly hindering 
the development of the private sector. 
Moreover, even outside the top 20 
economies there is an association be-tween 
performance in the ease of doing 
business ranking and performance on 
measures of quality of government and 
governance. For example, in a sample 
of 78 mostly low- and lower-middle-income 
economies the distance to 
frontier score is strongly correlated 
with the International Development 
Association (IDA) Resource Allocation 
Index, which measures the quality of 
a country’s policies and institutional 
arrangements.3 
The distance to frontier scores under-lying 
the ease of doing business rank-ings 
reveal some regional patterns. 
OECD high-income economies have the 
highest distance to frontier scores on 
average, indicating that this regional 
group has the most business-friendly 
regulations overall (figure 1.3). But best 
practices in business regulation can be 
FIGURE 1.2 Distance to frontier scores remain similar under the new methodology 
100 
90 
80 
70 
60 
50 
40 
30 
30 40 50 60 70 80 90 100 
Distance to frontier score 
under new methodology (0–100) 
Distance to frontier score 
under old methodology (0–100) 
Note: The figure compares distance to frontier scores based on this year’s data computed using the old (Doing Business 2014) 
methodology with scores based on the same data computed using the new methodology. The differences between the 2 
series are in protecting minority investors, resolving insolvency, the depth of credit information index in getting credit and the 
distance to frontier calculation for the total tax rate in paying taxes. It is not possible to isolate the changes in the strength 
of legal rights index in getting credit. The 45-degree line shows where the scores under the old and new methodologies are 
equal. The correlation between the 2 scores is 0.99. For analysis of the effect of the change in ranking calculation, see figure 
3.1 in the chapter on what is changing in Doing Business. 
Source: Doing Business database. 
FIGURE 1.3 Big gaps between the highest and lowest distance to frontier scores in 
some regions 
100 
80 
60 
40 
20 
0 
51.87 
Sub-Saharan 
Africa 
54.56 
South 
Asia 
59.23 
Middle 
East  North 
Africa 
60.66 
Latin 
America  
Caribbean 
63.19 
East Asia  
Pacific 
66.67 
Europe  
Central Asia 
76.47 
OECD high 
income 
74.81 
Worst score Best score Average score 
66.70 
86.91 
48.57 
79.46 
43.55 
88.27 
41.41 
72.29 
33.35 
76.81 
41.16 
61.36 
33.16 
Distance to frontier score 
Source: Doing Business database.
4 DOING BUSINESS 2015 
TABLE 1.1 Ease of doing business ranking 
Rank Economy DTF score Rank Economy DTF score Rank Economy DTF score 
1 Singapore 88.27 64 Cyprus 66.55 127 Mozambique 56.92 
2 New Zealand 86.91 65 Croatia 66.53 128 Lesotho 56.64 
3 Hong Kong SAR, China 84.97 66 Oman 66.39 128 Pakistan 56.64 
4 Denmark 84.20 67 Samoa 66.17 130 Iran, Islamic Rep. 56.51 
5 Korea, Rep. 83.40 68 Albania 66.06 131 Tanzania 56.38 
6 Norway 82.40 69 Tonga 65.72 132 Ethiopia 56.31 
7 United States 81.98 70 Ghana 65.24 133 Papua New Guinea 55.78 
8 United Kingdom 80.96 71 Morocco 65.06 134 Kiribati 55.48 
9 Finland 80.83 72 Mongolia 65.02 135 Cambodia 55.33 
10 Australia 80.66 73 Guatemala 64.88 136 Kenya 54.98 
11 Sweden 80.60 74 Botswana 64.87 137 Yemen, Rep. 54.84 
12 Iceland 80.27 75 Kosovo 64.76 138 Gambia, The 54.81 
13 Ireland 80.07 76 Vanuatu 64.60 139 Marshall Islands 54.72 
14 Germany 79.73 77 Kazakhstan 64.59 140 Sierra Leone 54.58 
15 Georgia 79.46 78 Vietnam 64.42 141 Uzbekistan 54.26 
16 Canada 79.09 79 Trinidad and Tobago 64.24 142 India 53.97 
17 Estonia 78.84 80 Azerbaijan 64.08 143 West Bank and Gaza 53.62 
18 Malaysia 78.83 81 Fiji 63.90 144 Gabon 53.43 
19 Taiwan, China 78.73 82 Uruguay 63.89 145 Micronesia, Fed. Sts. 53.07 
20 Switzerland 77.78 83 Costa Rica 63.67 146 Mali 52.59 
21 Austria 77.42 84 Dominican Republic 63.43 147 Côte d’Ivoire 52.26 
22 United Arab Emirates 76.81 85 Seychelles 63.16 148 Lao PDR 51.45 
23 Latvia 76.73 86 Kuwait 63.11 149 Togo 51.29 
24 Lithuania 76.31 87 Solomon Islands 63.08 150 Uganda 51.11 
25 Portugal 76.03 88 Namibia 62.81 151 Benin 51.10 
26 Thailand 75.27 89 Antigua and Barbuda 62.64 152 Burundi 51.07 
27 Netherlands 75.01 90 China 62.58 153 São Tomé and Príncipe 50.75 
28 Mauritius 74.81 91 Serbia 62.57 154 Algeria 50.69 
29 Japan 74.80 92 Paraguay 62.50 155 Djibouti 50.48 
30 Macedonia, FYR 74.11 93 San Marino 62.44 156 Iraq 50.36 
31 France 73.88 94 Malta 62.11 157 Bolivia 49.95 
32 Poland 73.56 95 Philippines 62.08 158 Cameroon 49.85 
33 Spain 73.17 96 Ukraine 61.52 159 Comoros 49.56 
34 Colombia 72.29 97 Bahamas, The 61.37 160 Sudan 49.55 
35 Peru 72.11 97 Dominica 61.37 161 Senegal 49.37 
36 Montenegro 72.02 99 Sri Lanka 61.36 162 Suriname 49.29 
37 Slovak Republic 71.83 100 St. Lucia 61.35 163 Madagascar 49.25 
38 Bulgaria 71.80 101 Brunei Darussalam 61.26 164 Malawi 49.20 
39 Mexico 71.53 102 Kyrgyz Republic 60.74 165 Equatorial Guinea 49.01 
40 Israel 71.25 103 St. Vincent and the Grenadines 60.66 166 Tajikistan 48.57 
41 Chile 71.24 104 Honduras 60.61 167 Burkina Faso 48.36 
42 Belgium 71.11 104 Lebanon 60.61 168 Niger 47.63 
43 South Africa 71.08 106 Barbados 60.57 169 Guinea 47.42 
44 Czech Republic 70.95 107 Bosnia and Herzegovina 60.55 170 Nigeria 47.33 
45 Armenia 70.60 108 Nepal 60.33 171 Zimbabwe 46.95 
46 Rwanda 70.47 109 El Salvador 59.93 172 Timor-Leste 46.89 
47 Puerto Rico (U.S.) 70.35 110 Swaziland 59.77 173 Bangladesh 46.84 
48 Romania 70.22 111 Zambia 59.65 174 Liberia 46.61 
49 Saudi Arabia 69.99 112 Egypt, Arab Rep. 59.54 175 Syrian Arab Republic 46.51 
50 Qatar 69.96 113 Palau 59.50 176 Mauritania 44.21 
51 Slovenia 69.87 114 Indonesia 59.15 177 Myanmar 43.55 
52 Panama 69.22 115 Ecuador 58.88 178 Congo, Rep. 43.29 
53 Bahrain 69.00 116 Maldives 58.73 179 Guinea-Bissau 43.21 
54 Hungary 68.80 117 Jordan 58.40 180 Haiti 42.18 
55 Turkey 68.66 118 Belize 58.14 181 Angola 41.85 
56 Italy 68.48 119 Nicaragua 58.09 182 Venezuela, RB 41.41 
57 Belarus 68.26 120 Brazil 58.01 183 Afghanistan 41 .1 6 
58 Jamaica 67.79 121 St. Kitts and Nevis 58.00 184 Congo, Dem. Rep. 40.60 
59 Luxembourg 67.60 122 Cabo Verde 57.94 185 Chad 37.25 
60 Tunisia 67.35 123 Guyana 57.83 186 South Sudan 35.72 
61 Greece 66.70 124 Argentina 57.48 187 Central African Republic 34.47 
62 Russian Federation 66.66 125 Bhutan 57.47 188 Libya 33.35 
63 Moldova 66.60 126 Grenada 57.35 189 Eritrea 33.16 
Note: The rankings are benchmarked to June 2014 and based on the average of each economy’s distance to frontier (DTF) scores for the 10 topics included in this year’s aggregate ranking. For 
the economies for which the data cover 2 cities, scores are a population-weighted average for the 2 cities. An arrow indicates an improvement in the score between 2013 and 2014 (and therefore 
an improvement in the overall business environment as measured by Doing Business), while the absence of one indicates either no improvement or a deterioration in the score. The score for both 
years is based on the new methodology. 
Source: Doing Business database.
OVERVIEW 5 
found in almost all regions. In 6 of the 
7 regions the highest distance to fron-tier 
score is above 70. The difference 
between the best and worst scores in 
a region can be substantial, however, 
especially in East Asia and the Pacific, 
the Middle East and North Africa and 
Sub-Saharan Africa. 
WHO IMPROVED THE MOST 
IN 2013/14? 
Since 2004 the Doing Business report 
has captured more than 2,400 regula-tory 
reforms making it easier to do 
business. In the year from June 1, 2013, 
to June 1, 2014, 123 economies imple-mented 
at least one reform in the areas 
measured by Doing Business—230 in 
total. More than 63% of these reforms 
reduced the complexity and cost of 
regulatory processes, while the oth-ers 
strengthened legal institutions. 
Twenty-one economies, including 6 in 
Sub-Saharan Africa and 6 in the OECD 
high-income group, implemented 3 or 
more reforms reducing burdensome 
bureaucracy or improving legal and 
regulatory frameworks.4 Globally, more 
than 80% of the economies covered by 
Doing Business had an improvement in 
their distance to frontier score—it is 
now easier to do business in most parts 
of the world. 
Sub-Saharan Africa, the region with 
the largest number of economies, 
accounted for the largest number 
of regulatory reforms in 2013/14, 
with 39 reducing the complexity and 
cost of regulatory processes and 36 
strengthening legal institutions. As in 
previous years, however, Europe and 
Central Asia had the largest share of 
economies implementing at least one 
regulatory reform, with some 85% 
doing so (figure 1.4). Sub-Saharan 
Africa had the second largest share 
of economies implementing at least 
one reform and the second largest 
average improvement in distance to 
frontier scores. Latin America and the 
Caribbean and South Asia remain the 
2 regions with the smallest share of 
economies implementing regulatory 
reforms as captured by Doing Business. 
Among the 21 economies with the most 
reforms making it easier to do business 
in 2013/14, 10 stand out as having 
improved the most in performance on 
the Doing Business indicators: Tajikistan, 
Benin, Togo, Côte d’Ivoire, Senegal, 
Trinidad and Tobago, the Democratic 
Republic of Congo, Azerbaijan, Ireland 
and the United Arab Emirates (table 1.2). 
Together, these 10 top improvers imple-mented 
40 regulatory reforms making 
it easier to do business. Among these 10, 
only Côte d’Ivoire featured among the 10 
top improvers in last year’s report. And 
only 4 place among the top 100 in the 
overall ease of doing business ranking; 
Ireland has the highest ranking, at 13. 
Being recognized as top improvers does 
not mean that these economies have ex-emplary 
business regulations; instead, it 
shows that thanks to serious efforts in 
regulatory reform in the past year, they 
made the biggest advances toward the 
frontier in regulatory practice (figure 
1.5). Many of the 10 top improvers still 
face many challenges on their way to 
international best practices in business 
regulation, including high bureaucratic 
obstacles, political instability and weak 
financial institutions. 
Among the 10 top improvers, Tajikistan 
made the biggest advance toward the 
regulatory frontier in the past year, 
thanks to improvements in several ar-eas. 
For example, starting a business 
in Tajikistan is now easier as a result of 
the implementation of new software 
at the one-stop shop and the elimina-tion 
of one of the business registration 
procedures. A reduction of fees made 
FIGURE 1.4 Europe and Central Asia had both the largest share of economies making 
it easier to do business in 2013/14 . . . 
Share of economies with at least one reform 
making it easier to do business (%) 
100 
80 
60 
40 
20 
0 
85 
. . . and the biggest average improvement in distance to frontier scores 
Average change in distance to frontier score 
between 2013 and 2014 
2.0 
1.5 
1.0 
0.5 
0 
South 
Asia 
Latin America 
 Caribbean 
Middle East 
 North Africa 
East Asia 
 Pacific 
OECD 
high income 
Sub-Saharan 
Africa 
Europe  
Central Asia 
South 
Asia 
Latin America  
Caribbean 
Middle East  
North Africa 
East Asia 
 Pacific 
OECD 
high income 
Sub-Saharan 
Africa 
Europe  
Central Asia 
74 
65 
60 
55 
50 50 
1.56 
1.11 
0.77 0.74 
0.52 
0.39 0.31 
Source: Doing Business database.
6 DOING BUSINESS 2015 
TABLE 1.2 The 10 economies improving the most across 3 or more areas measured by Doing Business in 2013/14 
Reforms making it easier to do business 
Ease of 
doing 
business 
rank 
Starting a 
business 
Dealing with 
construction 
permits 
Getting 
electricity 
Registering 
property 
Getting 
credit 
Protecting 
minority 
investors 
Paying 
taxes 
Trading 
across 
borders 
Enforcing 
contracts 
Resolving 
insolvency 
Tajikistan 166 √ √ √ √ 
Benin 151 √ √ √ √ 
Togo 149 √ √ √ √ 
Côte d’Ivoire 147 √ √ √ √ √ 
Senegal 161 √ √ √ √ √ √ 
Trinidad and Tobago 79 √ √ √ 
Congo, Dem. Rep. 184 √ √ √ √ √ 
Azerbaijan 80 √ √ √ 
Ireland 13 √ √ √ 
United Arab Emirates 22 √ √ √ 
Note: Economies are selected on the basis of the number of their reforms and ranked on how much their distance to frontier score improved. First, Doing Business selects the economies that 
implemented reforms making it easier to do business in 3 or more of the 10 topics included in this year’s aggregate distance to frontier score. Regulatory changes making it more difficult 
to do business are subtracted from the number of those making it easier. Second, Doing Business ranks these economies on the improvement in their distance to frontier score from the 
previous year. The improvement in their score is calculated not by using the data published in 2013 but by using comparable data that capture data revisions and methodology changes. 
The choice of the most improved economies is determined by the largest improvements in the distance to frontier score among those with at least 3 reforms. 
Source: Doing Business database. 
FIGURE 1.5 How far have economies moved toward the frontier in regulatory practice since 2013? 
Distance to frontier score 
100 
75 
50 
25 
0 
Singapore 
New Zealand 
Hong Kong SAR, China 
Denmark 
Korea, Rep. 
Norway 
United States 
United Kingdom 
Finland 
Australia 
Sweden 
Iceland 
Ireland 
Germany 
Georgia 
Canada 
Estonia 
Malaysia 
Taiwan, China 
Switzerland 
Austria 
United Arab Emirates 
Latvia 
Lithuania 
Portugal 
Thailand 
Netherlands 
Mauritius 
Japan 
Macedonia, FYR 
France 
Poland 
Spain 
Colombia 
Peru 
Montenegro 
Slovak Republic 
Bulgaria 
Mexico 
Israel 
Chile 
Belgium 
South Africa 
Czech Republic 
Armenia 
Rwanda 
Puerto Rico (U.S.) 
Romania 
Saudi Arabia 
Qatar 
Slovenia 
Panama 
Bahrain 
Hungary 
Turkey 
Italy 
Belarus 
Jamaica 
Luxembourg 
Tunisia 
Greece 
Russian Federation 
Moldova 
Cyprus 
Croatia 
Oman 
Samoa 
Albania 
Tonga 
Ghana 
Morocco 
Mongolia 
Guatemala 
Botswana 
Kosovo 
Vanuatu 
Kazakhstan 
Vietnam 
Trinidad and Tobago 
Azerbaijan 
Fiji 
Uruguay 
Costa Rica 
Dominican Republic 
Seychelles 
Kuwait 
Solomon Islands 
Namibia 
Antigua and Barbuda 
China 
Serbia 
Paraguay 
San Marino 
Regulatory frontier 
2014 
2013 
Note: The distance to frontier score shows how far on average an economy is at a point in time from the best performance achieved by any economy on each Doing Business indicator since 
2005 or the third year in which data for the indicator were collected. The measure is normalized to range between 0 and 100, with 100 representing the frontier. The vertical bars show the 
change in the distance to frontier score from 2013 to 2014; for more details, see the note to table 1.1. The 30 economies improving the most are highlighted in red. 
Source: Doing Business database.
OVERVIEW 7 
dealing with construction permits 
less costly, and the introduction of an 
electronic system for filing and paying 
the corporate income tax, value added 
tax and labor taxes made paying taxes 
easier. Finally, the Credit Information 
Bureau of Tajikistan improved access 
to credit information by starting to 
provide credit scores in June 2013. 
Eight of the 10 top improvers carried 
out reforms making it easier to start a 
business, while 7 implemented reforms 
making it easier to get credit. Some 
of these changes were inspired by 
transnational initiatives. One such ini-tiative 
was the revision by the Council 
of Ministers of the Organization for 
the Harmonization of Business Law 
in Africa (OHADA) of the Uniform 
Act on Commercial Companies and 
Economic Interest Groups. The revised 
act authorizes each member state to 
adopt national legislation reducing 
its paid-in minimum capital require-ment— 
the amount of capital that 
entrepreneurs need to deposit in a 
bank account or with a notary before 
or within 3 months of incorporation. 
Benin, Côte d’Ivoire, Senegal and Togo 
were all among the OHADA member 
economies that did so in 2013/14. 
Côte d’Ivoire and Senegal also took 
measures within the framework of the 
West African Economic and Monetary 
Union. Both adopted the Uniform Law 
on the Regulation of Credit Information 
Bureaus ahead of other member 
states, providing a legal framework to 
establish credit information bureaus. 
Reforms making it easier to get credit 
were also undertaken at the national 
level. In the United Arab Emirates the 
credit bureau Emcredit and the Dubai 
Electricity and Water Authority (DEWA) 
began exchanging credit information 
in October 2013. As a result, the credit 
bureau can now identify customers with 
unpaid DEWA accounts beyond 90 days 
and the utility has access to the bureau’s 
bounced check repository. Ireland im-proved 
its credit information system by 
passing a new act that provides for the 
establishment and operation of a credit 
registry. And in Trinidad and Tobago a 
new insolvency law strengthened pro-tections 
of secured creditors’ rights in 
insolvency proceedings, giving greater 
flexibility in enforcement actions. 
Six of the 10 top improvers reformed 
their property registration processes 
and 6 strengthened the rights of mi-nority 
shareholders, with Côte d’Ivoire, 
Senegal, Togo and the United Arab 
South Sudan 
Central African Republic 
Libya 
Eritrea 
Malta 
Philippines 
Ukraine 
Bahamas, The 
Sri Lanka 
St. Lucia 
Brunei Darussalam 
Kyrgyz Republic 
St. Vincent and the Grenadines 
Honduras 
Lebanon 
Barbados 
Bosnia and Herzegovina 
Nepal 
El Salvador 
Swaziland 
Zambia 
Egypt, Arab Rep. 
Palau 
Indonesia 
Ecuador 
Maldives 
Jordan 
Belize 
Nicaragua 
Brazil 
St. Kitts and Nevis 
Cabo Verde 
Guyana 
Argentina 
Bhutan 
Grenada 
Mozambique 
Pakistan 
Lesotho 
Iran, Islamic Rep. 
Tanzania 
Ethiopia 
Papua New Guinea 
Kiribati 
Cambodia 
Kenya 
Yemen, Rep. 
Gambia, The 
Marshall Islands 
Sierra Leone 
Uzbekistan 
India 
West Bank and Gaza 
Gabon 
Micronesia, Fed. Sts. 
Mali 
Côte d’Ivoire 
Lao PDR 
Togo 
Uganda 
Benin 
Burundi 
São Tomé and Príncipe 
Algeria 
Djibouti 
Iraq 
Bolivia 
Cameroon 
Comoros 
Sudan 
Senegal 
Suriname 
Madagascar 
Malawi 
Equatorial Guinea 
Tajikistan 
Burkina Faso 
Niger 
Guinea 
Nigeria 
Zimbabwe 
Timor-Leste 
Bangladesh 
Liberia 
Syrian Arab Republic 
Mauritania 
Myanmar 
Congo, Rep. 
Guinea-Bissau 
Haiti 
Angola 
Venezuela, RB 
Afghanistan 
Congo, Dem. Rep. 
Chad 
Dominica 
.
8 DOING BUSINESS 2015 
Emirates reforming in both these areas. 
These 4 economies strengthened mi-nority 
investor protections by making 
it possible for shareholders to inspect 
documents pertaining to related-party 
transactions as well as to appoint audi-tors 
to conduct inspections. Moreover, 
the United Arab Emirates introduced 
additional approval requirements for 
related-party transactions, greater 
requirements for disclosure of such 
transactions to the stock exchange and 
a requirement that interested directors 
be held liable if a related-party transac-tion 
is unfair or constitutes a conflict of 
interest. The United Arab Emirates also 
made it possible for shareholders to 
request the rescission of unfair related-party 
transactions. 
Highlights of reforms making it easier 
to register property include Azerbaijan’s 
introduction of an online procedure for 
obtaining nonencumbrance certificates 
for property transfers. Senegal made 
property transfers easier by eliminating 
the requirement for authorization by 
the tax authority. Now applicants for a 
property transfer need only notify the 
tax authority before proceeding with 
the property transaction at the land 
registry. 
Two of the 10 top improvers imple-mented 
reforms making it easier to 
trade across borders. Benin reduced 
the number of documents needed for 
customs clearance of imports. The 
technical standard or health certifi-cate 
is now no longer required except 
for food imports. Côte d’Ivoire simpli-fied 
the process for producing the 
inspection report for imported cargo 
and lowered port and terminal han-dling 
charges at the port of Abidjan 
by introducing new customs and port 
management. 
Among the areas with the fewest 
reforms by the 10 top improvers are 
enforcing contracts, with 2, and re-solving 
insolvency, with 1. Benin made 
enforcing contracts easier by creating 
a commercial section within its court 
of first instance. Trinidad and Tobago 
made resolving insolvency easier by 
introducing a statutory mechanism 
for rehabilitation of insolvent compa-nies 
as an alternative to previously 
available voluntary and court-ordered 
winding-up proceedings. (For more de-tail 
on the reform patterns in the past 
year, see the chapter on reforming the 
business environment.) 
WHAT DO THE NEW DATA 
SHOW ABOUT DIFFERENCES 
BETWEEN CITIES? 
Subnational Doing Business reports 
have covered more than 300 cities in 
55 economies in the nearly 10 years 
that they have been published. For the 
first time this year, the global Doing 
Business report also extends its cover-age 
beyond the largest business city in 
each economy. For the 11 economies 
with a population of more than 100 
million, Doing Business now covers the 
second largest business city as well as 
the largest one. The data provide new 
insights into the variability of business 
regulation within economies. 
The sets of indicators showing limited 
variability across cities in the same 
economy tend to be those measuring 
the strength of legal institutions— 
getting credit, protecting minority 
investors, enforcing contracts and 
resolving insolvency, which mainly 
draw from national laws with general 
applicability (figure 1.6). Variability is 
more common for the sets of indicators 
measuring the complexity and cost 
of regulatory processes—starting a 
business, dealing with construction 
permits, getting electricity, registering 
property, paying taxes and trading 
across borders. But this variability 
is more likely to be in time and cost 
than in the number of procedures, 
suggesting that in most cases the law 
is the same across cities though its 
implementation may vary. 
In all 11 economies the data for getting 
credit—both on the strength of legal 
rights and on the depth of credit 
information—are the same for the 2 
cities covered. This is easy to explain. 
Credit information systems tend to 
operate at the national level, not at 
the city or state level. Collateral laws 
also tend to be national, and even in 
the United States, where these laws 
are under state jurisdiction, there is 
enough legal harmonization so that 
the 2 cities in the sample have the 
same score on the strength of legal 
rights index. In the area of protecting 
minority investors all 11 economies 
again show no difference between 
the 2 cities in the aggregate score. 
In the United States, however, there 
are differences in some of the data 
embedded in the indicators for Los 
Angeles and New York City—because 
company law is under state jurisdiction 
and there are measurable differences 
between the California and New York 
company law. 
In the area of resolving insolvency only 
4 of the 11 economies have a difference 
between the 2 cities in the recovery 
rate and none have a difference in 
the strength of insolvency framework 
index. The pattern is different in the 
area of enforcing contracts. Only 4 of 
the 11 economies have a difference in 
the number of procedures to resolve 
a commercial dispute. In all 4 of these 
economies one of the pair of cities 
has a specialized commercial court 
(Rio de Janeiro, Monterrey, Lagos and 
New York City) while the other does 
not (São Paulo, Mexico City, Kano and 
Los Angeles). But the time and cost 
to resolve a commercial dispute dif-fer 
between the 2 cities in 7 of the 11 
economies and the differences in time 
can be significant. In Nigeria, for ex-ample, 
resolving a commercial dispute 
takes 720 days in Kano but 447 days 
in Lagos. 
There is also more variation at the 
city level in the other indicators. For
OVERVIEW 9 
example, only 4 economies have the 
same tax system in both the 2 major 
business cities—Bangladesh, India, 
Indonesia and Nigeria. In all the other 
large economies the total tax rate 
differs between the 2 cities. In the 
area of starting a business the paid-in 
minimum capital requirement is the 
same in the 2 cities in all 11 economies, 
and the number of procedures differs 
in only 4 economies. But the time and 
cost to start a business differ between 
the 2 cities in 8 economies. Only in 
Bangladesh and Pakistan is the pro-cess 
the same in the 2 cities. Similarly, 
the procedures to transfer a property 
between 2 firms differ in only 4 econo-mies 
but the cost to do so differs in 9 
economies. Only in Japan and Russia 
is the process the same in the 2 cities. 
In dealing with construction permits 
and getting electricity 10 economies 
show some degree of difference 
between the 2 cities, and in trading 
across borders all 11 economies do so. 
These are the areas of regulation mea-sured 
by Doing Business where location 
matters the most. Building permits are 
commonly issued by municipalities. 
Similarly, electricity connections are 
often provided by local utilities. And 
the distance to the nearest port is an 
important factor in determining the 
time and cost to export and import, 
leading to differences even within the 
same economy. 
Labor market regulation can also vary 
across cities within an economy. In 6 of 
the 11 economies—Brazil, China, India, 
Indonesia, Japan and Russia—the 2 
cities in the sample have different 
minimum wage levels. This is mainly to 
account for differences in the cost of 
living. In all these cases except Brazil 
and India, the largest business city 
has a higher minimum wage than the 
second largest one. In addition, in India 
the largest business city (Mumbai) has 
longer paid annual leave, with 21 days, 
than the second largest one (Delhi), 
with 15. 
Does city size matter for having 
business-friendly regulations? At first 
glance the data suggest that it does 
not. In 6 of the 11 economies the larg-est 
business city performs better on 
the Doing Business indicators overall 
than the second largest one, while in 
the other 5 the second largest busi-ness 
city has the higher score. And in 
the economies where the second larg-est 
business city has a substantially 
smaller population (at most 30% of the 
largest business city’s population), the 
second city has more business-friendly 
regulations overall. This is the case for 
Kano, Monterrey and Surabaya. 
Among the 11 economies, the United 
States has the highest number of 
differences between the largest and 
second largest business cities: Los 
Angeles and New York City differ in 
9 of the 10 topics (while the 2 cities 
have the same overall score on the 
strength of minority investor protec-tions, 
they have differences in the 
underlying indicators). Japan has the 
fewest: Osaka and Tokyo differ in only 
4 topics—starting a business, getting 
electricity, paying taxes and trading 
across borders. Overall, the differ-ences 
between cities within the same 
economy are very small, as shown in 
figure 3.2 in the chapter on what is 
changing in Doing Business. 
WHAT IS THE 
RELATIONSHIP BETWEEN 
EFFICIENCY AND QUALITY? 
One of the big innovations in this year’s 
report is the expansion of the data on 
the quality of regulation. Measuring 
aspects of the quality of regulation is 
not new for Doing Business; some indi-cator 
sets, such as getting credit and 
protecting minority investors, already 
included a focus on regulatory quality. 
But starting this year a systematic ef-fort 
is being made to include measures 
of quality in most of the indicator sets. 
This year’s report introduces a new 
measure of quality in the resolving 
insolvency indicator set and expands 
the measures of quality in the getting 
FIGURE 1.6 Indicators measuring the strength of legal institutions show less 
difference between cities within economies than those measuring the complexity and 
cost of regulatory processes 
Starting a business 
Dealing with 
construction permits 
Getting electricity 
Registering property 
Getting credit 
Protecting minority 
investors 
Paying taxes 
Trading across 
borders 
Enforcing contracts 
Resolving insolvency 
9 
10 
10 
9 
7 
8 
4 
11 
0 1 2 3 4 5 6 7 8 9 10 11 
Distance to frontier score differs between 
largest and second largest business cities 
Average difference in 
distance to frontier score 
(absolute value) 
2.99 
6.96 
7.53 
4.84 
0.00 
0.00 
0.34 
4.18 
3.06 
0.55 
Distance to frontier score is the same for 
largest and second largest business cities 
Note: The figure shows data for the 11 large economies for which Doing Business covers both the largest and the second 
largest business city. 
Source: Doing Business database.
10 DOING BUSINESS 2015 
credit and protecting minority inves-tors 
indicator sets. Next year’s report 
will add measures of regulatory quality 
to the indicator sets for dealing with 
construction permits, getting electric-ity, 
registering property, paying taxes 
and enforcing contracts. 
The results so far suggest that effi-ciency 
and quality go hand in hand. For 
resolving insolvency the data show that 
there is a positive correlation between 
the recovery rate for creditors and the 
strength of the legal framework for 
insolvency (figure 1.7). The recovery 
rate measures the cents on the dollar 
recouped by secured creditors through 
insolvency proceedings and is a measure 
of efficiency because time and cost are 2 
important components. The strength of 
insolvency framework index measures 
how well insolvency laws accord with in-ternationally 
recognized good practices 
and is therefore a proxy for quality. 
Very few economies have an insolvency 
system with both high efficiency (a 
recovery rate of more than 50 cents on 
the dollar) and low quality (a score on the 
strength of insolvency framework index 
of less than 8 of the possible 16 points). 
But many economies have an insolvency 
system with low efficiency and high 
quality. These are economies that have 
well-designed laws but face challenges 
in implementing them effectively. 
These results suggest that well-designed 
laws are necessary but not 
sufficient to achieve efficiency in an in-solvency 
system. The Federated States 
of Micronesia, for example, has a score 
of 11.5 on the strength of insolvency 
framework index, yet creditors in that 
country should expect to recover only 
3.3 cents for every dollar they have 
loaned to a firm that becomes insol-vent. 
So an insolvency law of above-average 
quality does not necessarily 
mean above-average recovery rates for 
creditors. On average, though, econo-mies 
with better-designed laws tend to 
have higher recovery rates. 
FIGURE 1.7 Better insolvency laws, higher recovery rate 
High quality, 
low efficiency 
Preliminary data for a new indicator 
being developed to measure regula-tory 
quality in registering property 
reinforce the idea that efficiency and 
quality go hand in hand: economies 
that offer a simple, fast and inexpen-sive 
process for transferring property 
are also likely to have a land adminis-tration 
system providing reliable land 
records (figure 1.8). 
The new indicator under development 
measures the reliability, transpar-ency 
and geographic coverage of land 
administration systems as well as ele-ments 
of land dispute resolution. The 
indicator focuses on such aspects as 
whether the land registry and mapping 
system (cadastre) have adequate infra-structure 
to guarantee high standards 
of quality for the information recorded, 
whether information is easily acces-sible 
to the public and whether the land 
registry and cadastre cover the entire 
territory of the economy. Preliminary 
data show that virtually all economies 
that score well on the overall quality of 
land administration (with a distance 
to frontier score above 50 for the 
indicator) also score well on efficiency 
in transferring property (with an aver-age 
distance to frontier score above 50 
for the procedures, time and cost). 
But many economies have a property 
transfer process that is efficient yet 
lacks quality. Thus while these econo-mies 
make the transfer of property 
simple, fast and inexpensive, the lack 
of quality in the land administration 
system is likely to undermine the value 
of the property title. In the Republic 
of Yemen, for example, a transfer of 
property between 2 firms takes 6 
procedures and only 19 days and costs 
1.8% of the property value. But the land 
administration system keeps most of 
the land records on paper and does not 
assign a unique, searchable number 
to land parcels, making it difficult to 
provide reliable information. 
Efforts are ongoing for other Doing 
Business topics as well. Preliminary data 
for a new measure of judicial quality and 
court infrastructure show a clear posi-tive 
link between efficiency and qual-ity 
in the area of enforcing contracts. 
Micronesia, Fed. Sts. 
Canada 
Cyprus 
0 10 20 30 40 50 60 70 80 90 100 
16 
14 
12 
10 
8 
6 
4 
2 
0 
Venezuela, RB 
Low quality, 
low efficiency 
High quality, 
high efficiency 
Low quality, 
high efficiency 
Strength of insolvency 
framework index (0–16) 
Recovery rate (cents on the dollar) 
Note: The correlation between the strength of insolvency framework index and the recovery rate is 0.59. The 
relationship is significant at the 1% level after controlling for income per capita. 
Source: Doing Business database.
OVERVIEW 11 
Economies that make resolving a com-mercial 
dispute simpler, faster and less 
expensive also tend to have a judicial 
system that follows well-established 
good practices—such as having a spe-cialized 
commercial court or division, 
having a small claims court, offering 
arbitration and voluntary mediation and 
making judgments in commercial cases 
available to the general public. 
Unlike for resolving insolvency and 
registering property, however, for 
enforcing contracts the economies 
are more evenly spread across the 4 
quadrants of quality and efficiency 
(figure 1.9). Singapore is among those 
that combine high efficiency and high 
quality. In that country resolving the 
standard commercial dispute in the 
Doing Business case study takes only 
21 procedures and 150 days and costs 
25.8% of the value of the claim. And not 
surprisingly, the judicial system follows 
several internationally recognized good 
practices, such as having a separate 
commercial court, providing arbitra-tion, 
making judgments available to 
the public, using case management 
and allowing plaintiffs to file their initial 
complaint electronically. On the other 
hand, the judicial system in Mongolia, 
with no specialized commercial court 
or small claims court, can resolve the 
standard commercial dispute through 
32 procedures in 374 days and at a 
cost of 30.6% of the claim value. 
WHAT ARE THE BENEFITS 
OF MORE BUSINESS-FRIENDLY 
REGULATIONS? 
As earlier Doing Business reports have 
discussed, the benefits of business-friendly 
regulations are well established 
in the economic literature. To name just 
a few: 
ƒ Reforms simplifying business regis-tration 
lead to more firm creation.5 
ƒ Increasing trade openness has 
greater effects on growth where 
labor markets are more flexible.6 
FIGURE 1.8 Better land administration system, faster property transfers 
Distance to frontier score for overall 
quality of land administration 
100 
90 
80 
70 
60 
50 
40 
30 
20 
10 
0 
0 10 20 30 40 50 60 70 80 90 100 
Distance to frontier score for registering property 
High quality, 
low efficiency 
Low quality, 
low efficiency 
Low quality, 
high efficiency 
Belgium 
Sweden 
Yemen, Rep. 
Afghanistan 
High quality, 
high efficiency 
Note: The figure compares the distance to frontier score for the existing registering property indicators with the 
distance to frontier score for the new indicator on the quality of land administration (to be published for the first 
time in Doing Business 2016). The data for the new indicator are obtained through a set of questions on reliability, 
transparency, coverage and dispute resolution. For example, an economy receives 1 point if it has a functional 
electronic database for encumbrances, 1 point if it makes the documents and fee schedules for property registration 
publicly available (online or on public boards), 1 point if it compiles statistics on land transactions and makes them 
publicly available, and so on. The correlation between the 2 distance to frontier scores is 0.56. The relationship is 
significant at the 1% level after controlling for income per capita. 
Source: Doing Business database. 
FIGURE 1.9 Better courts, faster courts 
Distance to frontier score for 
judicial quality index 
Singapore 
Belize 
Mongolia 
Angola 
0 10 20 30 40 50 60 70 80 90 100 
100 
90 
80 
70 
60 
50 
40 
30 
20 
10 
0 
Distance to frontier score for enforcing contracts 
High quality, 
low efficiency 
Low quality, 
low efficiency 
High quality, 
high efficiency 
Low quality, 
high efficiency 
Note: The figure compares the distance to frontier score for the existing enforcing contracts indicators with the distance 
to frontier score for the new index on judicial quality (to be published for the first time in Doing Business 2016). The index 
measures such aspects as whether the judicial system has a specialized commercial court or division, has a small claims 
court, offers voluntary mediation and arbitration and makes judgments in commercial cases available to the general 
public. The correlation between the 2 distance to frontier scores is 0.41. The relationship is significant at the 1% level after 
controlling for income per capita. 
Source: Doing Business database.
12 DOING BUSINESS 2015 
ƒ Cumbersome, poorly functioning 
business regulation undermines 
entrepreneurship and economic 
performance.7 
ƒ Introducing collateral registries and 
debt recovery tribunals leads to 
better-performing credit markets.8 
ƒ Reforms improving access to credit 
and the efficiency of property regis-tration 
are correlated with product 
and process innovation by young 
firms.9 
In addition, with the time series of 
Doing Business data now available, it 
is possible to study how changes in 
regulations within an economy over 
time lead to changes in development 
outcomes in that economy. One 
study shows, for example, that an 
improvement of 10 points in the overall 
distance to frontier score is linked to 
an increase in new firm density (the 
number of new firms created in a year 
per 1,000 adults) of around 0.5 (figure 
1.10). And while small changes in the 
overall distance to frontier score may 
have a negligible link with growth, 
moving from the lowest quartile of 
improvement in business regulations 
to the highest quartile is associated 
with a significant increase in the an-nual 
per capita growth rate of around 
0.8 percentage points.10 
These results apply for different types 
of indicators but their intensity varies. 
For example, an increase of 10 points in 
the average distance to frontier score 
for the indicators measuring the com-plexity 
and cost of regulatory processes 
is associated with an increase in new 
firm density of about 0.2. The equiva-lent 
result for the indicators measuring 
the strength of legal institutions that 
support business regulation, such as 
commercial courts and credit bureaus, 
is 0.4. These results suggest that com-bining 
good regulations across different 
areas is important for business entry 
and that piecemeal regulatory reforms 
may be less effective than a broad re-form 
program. 
FIGURE 1.10 Combined regulatory reforms are likely to have greater effects on new 
business registration than isolated ones 
0 0.1 0.2 0.3 0.4 0.5 
Distance to frontier score for indicators 
measuring the complexity and 
cost of regulatory processes 
Distance to frontier score for indicators 
measuring the strength 
of legal institutions 
These results encourage further research 
to better understand the mechanisms 
behind the link between business regula-tions 
and firm creation and potentially 
economic growth. Firm-level data can 
provide some insights into these mecha-nisms. 
The analysis combined data from 
World Bank Enterprise Surveys for more 
than 40,000 observations (across firms 
and years) with Doing Business data to 
test how business regulations affect 
the performance of firms of different 
size classes. The analysis used distance 
to frontier scores to measure business 
regulations in the areas covered by Doing 
Business and growth in sales and em-ployment 
to measure firm performance. 
The results show that improvements 
in the distance to frontier score have 
greater effects on sales and employ-ment 
growth for small firms than for 
large ones.11 
These results indicate that sound busi-ness 
regulations in the areas measured 
by Doing Business benefit small firms 
more than large ones. This is in line with 
earlier research findings. One study 
found that a heavy regulatory burden— 
measured by the share of management 
time spent dealing with regulations 
or inspections—can stunt the growth 
of small firms.12 Another found that in 
general there is a significant relation-ship 
between entrepreneurial activity 
and indicators of the quality of the legal 
and regulatory environment and gover-nance. 
13 The finding that good business 
regulations in areas such as those mea-sured 
by Doing Business benefit small 
firms more than large ones is an impor-tant 
one—since small firms account for 
the largest shares of job creation and the 
highest growth in sales and employment 
in developing economies.14 
HOW HAVE BUSINESS 
REGULATIONS CHANGED 
OVER THE PAST DECADE? 
Among the more encouraging trends 
shown by Doing Business data over the 
past decade is the gradual improve-ment 
in economies’ performance in 
the areas tracked by the indicators. 
Moreover, economies with the weak-est 
regulatory institutions and the 
most complex and costly regulatory 
processes tend to focus on the areas 
where their regulatory performance is 
worse, slowly but steadily beginning 
to adopt some of the better practices 
seen among the best performers. 
Overall distance to 
frontier score 
Increase in new firm density associated with 
10-point increase in distance to frontier score 
Note: New firm density is defined as the number of newly registered limited liability companies per 1,000 working-age 
people (ages 15–64). Indicators measuring the strength of legal institutions are those on getting credit, protecting 
minority investors, enforcing contracts and resolving insolvency. Indicators measuring the complexity and cost 
of regulatory processes are those on starting a business, dealing with construction permits, getting electricity, 
registering property, paying taxes and trading across borders. The analysis uses data from 2003–13 for all economies 
covered by Doing Business. 
Source: Divanbeigi and Ramalho 2014.
OVERVIEW 13 
FIGURE 1.11 Strong convergence across economies since 2005 
Averages by group 
800 
600 
400 
200 
250 
200 
150 
100 
50 
70 
60 
50 
40 
30 
20 
10 
Best 3 quartiles 
Worst quartile 
Best 3 quartiles 
Worst quartile 
Best 3 quartiles 
Cost to start a business 
(% of income per capita) 
300 
250 
200 
150 
100 
50 
0 
2005 2006 2007 2008 2009 2010 2011 2012 2013 2014 
140 
120 
100 
80 
60 
40 
20 
400 
350 
300 
250 
200 
150 
100 
50 
60 
50 
40 
30 
20 
10 
Worst quartile 
Best 3 quartiles 
Cost to register property 
(% of property value) 
18 
16 
14 
12 
10 
8 
6 
4 
2 
0 
2005 2006 2007 2008 2009 2010 2011 2012 2013 2014 
Time to import 
(days) 
0 
2005 2006 2007 2008 2009 2010 2011 2012 2013 2014 
Time to export 
(days) 
0 
2005 2006 2007 2008 2009 2010 2011 2012 2013 2014 
Time to register property 
(days) 
0 
2005 2006 2007 2008 2009 2010 2011 2012 2013 2014 
Time to deal with 
construction permits (days) 
0 
2005 2006 2007 2008 2009 2010 2011 2012 2013 2014 
Time to pay taxes 
(hours per year) 
0 
2005 2006 2007 2008 2009 2010 2011 2012 2013 2014 
Time to start a business 
(days) 
0 
2005 2006 2007 2008 2009 2010 2011 2012 2013 2014 
Worst quartile 
Worst quartile 
Best 3 quartiles 
Best 3 quartiles 
Worst quartile 
Worst quartile 
Best 3 quartiles 
Worst quartile 
Best 3 quartiles 
Note: Economies are ranked in quartiles by performance in 2005 on the indicator shown. The data refer to the 174 economies included in Doing Business 2006 (2005). Fifteen 
economies were added in subsequent years. 
Source: Doing Business database.
14 DOING BUSINESS 2015 
This process is leading to a conver-gence 
toward best practices. Here is an 
example: In 2005 the time to transfer 
property averaged 235 days among the 
economies ranking in the worst quartile 
on this indicator. Among the best 3 
quartiles it averaged 42 days. Today 
that gap is substantially narrower. 
While the difference is still substantial 
at 62 days, it is considerably smaller 
than the 193 days in 2005 (figure 1.11). 
Similar trends can be seen in other in-dicators 
measuring the complexity and 
cost of regulatory processes. 
WHAT IS IN THIS YEAR’S 
REPORT? 
This year’s report presents several case 
studies focusing on legal and regulatory 
features covered by new or expanded 
indicators being introduced this year or 
next year. One case study, on protect-ing 
minority investors, discusses the 
importance of corporate governance 
rules that are now being measured. 
Another discusses the importance of a 
strong legal framework for insolvency, 
also among the features being mea-sured 
by new indicators—while a third 
examines the new components of the 
getting credit indicators. A fourth case 
study analyzes good practices in land 
administration systems that will be 
measured in Doing Business 2016. 
These case studies provide new insights 
from the newly collected data. The case 
study on resolving insolvency shows, 
for example, that OECD high-income 
economies have the highest average 
score on the strength of insolvency 
framework index. And economies that 
have reformed their insolvency laws 
in the past several years score sub-stantially 
higher on this index than 
economies with outdated insolvency 
provisions. This is important, because 
economies with better insolvency laws 
as measured by Doing Business tend 
to have more credit available to the 
private sector. 
Other case studies in this year’s report 
focus on good practices in the areas 
of business regulation covered. A case 
study on starting a business analyzes 
good practices in operating a company 
registry and the benefits of those prac-tices. 
This case study discusses how 
company registries empower businesses 
to operate in the formal economy, al-lowing 
them to reap the benefits that 
come with formalization, and how online 
platforms for company incorporation 
make the process faster and cheaper. A 
case study on zoning regulations looks 
at good practices that can increase ef-ficiency 
in construction permitting. 
Another case study analyzes the time 
series of data on paying taxes with an 
emphasis on patterns before, during 
and after the global financial crisis. This 
case study shows that over the 9-year 
period ending in 2012, the global aver-age 
total tax rate as measured by Doing 
Business fell by 9.1 percentage points, 
with the fastest rate of decline occur-ring 
in the years immediately following 
the crisis. The reduction was accompa-nied 
by a tangible improvement in the 
quality of tax administration in many 
economies thanks to their adoption 
of the latest technologies to facilitate 
online filing and payment. 
The report also presents a case study 
on enforcing contracts that analyzes 
new data on freedom of contract. These 
new data will not be included in the 
enforcing contracts indicators; they 
were collected solely for research, with 
the aim of better understanding the 
link between contract enforcement and 
freedom of contract. 
Finally, this year’s report presents a 
summary of some of the research pre-sented 
at the Doing Business research 
conference that took place in February 
2014. This research used Doing Business 
data or studied areas relevant to 
the Doing Business indicators. Doing 
Business will continue to monitor prog-ress 
in business regulation in economies 
around the world with the aim of keep-ing 
governments informed about good 
practices and enabling researchers to 
further our knowledge of how laws and 
regulations affect development. 
NOTES 
1. For information on the Independent Panel 
on Doing Business, see its website at http:// 
www.dbrpanel.org/. 
2. The distance to frontier score shows how far 
on average an economy is at a point in time 
from the best performance achieved by any 
economy on each Doing Business indicator 
since 2005 or the third year in which 
data for the indicator were collected. The 
measure is normalized to range between 0 
and 100, with 100 representing the frontier. 
3. The correlation between the distance 
to frontier score and the IDA Resource 
Allocation Index is 0.73. The relationship is 
significant at the 1% level after controlling 
for income per capita. 
4. Regulatory changes making it more difficult 
to do business are subtracted from the 
number of those making it easier. 
5. Branstetter and others 2013; Bruhn 2011; 
Kaplan, Piedra and Seira 2011; Monteiro and 
Assunção 2012. 
6. Chang, Kaltani and Loayza 2009. 
7. Dreher and Gassebner 2013. 
8. Love, Martínez Pería and Singh 2013. 
9. Dutz 2014. 
10. Divanbeigi and Ramalho 2014. 
11. These results take into account differences 
in performance due to country-level time-invariant 
characteristics and firms’ sector, 
age and export status. The regression 
method used counts every firm equally 
even if the number of firms varies across 
countries. 
12. Aterido, Hallward-Driemeier and Pages 
2009. 
13. Klapper and others 2010. 
14. Ayyagari, Demirguc-Kunt and Maksimovic 
2014.
Doing Business 2015 
Going Beyond Efficiency 
About Doing Business 
Economic activity requires sensible 
rules that encourage firm start-up 
and growth and avoid creating 
distortions in the marketplace. Doing 
Business measures the rules and regula-tions 
that can help the private sector 
thrive—because without a dynamic 
private sector, no economy can provide 
a good, and sustainable, standard of liv-ing 
for people. Doing Business promotes 
rules that establish and clarify property 
rights, minimize the cost of resolving 
disputes, increase the predictability of 
economic interactions and provide con-tractual 
partners with core protections 
against abuse. 
The Doing Business data highlight the 
important role of the government and 
government policies in the day-to-day 
life of domestic small and medium-size 
firms. The objective is to encourage 
regulations that are designed to be ef-ficient, 
accessible to all who use them 
and simple in their implementation. 
Where regulation is burdensome and 
competition limited, success tends 
to depend on whom one knows. But 
where regulation is efficient, trans-parent 
and implemented in a simple 
way, it becomes easier for aspiring 
entrepreneurs to compete on an equal 
footing and to innovate and expand. 
In this sense Doing Business values 
good rules as a key to social inclusion. 
Enabling growth—and ensuring that all 
people, regardless of income level, can 
participate in its benefits—requires an 
environment where new entrants with 
drive and good ideas can get started 
in business and where good firms can 
invest and grow, thereby creating more 
jobs. 
Doing Business was designed with 2 
main types of users in mind: policy 
makers and researchers.1 Doing Business 
is a tool that governments can use to 
design sound policies for the creation 
of firms and jobs. But this tool should 
not be used in isolation. Doing Business 
provides a rich opportunity for bench-marking 
by capturing key dimensions 
of regulatory regimes. Nevertheless, the 
Doing Business data are limited in scope 
and should be complemented with other 
sources of information. 
Doing Business is also an important 
source of information for researchers. It 
provides a unique data set that enables 
analysis aimed at better understanding 
the role of business regulation in eco-nomic 
development. This year’s report 
discusses the results of some of this 
work in the chapter on highlights from 
the Doing Business research confer-ence. 
Doing Business 2014 presented a 
detailed summary of recent research on 
the effects of business regulation in the 
areas measured by Doing Business. 
WHAT DOES DOING 
BUSINESS MEASURE? 
Doing Business captures several im-portant 
dimensions of the regulatory 
environment as it applies to local firms. 
It provides quantitative measures of 
regulations for starting a business, 
dealing with construction permits, 
ƒ Doing Business measures business 
regulations that affect domestic small 
and medium-size firms in 11 areas 
across 189 economies. Ten of these 
areas—starting a business, dealing 
with construction permits, getting 
electricity, registering property, getting 
credit, protecting minority investors, 
paying taxes, trading across borders, 
enforcing contracts and resolving 
insolvency—are included in the distance 
to frontier score and ease of doing 
business ranking. Doing Business also 
measures labor market regulation, 
which is not included in these 2 
measures. 
ƒ Doing Business does not capture other 
aspects of the business environment, 
such as security, market size, 
macroeconomic stability and the 
prevalence of bribery and corruption. 
ƒ The Doing Business methodology is 
based on standardized case scenarios 
in the largest business city of each 
economy. In addition, for 11 economies 
a second city has been added this year. 
ƒ Doing Business relies on 4 main 
sources of information: the relevant 
laws and regulations, Doing Business 
respondents, the governments of the 
economies covered and the World Bank 
Group regional staff. 
ƒ Governments use Doing Business as 
a source of objective data providing 
unique insights into good practices 
worldwide. Many Doing Business 
indicators are “actionable”—though 
depending on the context, they may 
not always be “action-worthy.”
16 DOING BUSINESS 2015 
getting electricity, registering prop-erty, 
getting credit, protecting minority 
investors, paying taxes, trading across 
borders, enforcing contracts and re-solving 
insolvency. Doing Business also 
measures labor market regulation. This 
year’s report does not present rankings 
of economies on the labor market regu-lation 
indicators or include the topic 
in the aggregate distance to frontier 
score or ranking on the ease of doing 
business. It does present the data for 
these indicators. 
Doing Business provides 2 main types of 
indicators: those that broadly measure 
the complexity and cost of regulatory 
processes and those that measure the 
strength of legal institutions (table 2.1). 
Indicators of the first type promote ef-ficiency 
in transactions handled by the 
government, such as in the process to 
register a transfer of property. A simpler 
and less costly process results in better 
performance on the indicators and, if 
all else is constant, a more favorable 
ranking on the ease of doing business. 
These indicators are being expanded to 
also include components on the quality 
of regulation. 
Indicators of the second type reflect 
better institutions for private sector 
development, such as well-functioning 
courts and credit information systems. 
Accordingly, some of these indicators 
give a higher score for better and more 
developed regulation, as the protecting 
minority investors indicators do for 
stricter disclosure requirements for 
related-party transactions. Three sets 
of these indicators—getting credit, pro-tecting 
minority investors and resolving 
insolvency—have been expanded for 
this year’s report to further focus on 
the strength of legal institutions (for 
details on the expansion of the scope of 
indicator sets, see the chapter on what 
is changing in Doing Business). 
How the indicators are selected 
The choice of the 11 sets of Doing 
Business indicators has been guided 
by economic research and firm-level 
data, particularly data from the World 
Bank Enterprise Surveys.2 These 
surveys provide data highlighting the 
main obstacles to business activity as 
reported by entrepreneurs in more than 
120 economies. For example, among the 
factors that the surveys have identified 
as important to businesses have been 
access to finance and access to elec-tricity— 
inspiring the design of the Doing 
Business indicators on getting credit 
and getting electricity. 
The design of the Doing Business indica-tors 
has also been informed by theo-retical 
insights gleaned from extensive 
research and the literature on the role 
of institutions in enabling economic de-velopment. 
In addition, the background 
papers developing the methodology 
for each of the Doing Business indicator 
sets have established the importance 
of the rules and regulations that Doing 
Business measures for such economic 
outcomes as trade volumes, foreign di-rect 
investment, market capitalization 
in stock exchanges and private credit as 
a percentage of GDP.3 
Two aggregate measures 
Doing Business presents data both 
for individual indicators and for 2 
aggregate measures—the distance to 
frontier score and the ease of doing 
business ranking—to provide different 
perspectives on the data. The distance 
to frontier score aids in assessing 
the absolute level of regulatory 
performance and how it improves over 
time. This measure shows the distance 
of each economy to the “frontier,” 
which represents the best performance 
observed on each of the indicators 
across all economies in the Doing 
Business sample since 2005 or the third 
year in which data for the indicator were 
collected. This allows users both to see 
the gap between a particular economy’s 
performance and the best performance 
at any point in time and to assess the 
absolute change in the economy’s 
regulatory environment over time as 
measured by Doing Business. 
This year, for the first time, the ease of 
doing business ranking is based on the 
distance to frontier score. The ranking 
complements the distance to frontier 
score by providing information about 
an economy’s performance in business 
TABLE 2.1 What Doing Business measures—11 areas of business regulation 
Complexity and cost of regulatory processes 
Starting a business Procedures, time, cost and paid-in minimum capital to start a limited 
liability company 
Dealing with construction permits Procedures, time and cost to complete all formalities to build a 
warehouse 
Getting electricity Procedures, time and cost to get connected to the electrical grid 
Registering property Procedures, time and cost to transfer a property 
Paying taxes Payments, time and total tax rate for a firm to comply with all tax 
regulations 
Trading across borders Documents, time and cost to export and import by seaport 
Strength of legal institutions 
Getting credit Movable collateral laws and credit information systems 
Protecting minority investors Minority shareholders’ rights in related-party transactions and in 
corporate governance 
Enforcing contracts Procedures, time and cost to resolve a commercial dispute 
Resolving insolvency Time, cost, outcome and recovery rate for a commercial insolvency 
and the strength of the insolvency legal framework 
Labor market regulation Flexibility in employment regulation, benefits for workers and labor 
dispute resolution
ABOUT DOING BUSINESS 17 
FIGURE 2.1 An economy’s regulatory environment may be more business-friendly in some areas than in others 
Austria 
Latvia 
Portugal 
Japan 
France 
Spain 
Peru 
Mexico 
Chile 
Armenia 
Slovenia 
Bahrain 
Turkey 
Belarus 
100 
90 
80 
70 
60 
50 
40 
30 
20 
10 
regulation relative to the performance 
of other economies as measured by 
Doing Business. 
For each topic covered and for all topics, 
Doing Business uses a simple averaging 
approach for weighting component indi-cators, 
calculating rankings and deter-mining 
the distance to frontier score.4 
To test the robustness of this approach, 
other approaches were explored, includ-ing 
using principal components and 
unobserved components.5 These turn 
out to yield results nearly identical to 
those of simple averaging. In the ab-sence 
of a strong theoretical framework 
that assigns different weights to the 
topics covered for the 189 economies, 
the simplest method is used: weighting 
all topics equally and, within each topic, 
giving equal weight to each of the topic 
components.6 
Each topic covered by Doing Business 
relates to a different aspect of the 
regulatory environment. The distance 
to frontier scores and rankings of each 
economy vary, often substantially, 
across topics, indicating that strong 
performance by an economy in one 
Greece 
Moldova 
Croatia 
Samoa 
Tonga 
Morocco 
Guatemala 
Kazakhstan 
Fiji 
Antigua and Barbuda 
San Marino 
Philippines 
Bahamas, The 
Bosnia and Herzegovina 
area of regulation can coexist with weak 
performance in another. A quick way to 
assess the variability of an economy’s 
regulatory performance is to look at its 
distance to frontier scores across topics 
(see the country tables). Croatia, for ex-ample, 
has an overall distance to frontier 
score of 66.53. Its distance to frontier 
score is 85.43 for starting a business, 
82.92 for paying taxes and 80.05 for 
getting electricity. At the same time, 
it has a score of 44.97 for dealing with 
construction permits, 55.00 for getting 
credit and 53.92 for resolving insolvency 
(figure 2.1). 
WHAT DOES DOING 
BUSINESS NOT MEASURE? 
Doing Business does not cover many 
important policy areas, and even 
within the areas it covers its scope is 
narrow (table 2.2). Doing Business does 
not measure the full range of factors, 
policies and institutions that affect the 
quality of an economy’s business en-vironment 
or its national competitive-ness. 
It does not, for example, capture 
aspects of security, the prevalence of 
Cambodia 
Yemen, Rep. 
Côte d’Ivoire 
São Tomé and Príncipe 
Burkina Faso 
Zimbabwe 
Bangladesh 
Myanmar 
Angola 
Chad 
Eritrea 
bribery and corruption, market size, 
macroeconomic stability, the state 
of the financial system or the level of 
training and skills of the labor force. 
Even within the relatively small set of 
indicators included in Doing Business, 
the focus is deliberately narrow. The 
trading across borders indicators, for 
example, capture the documents, time 
and cost required for the logistical 
process of exporting and importing 
Hong Kong SAR, China 
United States 
Singapore 
Korea, Rep. 
Finland 
Sweden 
Ireland 
Georgia 
Estonia 
Taiwan, China 
Netherlands 
Slovak Republic 
South Africa 
Puerto Rico (U.S.) 
Saudi Arabia 
Luxembourg 
Kosovo 
Trinidad and Tobago 
Costa Rica 
Seychelles 
Solomon Islands 
Serbia 
Sri Lanka 
Brunei Darussalam 
St. Vincent and the Grenadines 
Honduras 
El Salvador 
Zambia 
Palau 
Ecuador 
Jordan 
Nicaragua 
St. Kitts and Nevis 
Mozambique 
Guyana 
Bhutan 
Lesotho 
Tanzania 
Papua New Guinea 
Marshall Islands 
Uzbekistan 
West Bank and Gaza 
Micronesia, Fed. Sts. 
Togo 
Benin 
Djibouti 
Bolivia 
Comoros 
Senegal 
Madagascar 
Equatorial Guinea 
Guinea 
Syrian Arab Republic 
Guinea-Bissau 
Afghanistan 
Central African Republic 
Distance to 
frontier score 
0 
Average of highest 3 topic scores 
Average of all topic scores 
Average of lowest 3 topic scores 
Note: The distance to frontier scores reflected are those for the 10 Doing Business topics included in this year’s aggregate distance to frontier score. Figure is illustrative only; it does 
not include all 189 economies covered by this year’s report. See the country tables for the distance to frontier score for each Doing Business topic for all economies. 
Source: Doing Business database. 
TABLE 2.2 What Doing Business does 
not cover 
Examples of areas not covered 
Security 
Prevalence of bribery and corruption 
Market size 
Macroeconomic stability 
State of the financial system 
Level of training and skills of the labor force 
Examples of aspects not included within the 
areas covered 
In getting electricity, the reliability of electricity 
supply 
In getting credit, the availability of credit for firms 
In trading across borders, export or import tariffs 
and subsidies
18 DOING BUSINESS 2015 
containerized goods by seaport, but 
they do not measure the cost of the sea 
transport or of tariffs or capture any 
aspects relating to international trade 
agreements. Thus through these indi-cators 
Doing Business provides a nar-row 
perspective on the infrastructure 
challenges that firms face, particularly 
in the developing world. It does not ad-dress 
the extent to which inadequate 
roads, rail, ports and communications 
may add to firms’ costs and undermine 
competitiveness (except to the extent 
that the trading across borders indica-tors 
indirectly measure the quality of 
ports and roads). Similarly, the indica-tors 
on starting a business or protect-ing 
minority investors do not cover 
all aspects of commercial legislation. 
And the getting electricity indicators 
do not currently address the quality 
of the electricity supply or the rate of 
electrification. 
Doing Business does not attempt to 
measure all costs and benefits of a 
particular law or regulation to society 
as a whole. For example, the paying 
taxes indicators measure the total tax 
rate, which, in isolation, is a cost to busi-nesses. 
The indicators do not measure, 
nor are they intended to measure, the 
benefits of the social and economic 
programs funded through tax revenues. 
Measuring business laws and regula-tions 
provides one input into the debate 
on the regulatory burden associated 
with achieving regulatory objectives. 
These objectives can differ across 
economies. Doing Business provides a 
starting point for this discussion and 
should be used in conjunction with other 
data sources. 
WHAT ARE THE 
STRENGTHS AND 
LIMITATIONS OF THE 
METHODOLOGY? 
The Doing Business methodology was 
designed to be an easily replicable way 
to benchmark business regulation. It 
has advantages and limitations that 
should be understood when using the 
data (table 2.3). 
A key consideration for the Doing 
Business indicators is that they should 
ensure comparability of the data 
across a global set of economies. The 
indicators are therefore developed 
around standardized case scenarios 
with specific assumptions. One such 
assumption is the location of a notional 
business—the subject of the Doing 
Business case study—in the largest 
business city of the economy. The 
reality is that business regulations and 
their enforcement may differ within a 
country, particularly in federal states 
and large economies. But gathering 
data for every relevant jurisdiction in 
each of the 189 economies covered by 
Doing Business would be infeasible. In 
addition, while variation is inevitable 
across different locations, the variation 
is unlikely to deliver significantly dif-ferent 
results commensurate with the 
scale of the effort. Nevertheless, where 
policy makers are interested in gener-ating 
data at the local level, beyond the 
largest business city, Doing Business 
has complemented its global indica-tors 
with subnational studies (box 2.1). 
And this year, for the first time, Doing 
Business has extended its coverage 
to the second largest business city in 
economies with a population of more 
than 100 million. 
Doing Business recognizes the limita-tions 
of the standardized case sce-narios 
and assumptions. But while 
such assumptions come at the expense 
of generality, they also help ensure the 
comparability of data. For this reason 
it is common to see limiting assump-tions 
of this kind in economic indica-tors. 
Inflation statistics, for example, 
are often based on prices of a set of 
consumer goods in a few urban areas, 
since collecting nationally representa-tive 
price data at high frequencies 
would be prohibitively costly in many 
countries. GDP estimates are also sub-ject 
to a number of limiting assump-tions, 
which have not prevented their 
widespread use. 
Some Doing Business topics include 
complex areas, and so it is important 
that the standardized cases are 
carefully defined. For example, the 
standardized case scenario usually 
involves a limited liability company or 
its legal equivalent. The considerations 
TABLE 2.3 Advantages and limitations of the Doing Business methodology 
Feature Advantages Limitations 
Use of standardized 
case scenarios 
Makes the data comparable across 
economies and the methodology 
transparent 
Reduces the scope of the data and 
means that only regulatory reforms 
in the areas measured can be 
systematically tracked 
Focus on largest 
business citya 
Makes the data collection manageable 
(cost-effective) and the data 
comparable 
Reduces the representativeness of 
the data for an economy if there are 
significant differences across locations 
Focus on domestic and 
formal sector 
Keeps the attention on where 
regulations are relevant and firms are 
most productive—the formal sector 
Fails to reflect reality for the informal 
sector—important where that is 
large—or for foreign firms where they 
face a different set of constraints 
Reliance on expert 
respondents 
Ensures that the data reflect the 
knowledge of those with the most 
experience in conducting the types of 
transactions measured 
Results in indicators that do not 
measure the variation in experiences 
among entrepreneurs 
Focus on the law Makes the indicators “actionable”— 
because the law is what policy makers 
can change 
Fails to reflect the reality that where 
systematic compliance with the law is 
lacking, regulatory changes may not 
achieve the full desired results 
a. In economies with a population of more than 100 million, Doing Business covers business regulation in both the 
largest business city and the second largest one.
ABOUT DOING BUSINESS 19 
BOX 2.1 Comparing regulations at the local level: subnational Doing Business studies 
The subnational Doing Business studies expand the Doing Business analysis beyond the largest business city of an econo-my. 
They measure variation in regulations or in the implementation of national laws across locations within an economy 
(as in Nigeria) or a region (as in Central America). Projects are undertaken at the request of governments. 
Data collected by subnational reports over the past 2 years show that there can be substantial variation within an econ-omy. 
In Mexico in 2013, for example, transferring property took as few as 2 days in Colima and as many as 74 in Mexico 
City. Indeed, within the same economy one can find cities that perform as well as economies ranking in the top 20 on the 
ease of registering property and cities that perform as poorly as economies ranking in the bottom 40 on that indicator 
(see figure). Despite these large differences across cities of varied sizes, the differences between the largest and the sec-ond 
largest business cities in an economy tend to be small, as discussed in the overview. 
Different locations, different regulatory processes, same economy 
43.76 
53.04 49.89 
48.96 
64.86 
59.94 
53.51 
Distance to frontier score for 
registering property (0–100) 
35.61 
32.95 
47.11 
41.15 
89.60 
43.17 
90th percentile 
(88.16) 
10th percentile 
(42.27) 
29.14 
57.64 
Nigeria, 2014 Colombia, 2012 Egypt, Arab Rep., 2013 Italy, 2012 Mexico, 2013 
Worst score Best score Average score 
Note: The average score shown for each economy is based on all locations covered by the data: 36 cities in Nigeria, 23 cities in Colombia, 15 locations and governorates in 
the Arab Republic of Egypt, 13 cities in Italy and 31 states and Mexico City in Mexico. The worst score shown for each economy is that of the location with the most complex 
process for transferring property, and the best score that of the location with the most efficient one. The 10th and 90th percentile values are based on economy-level scores 
for the 189 economies covered by Doing Business. 
Source: Subnational Doing Business database. 
The subnational Doing Business studies create disaggregated data on business regulations. But they go beyond a data 
collection exercise. They have proved to be strong motivators for regulatory reform at the city level: 
ě The data produced are comparable across locations within the economy and internationally, enabling locations to 
benchmark their results both locally and globally. Comparisons of locations that are within the same economy and 
therefore share the same legal and regulatory framework can be revealing: local officials find it hard to explain why 
doing business is more difficult in their jurisdiction than in a neighboring one. 
ě Pointing out good practices that exist in some locations but not others within an economy helps policy makers rec-ognize 
the potential for replicating these good practices. This can prompt discussions of regulatory reform across 
different levels of government, providing opportunities for local governments and agencies to learn from one another 
and resulting in local ownership and capacity building. 
Since 2005 subnational reports have covered 367 cities in 55 economies, including Brazil, China, India, Indonesia, Morocco 
and Pakistan. This year subnational studies were completed in the Arab Republic of Egypt, Mexico and Nigeria. Ongoing 
studies include those in Central America and the Dominican Republic (covering 22 cities and 10 ports across 7 countries), 
Poland (18 cities), South Africa (9 cities and 4 ports) and Spain (19 cities and 5 ports). 
Subnational reports are available on the Doing Business website at http://www.doingbusiness.org/subnational.
20 DOING BUSINESS 2015 
in defining this assumption are twofold. 
First, private limited liability companies 
are, empirically, the most prevalent 
business form for firms with more than 
one owner in many economies around 
the world. Second, this choice reflects 
the focus of Doing Business on expand-ing 
opportunities for entrepreneurship: 
investors are encouraged to venture 
into business when potential losses are 
limited to their capital participation. 
Another assumption underlying the 
Doing Business indicators is that en-trepreneurs 
have knowledge of and 
comply with applicable regulations. 
In practice, entrepreneurs may not 
know what needs to be done or how 
to comply and may lose considerable 
time trying to find out. Alternatively, 
they may deliberately avoid compli-ance 
altogether—by not registering 
for social security, for example. Where 
regulation is particularly onerous, firms 
may opt for bribery and other informal 
arrangements intended to bypass the 
rules—an aspect that helps explain 
differences between the de jure data 
provided by Doing Business and the de 
facto insights offered by World Bank 
Enterprise Surveys. In economies with 
particularly burdensome regulation, 
levels of informality tend to be higher. 
Compared with their formal sector 
counterparts, firms in the informal 
sector typically grow more slowly, have 
poorer access to credit and employ 
fewer workers—and these workers 
remain outside the protections of 
labor law.7 Firms in the informal sector 
are also less likely to pay taxes. Doing 
Business measures one set of factors 
that help explain the occurrence of 
informality and give policy makers 
insights into potential areas of regula-tory 
reform. 
Rules and regulations fall under the direct 
control of policy makers—and they are 
often where policy makers start when 
intending to change the set of incentives 
under which businesses operate. Doing 
Business not only shows where problems 
exist in the regulatory framework; it also 
points to specific regulations or regulato-ry 
procedures that may lend themselves 
to reform. And its quantitative measures 
of business regulations enable research 
on how specific regulations affect firm 
behavior and economic outcomes. 
HOW ARE THE DATA 
COLLECTED? 
The Doing Business data are based on 
domestic laws and regulations as well as 
administrative requirements. The data 
cover 189 economies—including small 
economies and some of the poorest 
economies, for which little or no data are 
available in other data sets. The data are 
collected through several rounds of in-teraction 
with expert respondents (both 
private sector practitioners and govern-ment 
officials)—through responses to 
questionnaires, conference calls, written 
correspondence and visits by the team. 
Doing Business relies on 4 main sources of 
information: the relevant laws and regu-lations, 
Doing Business respondents, the 
governments of the economies covered 
and the World Bank Group regional staff 
(figure 2.2). For a detailed explanation of 
the Doing Business methodology, see the 
data notes. 
Relevant laws and regulations 
Most of the Doing Business indicators 
are based on laws and regulations. 
Indeed, more than two-thirds of the 
data embedded in the Doing Business 
indicators are based on a reading of the 
law. Besides filling out written ques-tionnaires, 
Doing Business respondents 
provide references to the relevant laws, 
regulations and fee schedules. The 
Doing Business team collects the texts 
of the relevant laws and regulations 
and checks questionnaire responses 
for accuracy. For example, the team 
will examine the commercial code to 
confirm the paid-in minimum capital 
requirement, look at the legislation to 
see whether borrowers have the right to 
access their data at the credit bureau 
and read the tax code to find applicable 
tax rates. (Doing Business makes these 
and other types of laws available on 
the Doing Business law library website.)8 
Because of the data checking and qual-ity 
assurance, having large samples of 
respondents is not necessary. In princi-ple, 
the role of the contributors is largely 
advisory—helping the Doing Business 
team in finding and understanding the 
FIGURE 2.2 How Doing Business collects and verifies the data 
Data sources: 
• The relevant laws and regulations 
• Responses to questionnaires by 
private sector practitioners and 
government officials 
• Governments 
• World Bank Group regional staff 
Steps included in the 
data verification process: 
• Conference calls and 
videoconferences with private 
sector practitioners and 
government officials 
• Travel to selected economies 
The Doing Business team develops 
questionnaires for each topic and 
sends them to private sector 
practitioners and government officials. 
The Doing Business team analyzes the 
relevant laws and regulations along 
with the information in the 
questionnaires. 
Governments and World Bank Group 
regional teams submit information on 
regulatory changes that could 
potentially be included in the global 
count of regulatory reforms. 
The Doing Business team shares 
preliminary information on reforms 
with governments (through the World 
Bank Group’s Board of Executive 
Directors) and World Bank Group 
regional teams for their feedback. 
The report is published 
and disseminated. 
The Doing Business team analyzes the 
data and writes the report. 
Comments on the report and the 
data are received from across the 
World Bank Group through an 
internal review process.
ABOUT DOING BUSINESS 21 
laws and regulations—and there are 
quickly diminishing returns to an ex-panded 
number of contributors. 
For the rest of the data the team 
conducts extensive consultations 
with multiple contributors to mini-mize 
measurement error. For some 
indicators—for example, those on 
dealing with construction permits, 
enforcing contracts and resolving 
insolvency—the time component and 
part of the cost component (where fee 
schedules are lacking) are based on 
actual practice rather than the law on 
the books. This introduces a degree of 
judgment. When sources indicate dif-ferent 
estimates, the time indicators 
reported in Doing Business represent 
the median values of several responses 
given under the assumptions of the 
standardized case. 
Doing Business respondents 
Over the past 12 years more than 
30,000 professionals in 189 economies 
have assisted in providing the data that 
inform the Doing Business indicators.9 
This year’s report draws on the inputs 
of more than 10,700 professionals.10 
Table 14.2 in the data notes lists the 
number of respondents for each indi-cator 
set. The Doing Business website 
shows the number of respondents for 
each economy and each indicator set. 
Respondents are professionals who 
routinely administer or advise on the 
legal and regulatory requirements in 
the specific areas covered by Doing 
Business, selected on the basis of their 
expertise in these areas. Because of 
the focus on legal and regulatory ar-rangements, 
most of the respondents 
are legal professionals such as lawyers, 
judges or notaries. In addition, officials 
of the credit registry or bureau complete 
the credit information questionnaire. 
Freight forwarders, accountants, archi-tects, 
engineers and other profession-als 
answer the questionnaires related 
to trading across borders, paying taxes 
and dealing with construction permits. 
Certain public officials (such as regis-trars 
from the company or property 
registry) also provide information that 
is incorporated into the indicators. 
The Doing Business approach has been 
to work with legal practitioners or 
professionals who regularly undertake 
the transactions involved. Following 
the standard methodological approach 
for time-and-motion studies, Doing 
Business breaks down each process or 
transaction, such as starting a business 
or registering a building, into separate 
steps to ensure a better estimate of 
time. The time estimate for each step is 
given by practitioners with significant 
and routine experience in the transac-tion. 
When time estimates differ, fur-ther 
interactions with respondents are 
pursued to converge on one estimate or 
a narrow range that reflects the major-ity 
of applicable cases. 
Doing Business does not survey firms for 
2 main reasons. The first relates to the 
frequency with which firms engage in the 
transactions captured by the indicators, 
which is generally low. For example, a firm 
goes through the start-up process once in 
its existence, while an incorporation law-yer 
may carry out 10 such transactions 
each month. The incorporation lawyers 
and other experts providing information 
to Doing Business are therefore better 
able to assess the process of starting a 
business than are individual firms. They 
also have access to the latest regulations 
and practices, while a firm may have 
faced a different set of rules when incor-porating 
years before. The second reason 
is that the Doing Business questionnaires 
mostly gather legal information, which 
firms are unlikely to be fully familiar with. 
For example, few firms will know about all 
the many legal procedures involved in re-solving 
a commercial dispute through the 
courts, even if some of them have gone 
through the process themselves. But a 
litigation lawyer would have no difficulty 
in providing the requested information on 
all the procedures. 
Governments and World Bank 
Group regional staff 
After receiving the completed ques-tionnaires 
from the Doing Business 
respondents, verifying the information 
against the law and conducting follow-up 
inquiries to ensure that all relevant infor-mation 
is captured, the Doing Business 
team shares the preliminary reform de-scriptions 
with governments through the 
Board of Executive Directors and regional 
staff of the World Bank Group. Through 
this process government authorities and 
local World Bank Group staff in the 189 
economies covered can alert the team 
about, for example, regulatory reforms 
not picked up by the respondents or ad-ditional 
achievements of regulatory re-forms 
already captured in the database. 
In response to such feedback, the Doing 
Business team turns to the local private 
sector experts for further consultation 
and, as needed, corroboration. In addi-tion, 
the team responds formally to the 
comments of governments or regional 
staff and provides explanations of the 
scoring decisions. 
Data adjustments 
Information on data corrections is 
provided in the data notes and on the 
Doing Business website. A transparent 
complaint procedure allows anyone to 
challenge the data. From November 
2013 to October 2014 the team received 
and responded to more than 160 queries 
on the data. If changes in data are con-firmed, 
they are immediately reflected 
on the website. 
HOW DO GOVERNMENTS 
USE THE DATA? 
Over the past decade governments have 
increasingly focused on reforming busi-ness 
regulation as one way of maintain-ing 
competitiveness in an increasingly 
globalized economy. Doing Business pro-vides 
one source of actionable, objective 
data that give useful insights into good 
practices worldwide. Indeed, since 2003 
governments have implemented more
22 DOING BUSINESS 2015 
than 600 regulatory reforms that have 
been informed by Doing Business.11 
One venue for sharing success stories 
in business regulation reform is peer-to- 
peer learning events—workshops 
where officials from different govern-ments 
across a region or even across 
the globe meet to discuss the challenges 
of regulatory reform and to share their 
experiences (figure 2.3). 
In addition, reform committees within 
governments frequently use the Doing 
Business indicators as one input to inform 
their programs for improving the business 
environment. More than 50 economies 
have formed such committees—typically 
at the interministerial level or reporting 
directly to the president or the prime 
minister—to ensure the coordination of 
efforts across agencies. In East and South 
Asia they include Indonesia, the Republic 
of Korea, Malaysia, the Philippines and 
Sri Lanka. In the Middle East and North 
Africa: Algeria, Kuwait, Morocco, Saudi 
Arabia and the United Arab Emirates. 
In Europe and Central Asia: Azerbaijan, 
Croatia, the Czech Republic, Georgia, 
Kazakhstan, Kosovo, the Kyrgyz 
Republic, the former Yugoslav Republic 
of Macedonia, Moldova, Montenegro, 
Poland, the Russian Federation, 
Tajikistan, Ukraine, the United Kingdom 
and Uzbekistan. In Sub-Saharan Africa: 
Botswana, Burundi, the Central African 
Republic, the Comoros, the Democratic 
Republic of Congo, the Republic of Congo, 
Côte d’Ivoire, Guinea, Kenya, Liberia, 
Malawi, Mali, Nigeria, Rwanda, Sierra 
Leone, Togo and Zambia. And in Latin 
America: Chile, Colombia, Costa Rica, the 
Dominican Republic, Guatemala, Mexico, 
Panama and Peru. 
One reason behind the use of Doing 
Business indicators by governments 
is that many of these indicators can 
be considered “actionable,” measuring 
aspects over which governments have 
direct control. For example, govern-ments 
can reduce (or even eliminate) 
the minimum capital requirement for 
new firms. They can invest in company 
and property registries to increase the 
efficiency of these public agencies. They 
can improve the efficiency of tax admin-istration 
by adopting the latest technol-ogies 
to facilitate the preparation, filing 
and payment of taxes by businesses. 
And they can undertake court reforms 
to shorten delays in the enforcement 
of contracts. On the other hand, some 
Doing Business indicators capture costs 
that involve private sector participants, 
such as lawyers, notaries, architects, 
electricians or freight forwarders—costs 
over which governments may have little 
influence in the short run. 
While many Doing Business indica-tors 
are actionable, this does not 
necessarily mean that they are always 
“action-worthy” in a particular context.12 
Business regulation reforms are one ele-ment 
of a strategy aimed at improving 
competitiveness and establishing a solid 
foundation for sustainable economic 
growth. There are many other important 
goals to pursue—such as effective man-agement 
of public finances, adequate 
attention to education and training, 
adoption of the latest technologies to 
boost economic productivity and the 
quality of public services, and appropri-ate 
regard for air and water quality to 
safeguard people’s health. Governments 
have to decide what set of priorities 
best fits the needs they face. To say 
that governments should work toward 
a sensible set of rules for private sector 
activity does not suggest that doing so 
should come at the expense of other 
worthy economic and social goals. 
NOTES 
1. The focus of the Doing Business indicators 
remains the regulatory regime faced by 
domestic firms engaging in economic 
activity in the largest business city of an 
economy. Doing Business was not initially 
designed to inform decisions by foreign 
investors, though investors may in practice 
find the data useful as a proxy for the 
quality of the national investment climate. 
Analysis done in the World Bank Group’s 
Global Indicators Group has shown that 
countries that have sensible rules for 
domestic economic activity also tend to 
FIGURE 2.3 How governments use Doing Business as a policy tool 
Reform committees 
use Doing Business 
indicators to help 
inform programs to 
improve the business 
environment. 
improvements as part 
of broader reform 
Successful business 
regulation reforms 
programs. 
Governments learn 
from one another 
about good practices 
in the areas measured 
by Doing Business. 
Governments use 
Doing Business as a 
tool to stimulate 
regulatory
ABOUT DOING BUSINESS 23 
have good rules for the activities of foreign 
subsidiaries engaged in the local economy. 
2. For more on the World Bank Enterprise 
Surveys, see the website at http:// 
www.enterprisesurveys.org. 
3. These papers are available on the Doing 
Business website at http:// 
www.doingbusiness.org/methodology. 
4. For getting credit, indicators are weighted 
proportionally, according to their 
contribution to the total score, with a weight 
of 60% assigned to the strength of legal 
rights index and 40% to the depth of credit 
information index. In this way each point 
included in these indices has the same value 
independent of the component it belongs to. 
Indicators for all other topics are assigned 
equal weights. 
5. A technical note on the different 
aggregation and weighting methods is 
available on the Doing Business website at 
http://www.doingbusiness.org/methodology. 
6. For more details, see the chapter on the 
distance to frontier and ease of doing 
business ranking. 
7. Schneider 2005; La Porta and Shleifer 
2008. 
8. http://www.doingbusiness.org/law-library. 
9. The annual data collection exercise is an 
update of the database. The Doing Business 
team and the contributors examine the 
extent to which the regulatory framework 
has changed in ways relevant for the 
features captured by the indicators. The 
data collection process should therefore 
be seen as adding each year to an existing 
stock of knowledge reflected in the previous 
year’s report, not as creating an entirely 
new data set. 
10. While about 10,700 contributors provided 
data for this year’s report, many of them 
completed a questionnaire for more than 
one Doing Business indicator set. Indeed, 
the total number of contributions received 
for this year’s report is more than 13,500, 
which represents a true measure of the 
inputs received. The average number of 
contributions per indicator set and economy 
is just over 6. For more details, see http:// 
www.doingbusiness.org/contributors 
/doing-business. 
11. These are reforms for which Doing Business 
is aware that information provided by the 
Doing Business report was used in shaping 
the reform agenda. 
12. One study using Doing Business indicators 
illustrates the difficulties in using highly 
disaggregated indicators to identify reform 
priorities (Kraay and Tawara 2011).
Doing Business 2015 
Going Beyond Efficiency 
What is changing in 
Doing Business? 
Good practices in business 
regulation have evolved since 
the Doing Business indicators 
were first developed in 2003. Some 
changes have come, for example, as 
new technologies have transformed 
the ways governments interact with 
citizens and the business community. 
The new developments have created a 
need to expand and update the Doing 
Business methodology. While the Doing 
Business report has introduced changes 
in methodology of varying degrees 
every year, this year’s report and Doing 
Business 2016 are implementing more 
substantive improvements. Most were 
inspired by recommendations of the 
Independent Panel on Doing Business 
and by broader consultations that have 
taken place over the years with World 
Bank Group staff, country govern-ments 
and the private sector.1 
AN OVERVIEW OF THE 
CHANGES 
The improvements are in 3 areas: 
revision of the calculation of the ease 
of doing business ranking, expansion 
of the sample of cities covered in 
large economies and a broadening of 
the scope of indicator sets (table 3.1). 
Some of the changes imply a break in 
the data series and will compromise 
the comparability of data over time. 
For getting credit, for example, the 
changes in the strength of legal rights 
index are substantial enough to pre-vent 
comparability over time. But for 
all Doing Business topics, including get-ting 
credit, the data have been back-calculated 
1 year to allow for at least 
2 comparable years of data.2 Moreover, 
since most of the changes in method-ology 
involve adding new indicators 
rather than revising existing ones, data 
for more than 90% of the previously 
existing indicators remain comparable 
over time. The full data series are avail-able 
on the Doing Business website. 
Revising the ranking 
calculation 
Doing Business continues to publish 
the ease of doing business ranking. 
But beginning in this year’s report 
the ranking is based on the distance 
to frontier score rather than on the 
ƒ This year’s report and Doing Business 
2016 are introducing changes in 8 of 
the 10 Doing Business indicator sets: 
dealing with construction permits, 
getting electricity, registering 
property, getting credit, protecting 
minority investors, paying taxes, 
enforcing contracts and resolving 
insolvency. 
ƒ The improvements have 2 main 
goals. The first is to expand 
the focus of indicator sets that 
primarily measure the efficiency 
of a transaction or service to also 
cover aspects of the quality of that 
service. The second is to expand the 
focus of indicator sets that already 
measure some aspects of the quality 
of regulation to include recent good 
practices in the areas covered. 
ƒ Starting this year the ease of doing 
business ranking is based on the 
distance to frontier score. 
ƒ For the 11 economies with a 
population of more than 100 million, 
a second city has been added to the 
sample this year. 
TABLE 3.1 Timeline of the changes in 
Doing Business 
Changes in Doing Business 2015 
Revision of the ranking calculation 
Expansion of the city sample in large economies 
Broadening of the scope of indicator sets 
ě Getting credit 
ě Protecting minority investors 
ě Resolving insolvency 
Changes in Doing Business 2016 
Broadening of the scope of indicator sets 
ě Registering property 
ě Dealing with construction permits 
ě Getting electricity 
ě Paying taxes 
ě Enforcing contracts 
Note: No changes are planned for starting a business or 
trading across borders. Minor updates in methodology are 
introduced in this year’s report for dealing with construction 
permits, paying taxes and enforcing contracts, as explained 
in the data notes.
WHAT IS CHANGING IN DOING BUSINESS? 25 
percentile rank. The distance to frontier 
score benchmarks economies with re-spect 
to a measure of regulatory best 
practice—showing the gap between 
each economy’s performance and the 
best performance on each indicator. 
For indices, such as the strength of 
legal rights index (which ranges from 
0 to 12), the frontier is set at the best 
theoretical score (in this case 12) even 
if no economy attains it. For most of 
the other indicators the frontier is set 
at the lowest number that occurs in 
practice—for example, 1 for the num-ber 
of procedures to start a business. 
The exceptions are the recovery rate 
in insolvency, for which the frontier is 
set at the highest value, and the total 
tax rate, for which a threshold has been 
established. 
The ranking based on the distance to 
frontier score is highly correlated with 
that based on the percentile rank. But 
the distance to frontier score captures 
more information than the percentile 
rank because it shows not only how 
economies are ordered but also how far 
apart they are. Economies with greater 
variance across topics are more likely 
to have a less favorable position in the 
distance to frontier ranking than in the 
percentile ranking. Those with relatively 
better performance in topics with a 
compressed distribution, such as start-ing 
a business, also tend to place lower 
in the distance to frontier ranking. 
Two country examples can better il-lustrate 
the practical implications of 
the change in the ranking calculation. 
In Doing Business 2014 Côte d’Ivoire 
had rankings between 115 and 173 for 
8 of the 10 topics, and rankings of 88 
and 95 for the other 2. This resulted in 
a ranking of 167 on the overall ease of 
doing business. If the ranking had been 
computed using the distance to frontier 
score rather than the percentile rank, 
Côte d’Ivoire’s ranking, based on the 
same data, would have been 153 (figure 
3.1). This higher ranking would have been 
due mainly to the low variation in Côte 
d’Ivoire’s performance across topics. 
For Mongolia the opposite would have 
happened. In Doing Business 2014 
Mongolia’s topic rankings ranged be-tween 
22 and 181. Mongolia ranked in 
the top 40 for 4 of the topics, and in 
the bottom 60 for 3. Its overall ranking 
based on the percentile rank method 
was 76. If the ranking had been com-puted 
using the distance to frontier 
method instead, Mongolia’s ranking 
would have been 94. This lower ranking 
would have been attributable to the 
high variation in Mongolia’s perfor-mance 
across topics. 
How do the 2 countries fare in this 
year’s ease of doing business ranking? 
Côte d’Ivoire stands at 147 in the rank-ing, 
6 places higher than in last year’s 
ranking when based on the new meth-odology— 
and Mongolia stands at 72, 
22 places higher. The changes in ranking 
are due to other changes in methodol-ogy, 
changes in the data for these 2 
countries and changes in the data for 
other economies. (For more details, see 
the chapter on the distance to frontier 
and ease of doing business ranking.) 
Expanding the sample of cities 
covered 
Since its inception Doing Business has 
focused on the largest business city of 
each economy, taking it as a proxy for 
the entire national territory. Depending 
on the indicator and the size of the 
economy, this focus can be a limitation 
in extrapolating results to the economy 
level. As the subnational Doing Business 
reports have shown, the indicators 
measuring the procedures, time and 
cost to complete a transaction (such as 
the dealing with construction permits 
indicators) tend to show more variation 
across cities within an economy than 
do indicators capturing features of the 
law applicable nationwide (such as the 
protecting minority investors or resolv-ing 
insolvency indicators). Moreover, 
this limitation is likely to be more 
important in larger economies—where 
the largest business city is likely to 
represent a smaller share of the overall 
economy—and in those with greater 
regional diversity in business practices. 
To address this issue, this year Doing 
Business has expanded its sample of 
FIGURE 3.1 How much difference is there between the 2 calculations of the ease of 
doing business ranking? 
200 
180 
160 
140 
120 
100 
80 
60 
40 
20 
0 
0 20 40 60 80 100 120 140 160 180 200 
DB2014 ranking based on distance to frontier scores 
DB2014 ranking based 
on percentiles 
Mongolia 
Côte d’Ivoire 
Note: The 45-degree line shows where the rankings based on percentiles and the rankings based on distance to 
frontier scores are equal. The correlation between the 2 rankings is 0.99. 
Source: Doing Business database.
26 DOING BUSINESS 2015 
cities in large economies, defined as 
those with a population of more than 
100 million. Today there are 11 such 
economies in the world: Bangladesh, 
Brazil, China, India, Indonesia, Japan, 
Mexico, Nigeria, Pakistan, the Russian 
Federation and the United States. For 
each of these economies the sample 
now includes the second largest busi-ness 
city. Population size was used as 
the criterion for selecting these econo-mies 
for 2 main reasons: First, econo-mies 
with a large population, because of 
their size and diversity, are more likely 
to have differences in performance on 
indicators. Second, the larger the 
population in an economy, the larger the 
number of people who can benefit from 
improvements in business regulation. 
Within each economy the second city 
was also selected on the basis of popu-lation 
size. Another criterion was that 
the second city must be in a different 
metropolitan area than the largest 
business city.3 Other criteria were also 
considered, such as contribution to to-tal 
GDP or level of city dynamism, but 
these were not used in the end because 
of the lack of comparable data across 
the economies. 
What do the data for the new cities in 
the sample show about the differences 
within economies? Overall, the differ-ences 
are small. In 7 of the 11 econo-mies 
the difference in the distance to 
frontier score between the 2 cities is 
less than 1 point (figure 3.2). 
Broadening the scope of 
indicator sets 
Eight of the 10 sets of Doing Business 
indicators are being improved over a 
2-year period. The improvements are 
aimed at addressing 2 main concerns. 
First, in indicator sets that primarily 
measure the efficiency of a transaction 
or service provided by a government 
agency (such as registering property), 
the focus is being expanded to also 
cover aspects of the quality of that 
service. And second, in indicator sets 
that already measure some aspects of 
the quality of regulation (such as pro-tecting 
minority investors), the focus 
is being expanded to include additional 
good practices in the areas covered. 
INTRODUCING NEW 
MEASURES OF QUALITY 
Efficiency in regulatory transactions 
is important. Many research papers 
have highlighted the positive effect 
of improvements in areas measured 
by Doing Business on such economic 
outcomes as firm or job creation.4 
But increasing efficiency may have 
little impact if the service provided is 
of poor quality. For example, the ability 
to complete property transfers quickly 
and inexpensively is important, but if 
the land records are unreliable or other 
features of the property rights regime 
are flawed, the property title will have 
little value. 
There is a well-established literature 
linking regulatory quality with eco-nomic 
outcomes at the macro level. 
An important part of this literature 
stems from the Worldwide Governance 
Indicators, which measure regulatory 
quality as 1 of 6 pillars of governance. 
This literature has produced important 
findings: Better governance (includ-ing 
better regulatory quality) leads 
to higher income per capita.5 Better 
governance is linked to faster economic 
growth.6 And a heavier regulatory 
burden reduces economic growth and 
increases macroeconomic volatility.7 
While this research uses data far from 
the areas into which Doing Business 
indicators are expanding, these find-ings 
are encouraging and they suggest 
a need to better understand what 
aspects of regulatory quality drive 
these results. Measures of the quality 
of business regulation at the micro level 
are lacking. By expanding its focus on 
regulatory quality, Doing Business will 
open a new area for research. The aim 
is to help develop greater understand-ing 
of the importance of the quality 
of business regulation and its link to 
regulatory efficiency and economic 
outcomes. 
Six indicator sets are being expanded 
to measure regulatory quality: dealing 
with construction permits, getting 
electricity, registering property, pay-ing 
taxes, enforcing contracts and 
FIGURE 3.2 Small differences in the distance to frontier score between cities in the 
same economy 
Distance to frontier score of second 
largest business city (0–100) 
40 
40 
Indonesia China 
Brazil 
Pakistan 
60 
60 
Japan 
Russian Federation 
80 
80 
100 
100 
90 
70 
50 
United States 
Nigeria India 
50 70 90 
Distance to frontier score of largest business city (0–100) 
Bangladesh 
Mexico 
Note: The 45-degree line shows where the scores for the 2 cities are equal. 
Source: Doing Business database.
WHAT IS CHANGING IN DOING BUSINESS? 27 
resolving insolvency. The new indica-tors 
being introduced emphasize the 
importance of having the right type of 
regulations. In general, economies with 
less regulation or none at all will have a 
lower score on the new indicators. 
Changes in Doing Business 2015 
Resolving insolvency 
The resolving insolvency indicators 
measure the time, cost and outcome of 
an insolvency process for a case study 
firm and the recovery rate for its secured 
creditors. The indicators have focused 
mainly on the efficiency of the bank-ruptcy 
court system. But by measuring 
the outcome of the process—that is, 
whether the firm continues to operate 
or not—the indicators were already as-sessing 
some dimensions of the quality 
of insolvency regulation. In this year’s 
report the indicators go further, by 
explicitly measuring the strength of the 
legal framework for insolvency. 
A new indicator, the strength of in-solvency 
framework index, measures 
good practices in accordance with the 
World Bank’s Principles for Effective 
Insolvency and Creditor/Debtor Regimes 
and the United Nations Commission on 
International Trade Law’s (UNCITRAL) 
Legislative Guide on Insolvency Law.8 
The index measures 4 aspects. First, it 
records whether debtors and creditors 
have the right to commence liquidation 
proceedings, reorganization proceed-ings 
or both and what standard is used 
to determine whether a debtor is insol-vent. 
Second, it tests what happens 
to the contracts of a debtor during 
insolvency proceedings, whether post-commencement 
financing is permitted 
and what level of priority is granted to 
post-commencement creditors. Third, 
it tests the approval process for a 
reorganization plan as well as certain 
substantive requirements for the plan. 
Finally, it tests the extent to which 
creditors can participate in insolvency 
proceedings as a group as well as the 
rights of individual creditors to litigate 
and appeal decisions that affect their 
rights. 
Under the old methodology the distance 
to frontier score for resolving insolvency 
was based only on the recovery rate, 
which measures the cents on the dollar 
recouped by secured creditors through 
insolvency proceedings. Under the 
new methodology the score is based 
on both the recovery rate and the 
strength of insolvency framework index. 
A comparison of the 2 scores shows 
that many economies have insolvency 
laws that follow some good practices 
even if they may face challenges in 
implementing those laws (figure 3.3). 
For example, Brazil receives a score of 
13 (of 16 possible points) on the strength 
of insolvency framework index while its 
recovery rate is only 25.8% of the estate 
value. Economies not performing well 
on the new indicator are those that use 
foreclosure to resolve the insolvency in 
the Doing Business standardized case. 
Foreclosure is normally a relatively fast 
process, typically resulting in a higher 
recovery rate—but it ignores unsecured 
creditors, something that would not 
be true of a well-designed insolvency 
framework. In Maldives, for example, 
secured creditors should expect to re-cover 
49.9% of the estate value, but the 
country receives a score of only 2 on the 
strength of insolvency framework index. 
For more details on the new index and 
its scoring methodology, see the data 
notes. For a complete discussion of the 
new indicator and an analysis of the 
data, see the case study on resolving 
insolvency. 
Changes in Doing Business 2016 
Registering property 
The registering property indicator 
set has measured the procedures, 
time and cost to transfer a property 
from one company to another since 
2004. Starting in Doing Business 2016, 
the indicator set will be expanded to 
cover the reliability, transparency and 
geographic coverage of land admin-istration 
systems as well as dispute 
resolution for land issues. 
Ensuring the reliability of information 
on property titles is a crucial function 
of land administration systems. To 
FIGURE 3.3 Comparing distance to frontier scores for resolving insolvency under the 
old and new methodologies 
Distance to frontier score for resolving 
insolvency under new methodology 
100 
90 
80 
70 
60 
50 
40 
30 
20 
10 
0 
Maldives 
Brazil 
0 10 20 30 40 50 60 70 80 90 100 
Distance to frontier score for resolving insolvency under old methodology 
Note: Under the new methodology the distance to frontier score for resolving insolvency includes both the recovery 
rate and the strength of insolvency framework index; under the old one it includes only the recovery rate. Both scores 
are based on this year’s data. The 45-degree line shows where the scores under the old and new methodologies are 
equal. The correlation between the 2 scores is 0.90. 
Source: Doing Business database.
28 DOING BUSINESS 2015 
assess how well these systems are per-forming 
this function, a new indicator 
will record the practices used for col-lecting, 
recording, storing and process-ing 
information on land parcels and 
property titles. Specific attention will 
be given to practices that support data 
reliability, such as unifying, standard-izing 
and synchronizing records across 
different sources and putting in place 
the necessary infrastructure to reduce 
the risk of errors. 
The indicator will also provide informa-tion 
allowing comparison of transpar-ency 
standards for land administration 
systems around the world. New data 
will record what land-related informa-tion 
is made publicly available, whether 
procedures and property transactions 
are transparent and whether informa-tion 
on fees for public services is easily 
accessible. 
In addition, the indicator will measure 
the coverage levels attained by land 
registration and mapping systems. A 
land administration system that does 
not cover the economy’s entire territory 
is unable to guarantee the protection 
of property rights in areas that lack 
institutionalized information on land. 
The result is a dual system, with both 
formal and informal land markets. To 
be enforceable, all transactions need to 
be publicly verified and authenticated 
at the registry. 
Finally, the indicator will allow compar-ative 
analysis of land dispute resolu-tion 
across economies. It will measure 
the accessibility of conflict resolution 
mechanisms and the extent of liability 
for the entities or agents recording land 
transactions. For a complete discussion 
of the new indicator and a preliminary 
data analysis, see the case study on 
registering property. 
Dealing with construction 
permits 
The existing indicator set on dealing 
with construction permits measures 
the procedures, time and cost to 
comply with the formalities to build 
a warehouse—including obtaining 
necessary licenses and permits, 
completing required notifications 
and inspections and obtaining utility 
connections. The indicator set will be 
expanded in Doing Business 2016 to 
measure good practices in construc-tion 
regulation (see figure 3.4 for some 
of the new aspects that will be added 
to the indicator set). 
The changes will address important 
issues facing the building community. 
One is the need for clarity in the rules, 
to ensure that regulation of construc-tion 
can fulfill the vital function of 
helping to protect the public from 
faulty building practices. Besides be-ing 
clear, building rules also need to 
be adaptable, so that they can keep 
up with economic and technological 
change. To assess these character-istics, 
a new indicator on regulatory 
quality will examine how clearly the 
building code or building regulations 
specify the requirements for obtaining 
a building permit and how easily ac-cessible 
the regulations are. 
Beyond measuring the clarity and 
accessibility of regulations, the indi-cator 
will assess the effectiveness of 
inspection systems. Good inspection 
systems are critical to ensuring public 
safety. They can ensure that buildings 
comply with proper safety standards, 
reducing the chances of structural 
faults. And requirements that techni-cal 
experts review the proposed plans 
before construction even begins can re-duce 
the risk of structural failures later 
on. The new indicator will cover quality 
control at 3 stages: before, during and 
after construction. 
Measures of quality control before 
construction will look at 2 points: 
which entity is required to verify that 
the architectural plans and drawings 
comply with the building regulations 
and who makes up the team or com-mittee 
that reviews and approves 
building permit applications at the 
permit-issuing agency. Measures of 
quality control during construction 
will examine 3 points: what types of 
mandatory inspections (if any) are 
required by law during construction; 
which agency is responsible for con-ducting 
these inspections; and whether 
inspections required by law are actually 
carried out (or, if not required by law, 
commonly occur in practice). Measures 
of quality control after construction 
will also examine 3 points: whether a 
final inspection is required by law to 
FIGURE 3.4 What will be added to dealing with construction permits 
Does the building code 
follow good practices? Is it 
easily accessible? 
Who approves the designs? 
How are inspections 
carried out before, during 
and after construction? 
What qualifications are 
required for the professionals 
reviewing plans or 
conducting inspections? 
What are the rules on 
liability and insurance?
WHAT IS CHANGING IN DOING BUSINESS? 29 
verify that the building was built in ac-cordance 
with the approved plans and 
the building regulations; which agency 
is responsible for conducting the 
final inspection; and whether the final 
inspection required by law is actually 
carried out (or, if not required by law, 
commonly occurs in practice). 
The professionals who conduct the 
inspections play a vital part in ensuring 
that buildings meet safety standards. 
So it is important that these profes-sionals 
be certified and that they have 
the necessary technical qualifications. 
And if safety violations or construction 
flaws occur despite their efforts, it is im-portant 
to have a well-defined liability 
and insurance structure to cover losses 
resulting from any structural faults. 
The new indicator will cover several 
points relating to these issues: what 
the qualification requirements are 
for the professionals responsible for 
verifying the architectural plans and 
for those authorized to supervise the 
construction; which parties are held 
legally liable for construction flaws or 
problems affecting the structural safe-ty 
of the building once occupied; which 
parties are required by law to obtain an 
insurance policy to cover possible flaws 
or problems affecting the structural 
safety of the building once occupied; 
and what the consequences are for 
the construction company and the 
professionals authorized to supervise 
construction if construction flaws or 
problems are found or if building regu-lations 
were not complied with. 
Getting electricity 
The existing data set on getting elec-tricity 
measures the efficiency of the 
process for obtaining an electricity con-nection 
for a standard warehouse—as 
reflected in the procedures, time and 
cost required. While the efficiency of 
the connection process has proved 
to be a useful proxy for the overall ef-ficiency 
of the electricity sector, these 
measures cover only a small part of 
the sector’s performance. Beyond the 
complexity and high cost of getting an 
electricity connection, inadequate or 
unreliable power supply is also perceived 
as an important constraint on business 
activity, particularly in the developing 
world. To offer a more complete view 
of the electricity sector, Doing Business 
will broaden the scope of the getting 
electricity indicators to include the reli-ability 
of the power supply (figure 3.5). 
The expanded data set will be published 
in Doing Business 2016. 
A new indicator will assess the reliability 
of electricity supply by measuring both 
the duration and the frequency of power 
outages. The indicator will use the 
system average interruption duration 
index (SAIDI) and the system average 
interruption frequency index (SAIFI). 
SAIDI is the average total duration of 
outages over the course of a year for 
each customer served, while SAIFI is the 
average number of service interruptions 
experienced by a customer in a year. 
Collecting these data can be challeng-ing. 
The SAIDI and SAIFI measures are 
often recorded by utility companies, 
and the availability and quality of the 
data depend on the utilities’ ability to 
collect the information. To provide an 
understanding of the quality of moni-toring, 
the indicator will also record the 
methods used by electricity distribution 
companies to measure power outages. 
Paying taxes 
The paying taxes indicators measure 
the taxes and mandatory contributions 
that a medium-size company must 
pay in a given year as well as the 
administrative burden of paying taxes 
and contributions. The indicators now 
measure only the administrative burden 
associated with preparing, filing and 
paying 3 major tax categories (profit 
taxes, consumption taxes and labor 
taxes). But the postfiling process— 
involving tax audits, tax refunds 
and tax appeals—can also impose 
a substantial administrative burden 
on firms. Starting in Doing Business 
2016, the paying taxes indicator set 
will therefore be expanded to include 
measures of the postfiling process. 
In addition, this year’s report includes 
an important change in the methodol-ogy 
for the paying taxes indicators. 
The distance to frontier score for the 
total tax rate now enters the distance 
to frontier score for paying taxes in 
a nonlinear fashion. As a result of 
this change, an increase in the total 
tax rate has a smaller impact on the 
distance to frontier score for paying 
taxes than previously for economies 
with a below-average total tax rate 
and a larger impact for economies 
with a very high total tax rate relative 
to the average (see figure 15.2 and the 
related discussion in the chapter on the 
distance to frontier and ease of doing 
business ranking). 
FIGURE 3.5 What will be added to getting electricity 
Reliability of electricity supply 
²ƀƖŦƃĊĶĩƀĶâƀŎĶƦÊŦƀĶƖƃöÊŬ 
²ƀ/ŦÊśƖÊĩ³ƭƀĶâƀŎĶƦÊŦƀĶƖƃöÊŬ
30 DOING BUSINESS 2015 
Enforcing contracts 
The enforcing contracts indicators 
measure the procedures, time and 
cost to resolve a commercial dispute 
between 2 firms. The indicators have 
focused on the efficiency of the com-mercial 
court system without directly 
addressing the quality of the judiciary 
or the judicial infrastructure. In Doing 
Business 2016 the indicator set will be 
expanded to cover aspects of judicial 
quality and court infrastructure, 
focusing on well-established good 
practices that promote quality and 
efficiency in the commercial court 
system (figure 3.6). 
To assess the quality of the judiciary 
and judicial infrastructure, a new in-dicator 
will record whether there is a 
specialized commercial court or divi-sion; 
whether there is a small claims 
court; whether voluntary mediation is 
available; whether arbitration is avail-able; 
whether pretrial attachment of 
assets is available; whether it is com-mon 
practice for the parties in a com-mercial 
case to request adjournments 
and whether the law sets a limit on 
the total number allowed; and whether 
judgments in commercial cases are 
made available to the general public. 
Another new indicator will measure 
court efficiency. This indicator will re-cord 
whether the initial complaint can 
be filed electronically; whether case 
management is available; whether 
electronic case management is avail-able; 
whether there is a pretrial confer-ence 
as part of the case management 
system; and whether process can be 
served electronically. 
Once these new data are collected and 
presented in Doing Business 2016, the 
indicator on the number of procedures 
to enforce a contract will be dropped. 
EXPANDING THE EXISTING 
MEASURES OF QUALITY 
Two sets of Doing Business indicators— 
getting credit and protecting minority 
investors—already measure aspects 
of regulatory quality. These indicator 
sets have been expanded in this year’s 
report to incorporate more recent 
knowledge on good practices. These 
changes are reflected in this year’s 
ranking on the ease of doing business. 
Getting credit 
The getting credit indicators assess the 
legal rights of borrowers and lenders in 
secured transactions and the sharing of 
credit information. Measures compiled 
in the strength of legal rights index 
focus on whether collateral and bank-ruptcy 
laws include certain features 
that facilitate lending. Those combined 
in the depth of credit information 
index focus on the coverage, scope 
and accessibility of credit information 
available through credit bureaus and 
registries. Both sets of measures have 
been expanded this year to cover more 
good practices (figure 3.7). 
The strength of legal rights index has 
been expanded from 10 points to 12, 
with the new aspects selected in ac-cordance 
with UNCITRAL’s Legislative 
Guide on Secured Transactions.9 One of 
the new points is awarded for having 
an integrated secured transactions 
system. Modern secured transactions 
systems are aimed at ensuring that a 
prospective creditor can easily deter-mine 
not only whether an asset has 
already been pledged as collateral but 
also whether there is some other type 
of right over that asset. Such rights 
might be established by legal instru-ments 
that are functional equivalents 
to security interests. In an integrated 
secured transactions system these 
instruments are regulated under 
the same law as traditional security 
interests. This approach provides the 
greatest transparency and predict-ability— 
because all rights in collateral, 
whether traditional security interests 
or their functional equivalents, are 
registered at the same registry, and 
the law will contemplate how priority 
rules apply across the different types 
of contracts. 
FIGURE 3.6 What will be added to enforcing contracts 
Quality of 
the judiciary 
Electronic filing of 
complaints 
Case management 
Electronic case management 
Pretrial conference 
Electronic service 
of process 
Specialized commercial court 
Small claims court 
Voluntary mediation 
Arbitration 
Pretrial attachment 
Adjournments 
Publication of 
judgments 
Court 
efficiency
WHAT IS CHANGING IN DOING BUSINESS? 31 
Other new points are awarded for hav-ing 
a well-functioning collateral regis-try, 
defined by several characteristics. 
One is that the registry must cover any 
type of secured transaction, regard-less 
of the type of debtor, creditor or 
assets.10 Another is that the registry 
must be a notice-based registry. This 
type of registry has much lower ad-ministrative 
and archival costs than a 
document registry, which must register 
voluminous documentation and have 
specialists review the documents pro-vided 
and the assets used as collateral. 
Finally, the registry must offer modern 
features. Secured creditors (or their 
representatives) should be able to 
register, search, amend and cancel 
security interests online. Information in 
the database should be updated imme-diately 
or no more than 24 hours after 
registration documents are submitted. 
And the registry should have a digital 
database for storing the informa-tion. 
These types of online solutions 
enhance the efficiency of a registry 
and the reliability of the information it 
records. Establishing and maintaining 
such systems can be costly, however, 
and these systems need to be backed 
by adequate legislation, such as pri-vacy 
laws and regulations on electronic 
signatures. 
The depth of credit information index 
has been expanded from 6 points to 8. 
In addition, because of the importance 
of coverage in assessing the effective-ness 
of a credit information system, 
only credit bureaus or registries that 
cover at least 5% of the adult popula-tion 
are being scored. 
One of the new points is awarded to 
economies where credit information can 
be accessed through an online platform 
or through a system-to-system connec-tion 
between financial institutions and 
the credit information system. Online 
access can improve data quality and 
security, increase efficiency and trans-parency 
and ensure a high standard 
of service for users—and thus might 
increase the number of reporting insti-tutions 
that share credit information. 
Another new point is awarded to econo-mies 
where credit scores are available. 
Credit scores, considered more effective 
in predicting risk than credit histories 
alone, may improve market efficiency 
and provide borrowers with more op-portunities 
to obtain credit. Their 
availability enables lenders that would 
otherwise not be capable of analyzing 
the raw credit data to extend credit to 
underserved markets at lower cost. 
For more details on the expanded indi-cators 
and their scoring methodology, 
see the data notes. For a complete 
discussion of the indicators and an 
analysis of the data, see the case study 
on getting credit. 
Protecting minority investors 
The name of the protecting investors 
indicator set has been changed this 
year to protecting minority investors to 
better reflect its scope—and the scope 
of the indicator set has been expanded. 
The indicators have traditionally mea-sured 
the strength of minority share-holder 
protections against directors’ 
misuse of corporate assets for personal 
gain. This year a new indicator has 
been added to measure shareholders’ 
rights in corporate governance beyond 
related-party transactions, following 
internationally accepted good practic-es 
such as those proposed by the OECD 
Principles of Corporate Governance.11 The 
new indicator, the extent of shareholder 
governance index, encompasses a 
range of issues and data: 
ƒ Shareholders’ rights and role in major 
corporate decisions—the extent to 
which shareholders can influence 
important corporate decisions, such 
as appointing and removing board 
members, issuing new shares and 
amending the company’s bylaws 
and articles of association. 
ƒ Governance structure—the extent to 
which the law mandates separation 
between corporate constituencies to 
minimize potential agency conflicts. 
The issues covered include whether 
the chief executive officer (CEO) can 
also be chair of the board of direc-tors, 
whether a board must include 
a minimum number of independent 
directors and whether there are 
rules relating to cross-shareholding 
and subsidiary ownership. 
ƒ Transparency—the extent to which 
companies are required to disclose 
information about their finances, 
about the remuneration of their 
managers and directors and about 
other directorships they hold. 
Transparency has been found to im-prove 
governance and lower the cost 
of investment in capital markets. 
ƒ Allocation of legal expenses—the 
extent to which the expenses as-sociated 
with lawsuits brought by 
shareholders can be recovered from 
the company or the payment of the 
expenses can be made contingent 
on a successful outcome. The data 
provide information on whether 
FIGURE 3.7 What has been added to getting credit 
²ƀƀ9ĩƃÊöŦƃÊÀƀĚÊöĚƀ 
ŦĊöĆƃŬƀâŦĥÊƦĶŦė 
²ƀƀMĶŦÊƀâʏƃƖŦÊŬƀĶâƀƃĆÊƀ 
³ĶĚ̏ƃÊŦĚƀŦÊöĊŬƃŦƭ 
²ƀƀƫĊŬƃÊĩ³ÊƀĶâƀĩƀĶĩĚĊĩÊƀ 
Ŏ̏ƃâĶŦĥ 
²ƀƀƥĊ̏ªĊĚĊƃƭƀĶâƀ 
³ŦÊÀĊƃƀŬ³ĶŦÊŬ 
hƃŦÊĩöƃĆƀĶâƀ 
ĚÊöĚƀŦĊöĆƃŬ 
ÊŎƃĆƀĶâƀ³ŦÊÀĊƃƀ 
ĊĩâĶŦĥƃĊĶĩ
32 DOING BUSINESS 2015 
FIGURE 3.8 Comparing distance to frontier scores for protecting minority investors 
under the old and new methodologies 
Distance to frontier score for protecting minority 
investors under new methodology 
Switzerland 
filing a shareholder action is pro-hibitively 
expensive—and therefore 
impracticable even if allowed by law. 
By expanding the scope of the indica-tors 
Doing Business has raised the bar, 
making it more difficult to reach the 
frontier. The highest distance to frontier 
score for protecting minority investors 
observed under the new methodology is 
lower than the highest one under the old 
methodology (figure 3.8). The average 
score across all economies covered by 
Doing Business is also lower under the 
new methodology than under the old 
one. This is true even though the pos-sible 
range of the overall measure, the 
strength of minority investor protection 
index, continues to be 0–10. Yet some 
economies score higher on the overall in-dex 
under the new methodology. One of 
them is Switzerland. While it performs 
relatively poorly in protecting minority 
investors in related-party transactions, 
it does considerably better on general 
corporate governance rules. For others, 
such as Paraguay, the opposite is true. 
For more details on the methodology 
for the protecting minority investors 
Paraguay 
indicators, see the data notes. For a 
complete discussion of the new indica-tor 
and an analysis of the data, see 
the case study on protecting minority 
investors. 
NOTES 
1. For more information on the Independent 
Panel on Doing Business and its work, see its 
website at http://www.dbrpanel.org. 
2. See the data notes for more details. 
3. Where the second and third largest cities 
were very close in population size, the GDP 
of the city or relevant state was used to 
determine which city was the second largest 
business city. 
4. For more details, see the chapter in Doing 
Business 2014 on research on the effects of 
business regulations. 
5. Kaufmann and Kraay 2002. 
6. Cuzman, Dima and Dima 2010. 
7. Loayza, Oviedo and Servén 2010. 
8. World Bank 2011b; UNCITRAL 2004. 
9. UNCITRAL 2007. 
10. Excluding exemptions such as planes, boats 
and the like, which are traditionally covered 
by different registries. 
11. OECD 2004. 
100 
90 
80 
70 
60 
50 
40 
30 
20 
10 
0 
0 10 20 30 40 50 60 70 80 90 100 
Distance to frontier score for protecting minority investors under old methodology 
Note: Under the new methodology the distance to frontier score for protecting minority investors includes 6 areas of 
corporate governance; under the old one it includes 3 of the 6 areas. Both scores are based on this year’s data. The 
45-degree line shows where the scores under the old and new methodologies are equal. The correlation between the 
2 scores is 0.87. 
Source: Doing Business database.
Doing Business 2015 
Going Beyond Efficiency 
Reforming the business 
environment in 2013/14 
As many studies have shown, 
the business environment can 
have an important influence on 
the development of the private sector 
and economic growth—and thus on the 
creation of jobs and better livelihoods. 
Where well designed and properly 
implemented, regulatory reforms can 
promote private sector growth by elimi-nating 
bureaucratic obstacles, reducing 
cost and time constraints to doing 
business and improving the efficiency of 
legal institutions. They can also have an 
important impact on perceptions of an 
economy’s business environment. 
One important area of regula-tory 
reform is the process for starting 
a business. Research provides strong 
evidence that reforms making it easier 
to start a business are associated with 
more firm creation,1 which in turn is 
strongly associated with job creation 
and economic growth. Using a sample 
of OECD countries, researchers found 
that, on average, halving the number of 
procedures required to start a business 
is associated with a 14% increase in the 
number of new business registrations. 
A similar reduction in the days required 
is linked to a 19% increase, while an 
equivalent cut in the cost is associated 
with a 30% increase. 
These findings are borne out by evidence 
at the country level. After a reform in 
Mexico that reduced the number of 
procedures to start a business by about 
60%, the country saw a 5% increase in 
the total number of firms.2 Portugal ex-perienced 
similar effects after it reduced 
the time and cost to start a business 
by 50%. New start-ups increased by 
about 17%, with most of the growth 
among less productive firms, those 
“that would have been most deterred by 
burdensome regulations, such as small 
firms in low-tech sectors.”3 Comparable 
evidence exists on a regional level for 
Italy: provinces with a longer process 
for starting a business have lower rates 
of firm creation than those with a more 
streamlined process.4 
Regulatory reforms can have impor-tant 
positive spillover effects. In trade 
logistics, evidence shows that improv-ing 
port efficiency not only reduces 
shipping times but also ultimately cuts 
shipping costs. According to analysis of 
data for the Doing Business indicators on 
trading across borders, increasing port 
efficiency from the 25th to the 75th 
percentile can reduce shipping costs 
by 12%.5 These spillover effects on ship-ping 
costs decrease with an economy’s 
income level: high-income economies 
showed greater effects than low- and 
middle-income ones. 
Moreover, better regulation is strongly 
correlated with better perceptions of 
the quality of the business environment 
in an economy.6 And there is strong 
evidence that regulatory reforms in 
the areas measured by Doing Business 
indicators improve perceptions of 
quality. But the research is inconclusive 
about which reforms have a greater 
effect—those affecting the indicators 
that measure the complexity and 
cost of regulatory processes or those 
ƒ Doing Business has captured more 
than 2,400 regulatory reforms 
making it easier to do business since 
2004. 
ƒ In the year ending June 1, 2014, 123 
economies implemented at least one 
such reform in areas measured by 
Doing Business—230 in total. 
ƒ Among reforms to reduce the 
complexity and cost of regulatory 
processes in 2013/14, those in the 
area of starting a business were the 
most common, followed by reforms 
in the areas of paying taxes and 
registering property. 
ƒ Among reforms to strengthen legal 
institutions in 2013/14, the largest 
numbers were recorded in the areas 
of getting credit and protecting 
minority investors, and the smallest 
in the area of resolving insolvency. 
ƒ Eight of the 11 economies with a 
population of more than 100 million 
implemented at least one reform 
making it easier to do business 
in the past year. China, Mexico 
and the Russian Federation each 
implemented 2, while India and 
Indonesia each implemented 3. 
ƒ Greece, Italy, Portugal and Spain— 
all among the economies most 
adversely affected by the global 
financial crisis—have maintained a 
steady pace of regulatory reform.
34 DOING BUSINESS 2015 
affecting the indicators that measure 
the strength of legal institutions. Overall, 
there appears to be no statistically 
significant differences between the 2 
groups of indicators. 
Using its indicators to track changes in 
business regulations, Doing Business has 
captured more than 2,400 regulatory 
reforms making it easier to do business 
since 2004. In the year ending June 1, 
2014, 123 economies implemented at 
least one such reform in areas mea-sured 
by Doing Business—230 in total. 
From year to year Doing Business has 
recorded many more reforms reducing 
the complexity and cost of regulatory 
processes than reforms strengthening 
legal institutions. It is no different for 
2013/14, with a count of 145 reforms re-ducing 
regulatory complexity and cost 
and 85 strengthening legal institutions 
(table 4.1). 
This pattern is no surprise. It happens 
in small economies and in large ones 
(box 4.1). Reforms aimed at cutting 
red tape and improving regula-tory 
efficiency are generally easier 
to implement, because they rarely 
involve large institutional players and 
they yield relatively quick results. By 
contrast, reforms aimed at improving 
legal institutions are typically com-plex. 
Most entail substantial changes 
to legal frameworks, are costly to 
implement and can take years to yield 
positive results. 
HIGHLIGHTS OF REFORMS 
REDUCING REGULATORY 
COMPLEXITY AND COST 
Among reforms to reduce the complex-ity 
and cost of regulatory processes in 
2013/14, those in the area of starting 
a business were the most common, 
followed by reforms in paying taxes. 
The area with the third largest number 
of reforms was registering property, 
though in previous years it tended to 
be trading across borders. 
TABLE 4.1 Reforms making it easier to do business in 2013/14 and in the past 
5 years 
Easing bureaucratic barriers to 
start-up 
Start-up formalities, while they still 
vary around the world, are converging 
toward good practices. In 2013/14, as 
in earlier years, many of the reforms 
making it easier to start a business 
focused on introducing a one-stop 
shop or eliminating the minimum 
capital requirement (see table 4A.1 at 
the end of the chapter). Timor-Leste, 
the economy that improved the ease 
of starting a business the most, did 
so by creating a one-stop shop. Now 
entrepreneurs can complete several 
formalities in one place—reserving a 
company name, submitting company 
documents, applying for registration 
and publishing company statutes. By 
streamlining start-up formalities and 
centralizing services, the new one-stop 
shop reduced the time required to start 
a business from 94 days to just 10. 
São Tomé and Príncipe eliminated the 
minimum capital requirement for busi-ness 
entities with no need to obtain a 
commercial license. Moldova abolished 
the minimum capital requirement for 
all limited liability companies. The 
Russian Federation, through amend-ments 
to its civil code and federal law, 
eliminated the requirement for a com-pany’s 
founders to deposit the charter 
capital before incorporation. Russia 
also abolished the requirement for 
companies to notify the tax authorities 
of the opening of bank accounts. 
Cutting red tape in 
construction permitting 
Doing Business recorded 16 reforms 
making it easier to deal with construc-tion 
permits in 2013/14. Most were 
in Europe and Central Asia and Sub- 
Saharan Africa. Djibouti and Ghana 
both streamlined their permitting pro-cess. 
Madagascar and Senegal reduced 
the time required to obtain a building 
permit. Mali reduced the time needed 
to obtain a geotechnical study. And 
Rwanda eliminated the fee to obtain a 
freehold title and streamlined the pro-cess 
for obtaining an occupancy permit. 
Area of reform 
Number of reforms 
in 2013/14 
Average annual 
number of reforms 
in past 5 years 
Economy improving 
the most in area in 
2013/14 
Complexity and cost of regulatory processes 
Starting a business 45 45 Timor-Leste 
Dealing with construction permits 16 19 Croatia 
Getting electricity 12 12a Solomon Islands 
Registering property 21 22 Greece 
Paying taxes 31 34 Romania 
Trading across borders 20 23 Myanmar 
Strength of legal institutions 
Getting credit—legal rights 9 10 Colombia 
Getting credit—credit information 22 20 Jamaica 
Protecting minority investors 30 14 United Arab Emirates 
Enforcing contracts 15 13 Kosovo 
Resolving insolvency 10 17 Mozambique 
Note: Because Jamaica implemented changes in the past year in both the strength of legal rights and depth of credit 
information components of getting credit, the table shows a total of 231 reforms for 2013/14, though only 230 are 
counted as separate reforms. 
a. Refers to the average for the past 4 years. 
Source: Doing Business database.
REFORMING THE BUSINESS ENVIRONMENT IN 2013/14 35 
BOX 4.1 Most economies with a population of more than 100 million implemented at least one regulatory reform in 2013/14 
Some people might assume that reforming business regulation is easier in small economies because their government 
structures tend to be less complex. The Doing Business data do not suggest that this is so. Eight of the 11 economies with 
a population of more than 100 million reformed in at least one of the areas measured by Doing Business in 2013/14, while 
only 18 of the 34 economies with a population of less than 1 million did so. Among the 11 large economies, China, Mexico 
and the Russian Federation each implemented 2 reforms making it easier to do business, while India and Indonesia each 
implemented 3 (see table). 
What did these economies do? India made starting a business easier by considerably reducing the registration fees— 
though it also added a requirement to file a declaration before commencing business operations. It made obtaining a 
new electricity connection in Mumbai less costly by reducing the security deposit. And it strengthened minority investor 
protections by requiring greater disclosure by board members, increasing the remedies available in case of prejudicial 
related-party transactions and introducing additional safeguards for shareholders of privately held companies. 
Indonesia made starting a business easier by making it possible to issue the approval letter for the deed of establishment 
electronically. It made getting electricity in Jakarta easier by eliminating the need for multiple certificates guaranteeing 
the safety of internal installations. And it lowered labor taxes. 
China also made starting a business easier, by eliminating the minimum capital requirement and thus the need for a 
capital verification report from an auditing firm. In addition, it reduced employers’ social security contribution rate in 
Shanghai and enhanced the electronic system for filing and paying taxes. 
Mexico improved access to credit by amending its insolvency 
proceedings law and establishing clear grounds for relief from a 
stay of enforcement actions by secured creditors during reor-ganization 
Croatia made the biggest improve-ment 
in the ease of dealing with 
construction permits (figure 4.1). New 
regulations in the Building Act and 
Physical Planning Act that took effect 
on January 1, 2014, made it possible to 
obtain a building permit before paying 
contribution fees for utilities, speeding 
up the permitting process. The fees 
for building permits were also reduced. 
In addition, registration of the new 
building with the land registry is now 
done automatically, with no action re-quired 
by the builder: the municipality 
sends documentation to the cadastre 
for registration, and the cadastre 
sends documentation on to the land 
registry. And the final inspection is 
now done with greater timeliness, dra-matically 
reducing the time required 
for the issuance of the occupancy per-mit. 
As a result of all these changes, 
the number of procedures required to 
comply with the formalities to build 
a warehouse in Croatia fell from 22 
to 21, the time from 379 days to 188 
and the cost by 0.3% of the warehouse 
value. 
Making it easier to get 
electricity 
Doing Business recorded only 12 reforms 
making it easier to get electricity in 
proceedings. And it made resolving insolvency easi-er 
by shortening the time extensions during reorganization pro-ceedings 
and facilitating electronic submission of documents. 
Russia made starting a business easier by eliminating the re-quirement 
to deposit the charter capital before company reg-istration 
as well as the requirement to notify tax authorities of 
the opening of bank accounts. And it made transferring prop-erty 
easier by eliminating the need for notarization and reduc-ing 
the time required for property registration. 
In 2013/14 the 11 large economies were more likely to imple-ment 
reforms reducing the complexity and cost of regulatory 
processes than reforms strengthening legal institutions—a 
pattern also evident in smaller economies. Among the 15 re-forms 
captured by Doing Business in these large economies, 
most were at the national level and affect both cities mea-sured. 
One of the exceptions was in the United States, where 
the reform making it easier to start a business applies to New 
York City but not to Los Angeles. 
Reforms making it easier to do business in the 11 large 
economies in 2013/14 
Economy 
Reforms reducing 
regulatory 
complexity and cost 
Reforms 
strengthening legal 
institutions 
Bangladesh 1 0 
Brazil 0 0 
China 2 0 
India 2 1 
Indonesia 3 0 
Japan 0 0 
Mexico 0 2 
Nigeria 0 0 
Pakistan 1 0 
Russian Federation 2 0 
United States 1 0 
Note: The table shows data for the 11 large economies for which Doing Business 
covers both the largest and the second largest business city. 
Source: Doing Business database.
36 DOING BUSINESS 2015 
FIGURE 4.1 Croatia cut more than 6 months from the time required to deal with 
construction permits 
180 
160 
140 
120 
100 
80 
60 
40 
20 
1 2 3 4 5 6 7 8 9 10 11 12 13 14 15 16 17 18 19 20 21 22 
450 
400 
350 
300 
250 
200 
150 
100 
50 
0 
2013/14. Revision of the costs for new 
connections was the most common 
feature of the reforms. In Rwanda, 
where increasing the electrification rate 
is a government priority, the distribu-tion 
utility waived all fees for complet-ing 
a new connection, including the 
security deposit. The big reduction in 
cost provides a strong incentive to seek 
an official connection to the network 
and encourages new business ventures. 
In Poland the utility in Warsaw revised 
the fee structure for new connections 
in ways that reduced the cost for new 
customers. In India the electricity utility 
in Mumbai changed its method for cal-culating 
the security deposit. The utility 
now calculates it as a fixed charge per 
kilowatt rather than basing it on a cus-tomer’s 
estimated monthly consump-tion, 
increasing the transparency of the 
related costs. 
Another common feature of electricity 
reforms was improvement in the effi-ciency 
of distribution utilities’ internal 
processes. The utility in the Democratic 
Republic of Congo, Société Nationale 
d’Electricité, reduced the time required 
to get electricity by improving its 
administrative management of new 
connection requests. Starting in 2014 
the utility began tracking how much 
time each of its departments takes 
to deal with connection requests. The 
utility also streamlined its internal 
approval process: its staff no longer 
seeks approval from the head office 
for each individual connection request 
but instead submits batches once a 
month. The utility in Malawi reduced 
the time required to get electricity 
by outsourcing external connection 
works to subcontractors. 
In many economies shortages in the 
materials needed for external works— 
such as transformer substations—are 
a source of substantial delays in the 
connection process. Tackling this 
issue was a focus of the utility in 
the Solomon Islands. By improving 
procurement practices, the utility cut 
the wait time for new connections by 
two-thirds (figure 4.2). As a result, the 
Solomon Islands made the biggest 
improvement in the ease of getting 
electricity in 2013/14. 
Simplifying property 
registration 
In 2013/14, 21 economies made it easier 
for businesses to register property by 
reducing the time, cost or number of 
procedures required. Among the most 
common improvements were reducing 
property transfer taxes, combining or 
eliminating procedures, and introduc-ing 
computerized procedures. Lowering 
the property transfer tax can substan-tially 
reduce the cost of transferring 
property and improve compliance with 
property registration and tax regula-tions, 
though this type of change needs 
to be informed by broader tax policy 
discussions. 
FIGURE 4.2 The Solomon Islands reduced the time to obtain an electricity connection 
by two-thirds 
0 
Procedures 
2013 2014 
Time to get electricity (days) 
Await inspection of the 
internal wiring by SIEA 
and installation of the 
meter; electricity 
starts flowing 
Await completion of 
the external connection 
works by SIEA 
Await completion of an 
external inspection by 
SIEA for purposes of 
preparing the estimate 
Submit application for 
a connection to SIEA 
and await a cost 
estimate 
Time cut from 
160 days to 53 
Note: SIEA is the Solomon Islands Electricity Authority. 
Source: Doing Business database. 
Procedures 
One procedure cut, 
191 days saved 
Time to deal with 
construction permits (days) 
2013 2014 
Source: Doing Business database.
REFORMING THE BUSINESS ENVIRONMENT IN 2013/14 37 
Payments (number per year) 
Total tax rate (% of commercial profit) Time (hours per year) 
120 
100 
80 
60 
40 
20 
Greece made the largest improvement 
in the ease of registering property (figure 
4.3). In December 2013 it established a 
new property transfer tax of 3% of the 
property value, substantially lower than 
the previous one of 10%. In addition, it 
simplified property transfers by elimi-nating 
the need to submit a tax clear-ance 
certificate from the municipality 
before signing the sale agreement. 
240 
200 
160 
120 
80 
40 
Sub-Saharan Africa accounted for the 
largest number of property registra-tion 
reforms in 2013/14. For example, 
Mozambique streamlined registration 
procedures at the land registry and the 
municipality. Côte d’Ivoire established 
a single process for tax and property 
registration and lowered the property 
registration tax. Senegal replaced the 
requirement for authorization from 
the tax authority with a notification 
requirement and set up a single step 
for the property transfer at the land 
registry. 
Making it easier and less costly 
to pay taxes 
Doing Business recorded 31 reforms 
in 2013/14 making it easier or less 
costly for firms to pay taxes. Europe and 
Central Asia accounted for the largest 
number, with 9. Globally, the most com-mon 
feature of tax reforms in the past 
year was the introduction or enhance-ment 
of electronic systems for filing 
and paying taxes. Thirteen economies 
implemented such changes, including 
Azerbaijan, Belarus, Moldova, Mongolia, 
Romania, Tajikistan and Ukraine. 
Electronic tax systems, if implemented 
well and used by most taxpayers, ben-efit 
both tax authorities and firms. For 
tax authorities, they ease workloads 
and reduce operational costs. And for 
firms, they reduce the time required to 
comply with tax obligations as well as 
the potential for errors. 
Romania improved the ease of paying 
taxes the most in 2013/14 (figure 4.4). 
The government has developed an 
electronic system for filing and paying 
corporate income tax, value added tax 
and all 6 mandatory labor contribu-tions 
measured by Doing Business.7 The 
system was initially launched in 2010, 
though with only the possibility of 
submitting tax returns online. Over the 
past 2 years, however, online payment 
of taxes and contributions became 
possible with the use of banking cards 
and was gradually taken up by the 
business community. By January 2013 
the majority of firms were making their 
tax payments online. 
Other economies making noteworthy 
changes in the area of paying taxes in 
the past year include Belarus, China, 
the Democratic Republic of Congo and 
Latvia. Belarus improved its system for 
keeping online records for corporate 
income tax and value added tax. The 
FIGURE 4.3 Greece made registering property both easier and less expensive 
Time to register property 
(days) 
Cost to register property 
(% of property value) 
1 2 3 4 5 6 7 8 9 10 11 
25 
20 
15 
10 
5 
0 
14 
12 
10 
8 
6 
4 
2 
0 
2013 
Procedures 
Cost 
2014 
Procedures 
Cost 
One procedure eliminated, and 
cost reduced by 6.86% of the 
property value 
Procedures 
Note: In 2014 procedures 3, 4 and 5 occur simultaneously with procedure 2 (although procedures may take place 
simultaneously, they cannot start on the same day). Procedure 6 starts after procedure 2. 
Source: Doing Business database. 
FIGURE 4.4 Romania has been making compliance with tax obligations easier in 
recent years 
2004 2005 2006 2007 2008 2009 2010 2011 2012 2013 
0 
0 
Payments Total tax rate Time 
Source: Doing Business database.
38 DOING BUSINESS 2015 
system now automatically updates 
all relevant tax rates, alerts users of 
potential errors and automatically col-lects 
and checks data required for filling 
out tax returns. Belarus also simplified 
its rules for deducting expenses for the 
calculation of corporate income tax. 
Four other economies merged or elimi-nated 
certain taxes—the Republic of 
Congo, Hungary, Senegal and Zambia. 
Eleven economies reduced profit tax 
rates, the second most common fea-ture 
of tax reforms in 2013/14. These 
include 4 high-income economies 
(Portugal, Spain, St. Kitts and Nevis, 
and the United Kingdom), 3 upper-middle- 
income economies (Colombia, 
the Seychelles and Tunisia) and 4 lower-middle- 
income economies (the Republic 
of Congo, Guatemala, Swaziland and 
Vietnam). Reductions in profit tax rates 
are often combined with efforts to 
widen the tax base by removing exemp-tions 
and with increases in the rates of 
other taxes, such as value added tax. 
Facilitating trade 
Myanmar made the biggest improve-ment 
in the ease of trading across 
borders in 2013/14 (figure 4.5). Its 
Ministry of Commerce abolished the 
export license requirement for 166 
types of goods and the import license 
requirement for 152—reducing the 
time, cost and number of documents 
required to export and import general 
cargo products. As measured by Doing 
Business, exporting now takes 20% less 
time than before, and importing 19% 
less time. 
Tanzania invested in port infrastruc-ture. 
New cranes, a conveyor belt and 
anchorage tankers at the port of Dar 
es Salaam helped reduce berthing and 
unloading time as well as congestion. 
The reduction in the time required for 
port and terminal handling activities 
benefits not only traders in Tanzania 
but also those in the landlocked econo-mies 
of Burundi and Rwanda that use 
the port. 
FIGURE 4.5 Myanmar reduced the time to export and import by abolishing license 
requirements for many types of goods 
Time to export (days) Time to import (days) 
Document preparation 
30 
25 
20 
15 
10 
5 
Eighteen other economies also 
implemented reforms making it 
easier to trade across borders in 
2013/14. Introducing or improving 
electronic submission and processing 
of documents was the most common 
feature of these reforms. Eight 
economies—Bangladesh, Croatia, Ecuador, 
Pakistan, Palau, St. Lucia, Uganda 
and Uzbekistan—reduced the time to 
export and import by implementing 
computerized systems that allow 
web-based submission of documents. 
Croatia switched to an electronic 
customs system as part of reforms 
in preparation for accession to the 
European Union. 
Improving customs administration 
remained an important item on reform 
agendas. Benin, Côte d’Ivoire, the 
Dominican Republic, Morocco, Myanmar, 
St. Lucia and Uzbekistan all did so by 
reducing the number of documents 
required by customs or streamlining the 
process to obtain and submit certain 
documents. 
Five economies—Algeria, Ghana, 
Jordan, Kazakhstan and Tanzania— 
strengthened transport or port 
Port and terminal handling 
Inland transport and handling 
30 
25 
20 
15 
10 
5 
infrastructure. Kazakhstan opened a 
new border station and railway link that 
reduced congestion at the border with 
China. Poland improved port procedures 
by launching a new terminal operating 
system at the port of Gdansk. And 
Uruguay implemented a risk-based in-spection 
system that reduced customs 
clearance time. 
HIGHLIGHTS OF REFORMS 
STRENGTHENING LEGAL 
INSTITUTIONS 
Among reforms to strengthen legal 
institutions in 2013/14, the largest 
numbers were recorded in the areas of 
getting credit and protecting minority 
investors (with 30 in each area), and 
the smallest in the area of resolving 
insolvency. Economies in Europe and 
Central Asia implemented the most 
reforms aimed at strengthening legal 
institutions, followed by economies in 
Sub-Saharan Africa. 
Strengthening legal rights of 
borrowers and lenders 
In 2013/14, 9 economies improved ac-cess 
to credit by strengthening the legal 
Customs clearance and inspections 
0 
2013 2014 
0 
2013 2014 
Source: Doing Business database.
REFORMING THE BUSINESS ENVIRONMENT IN 2013/14 39 
rights of borrowers and lenders—either 
by reforming secured transactions 
legislation or by enhancing secured 
creditors’ rights in bankruptcy pro-ceedings 
(see table 4A.1 at the end of 
the chapter). Colombia, Hungary and 
Jamaica all implemented a functional 
approach to secured transactions. The 
Czech Republic and the Lao People’s 
Democratic Republic both created a 
modern, notice-based collateral reg-istry. 
Hungary and Panama expanded 
the range of movable assets that can 
be used as collateral. Mexico, Rwanda, 
and Trinidad and Tobago strengthened 
the rights of secured creditors during 
reorganization proceedings. 
Globally, Colombia strengthened the 
legal rights of borrowers and lenders 
the most, by implementing a new legal 
framework for secured transactions 
(table 4.2). The country launched a col-lateral 
registry with modern features in 
May 2014, following approval of a new 
law on movable property guarantees. 
The new law permits all types of mov-able 
assets, present or future, to be 
used as collateral to secure a loan. The 
law also regulates legal instruments 
that are the functional equivalents of 
traditional security interests, such as 
assignments of receivables and sales 
with retention of title. In addition, it pro-vides 
priority rules for creditors’ claims 
within bankruptcy and establishes 
the rights of secured creditors during 
reorganization proceedings. Finally, the 
law allows out-of-court enforcement of 
collateral. 
Jamaica also made noteworthy im-provements 
in the area of legal rights 
in the past year. It adopted a new law 
on secured transactions that broadens 
the range of assets that can be used as 
collateral, allows a general description 
of assets granted as collateral and 
establishes a modern, unified, notice-based 
collateral registry. Panama 
implemented similar changes and also 
introduced the possibility of out-of-court 
enforcement of collateral. 
The Czech Republic, through an 
amendment to its civil code, made it 
possible to register receivables at the 
pledge registry. It also introduced the 
possibility for the parties to a secu-rity 
agreement to agree to out-of-court 
enforcement of the collateral. The 
government of Lao PDR established a 
centralized, online, notice-based reg-istry 
where financial institutions can 
register any security interest held over 
movable property—including functional 
equivalents to more traditional security 
interests, such as financial lease agree-ments, 
assignments of receivables, 
fiduciary transfers of title and sales 
with retention of title. 
Improving credit information 
systems 
Jamaica made the biggest improve-ment 
in credit reporting in 2013/14. 
Two new credit bureaus, Creditinfo 
Jamaica and CRIF-NM Credit Assure 
Limited, having received business 
licenses in 2012, began operations in 
2013. Twenty-one other economies 
also improved credit reporting, with 
the largest number of them in Sub- 
Saharan Africa. 
The Democratic Republic of Congo and 
Tanzania both established new credit 
reporting agencies. The Democratic 
Republic of Congo’s central bank es-tablished 
an electronic system allow-ing 
the exchange of credit information 
between its credit registry and banks 
and financial institutions. Tanzania’s 
central bank issued an operating 
license to the country’s first credit 
bureau, Creditinfo Tanzania, in June 
2013, and to its second one, Dun  
Bradstreet Credit Bureau Tanzania, in 
September 2013. Creditinfo Tanzania 
began responding to inquiries from 
data users 2 months after receiving its 
license. Vietnam’s first credit bureau, 
Vietnam Credit Information, started 
serving data users in January 2014 
along with the existing credit registry 
managed by the country’s central 
bank. 
TABLE 4.2 A comparison of Colombia’s 
previous and new legal frameworks for 
secured transactions 
Previous legal 
New legal 
framework 
framework 
Is there a functional secured transactions system? 
No. Yes. 
Is the collateral registry unified or centralized 
geographically for the entire economy? 
No. Yes. 
Is the collateral registry notice-based? 
No. Yes. 
Does the collateral registry have a modern 
online system (such as for registrations and 
amendments)? 
No. Yes. 
Can secured creditors apply for relief from 
an automatic stay during reorganization 
proceedings? 
No. Yes, the new law 
establishes clear 
grounds for relief. 
Do secured creditors’ claims have priority inside 
bankruptcy? 
No clear priority rules 
for secured creditors. 
Yes, the new law gives 
priority to secured 
creditors’ claims. 
Can security rights in a single category of assets 
be described in general terms? 
No, detailed description 
of the assets required 
by law. 
Yes, the new law allows 
a general description. 
Can parties agree to enforce security rights out 
of court? 
No, out-of-court 
enforcement not 
permissible by law. 
Yes, the new law 
allows out-of-court 
enforcement of 
collateral. 
Source: Doing Business database. 
Five Sub-Saharan African economies— 
Cabo Verde, Cameroon, Côte d’Ivoire, 
Kenya and Senegal—strengthened 
their regulatory frameworks for credit 
reporting. Cameroon’s government 
passed legislation establishing an in-tegrated 
database that records nega-tive 
payment information on bank 
accounts, checks and cards as well as 
credit information on firms and micro-finance 
institutions. Kenya issued new 
regulations allowing the exchange of 
positive credit information and estab-lishing 
guidelines for data retention.
40 DOING BUSINESS 2015 
Time for enforcement cut from 180 days to 90 
Time to enforce 
a contract (days) 
200 
180 
160 
140 
120 
100 
80 
60 
40 
20 
Among OECD high-income economies, 
Ireland and the Slovak Republic im-proved 
their regulatory frameworks for 
credit reporting. Ireland created a regu-latory 
framework for the establishment 
and operation of a central credit register 
that will be managed by the country’s 
central bank. The Slovak Republic ad-opted 
a new regulation to protect the 
rights of individuals in the processing of 
their personal data. And New Zealand, 
under its Credit Reporting Privacy Code, 
introduced more comprehensive credit 
reporting. In addition to negative credit 
information, credit bureaus now collect 
and report positive credit information 
on individuals and firms from banks, 
financial institutions and telephone 
companies. 
Strengthening minority 
investor protections 
The United Arab Emirates strength-ened 
minority investor protections 
the most in 2013/14, through a new 
ministerial resolution on corporate gov-ernance 
rules and corporate discipline 
standards. The resolution establishes 
requirements for related-party trans-actions 
to be approved by a general 
meeting of shareholders, to undergo 
prior review by a specialized external 
firm and to be disclosed in detail to the 
Securities and Commodities Authority. 
The resolution also establishes director 
liability for any damage resulting from 
prejudicial related-party transactions 
and enables courts to cancel such 
transactions on grounds of unfairness. 
Finally, it permits shareholders repre-senting 
5% or more of the shares of a 
company involved in a related-party 
transaction to access documents relat-ing 
to the transaction. 
The most far-reaching change in minor-ity 
investor protections, however, took 
place in January 2014, when the OHADA 
(Organization for the Harmonization 
of Business Law in Africa) Revised 
Uniform Act on Commercial Companies 
and Economic Interest Groups simul-taneously 
updated the regulatory 
frameworks of 17 member economies 
in Sub-Saharan Africa. The revised act 
addresses multiple aspects of corporate 
law. Among other things, it increases the 
requirements for directors to disclose 
their conflicts of interest and grants 
shareholders the right to access and ob-tain 
copies of all documents pertaining 
to related-party transactions. 
One OHADA member, Senegal, made 
further improvements by amending its 
code of civil procedure—and with these 
changes became the economy that 
most strengthened minority investor 
protections in Sub-Saharan Africa in 
2013/14. Notably, the amendments 
grant litigants increased rights to obtain 
evidence relevant to their claims from 
the opposing parties. Elsewhere in the 
region, The Gambia adopted a new 
Companies Bill, clarifying the duties of 
directors and offering new venues and 
remedies for minority shareholders 
harmed by abusive conduct by company 
insiders. 
Making it easier to enforce 
contracts 
Doing Business recorded 15 reforms 
making it easier to enforce contracts 
in 2013/14. Kosovo made the biggest 
improvement—by introducing a private 
bailiff system (figure 4.6). The effort 
began in 2010, when the local judiciary 
was short of resources and facing a 
heavy backlog. Less than 4% of civil 
enforcement cases on court dockets 
were completed in 2009, and for 
many courts the share was less than 
1%. The Kosovo Judicial Council, with 
the assistance of the U.S. Agency for 
International Development, analyzed 
the legal framework and identified 
the main causes of delay. This map-ping 
exercise showed that the lack of 
penalties for filing groundless appeals, 
the impossibility of seizing most kinds 
of assets and the inadequacy of the 
regulatory framework for enforcement 
officers contributed substantially to 
the growing backlog. A 3-year work 
plan was undertaken to provide more 
suitable ways to deal with business dis-putes. 
In 2013 Kosovo finished privatiz-ing 
its judicial enforcement process and 
FIGURE 4.6 Kosovo cut the time for enforcing judgments in half by introducing a 
private bailiff service 
Filing and service Trial and judgment Enforcement 
2013 2014 
0 
Source: Doing Business database.
REFORMING THE BUSINESS ENVIRONMENT IN 2013/14 41 
created private bailiff services, expedi-ent 
execution procedures and penalties 
for noncompliant debtors. 
Globally, one of the most common 
features of reforms in contract en-forcement 
in the past year was the in-troduction 
of electronic filing. Greece, 
Kazakhstan, Lithuania, Mauritius and 
Turkey all made their courts more effi-cient 
by implementing electronic filing 
platforms. These enable litigants to 
file initial complaints electronically— 
increasing transparency, expediting 
the filing and the service of process, 
limiting opportunities for corruption 
and preventing the loss, destruction 
or concealment of court records. In 
Singapore the judiciary launched an 
electronic litigation system designed 
to streamline the litigation process 
and improve access to justice. The 
system allows litigants to file their 
cases online—and it enables courts to 
keep litigants and lawyers informed 
about their cases through e-mail, text 
messages and text alerts; to manage 
hearing dates; and even to hold certain 
hearings through videoconference. 
The Bahamas, Portugal and Uruguay 
adopted a new code of civil procedure 
or amended procedural rules ap-plicable 
to commercial cases, mainly 
to reduce case backlog, simplify 
and expedite court proceedings and 
limit obstructive techniques. In 2013 
Uruguay passed a law setting tight 
deadlines that parties to a commercial 
case must comply with throughout the 
entire court proceedings. Three econo-mies— 
the Czech Republic, Ireland 
and South Africa—reorganized their 
court systems by amending the rules 
on the size of monetary claims that 
can be filed with courts at different 
levels, thus redistributing the workload 
among courts and reducing backlog. 
Creating specialized commercial courts 
or divisions has been a common feature 
of reforms in contract enforcement over 
the years. Two economies undertook 
such changes in 2013/14. Benin estab-lished 
a commercial chamber within its 
court of first instance and assigned 6 
judges to solely hear commercial cases. 
The Seychelles established a special-ized 
commercial court and assigned a 
permanent local judge to resolve only 
commercial disputes. 
Increasing efficiency in 
resolving insolvency 
Doing Business recorded 10 reforms 
making it easier to resolve insolvency 
in 2013/14, most of them in OECD 
high-income and Sub-Saharan African 
economies. Among the most common 
features of these reforms were promot-ing 
reorganization and improving the 
likelihood of successful outcomes in 
insolvency proceedings. Mozambique, 
the Seychelles, and Trinidad and 
Tobago introduced a court-supervised 
reorganization procedure. Switzerland 
allowed cancellation of long-term 
contracts that could jeopardize the 
debtor’s rehabilitation. Slovenia es-tablished 
a simplified reorganization 
procedure for small companies and a 
preventive restructuring procedure for 
medium-size and large ones. Slovenia 
also made it easier for creditors to 
initiate reorganization proceedings 
and propose a reorganization plan, 
introduced provisions on debt-equity 
swaps and allowed new equity hold-ers 
to take over management of the 
debtor to ensure continuation of the 
business. 
Mozambique improved the ease of re-solving 
insolvency the most in the past 
year (table 4.3). A new legal framework 
for insolvency adopted in 2013 intro-duced 
a reorganization procedure for 
commercial entities, granted creditors 
better access to information during in-solvency 
proceedings and provided for 
more active participation by creditors 
in the proceedings. 
Other insolvency reforms recorded in 
2013/14 focused on streamlining and 
shortening time frames for proceedings. 
TABLE 4.3 A comparison of 
Mozambique’s previous and new legal 
frameworks for insolvency 
Previous legal 
New legal 
framework 
framework 
Can a debtor initiate reorganization proceedings? 
No. Yes. 
Do creditors vote on the reorganization plan? 
No reorganization 
Yes, all creditors vote. 
available. 
Do creditors vote on the reorganization plan in 
classes? 
No reorganization 
available. 
Creditors are divided 
into classes, creditors 
within each class are 
treated equally, and 
the plan is approved 
by a simple majority of 
creditors in each class. 
Can creditors request information about 
insolvency proceedings? 
No specific provisions. The insolvency 
administrator has 
the duty to provide 
any creditor with 
information requested 
by the creditor. 
Can creditors object to decisions that affect their 
rights? 
No specific provisions. A creditor has the right 
to object to decisions to 
accept or reject claims 
of other creditors. 
Source: Doing Business database. 
The former Yugoslav Republic of 
Macedonia tightened time frames for 
several stages of insolvency proceed-ings 
and established a framework for 
electronic auctions of debtors’ assets. 
Mexico shortened the time extensions 
allowed during reorganization pro-ceedings 
and made it easier to submit 
documents electronically. Several other 
economies reformed their insolvency 
laws to strengthen the rights of credi-tors. 
For example, Kazakhstan estab-lished 
provisions for direct participa-tion 
of all creditors through creditors’ 
meetings. 
Another common feature of insolvency 
reforms in the past year was to im-prove 
regulations on the profession of 
insolvency administrators. Trinidad and
42 DOING BUSINESS 2015 
Tobago created a public office respon-sible 
for the general administration of 
insolvency proceedings and clarified 
rules on the appointment and duties 
of trustees. And Uganda established 
explicit rules on the enforcement of the 
duties of liquidators during liquidation 
proceedings. 
Addressing labor market 
regulation 
In 2013/14 Doing Business recorded 9 
reforms relating to labor market regu-lation. 
The economies implementing 
reforms included Portugal, which has 
made the most reforms aimed at im-proving 
the labor market environment 
in recent years. In 2013 Portugal re-vised 
the rules on fixed-term contracts 
executed under the labor code that 
reach their maximum duration before 
November 8, 2015; under the new rules 
these contracts can be renewed 2 more 
times, with an additional maximum 
duration of 12 months, though the 
renewed contracts need to end by 
December 31, 2016. In previous years 
Portugal reduced the wage premium 
required for work on weekly holidays 
and also made redundancy easier by 
eliminating the need to follow a specific 
order in dismissals when eliminating a 
worker’s position. Portugal’s continual 
reforms in labor market regulation are 
in part a response to the economic 
downturn that followed the global 
financial crisis. And Portugal is one of 
several Southern European economies 
that reformed business regulation in 
areas beyond labor market regulation 
in 2013/14 (box 4.2). 
Other economies implementing re-forms 
in labor market regulation in 
2013/14 focused on different areas. 
Cabo Verde introduced a minimum 
wage. Finland made the redundancy 
process more flexible by eliminating the 
requirement to notify a third party be-fore 
dismissing 1 redundant worker or a 
group of 9 redundant workers. Croatia 
lifted the 3-year limit on the duration 
of first-time fixed-term contracts, 
BOX 4.2 Southern European economies continue a steady pace of regulatory 
reform 
Greece, Italy, Portugal and Spain—all among the economies most adversely 
affected by the global financial crisis—have maintained a steady pace of regu-latory 
reform. As Doing Business 2013 reported, the pace picked up in the after-math 
of the crisis, and this year’s report shows that the trend has continued. In 
2013/14 Greece reformed in 3 areas of business regulation measured by Doing 
Business, and Spain in 4. 
Greece made starting a business easier by lowering the cost of registration. It 
made transferring property easier by reducing the property transfer tax and 
eliminating the requirement for a municipal tax clearance certificate. And it 
made enforcing contracts easier by introducing an electronic filing system for 
court users. 
Italy and Spain also made starting a business easier. Italy reduced the minimum 
capital requirement, while Spain simplified business registration by introducing 
an electronic system that links several public agencies. Portugal lowered its 
corporate income tax rate and introduced a reduced corporate tax rate for a 
portion of the taxable profits of qualifying small and medium-size enterprises. 
Spain reduced its statutory corporate income tax rate. 
Portugal made enforcing contracts easier by adopting a new code of civil pro-cedure 
designed to reduce court backlog, streamline court procedures, enhance 
the role of judges and speed up the resolution of standard civil and commer-cial 
disputes. Spain made resolving insolvency easier by introducing new rules 
for out-of-court restructuring as well as provisions applicable to prepackaged 
reorganizations. 
These economies, by actively reducing the complexity and cost of regulatory 
processes and strengthening legal institutions, are narrowing the gap with the 
regulatory frontier at a faster pace than the rest of the European Union. 
while Mauritius reduced the maximum 
duration of fixed-term contracts to 24 
months and Georgia reduced it to 30 
months. 
NOTES 
1. Klapper and Love 2011. 
2. Bruhn 2011. 
3. Branstetter and others 2013. 
4. Bripi 2013. 
5. Portugal-Perez and Wilson 2012. 
6. Kraay and Tawara 2013. 
7. The 6 mandatory labor contributions 
measured by Doing Business are those 
for social security, health insurance, 
unemployment, an accident risk fund, a 
guarantee fund and medical leave.
REFORMING THE BUSINESS ENVIRONMENT IN 2013/14 43 
TABLE 4A.1 Who reduced regulatory complexity and cost or strengthened legal institutions in 2013/14—and what did they do? 
Feature Economies Some highlights 
Making it easier to start a business 
Simplified preregistration and 
Albania; Bulgaria; The Gambia; Guatemala; 
registration formalities (publication, 
India; Islamic Republic of Iran; Jamaica; Malawi; 
notarization, inspection, other 
Malta; Mauritius; Nicaragua; Norway; Slovak 
requirements) 
Republic; Spain; Swaziland; United Kingdom 
Guatemala’s official gazette reduced the time to publish a notice of 
incorporation by modifying internal processes. The Islamic Republic of 
Iran combined name reservation with company registration at a single 
window. 
Abolished or reduced minimum capital 
requirement 
Austria; Benin; China; Côte d’Ivoire; Czech 
Republic; Denmark; Italy; Moldova; São Tomé 
and Príncipe; Senegal; Togo 
China and Côte d’Ivoire both abolished the minimum capital 
requirement. In doing so, China also eliminated the need to open a 
preliminary bank account, deposit the capital and obtain a certificate 
of deposit. 
Cut or simplified postregistration 
procedures (tax registration, social 
security registration, licensing) 
Armenia; Greece; Jamaica; Lithuania; 
Mauritania; Russian Federation; United States 
Lithuania abolished the requirement for a company seal, no longer 
used in practice. Mauritania eliminated the requirement to publish 
company statutes in the official gazette. 
Introduced or improved online 
procedures 
Azerbaijan; Croatia; Iceland; Indonesia; FYR 
Macedonia; Switzerland; Trinidad and Tobago 
Trinidad and Tobago introduced an online platform for business 
registration, reducing registration time from 38 days to 14.5. The 
former Yugoslav Republic of Macedonia introduced a free online 
company registration system. 
Created or improved one-stop shop Democratic Republic of Congo; France; 
Suriname; Tajikistan; Timor-Leste 
Timor-Leste created a one-stop shop—making it possible to reserve 
a company name, file the company statutes, apply for and obtain the 
final registration number and publish the statutes all at one agency. 
Making it easier to deal with construction permits 
Reduced time for processing permit 
applications 
Albania; Croatia; Djibouti; Ghana; Lithuania; 
Madagascar; Senegal; Thailand 
Lithuania tightened the time limit for issuing special architectural 
requirements, cutting the time to obtain a building permit from 42 
days to 21. Madagascar completed the computerization of its one-stop 
shop, reducing the time to obtain a building permit from 90 days 
to 45. 
Streamlined procedures Albania; Brunei Darussalam; Djibouti; Ghana; 
Madagascar; Mali; Rwanda 
Djibouti streamlined the review of building permits by adopting a 
3-step process. Ghana made it mandatory to submit all required 
clearances when applying for a building permit. 
Adopted new building regulations Albania; Croatia; Lithuania; Montenegro; Nepal Albania adopted a new law on territory planning, consolidating 
the land permit and construction permit into a single construction 
development permit. Croatia’s adoption of the Building Act and a new 
Physical Planning Act made it possible to obtain a building permit 
before paying contribution fees for utilities. 
Improved building inspection process Kosovo; Nepal; Puerto Rico (U.S.) Kosovo introduced a new inspection scheme and made the final 
inspection process easier by breaking the approval process into several 
phases. Puerto Rico (territory of the United States) introduced the 
option of hiring an authorized professional and authorized inspector 
to carry out the fire safety recommendations and issue the fire 
prevention and environmental health certificates. 
Reduced fees Croatia; Rwanda; Tajikistan Rwanda eliminated the fee to obtain a freehold title. Tajikistan reduced 
the fee for obtaining an architectural planning assignment. 
Improved or introduced electronic 
platforms or online services 
Nepal Nepal launched an online system for obtaining building permits. 
Making it easier to get electricity 
Improved regulation of connection 
processes and costs 
India; Jamaica; Poland; Rwanda; Sierra Leone; 
Taiwan, China 
In Poland the electricity utility made obtaining a new connection less 
costly by revising its fee structure. In Rwanda the electricity utility 
eliminated all its fees for a new connection. 
Improved process efficiency Democratic Republic of Congo; Costa Rica; 
Malawi; Solomon Islands 
The electricity utility in Malawi engaged private subcontractors to 
carry out external connection works, reducing the time required to 
complete the works by 50 days. 
Streamlined approval process Indonesia; Islamic Republic of Iran Indonesia eliminated a redundant internal wiring inspection by 
dropping the requirement for a certificate guaranteeing that the 
internal installation meets the standards. 
Making it easier to register property 
Reduced taxes or fees Bahrain; Côte d’Ivoire; Greece; San Marino; 
Spain; Togo 
Greece reduced the property transfer tax from 10% of the property 
value to 3%. Spain reduced the property registration tax to 6% of the 
property value. 
Combined or eliminated procedures Colombia; Greece; Mozambique; Russian 
Federation; Senegal 
Colombia eliminated the need for a provisional registration. The 
Russian Federation eliminated the requirement for notarization of 
certain documents. 
Computerized procedures Albania; Côte d’Ivoire; Ireland; Sweden; Vanuatu Ireland enhanced its land registry’s computerized system and 
implemented an online system for title registration. In Vanuatu 
property records have been scanned, and the land registry is now 
using a fully computerized system for land transactions. 
Increased administrative efficiency Guinea; Republic of Korea; United Arab Emirates The District Registration Courts in the Republic of Korea increased 
efficiency by streamlining internal processes. The United Arab 
Emirates started licensing companies to act on behalf of the Dubai 
Land Department and use its system for property registration.
44 DOING BUSINESS 2015 
TABLE 4A.1 Who reduced regulatory complexity and cost or strengthened legal institutions in 2013/14—and what did they do? 
Feature Economies Some highlights 
Making it easier to register property (continued) 
Set effective time limits Albania; Kazakhstan; Russian Federation Albania established effective time limits for processing requests at 
the local offices for registration of immovable property. Kazakhstan 
introduced effective time limits for issuing technical passports and 
nonencumbrance certificates on immovable property. 
Introduced online procedures Azerbaijan; Poland Azerbaijan introduced a system allowing notaries to obtain 
nonencumbrance certificates online. Poland provided legal status to 
land extracts obtained online. 
Introduced fast-track procedures Sierra Leone Sierra Leone introduced a fast-track procedure for property 
registration. 
Making it easier to pay taxes 
Introduced or enhanced electronic 
systems 
Azerbaijan; Belarus; China; Costa Rica; Gabon; 
Guatemala; Moldova; Mongolia; Romania; 
Taiwan, China; Tajikistan; Ukraine; Zambia 
Belarus introduced electronic filing and payment for the obligatory 
insurance fund in 2013. 
Reduced profit tax rate by 2 
percentage points or more 
Colombia; Republic of Congo; Guatemala; 
Portugal; Seychelles; Spain; Swaziland; St. Kitts 
and Nevis; Tunisia; United Kingdom; Vietnam 
Portugal reduced the corporate income tax rate from 25% to 23% for 
2013. 
Simplified tax compliance process Belarus; Brunei Darussalam; China; Democratic 
Republic of Congo; Latvia; Seychelles 
Latvia introduced a simplified value added tax return in January 2013. 
Reduced labor taxes and mandatory 
contributions by 1 percentage point 
or more 
China; Colombia; Indonesia; Togo China reduced the social security contribution rate for firms in 
Shanghai from 37% to 35% for 2013. 
Merged or eliminated taxes other than 
profit tax 
Republic of Congo; Hungary; Senegal; Zambia Hungary abolished the special tax that had been introduced in 2010. 
Reduced number of tax filings or 
payments 
Belarus; Cyprus; West Bank and Gaza Cyprus reduced the number of provisional tax installments for 
corporate income tax from 3 to 2 in 2013. 
Making it easier to trade across borders 
Introduced or improved electronic 
submission and processing 
Bangladesh; Croatia; Ecuador; Pakistan; Palau; 
St. Lucia; Uganda; Uzbekistan 
Ecuador upgraded to a new electronic data interchange system, 
reducing customs clearance time. 
Improved customs administration Benin; Côte d’Ivoire; Dominican Republic; 
Morocco; Myanmar; St. Lucia; Uzbekistan 
St. Lucia reduced the number of export documents that must be 
submitted to customs by merging 2 forms. 
Strengthened transport or port 
infrastructure 
Algeria; Ghana; Jordan; Kazakhstan; Tanzania Ghana invested in infrastructure at the port of Tema, which helped 
reduce the wait time for vessels outside the port. 
Improved port procedures Côte d’Ivoire; Poland Poland launched a new terminal operating system at the port of 
Gdansk. 
Introduced or improved risk-based 
inspections 
Uruguay Uruguay implemented a risk-based inspection system that reduced 
customs clearance time. 
Strengthening legal rights of borrowers and lenders 
Created a unified registry for movable 
property 
Colombia; Hungary; Jamaica; Lao PDR The Lao People’s Democratic Republic established a registry in the 
Ministry of Finance for security interests in movable property. The 
registry began operating in November 2013. 
Introduced a functional, integrated 
and comprehensive secured 
transactions regime 
Colombia; Hungary; Jamaica Colombia approved a new law establishing a modern legal framework 
for secured transactions. The law allows all types of movable assets, 
present or future, to be used as collateral to secure a loan. It also 
regulates functional equivalents to loans secured with movable property, 
such as assignments of receivables and sales with retention of title. 
Strengthened rights of secured 
creditors during reorganization 
procedures 
Mexico; Rwanda; Trinidad and Tobago In Mexico amendments to the insolvency proceedings law established 
new grounds for relief from a stay of enforcement actions by secured 
creditors during a reorganization procedure. 
Allowed out-of-court enforcement Czech Republic; Panama The Czech Republic adopted new legislation making it possible to 
execute a security in any way established by the parties to a security 
agreement. 
Expanded range of movable assets 
that can be used as collateral 
Hungary; Panama Panama introduced a new law governing chattel mortgages that 
expands the range of movable assets that can be used as collateral to 
secure a loan. 
Improving the sharing of credit information 
Expanded scope of information 
collected and reported by credit 
bureau or registry 
Bahrain; Cyprus; Mauritania; New Zealand; 
Sierra Leone; Taiwan, China; United Arab 
Emirates; Zambia 
New Zealand implemented comprehensive credit reporting and began 
distributing both positive and negative information in credit reports. 
Improved regulatory framework for 
credit reporting 
Cabo Verde; Cameroon; Côte d’Ivoire; Dominican 
Republic; Ireland; Kenya; Senegal; Slovak 
Republic 
Ireland adopted a new credit reporting act providing for the 
establishment of a central credit register to be managed by the 
central bank. 
Established a credit bureau or registry Democratic Republic of Congo; Jamaica; 
Tanzania; Vietnam 
In Jamaica 2 new credit bureaus, licensed in 2012, started serving 
banks and other financial institutions in 2013. 
Introduced bureau or registry credit 
scores as a value added service 
Nicaragua; Tajikistan In Nicaragua in June 2013 the credit bureau TransUnion Nicaragua 
started offering the service of credit scoring based on its data.
REFORMING THE BUSINESS ENVIRONMENT IN 2013/14 45 
TABLE 4A.1 Who reduced regulatory complexity and cost or strengthened legal institutions in 2013/14—and what did they do? 
Feature Economies Some highlights 
Strengthening minority investor protections 
Increased disclosure requirements for 
related-party transactions 
Benin; Burkina Faso; Cameroon; Central African 
Republic; Chad; Comoros; Democratic Republic 
of Congo; Republic of Congo; Côte d’Ivoire; 
Ecuador; Arab Republic of Egypt; Equatorial 
Guinea; Gabon; Guinea; Guinea-Bissau; 
Hong Kong SAR, China; India; Lao PDR; FYR 
Macedonia; Mali; Mongolia; Niger; Senegal; Togo; 
United Arab Emirates; Uzbekistan 
Uzbekistan adopted a new law on joint stock companies and 
protection of shareholder rights that establishes higher standards for 
disclosure of related-party transactions by interested directors and 
requires companies to include information on such transactions in 
their annual reports. 
Enhanced access to information in 
shareholder actions 
Benin; Burkina Faso; Cameroon; Central African 
Republic; Chad; Comoros; Democratic Republic 
of Congo; Republic of Congo; Côte d’Ivoire; 
Equatorial Guinea; Gabon; Guinea; Guinea-Bissau; 
Mali; Niger; Senegal; Togo; United Arab Emirates 
Senegal’s code of civil procedure, amended in August 2013, now 
permits judges to grant requests from parties to a civil case to compel 
evidence from the other party, as long as they are relevant to the 
subject matter of the claim. 
Expanded shareholders’ role in 
company management 
Dominican Republic; India; Republic of Korea; 
Switzerland 
Switzerland issued a federal ordinance against abusive remuneration 
in publicly listed joint stock companies. The ordinance introduced 
multiple safeguards, including establishing compensation committees 
and increasing the transparency of directors’ compensation schemes. 
Increased director liability The Gambia; India; United Arab Emirates India’s new companies act came into effect in 2014, bringing a host 
of enhancements, notably on the prevention of abuse by corporate 
insiders and company mismanagement. 
Making it easier to enforce contracts 
Increased procedural efficiency at 
main trial court 
The Bahamas; Czech Republic; Ireland; Portugal; 
South Africa; Uruguay 
The Bahamas and Portugal introduced new rules of civil procedure 
to streamline and expedite court proceedings and ensure less costly 
resolution of disputes. The Czech Republic, Ireland and South Africa 
amended the monetary thresholds for courts at different levels to 
reduce backlog. 
Introduced electronic filing Greece; Kazakhstan; Lithuania; Mauritius; 
Turkey 
Greece, Kazakhstan, Lithuania, Mauritius and Turkey all introduced an 
electronic filing system for commercial cases, allowing attorneys to 
submit the initial summons online. 
Introduced or expanded specialized 
commercial court 
Benin; Seychelles Benin established a commercial chamber within its court of first 
instance and assigned 6 judges to solely hear commercial cases. The 
Seychelles established a specialized commercial court and assigned a 
permanent local judge to resolve only commercial disputes. 
Expanded court automation Singapore Singapore launched a new electronic litigation system that 
streamlines litigation proceedings. 
Made enforcement of judgment more 
efficient 
Kosovo Kosovo introduced private bailiffs and strengthened its enforcement 
process by establishing penalties for noncompliant debtors. 
Making it easier to resolve insolvency 
Introduced a new restructuring 
procedure 
Mozambique; Seychelles; Slovenia; Trinidad and 
Tobago; Uganda 
Uganda established a reorganization procedure for insolvent but viable 
companies. 
Strengthened creditors’ rights Kazakhstan; Mexico; Mozambique; Switzerland; 
Uganda 
Kazakhstan expanded the rights of creditors in insolvency, making it 
possible for them to remove the debtor from management, nominate 
an insolvency representative and approve a plan for the sale of assets 
in case of liquidation. 
Improved the likelihood of successful 
reorganization 
Mexico; Seychelles; Slovenia; Switzerland Mexico introduced provisions allowing debtors to apply for post-commencement 
financing, establishing priority rules for post-commencement 
financing and permitting debtors facing imminent 
insolvency to apply for reorganization proceedings. 
Established framework for out-of-court 
restructuring 
FYR Macedonia; Slovenia; Spain Spain established a framework for a prebankruptcy, out-of-court 
payment agreement. 
Regulated the profession of insolvency 
administrators 
Mozambique; Trinidad and Tobago; Uganda Trinidad and Tobago created a public office responsible for the general 
administration of insolvency proceedings and clarified rules on the 
appointment and duties of trustees. 
Streamlined and shortened time 
frames for insolvency proceedings 
Kazakhstan; FYR Macedonia; Mexico FYR Macedonia tightened time frames for several stages of insolvency 
proceedings, including inventory and assessment of the debtor’s 
property, submission of creditors’ claims and the hearing to examine 
claims. 
Improved provisions applicable to 
voidable transactions 
Seychelles; Uganda The Seychelles introduced provisions allowing the avoidance of 
undervalued transactions or transactions made as a gift, if entered into 
within 2 years before the commencement of liquidation proceedings. 
Changing labor market regulation 
Altered hiring rules Cabo Verde; Croatia; Georgia; Italy; Mauritius; 
Portugal 
Cabo Verde introduced a minimum wage. Croatia lifted the 3-year 
limit on the duration of first-time fixed-term contracts. 
Changed redundancy cost and 
procedures 
Belgium; Croatia; Finland; France; Georgia; 
Portugal 
Finland eliminated the requirement to notify a third party before 
dismissing 1 or a group of 9 redundant employees. 
Note: Reforms affecting the labor market regulation indicators are included here but do not affect the ranking on the ease of doing business. 
Source: Doing Business database.
Doing Business 2015 
Going Beyond Efficiency 
Starting a business 
The growing efficiency of company registries 
Entrepreneurs should have the op-portunity 
to turn their ideas into 
a business. Often a first step is to 
formally register a company. Yet in many 
countries the bureaucratic obstacles and 
high costs imposed by inefficient com-pany 
registries deter people with good 
business ideas from embarking on the 
path of formal entrepreneurship. 
Formal registration has substantial 
benefits for businesses and for the 
economy as a whole. Registered 
companies can benefit from legal and 
financial services provided by courts 
and commercial banks, services not 
available to unregistered businesses. 
Their employees benefit from social 
security protections. And the economy 
benefits from positive spillovers: where 
formal entrepreneurship is higher, job 
creation and economic growth also 
tend to be higher.1 Moreover, as more 
businesses formalize, the tax base 
expands, enabling the government to 
spend on productivity-enhancing areas 
and pursue other social and economic 
policy objectives. 
As the first interface between the regu-lator 
and a potential new entrepreneur, 
company registries hold the key to the 
formal economy, providing businesses 
with a legal identity and empowering 
them to participate fully and within the 
framework of the law. Thus the relative 
ease or difficulty of start-up can have 
important economic consequences. 
Evidence suggests that regulatory re-forms 
making it easier to start a formal 
business are associated with increases 
in the number of newly registered firms 
and with higher levels of employment 
and productivity. Conversely, exces-sively 
cumbersome regulation of start-up 
is associated with higher levels of 
corruption and informality.2 
WHAT IS AN EFFICIENT 
REGISTRY? 
Institutional efficiency at company 
registries is thus a critical element 
of a healthy economy.3 What makes 
an efficient registry? Answering that 
question first requires understanding 
what registries do. 
A company registry records and 
updates information on new and exist-ing 
companies in its jurisdiction and 
enables registered entities to comply 
with their obligations under the current 
regulatory framework, including those 
related to the company laws.4 In do-ing 
so, the registry incorporates legal 
entities, providing them with a unique 
identification, and deregisters insol-vent 
firms. Other services provided by 
a registry commonly include conduct-ing 
company name searches, reserving 
company names and processing ap-plications 
for business licenses. 
These functions enable the government 
to measure tax compliance or 
avoidance in the formal sector and 
to derive other business statistics by 
economic sector or by company size 
or ownership type. They also enable 
the government to determine which 
ƒ Company registries empower 
businesses to operate in the formal 
economy—and to reap the benefits 
that come with formalization. 
ƒ Online platforms for company 
incorporation make the process 
faster and cheaper. 
ƒ Electronic registration and online 
services substantially reduce the 
opportunities for bribery and other 
forms of corruption. 
ƒ Rwanda has made promoting 
private sector development a top 
priority on its reform agenda—and 
making it easier to register a 
business is part of that. 
ƒ Chile’s new online business 
registry experienced rapid take-up, 
accounting for nearly half of new 
registrations of limited liability 
companies in just 7 weeks. 
ƒ The United Kingdom’s corporate 
registry actively promotes the use 
of electronic services and data 
transparency.
48 DOING BUSINESS 2015 
entities are eligible to participate in 
public tenders and bids (generally 
only formally registered companies). 
In addition, they promote consumer 
protection, as business licensing often 
represents a quality check to ensure 
that business activities in certain 
“high-risk” industries—such as food 
preparation and pharmaceuticals— 
meet the required health, safety and 
environmental standards.5 
In evaluating a registry’s efficiency in 
providing daily services, several ele-ments 
are often considered to be key: a 
comprehensive electronic database, a 
one-stop shop and an online platform 
for business registration. An effective 
electronic database maintains up-to- 
date information and documents 
on both newly registered and existing 
companies and makes this information 
easily accessible, whether online or on-site 
at the registry’s office. Historically, 
records were kept in a paper-based for-mat. 
But the growing trend of comput-erization 
among company registries 
has enabled the electronic storage and 
maintenance of records. This not only 
helps reduce errors in inputting and 
updating business information but also 
speeds up searches. In addition, elec-tronic 
record keeping makes it easier to 
extract statistics. 
One-stop shops for business registra-tion 
have become increasingly com-mon. 
Globally, 100 economies have 
already launched one. And these 100 
one-stop shops are quite widely dis-tributed, 
with 64 of them located in 
low- or middle-income economies. A 
one-stop shop provides a single service 
point for completing several business 
registration processes. It might consist 
of several windows or offices occupied 
by representatives from different 
government agencies that entrepre-neurs 
need to visit sequentially. Some 
one-stop shops are even “one-window 
shops”—providing a single point of in-teraction 
between an entrepreneur and 
all the government agencies involved 
in business registration. In these one-stop 
shops an entrepreneur can submit 
all the necessary documents at one 
window, and the documents are then 
distributed to the appropriate agencies 
for processing and approval. 
A GLOBAL TREND OF GOING 
ELECTRONIC 
Putting processes online takes efficien-cy 
one step further. Doing Business data 
show that among the 189 economies 
covered, 144 have introduced online 
platforms for business incorporation. 
These enable entrepreneurs to file 
incorporation documents electronically 
and sometimes even to complete the 
entire business registration process 
online. 
Company registries in 95 economies 
around the world reported extensive 
use of online services in the World Bank 
Group Entrepreneurship Survey in 
2013. Among those in the sample, 60% 
offer an online application to register a 
business, and 58% allow entrepreneurs 
to register a business remotely. The 
most common online features offered 
include online company name search, 
electronic submission of documents 
and applications, online filing of annual 
accounts and the exchange of data 
between different agencies. In New 
Zealand and Singapore, for example, 
entrepreneurs can complete the entire 
business registration process online. 
Thanks to the interconnectivity be-tween 
different agencies’ systems, 
they can register their business with 
tax and social security authorities at 
the same time as they complete the 
incorporation process. 
Some economies, especially low- and 
middle-income ones, start the digiti-zation 
process by putting just some 
features online—such as conducting 
a company name search, filling out 
and submitting registration forms 
and obtaining an electronic identifica-tion 
number. In Costa Rica, Ecuador, 
Trinidad and Tobago, and Zambia en-trepreneurs 
can check the uniqueness 
and availability of company names 
online. In Kenya business registration 
reforms made it possible to complete 
the value added tax registration online. 
FIGURE 5.1 Company registries in high-income economies offer more electronic 
services 
Share of economies with 
electronic service available (%), 2013 
100 
80 
60 
40 
20 
0 
High income Upper middle income Lower middle income Low income 
Online application Remote registration Electronic access to data 
Source: World Bank Group, Entrepreneurship Database.
STARTING A BUSINESS 49 
To implement an effective online 
registration system, all paper-based 
registration records need to be digitized 
in a single database—and online name 
search, electronic document filing and 
online fee payment functions enabled. 
Streamlining data exchange with other 
government agencies to automate such 
actions as enrollment in tax and social 
security systems can further reduce 
processing times. Effective security 
measures are needed to ensure data 
security. And reliable internet and elec-tricity 
connections are critical to ensure 
that online platforms function properly. 
The most technologically advanced 
registries are concentrated in OECD 
high-income economies and Europe 
and Central Asia. Company registries in 
high-income and upper-middle-income 
economies tend to offer a much broader 
array of online services than those in 
lower-income ones (figure 5.1). This pat-tern 
is not surprising, because develop-ing 
and launching online services can 
be costly. Online platforms are usually 
designed by large international infor-mation 
technology consulting firms 
and can take months to implement. The 
cost can range from as low as $20,000 
to as high as several million dollars, 
depending on the features included.6 In 
Nepal the Ministry of Finance allocated 
32.20 million Nepalese rupees (about 
$447,000) over 3 years to modernize 
the country’s registration office.7 Once 
a system is in place, funds are needed 
to operate it. In Colombia the operating 
costs of the online national business 
registration database RUE, which is 
hosted on 9 different servers, amount to 
$1 million a year.8 
WHAT ARE THE GAINS 
FROM GOING ELECTRONIC? 
Using online services for business regis-tration 
has several advantages. Online 
platforms make the process faster and 
more efficient by eliminating the need 
for entrepreneurs to travel to meet with 
FIGURE 5.2 Online registration makes starting a business faster and cheaper 
35 
30 
25 
20 
15 
10 
5 
government officials, wait in long lines 
and return if some information turns 
out to be missing or incorrect. Analysis 
of data from 71 economies shows 
that business registration for lim-ited 
liability companies is significantly 
faster in those using online platforms 
(figure 5.2). And in most cases online 
registration is either substantially less 
expensive than paper-based processes 
or costs the entrepreneur nothing at all. 
Using online registration services also 
greatly reduces the opportunities for 
corruption and bribery. Where entrepre-neurs 
have no need to interact directly 
with public officials, they are less likely 
to use informal payments or to face 
deliberate delays aimed at encouraging 
bribes. Analysis shows strong positive 
relationships between international 
measures of transparency or gover-nance 
quality—including rankings on 
the rule of law by the World Justice 
Project and rankings on voice and ac-countability, 
control of corruption and 
regulatory quality as measured by the 
Worldwide Governance Indicators—and 
the use of online systems for company 
35 
30 
25 
20 
30 
15 
20 
10 
5 
50 
registration.9 Economies whose com-pany 
registry uses online registration, 
allowing entrepreneurs to set up new 
businesses remotely, tend to score high 
on such measures. 
THREE COUNTRY CASE 
STUDIES 
Three country case studies—on 
Rwanda, Chile and the United 
Kingdom—provide good examples of 
how corporate registries have improved 
efficiency and service quality over time. 
The choice of these countries is based 
on geographic diversity, adoption of 
good practices, consistent pace of 
business registration reform and avail-ability 
of data. 
Rwanda—promoting a 
competitive business 
environment 
The government of Rwanda has been 
working to improve the efficiency 
of business registration as part of 
broader business regulation reforms 
aimed at promoting private sector 
0 
0 
Online registration Paper registration SCALE 
0 
10 
40 
Average cost 
(% of income per capita) 
Average 
time (days) 
Average time Average cost 
Note: The sample consists of 71 economies, with 20 having online registration. Data are for 2013. The relationship is 
significant at the 5% level after controlling for income per capita. 
Source: Doing Business database; World Bank Group, Entrepreneurship Database.
50 DOING BUSINESS 2015 
1.2 
1.0 
0.8 
0.6 
0.4 
0.2 
development—a top priority on its re-form 
agenda. The reforms are driven by 
the conviction that an efficient business 
climate can reduce poverty by fostering 
economic growth and job creation.10 
As part of a series of reforms of the 
start-up process, in 2008 the govern-ment 
established the Office of the 
Registrar General to maintain an ef-ficient 
business register and promote a 
competitive business environment. The 
new entity oversees the implementa-tion 
of applicable commercial laws, 
such as the Companies Act,11 and the 
registration and deregistration of busi-nesses. 
12 By May 2009 it had set up a 
one-stop shop, streamlining company 
name checking, payment of incorpora-tion 
fees, and tax and company regis-tration 
procedures. 
As a result of these reforms com-pany 
registrations surged (figure 5.3). 
In 2009 alone, 3,028 new limited li-ability 
companies were formed—almost 
equivalent to the total for the previous 
5 years, when 3,374 new limited liability 
companies had been registered. Further 
simplification of the start-up process 
followed as a new company law was en-acted 
in 2009. This helped sustain the 
annual increase in the number of new 
limited liability companies, a number 
that reached 6,655 in 2012.13 
Today Rwanda’s Office of the Registrar 
General is focused on making its reg-istration 
system completely paperless 
by promoting electronic registration 
services. Other priorities include en-suring 
accurate and timely delivery 
of information on its services and 
raising awareness of the importance 
of formalizing businesses. Consistent 
with good practices in ensuring trans-parency, 
the Office of the Registrar 
General makes official fee schedules for 
business services easily available to the 
general public at its premises as well as 
on its website.14 
Rwanda has made important strides 
in improving its business environment 
over the past 10 years. Its business 
regulation reforms have resulted in 
cost savings for the private sector 
estimated at $5 million, investments 
totaling $45 million and about 15,000 
jobs.15 In 2006, before these reforms, 
starting a limited liability company in 
Rwanda took 9 procedures, 18 days 
and 235.5% of income per capita in 
fees. Today it takes 8 procedures, 6.5 
days and 52.3% of income per capita. 
Rwanda, a country facing a range 
of other development challenges, 
has shown that improvements in the 
regulatory environment—including the 
adoption of global good practices—are 
well within the reach of low-income 
economies. 
Chile—creating a new online 
registry 
In recent years the government of 
Chile has been trying to reduce the size 
of the country’s informal sector and 
encourage entrepreneurs to formalize 
their businesses. In 2013, as part of 
these efforts, a new Chilean law made 
it possible for entrepreneurs to register 
limited liability companies through an 
electronic, unified company registry 
hosted by the Ministry of Economy 
and accessible from anywhere free of 
charge.16 The new law was part of a 
strategy aimed at continuing to en-hance 
the efficiency of public services 
through the use of the latest tech-nologies, 
moving the country closer to 
e-government and fostering entrepre-neurship 
and competitiveness. It was 
also motivated by the government’s 
desire to make further strides in the 
fight against excessive bureaucracy 
and red tape, a widespread problem in 
Latin America. 
Private sector associations supported 
the new law, but Chilean notaries ini-tially 
opposed it, because it dispensed 
with the requirement for the business 
incorporation services they offered. For 
business owners, however, the new law 
represented an opportunity to save 
time and money and to get access to 
the growing amount of funding that 
the Chilean government was investing 
in business start-ups. 
The electronic registration system— 
called “Your Company in One Day”—is 
FIGURE 5.3 A surge in newly registered firms after start-up reforms in Rwanda 
0 
2004 2005 2006 2007 2008 2009 2010 2011 2012 
Year with reform 
New firm 
density 
Note: New firm density is defined as the number of newly registered limited liability companies per 1,000 working-age 
people (ages 15–64). 
Source: World Bank Group, Entrepreneurship Database.
STARTING A BUSINESS 51 
Share of new companies 
created through online system (%) 
50 
40 
30 
20 
10 
not only a new process of incorporation 
but also a new company registry that 
runs alongside the existing paper-based 
one. It allows users to register 
a company online at no cost. All they 
need to do is to fill out an electronic 
form providing information about the 
company and its shareholders. The 
process takes only a few minutes and 
provides the certificate of existence 
instantaneously. The system also 
automatically assigns a taxpayer 
identification number to the newly reg-istered 
company, a function made pos-sible 
by the interconnectivity with the 
online platform of the tax agency. And 
through a web service, the system per-forms 
automatic identity checks with 
the tax and civil registry authorities. 
The rapid take-up of the online ser-vices 
testifies to the success of Your 
Company in One Day. Only 7 weeks 
after the launch, nearly half of new 
limited liability companies in Chile 
were being created through the new 
online registry (figure 5.4). In the first 
8 months, the government estimates, 
more than 20,000 companies were 
created electronically. The number of 
limited liability companies registered 
through the electronic system in 2013 
(more than 85,000) was more than 
twice the number created in 2009 
(close to 39,000). The ultimate goal 
should be to reach an electronic regis-tration 
rate of nearly 100% (see the U.K. 
case study as an example). 
Chile’s online company registry has 
allowed greater productivity among 
business founders by making the 
incorporation process faster and more 
convenient. And more changes are set 
to come. The online registry is built for 
expansion, and the government plans 
to add new services as well as to allow 
other types of legal entities to incorpo-rate 
electronically. 
The United Kingdom— 
simplifying start-up 
In the United Kingdom interacting 
with the national business registry— 
Companies House—is an imperative for 
starting a business. According to the 
2006 Companies Act and its 1985 pre-decessor, 
all new limited liability com-panies 
must register with Companies 
House to do business. Before the digital 
age this was often a costly and labori-ous 
task. It involved visits to Companies 
House, long lines and the higher costs 
associated with postal mail. Company 
founders often had to hire solicitors to 
handle paperwork such as the articles 
of association. 
But Companies House has greatly 
simplified the process—by introducing 
electronic filing in 2001, increasing the 
transparency of its data and provid-ing 
model articles of association for 
FIGURE 5.4 Chile’s online system was soon registering almost half of new limited 
liability companies 
0 
Week 1 Week 2 Week 3 Week 4 Week 5 Week 6 Week 7 
Note: Data cover the period May 2–June 16, 2013. 
Source: Chile, Ministry of Economy, Register of Companies (Registro de Empresas y Sociedades). 
FIGURE 5.5 Electronic registration has become almost universal in the United 
Kingdom 
4 
3 
2 
1 
0 
Share of new companies 
registered electronically (%) 
1990 1995 2000 2001 2003 2005 2007 2009 2010 2011 2012 2013 2014 
0 
Total number of registered 
companies (millions) 
100 
75 
50 
25 
Share of new companies 
registered electronically 
Total number of registered 
companies 
Note: Data for 2014 are projected. 
Source: U.K. Companies House 2013a.
52 DOING BUSINESS 2015 
companies.17 These changes have made 
incorporation faster, more convenient 
and less expensive. Now entrepre-neurs 
can register their business with 
Companies House in just a few hours 
by simply filing incorporation docu-ments. 
All the incorporation forms are 
available at no cost on the Companies 
House website and come with detailed 
instructions. Registration can be done 
online or at the Companies House office, 
where computers are available to enable 
entrepreneurs to register electronically. 
Entrepreneurs are making good use of 
the electronic filing option. The share 
of new companies registered electroni-cally 
grew sharply in the first few years, 
rising from around 25% in 2001 to 95% 
in 2009 (figure 5.5). Indeed, electronic 
filing has become virtually universal, 
with more than 98% of new companies 
registered electronically in 2013.18 
Besides offering online registration, 
Companies House has also simpli-fied 
the preregistration process. One 
important step was to increase the 
transparency of registry data, mak-ing 
initial business start-up research 
easier. Companies House made basic 
information on existing companies 
available at no charge in 1996, allowing 
business founders to easily conduct 
name searches both online and in its 
office. Today Companies House pro-cesses 
235 million free basic company 
information searches online or through 
its mobile application every year. 
Beginning in 2012, Companies House 
expanded its company information to 
include company number, address, sta-tus, 
incorporation date, accounts and 
filing dates for annual returns. There 
were almost 15,000 unique downloads 
of this company information data set 
in 2013.19 Over the past decade, as 
Companies House has increased its data 
transparency, electronic procedures and 
free resources for business founders, the 
number of registered companies in the 
United Kingdom has doubled. 
CONCLUSION 
Many economies have modernized their 
company registries, offering a wide 
array of online services for a lower fee 
or at no cost at all. But many others 
lag behind. For low-income economies, 
introducing online platforms may not 
be an affordable or practical solution, 
especially if electricity shortages are 
common. But other steps can be taken 
to increase the efficiency of business 
registration. For example, economies 
could create physical one-stop shops— 
or improve existing ones—to streamline 
incorporation processes and coordi-nate 
the work of different agencies. 
Improving the efficiency and transpar-ency 
of company registries can not only 
make incorporation faster and cheaper; 
it can also reduce the opportunities for 
corruption and bribery associated with 
business start-up processes. 
Two important (and related) observa-tions 
emerge from this comprehensive 
overview of the Doing Business data on 
business start-up. First, a low level of 
income need not be an insurmount-able 
obstacle to implementing reforms 
that reduce the complexity and cost of 
regulatory processes and improve the 
quality of the underlying institutions. 
And second, as the latest informa-tion 
and communication technologies 
spread around the world, low-income 
economies will find a broader range 
of opportunities to adopt good prac-tices 
used in higher-income economies, 
further contributing to the process 
of convergence seen in the Doing 
Business indicators. A growing number 
of economies with difficult business 
environments are gradually adopting 
the practices seen in those with more 
business-friendly climates. 
NOTES 
This case study was written by Baria Nabil 
Daye, Paula García Serna, Julie Ryan and 
Valentina Saltane. 
1. Fritsch and Noseleit 2013. 
2. Motta, Oviedo and Santini 2010; Klapper 
and Love 2011. 
3. While in some economies the registry is 
the first and only interface for formally 
commencing business operations, in other 
economies the start-up process involves 
other government agencies as a result of 
more burdensome regulations. 
4. See, for example, the website of the 
Companies Office of Jamaica at http:// 
www.orcjamaica.com/profile/ and that of 
the Companies Registry of Hong Kong at 
http://www.cr.gov.hk/en/home/. 
5. De Sa 2005. 
6. Wille and others 2011. 
7. “IFC Helps Nepal Simplify Business 
Registration,” World Bank Group, https:// 
www.wbginvestmentclimate.org 
/advisory-services/regulatory-simplification 
/business-regulation/business-entry 
/nepal-business-registration.cfm. 
8. World Bank Group, Investment Climate 
Advisory Services 2009. 
9. The relationship is significant at the 5% level 
after controlling for income per capita. 
10. “Rwanda’s Vision 2020: Improving the 
Investment Climate for Private Sector 
Development,” World Bank Group, http:// 
go.worldbank.org/2U51FR33M0. 
11. Rwandan Law 07/2009 relating to 
companies, April 27, 2009. 
12. Information from the website of the 
Rwandan Office of the Registrar General at 
http://org.rdb.rw/. 
13. World Bank Group, Entrepreneurship 
Database. 
14. Information from the website of the 
Rwandan Office of the Registrar General at 
http://org.rdb.rw/. 
15. World Bank Group, Investment Climate 
Advisory Services 2013. 
16. Simplifica el régimen de constitución, 
modificación y disolución de las sociedades 
comerciales, Chilean Law 20.659, January 
22, 2013. 
17. Moss 2014. 
18. U.K. Companies House 2013b. 
19. U.K. Companies House 2013a.
Doing Business 2015 
Going Beyond Efficiency 
Zoning and urban planning 
Understanding the benefits 
Sound regulation of construction 
helps strengthen property rights, 
protects the public from faulty 
building practices and contributes to 
the process of capital formation.1 But 
if procedures are too complicated or 
costly, builders tend to proceed without 
a permit.2 By some estimates 60–80% 
of building projects in developing econo-mies 
are undertaken without the proper 
permits and approvals.3 
For many entrepreneurs, construction 
regulation is an important consideration 
when deciding where to establish their 
business. According to a competitive-ness 
report by KPMG, construction 
costs are the 5th most important factor 
determining the location of a start-up 
in the United States and the permitting 
process is the 17th most important.4 
One element of construction regulation 
is zoning, which regulates the location 
and use of certain types of buildings 
within a city. 
HOW DOES ZONING RELATE 
TO CONSTRUCTION 
PERMITTING? 
Zoning is an essential tool in successful 
urban planning. Maps divide com-munities 
into different zones based 
on the types of uses allowed—such 
as residential, commercial, industrial, 
public buildings, parks and green areas. 
In most economies with zoning plans, 
each zone has its own ordinance gov-erning 
development within that sec-tion. 
These ordinances determine such 
factors as building size, height, shape 
and color; building location; and urban 
densities.5 
Zoning regulations can provide a useful 
framework for investors and develop-ers 
by specifying the most appropriate 
location for their projects before they 
apply for a construction permit (figure 
6.1). They can also help municipal 
authorities establish a consistent 
and predictable basis for granting 
construction permits and approving 
or rejecting construction proposals. 
Having an up-to-date zoning system is 
therefore essential not only in support-ing 
the coordination among agencies 
that is needed for prosperous urban 
planning but also in ensuring efficiency 
in granting construction permits. Also 
important is that such zoning systems 
be developed through a consultative 
process with broad participation, to 
ensure that they benefit all social 
groups. 
HOW CAN ZONING AFFECT 
ECONOMIC DEVELOPMENT? 
Through zoning, governments can 
ensure the proper use of land and 
avoid mixing incompatible land uses. 
Zoning has been used as a regulatory 
tool to respond to changing environ-mental 
and development conditions 
as well, including flooding, rising sea 
levels and the loss of infrastructure.6 
Zoning regulations that take into ac-count 
environmental threats such as 
flooding protect citizens by ensuring 
ƒ Zoning—the process of planning 
for land use across geographic 
areas—can help avoid the mixing 
of incompatible land uses. This has 
both environmental and economic 
benefits. 
ƒ Zoning practices vary widely 
around the world. Economies with 
an efficient and effective zoning 
process make zoning maps of 
cities accessible to builders. Others 
limit access to the building permit 
authority, which checks the zoning 
compliance of permit applications. 
Still others have no zoning system 
at all. 
ƒ Among OECD high-income 
economies the process for obtaining 
a building permit, as measured 
by Doing Business, takes 19 fewer 
days on average in those where the 
process includes zoning procedures 
than in those where it does not. 
ƒ In New Zealand all municipalities 
have a detailed, up-to-date zoning 
plan that has been approved through 
a process with intensive public 
involvement—including public 
hearings to allow residents to offer 
suggestions or objections. 
ƒ Guatemala, a recent success story, 
introduced a land management plan 
in its capital city in January 2009. 
A new zoning system established 
zones based on the general use of 
land, including mixed-use zones.
54 DOING BUSINESS 2015 
that future development keeps them 
and their possessions out of harm’s 
way. More generally, zoning plans can 
promote the conservation of energy 
and natural resources, foster a greener 
environment, improve sustainability 
and enhance the ability to adapt to 
climate change. 
A good zoning plan can help reduce 
greenhouse gas emissions by cutting 
down on vehicle travel—such as by 
promoting higher-density development 
and concentrating residential develop-ment 
near job centers. A zoning plan 
can also help reduce greenhouse gas 
emissions by promoting an adequate 
and accessible public transportation 
system.7 By ensuring that certain 
municipalities include new areas for 
housing development and new indus-tries, 
zoning plans can help address 
the challenges associated with demo-graphic 
change and shifts in business 
activity. In addition, municipal zoning 
can protect and improve the health of 
citizens by removing or minimizing pol-lution 
from industrial plants and con-tamination 
from landfills and sewage. 
Zoning can help ensure an adequate 
supply of safe water and the suitable 
disposal of waste. And it can enhance 
property values—by reducing pollu-tion, 
providing suitable light, avoiding 
overcrowding and traffic congestion, 
developing green zones and offering 
proximity to schools, hospitals and 
other public necessities.8 
But where a zoning process is too 
complex or restrictive, it can have an 
adverse effect on factors such as hous-ing 
supply and prices. Consider the ex-ample 
of Sweden, where zoning policies 
mandate that municipalities must ap-prove 
a detailed development plan for 
most housing projects before issuing a 
construction permit. According to the 
Stockholm Planning Department and 
an OECD study, more than half of all 
construction projects—including most 
apartment buildings—involve designing 
or modifying a detailed development 
plan.9 This can take 18 months on av-erage, 
according to estimates from the 
municipality of Stockholm, and in 20% 
of cases it can take 3–4 years.10 Many 
researchers agree that administrative 
FIGURE 6.1 Where does zoning generally fit into the construction permitting process? 
Builder decides on type of construction project. 
Builder obtains zoning approval (recorded by Doing Business as a 
separate procedure only if builder is required to obtain 
approval directly from the relevant agency). 
Builder prepares the necessary drawings and other required documentation. 
Builder applies for the necessary preapprovals for the project (if required), 
such as land use approval, environmental approval and fire safety approval 
(including any necessary inspections). 
Builder applies for and obtains a building permit. 
Builder begins construction and receives either random or phased inspections 
during construction by the relevant parties. 
Builder completes construction and receives final inspection from the relevant 
parties to ensure that the construction was completed in compliance with 
building regulations and the conditions set forth in the building permit. 
Builder receives a completion certificate or occupancy permit, ensuring that 
the building is ready to be occupied. 
Builder applies for and obtains the final water and sewerage connection from 
the water and sewerage authorities. 
In some 
instances builder 
must apply for a 
zoning certificate or 
zoning approval for 
the intended location 
of the project. 
The relevant authority consults 
the zoning maps of the city to 
determine whether the project 
will be built in an appropriate 
location, based on its 
specifications. In some 
instances builder may consult 
the zoning maps while the 
relevant authority simply does a 
verification check when 
reviewing the permit 
application. 
Source: Doing Business database.
ZONING AND URBAN PLANNING 55 
barriers to new construction are one 
of the 2 main factors (the other being 
rent control policies) that have led to a 
housing shortage in Sweden over the 
past decade.11 
WHAT ARE SOME GOOD 
PRACTICES IN ZONING? 
Recognizing the importance of zoning 
and urban planning, many economies 
require builders to obtain some form 
of zoning or urban planning approval 
before building or even before obtaining 
a construction permit. This is done to 
ensure that the intended building will 
be located in the appropriate zone 
(industrial, commercial or residential) 
according to the city’s zoning require-ments. 
But economies go about this 
process in different ways. 
Some economies complete the process 
efficiently and effectively by mak-ing 
zoning maps of cities accessible 
to builders (in some cases online). In 
these cases builders access the maps 
to verify that their project’s intended 
location is in compliance with zoning 
regulations, and they can include this 
information with the building permit 
application. In Swaziland, for example, 
builders are responsible for checking 
the zoning maps and including the zon-ing 
information when submitting their 
permit application to the municipality. 
In the United States builders in New 
York City must complete a zoning 
diagram form available online and sub-mit 
it along with other required forms 
to the Department of Buildings. The 
Department of Buildings will still review 
the form to check that the project 
complies with the city’s zoning policies. 
In other economies the permit-issuing 
authority checks the zoning compli-ance 
itself after receiving the building 
permit application. In The Bahamas, 
for example, a builder is required only 
to submit a permit application to the 
Building Control Unit. This unit then 
automatically forwards the applica-tion 
to the Town Planning Department 
for zoning approval, with no involve-ment 
from the builder. In Belize the 
Building Plan Committee of the Central 
Building Authority checks the permit 
application to ensure compliance with 
zoning, environmental and fire safety 
requirements. 
Neither of these processes requires 
the builder to take the extra step of 
actually obtaining a zoning approval 
before applying for a building permit— 
a good-practice scenario if completed 
efficiently without significant delays. 
But efficiency is not all that is impor-tant. 
Around the world, good zoning 
systems also need to be broadly 
inclusive, incorporating all groups in 
society to bring about positive social 
outcomes. They also need to be regu-larly 
updated to reflect changing needs 
and developments. 
Sixty-five of the 189 economies cov-ered 
by Doing Business do require that 
builders go through the additional 
step of getting urban planning ap-proval 
before obtaining a construction 
permit. Of those 65, the largest shares 
are in Europe and Central Asia (26%) 
and Latin America and the Caribbean 
(22%) (figure 6.2). This is a second-best 
scenario: a zoning system is still in 
place and zoning compliance is still 
verified, though not in the most ef-ficient 
way. Nevertheless, requiring 
verification of zoning compliance is 
better than having no zoning system at 
all—with builders able to construct any 
type of project in any part of the city. 
Thirty-six of the 65 economies require 
builders to obtain approval to build in 
their intended location before they can 
receive a construction permit (table 
6.1). Twenty-two of these 36 economies 
require a zoning permit as this form of 
approval. A zoning permit or zoning 
clearance signifies that the land use for 
the planned development is consistent 
with the zoning regulations. In Canada 
the building code requires a builder to 
obtain a zoning permit before even 
applying for a site plan approval and 
the technical review of a development 
application. Among the 22 economies 
requiring a zoning permit, some issue it 
more expeditiously than others. In the 
Philippines it takes 5 days on average 
to obtain the site clearance from the 
City Planning and Development Office 
that a builder must have to apply for 
a construction permit. In Bangladesh 
obtaining a zoning clearance from 
the Capital Development Authority 
(Rajuk) in Dhaka takes 45 days on 
FIGURE 6.2 Half the economies that require the additional step of obtaining a zoning 
or urban planning approval are in Europe and Central Asia or Latin America 
Latin America  Caribbean 
(14 of 32 economies) 
Middle East  North Africa 
(7 of 20 economies) 
12% 
OECD high income 
(9 of 31 economies) 
East Asia  Pacific 
(8 of 25 economies) 
Sub-Saharan Africa 
(8 of 47 economies) 
South Asia 
(2 of 8 economies) 
Europe  Central Asia 
(17 of 26 economies) 
26% 
22% 
14% 
12% 
11% 
3% 
Note: The numbers in parentheses are the number of economies out of the total in each region that require the 
additional step of obtaining a zoning or urban planning approval. 
Source: Doing Business database.
56 DOING BUSINESS 2015 
average, while obtaining one from the 
Chittagong Development Authority 
takes 40 days on average. 
In other economies the process is 
entirely different. In Belgium, for ex-ample, 
an urban planning certificate is 
required only for large-scale projects. 
This certificate not only verifies that 
the project can be built in the specified 
zone but also guarantees that the con-struction 
permit will be issued without 
problems—because much of the verifi-cation 
for the permit is done as part of 
the process for issuing the certificate. 
For smaller-scale projects all plan-ning 
regulations are available online. 
These regulations are set at several 
levels—regional, municipal or special 
zoning—providing several options for 
verifying the regulatory compliance of 
the project. 
In 29 of the 65 economies there is no 
legal requirement to obtain an urban 
planning clearance or certificate. 
But architects normally request a 
certificate because it provides all the 
information needed to ensure that 
architectural plans are in compliance 
with building regulations. In some 
economies the information is available 
online, but in most the information can 
be obtained upon request. 
IS PERMITTING MORE 
EFFICIENT WITH ZONING? 
While obtaining a zoning or urban plan-ning 
clearance represents an additional 
step in the construction permitting 
process, this does not necessarily mean 
that economies that require this step 
have inefficient permitting systems. 
Consider OECD high-income econo-mies. 
As measured by Doing Business, 
the process for obtaining approval 
of a building permit takes 43 days 
on average in those where it includes 
zoning procedures, 62 days in those 
where it does not. Obtaining a zoning 
or urban planning clearance actually 
speeds up the process—by 19 days on 
average in these OECD high-income 
economies—especially where the builder 
can obtain the clearance directly on-line. 
The reason is that this step avoids 
back-and-forth interactions between 
the permit-issuing agency and the 
architect or even outright rejection of 
the project because of noncompliance. 
On average across all 65 economies 
that require the additional step, ob-taining 
the zoning or urban planning 
clearance takes 26 days (of a total of 
177 days on average to comply with 
all formalities to build a warehouse) 
and costs $402 (of a total of $15,709). 
These economies generally require only 
TABLE 6.1 What type of clearance is needed in economies with zoning 
requirements? 
Zoning permit is mandatory 
Urban planning clearance or 
certificate is mandatory 
Urban planning clearance or 
certificate is generally obtained 
but not mandatory 
Afghanistan Albania Algeria 
Argentina Bosnia and Herzegovina Antigua and Barbuda 
Australia Côte d’Ivoire Bahamas, The 
Bangladesh Ecuador Bahrain 
Bolivia Iran, Islamic Rep. Cameroon 
Canada Kosovo Cyprus 
Comoros Lebanon Finland 
Costa Rica Macedonia, FYR France 
Czech Republic Madagascar Kazakhstan 
Dominican Republic Moldova Latvia 
El Salvador Nicaragua Lithuania 
Fiji Serbia Montenegro 
Indonesia South Africa Morocco 
Kuwait Spain Netherlands 
Mexico New Zealand 
Namibia Palau 
Philippines Papua New Guinea 
Puerto Rico (U.S.) Qatar 
Solomon Islands Romania 
United States Russian Federation 
Uruguay Senegal 
Venezuela, RB Singapore 
Sudan 
Tajikistan 
Trinidad and Tobago 
Turkey 
Ukraine 
Uzbekistan 
Vanuatu 
Note: A zoning permit signifies that the land use for the planned development is consistent with the zoning regulations. 
An urban planning clearance or certificate generally outlines conditions relating to the plot of land where the builder 
intends to build, including where construction is permitted on the plot (that is, the specific coordinates). 
Source: Doing Business database.
ZONING AND URBAN PLANNING 57 
one procedure to obtain the zoning cer-tificate 
or clearance. Very few require a 
site inspection as part of this process, 
but in those that do, the overall permit-ting 
system tends to be less efficient. In 
Indonesia, for example, a builder must 
first request a city planning permit and 
building site plan—in Jakarta, from the 
zoning office, and in Surabaya, from the 
one-stop shop—then receive an on-site 
inspection and finally receive the city 
planning permit. This process takes 
22 days on average in Jakarta (where 
the entire construction permitting 
process takes 202 days) and 23 days 
in Surabaya (where the entire process 
takes 243 days). By contrast, Namibia 
requires only one zoning procedure: the 
builder must consult with the Town 
Planning Department to ensure that 
the land is in the correct zoning area. 
Zoning approvals are issued on the 
spot and at no cost. 
Overall, zoning requirements can lead 
to more efficient and less costly con-struction 
permitting systems. They 
can help guarantee compliance with 
zoning regulations even before the 
permit-issuing agency receives the 
building permit application. This allows 
architects and engineers to finalize the 
building specifications with the knowl-edge 
that there will be no need to ad-just 
them later in the process because 
of possible zoning issues. 
TWO EXAMPLES OF GOOD 
PRACTICE 
New Zealand and Guatemala both 
provide examples of well-implemented 
zoning systems. In New Zealand all mu-nicipalities 
have a detailed, up-to-date 
zoning plan that has been approved 
through a participatory process and 
supports an efficient construction 
permitting system. And in Guatemala 
planning authorities in the capital 
city recently switched to a mixed-use 
land planning system and digitized 
the zoning maps—all in the span of 
just 5 years. Construction activity has 
increased substantially under the new 
zoning system in Guatemala City. 
New Zealand—an efficient and 
predictable process 
New Zealand illustrates the use of mu-nicipal 
planning and zoning as a tool to 
facilitate the construction permitting 
process. Its planning and zoning regula-tions 
are among the world’s most effi-cient. 
They are comprehensive, predict-able 
and streamlined in implementation. 
New Zealand uses 2 main types of plan-ning 
documents: regional plans and 
district plans. Regional plans specify 
general requirements, such as air and 
water quality and the use of coastal 
areas. District plans are detailed plan-ning 
guidelines that outline the specific 
land use and design requirements for 
builders. 
The district plans are legally bind-ing, 
cover the entire usable land in a 
municipality and are periodically re-viewed 
to ensure that they reflect the 
changing urban needs. Each district 
plan is approved through a participato-ry 
process in which the district council 
holds public hearings to allow residents 
to submit suggestions or objections. 
Once the residents’ comments have 
been processed, the plan becomes 
“operative”—as a statutory document 
that regulates land development ac-tivities 
for the entire municipality. 
This means that all municipalities in 
New Zealand have a detailed, up-to-date 
zoning plan in place that has been 
approved through meaningful public 
involvement. The plan provides inves-tors 
and developers with a reliable ref-erence 
to guide them in the design and 
conceptual stage of a project, before 
they apply for a construction permit. 
And it provides municipal authorities 
with a consistent basis for approving 
or rejecting construction permits, with 
little discretion involved (figure 6.3). 
FIGURE 6.3 New Zealand’s district plans support an efficient, predictable process for 
construction permitting 
The district plan specifies 6 
categories of construction 
projects—ranging from 
permitted to prohibited. 
A project not in the permitted 
category requires a resource 
consent, an official approval 
verifying compliance with the 
resource use requirements of 
the district plan. 
Apply for a 
construction 
permit 
No 
Apply for a 
resource 
consent 
Provide an 
assessment of 
environmental 
effects 
Provide a written 
consent from the 
affected parties 
Undergo 
public 
hearings 
No 
Notify directly 
affected parties and 
obtain the resource 
consent 
Yes 
Yes 
Is the 
land plot in a 
permitted 
zone? 
Is the 
project 
complex? 
Source: “An Everyday Guide to the Resource Manangement Act Series 1.1: Getting in on the Act,” New Zealand, Ministry 
of Environment, http://www.mfe.govt.nz/publications/rma/everyday/overview/.
58 DOING BUSINESS 2015 
Municipalities face official time limits 
for making a decision—20 working 
days for simple cases and 4 months 
for more complex cases that involve 
public hearings. According to Doing 
Business data, most complex cases are 
processed in 100 days. 
There are 3 main factors behind the 
efficient processing of construction 
permits in New Zealand in cases where 
a change in zoning is necessary. First, 
there are clearly defined steps for mod-ifying 
a zoning plan (that is, obtaining 
a resource consent), requiring differ-ent 
levels of review depending on the 
complexity of the project. A resource 
consent is not required if the proposed 
construction is already in a permit-ted 
zone. Second, there are objective 
criteria for municipalities to use in 
making a decision to approve or reject 
a construction proposal—an assess-ment 
of environmental effects and a 
written consent from affected parties. 
And third, there are official time limits 
for completing each procedure related 
to obtaining a resource consent (zoning 
modification) or construction permit.12 
Guatemala—a recent success 
story 
Until 5 years ago Guatemala’s capital 
city had a weak zoning system with no 
digital zoning maps. In January 2009, 
however, the Municipality of Guatemala 
City adopted a new land management 
plan that established land use classifi-cations 
based on 10 objectives: 
ƒ Encourage access to housing and 
diversify its supply 
ƒ Promote high-density construction 
where there is an adequate trans-port 
network 
ƒ Limit construction in high-risk areas 
and protect natural and historically 
significant areas 
ƒ Ensure public participation in local 
land use planning 
ƒ Ensure compatibility in the use of 
buildings in close proximity 
ƒ Encourage mixed land use 
ƒ Create public spaces with high 
urban vitality 
ƒ Promote an interconnected road 
network 
ƒ Provide certainty to owners and 
investors, including by promoting 
the desired urban development 
practices through incentives 
ƒ Secure the necessary resources for 
municipal investment 
While the old system had divided the 
land into industrial, residential and com-mercial 
zones, the new one established 
zones according to the general use of 
land, a change that included introducing 
mixed-use zones. The city was divided 
into 6 main zones that range from rural 
to more urban (table 6.2). 
The municipality developed the new 
plan in consultation with both the 
private and public sector and widely 
publicized it. The zoning maps have 
been digitized over the past 5 years, 
and the process is now complete for 
the entire city. Builders can access the 
maps through an online link to verify 
that a planned building is in compliance 
with the city’s zoning system before 
applying for a building permit.13 
The new zoning system has shown 
positive results, including a substantial 
increase in construction activity, a 
welcome development given pervasive 
shortages. The square meters of con-struction 
authorized by Guatemala 
City’s one-stop shop for construction 
permitting almost doubled in the first 
few years, rising from 1.1 million in 2009 
to 2.08 million in 2013.14 And the munici-pality 
expects to authorize 2.2 million 
square meters by the end of 2014. 
But implementing the system was not 
without its challenges. Some citizens 
felt that the government was regulat-ing 
what they could do with their own 
land. And many objected to the notion 
of mixed land use, fearing an increase in 
negative externalities such as noise and 
traffic in residential areas. In introducing 
TABLE 6.2 Zoning classifications in Guatemala City’s new land management plan 
Zone 
Share of 
total land in 
Guatemala City (%) Primary use of zone 
Share of buildings 
in zone that can be 
residential (%) 
G0—natural 18 Natural reserve areas where residential 
buildings are not allowed for 
environmental reasons and because of 
high risk levels 
0 
G1—rural 20 Areas that are still rural or agricultural 
with an intermediate level of risk, where 
low-density residential buildings are 
allowed though preservation of the 
environment is a priority 
75 
G2—semiurban 9 Areas where low-density buildings in 
closer proximity are allowed but because 
of location or topography, preservation of 
the environment is a priority 
75 
G3—urban 37 Areas that comprise most of the city’s 
currently urbanized area, including a 
medium density of single-family and 
multi-family dwellings 
50 
G4—central 13 Areas with a high density of mid-rise 
buildings, where most of the land has 
been developed and open spaces have 
been converted into public parks 
35 
G5—núcleo (core) 3 Areas with a high density of high-rise 
buildings and towers, where most of the 
land has been developed and open spaces 
have been converted into public parks 
25 
Source: “Plan de Ordenamiento Territorial,” Municipality of Guatemala City, http://pot.muniguate.com/docts 
_soporte/07_procedimientos_pot.php.
ZONING AND URBAN PLANNING 59 
mixed land use, however, the municipal-ity 
was seeking to address both traffic 
issues, by reducing the need for long 
commutes, and security concerns, by 
ensuring that all neighborhoods would 
have activity throughout the day. 
CONCLUSION 
Without properly implemented zoning 
systems, urban planning becomes dif-ficult, 
as does ensuring the proper uses 
of land and mitigating environmental 
concerns. Recognizing the importance 
of zoning and urban planning, many 
economies have adopted zoning 
systems to varying extents. These 
economies require builders to obtain 
some form of zoning or urban planning 
approval before building or even before 
obtaining a construction permit. These 
requirements can lead to more efficient 
and less costly construction permitting 
systems. 
NOTES 
This case study was written by Marie Lily Delion, 
Anushavan Hambardzumyan, Joyce Ibrahim, Ana 
Maria Santillana Farakos and Melissa Scanlan. 
1. World Bank Group, Investment Climate 
Department 2013. 
2. Moullier 2009. 
3. De Soto 2000. 
4. KPMG 2009. 
5. Grannis 2011; Neumann 2014. 
6. Grannis 2011. 
7. Schaffner and Waxman 2009. 
8. Crone 1982; Karkkainen 1994. 
9. In-depth interview with an expert in the 
Stockholm Planning Department conducted 
by the Doing Business team on December 5, 
2013; Hüfner and Lundsgaard 2007. 
10. “Planprocessen,” City of Stockholm, http:// 
www.stockholm.se/TrafikStadsplanering 
/Stadsutveckling/Stadsplanering 
/Planprocessen/. 
11. Swedish National Board of Housing, Building 
and Planning 2013. 
12. For more information on New Zealand’s 
zoning system, see the chapter on urban 
planning and construction permitting in 
World Bank (2014b). 
13. Zoning maps are available on the website 
of the Municipality of Guatemala City at 
http://vu.muniguate.com 
/index.php?id=14opc=10. 
14. Statistics provided by the Municipality of 
Guatemala City.
Doing Business 2015 
Going Beyond Efficiency 
Registering property 
Measuring the quality of land administration systems 
Insecure title to land prevents people 
from taking full advantage of the 
productive uses of the land.1 Where 
people have proper title to their land, 
however, they can use the property as 
collateral for a loan or transfer land par-cels 
in which they have invested.2 And 
titles can serve as a valuable insurance 
and savings tool for families, providing 
protection during difficult times and in 
retirement. Indeed, with the protection 
of secure title guaranteed by a reliable 
land registration system, land can be 
used to create wealth for the broader 
benefit of society and contribute to 
the eradication of poverty. Because 
land and buildings account for between 
half and three-quarters of the wealth 
in most economies, having a reliable 
system for registering and transferring 
property titles matters.3 
Doing Business, through its registering 
property indicators, measures the 
efficiency of property registration 
systems through the time, cost and 
number of procedures required to 
transfer a commercial property. These 
indicators do not provide information 
on the overall quality of land admin-istration 
systems. This year, for the 
first time, Doing Business has collected 
preliminary data in 170 economies 
on the reliability, transparency and 
coverage of land registration systems 
and on land dispute resolution (figure 
7.1). Next year Doing Business will refine 
the newly collected data and intends 
to add a new indicator on the quality 
of land administration to its current 
set of registering property indicators. 
ƒ This year Doing Business has 
collected new data in 170 economies 
on the overall quality of land 
administration systems through 
a set of indicators on reliability, 
transparency, coverage and dispute 
resolution. 
ƒ Half of economies around the world 
use an electronic database for 
checking for charges on property 
(encumbrances)—and half have a 
geographic information system for 
recording maps. 
ƒ In 72% of economies the land registry 
makes fee schedules publicly 
available, either online or on public 
display boards. 
ƒ Only 56 economies make statistics 
about transactions at the land 
registry publicly available, and only 
63 provide specific means for filing 
an official complaint about land 
services. 
ƒ Around the world, 27% of economies 
have a registry with full coverage 
of private land, and 34% a mapping 
system with complete coverage. 
ƒ A reliable, transparent, complete 
and secure land registration system 
is associated with greater access to 
credit, lower income inequality and 
a lower incidence of bribery at the 
land registry. 
FIGURE 7.1 What do the data on the quality of land administration systems cover? 
Reliability 
Data on reliability assess whether the land registry and mapping system 
(cadastre) have adequate infrastructure to guarantee high standards and 
reduce the risk of errors. Reliable land administration systems can provide 
up-to-date information that is sufficient to make meaningful inferences on 
ownership. 
Data on transparency record whether the land administration system makes 
land-related information publicly available. This can inform the public about 
transaction possibilities and foster the development of a unified and more 
efficient land market. 
Data on coverage assess the extent to which the land registry and mapping 
system (cadastre) provide complete geographic coverage of privately held 
land parcels. To be accessible to third parties, and thus enforceable to 
anyone, all transactions need to be publicly verified and authenticated at 
the registry. 
Data on dispute resolution measure the accessibility of conflict resolution 
mechanisms and the extent of liability for entities or agents recording land 
transactions. Unclear responsibilities in land transactions lead to more land 
disputes, diverting land from productive uses. Clear responsibilities can help 
keep the number of unresolved disputes low. 
Transparency 
Coverage 
Dispute 
resolution
REGISTERING PROPERTY 61 
HOW TO PROVIDE 
RELIABLE INFORMATION? 
A reliable land administration system 
provides clear information on the 
ownership of property, supports the 
security of tenure and facilitates the 
development of a land market (figure 
7.2). It also inhibits fraudulent actions, 
such as using false documents to 
conduct land transactions or selling 
properties multiple times without the 
knowledge of the true owners. One key 
to fulfilling these functions is to have 
in place the infrastructure needed to 
maintain land information, supported 
by an appropriate institutional frame-work 
and adequate capacity. Doing 
Business has developed a series of 
questions to assess the quality of the 
infrastructure of land administration 
systems. These questions focus mainly 
on how land records are stored at the 
land registry, whether the informa-tion 
is kept in an electronic database, 
whether the databases for landowner-ship 
and maps are linked and whether 
each parcel has a unique, searchable 
identification number. 
In many economies property titles are 
registered manually and most titles 
remain stored in paper archives with 
restricted access. In 62 economies 
property titles are kept only in paper 
format. Relying on a paper-based 
FIGURE 7.2 What does land administration cover? 
Land administration 
Land registration system 
system increases the time required to 
conduct a title search and the oppor-tunities 
for fraud.4 It also increases the 
vulnerability of the records to political 
instability, poor climate conditions, 
natural disasters or such incidents as 
the Great Chicago Fire of 1871, which 
destroyed almost all the city’s real es-tate 
records. More recently, in Kosovo 
the entire cadastral system had to be 
reconstructed after years of armed 
conflict led to the loss or destruction of 
the system’s records.5 In Pakistan the 
floods of 2010 destroyed thousands 
of paper land records, leading to the 
loss of the only evidence that people 
had of their land tenure.6 There was no 
backup. 
Computerization can provide a backup 
system to protect information. It can 
also make cross-checking data easier 
Surveying and mapping system 
for the public agencies that deal with 
land issues as well as for the general 
public. Many economies are moving 
toward computerized land administra-tion 
systems. Over the past 6 years 
51 economies computerized their land 
registries. Mozambique, where a flood 
affected land records in 2000, scanned 
most of its titles in 2013. Mauritius 
implemented a new electronic system 
that allows the automatic population 
of property registration information 
dating back to 1978 and enables differ-ent 
branches of the Registrar General 
Department to share information. 
Other economies scanned all their 
historical records. 
Digital records also make it easier to 
access key information on the legal 
status of properties. An electronic da-tabase 
for encumbrances can quickly 
show whether there is a mortgage or 
other charges on a property or any 
other limitations that would impede its 
sale to a third party. According to Doing 
Business research, half of economies 
around the world have an electronic 
database for rights and encumbrances 
(figure 7.3). 
Cadastral maps play an important 
part in increasing tenure security—by 
providing information about the 
physical characteristics of land, the 
boundaries of parcels and any changes 
in those boundaries. They can also 
help ensure a stable source of public 
revenue by supporting more complete 
A land registry records the ownership and 
other legal rights over land. The function 
of land registration is to provide a safe 
and certain foundation for the acquisition, 
enjoyment and disposal of rights in land. 
A property map index (cadastre) provides 
descriptions of land parcels in a specific 
jurisdiction based on land surveys. It 
typically includes information about the 
location, owner and zoning use of parcels. 
It can be used for land taxation purposes. 
FIGURE 7.3 Half of economies have an electronic database for encumbrances—and 
half have a geographic information system 
Share of economies with an electronic 
database for encumbrances (%) 
Share of economies with a geographic 
information system (%) 
High 
income 
Upper middle 
income 
Lower middle 
income 
Low 
income 
90 
80 
70 
60 
50 
40 
30 
20 
10 
0 
High 
income 
Upper middle 
income 
Lower middle 
income 
Low 
income 
90 
80 
70 
60 
50 
40 
30 
20 
10 
0 
Source: Doing Business database.
62 DOING BUSINESS 2015 
coverage of property taxes.7 A case in 
point was the Maputo Structure Plan 
in Mozambique—an initiative to col-lect 
geographic data that was aimed 
at aiding the physical development 
of the capital but that also has the 
potential to help further improve the 
collection of property taxes.8 Today, 
half of economies around the world 
have a geographic information system 
in place—a computerized system 
that can capture, store and analyze 
geographic data. While most are high-income 
economies, some are low- and 
middle-income economies. In Sub- 
Saharan Africa, for example, South 
Africa and Swaziland both have an 
electronic database to record property 
boundaries, check maps and provide 
updated geographic information on 
land parcels. 
Linking the land registry with the 
cadastral system has important 
advantages. It helps in maintaining 
up-to-date records on the legal rights 
to properties and the spatial charac-teristics 
of land plots, thus increasing 
tenure security. And it provides a single 
point of contact for those conducting 
land transactions.9 In recent years 
several economies, mostly in Europe 
and Central Asia, have merged their 
land registries and cadastral systems. 
For example, the Russian Federation 
created a unified electronic land and 
property registry in 2013 by merging 
the state registry of immovable prop-erty 
and the state topographical and 
cadastral mapping system. 
Having all agencies use a single iden-tification 
number for property is also 
beneficial. It allows quick identification 
of the legal status of a parcel, provid-ing 
greater certainty for the parties 
engaged in a transfer of property and 
reducing the likelihood of mistakes. 
A majority of economies use a single 
identification number, with the highest 
shares doing so in Europe and Central 
Asia, the OECD high-income group and 
the Middle East and North Africa. 
HOW DOES TRANSPARENCY 
SUPPORT QUALITY? 
Transparency is a key element in the 
quality of land administration systems. 
It helps eliminate asymmetries in in-formation 
between users and officials 
in a land administration system and 
increases the efficiency of the land 
market.10 Doing Business has collected 
data about transparency through a set 
of questions focusing on who has ac-cess 
to land information, whether the 
fee schedule for land registry services 
is publicly available, whether there are 
service standards for property transac-tions, 
whether statistics about land 
transactions are collected and made 
available to the public and whether any 
specific mechanism is in place for filing 
a complaint. 
Transparency in a land administration 
system provides a defense against 
requirements for informal payments, 
such as to register property, change 
a title, acquire information on land or 
process cadastral surveys. Complicated 
processes and limited availability of 
information in the land sector facilitate 
such bribery.11 But a transparent land 
administration system—one in which 
all land-related information is publicly 
available, all procedures and property 
transactions are clear, and information 
on fees for public services is easy to 
access—minimizes the possibilities for 
informal payments and abuses of the 
system. Indeed, cross-country data 
show that the greater the quality and 
transparency of a land administration 
system, the lower the incidence of 
bribery at the land registry (figure 7.4). 
Among all economies included in the re-search, 
45 do not make the fee sched-ule 
for land registry services publicly 
available. In 7 of these economies the 
fee schedule is not accessible, and in 
38 it is accessible only by asking for it 
in person from a public official. In stark 
contrast, 83 economies make informa-tion 
on fee schedules available online. 
Some economies go even further: 
FIGURE 7.4 A better and more transparent land administration system is associated 
with a lower incidence of bribery at the land registry 
Score on overall quality of land administration 
Reported incidence of 
bribery for land services (%) 
80 
70 
60 
50 
40 
30 
20 
10 
0 
0 5 10 15 20 25 30 
Note: The score on the overall quality of land administration is obtained through a set of questions on reliability, transpar-ency; 
coverage and dispute resolution. For example; an economy receives 1 point if it has a functional electronic database for 
encumbrances; 1 point if it makes the documents and fee schedules for property registration publicly available (online or on 
public boards); 1 point if it compiles statistics on land transactions and makes them publicly available and so on. The highest 
possible score; indicating the highest overall quality; is 30 points. The reported incidence of bribery refers to the share of 
people reporting in Transparency International’s Global Corruption Barometer 2013 survey that when they had contact 
with land services in the previous 12 months; they paid a bribe for services. The correlation between the score on the overall 
quality of land administration and the reported incidence of bribery is −0.60. The relationship is significant at the 1% level 
after controlling for income per capita. The analysis is based on 88 observations. 
Source: Doing Business database; Transparency International data.
REGISTERING PROPERTY 63 
Sweden has an online system allowing 
anyone to access not only information 
on fees but also any information on 
plots going back 400 years.12 Advanced 
systems like Sweden’s are not easy to 
afford. A much cheaper alternative is 
to make fees available through public 
boards or brochures—the approach 
used by land registries in 34 economies 
(figure 7.5). 
Governments can give citizens the 
chance to be informed and contribute 
to a better business environment by 
promoting transparency about their 
operations—for example, by tracking 
the performance of their land services 
and openly sharing statistics about 
property transactions. Lithuania com-piles 
statistics on the performance 
of its land registries and makes them 
available to the public.13 Panama’s 
land registry dedicates a page on its 
online portal to transparency, publish-ing 
monthly data on the number of 
transactions broken down by type— 
mortgages, first registrations, trans-fers. 
14 Overall, 98 economies compile 
statistics on land transactions (figure 
7.6), though only 56 of those make their 
statistics public. 
One powerful consequence of trans-parency 
is accountability: information 
gives citizens the power of knowing 
what to expect and whom to hold 
accountable in case things go awry. 
But if the mechanisms through which 
individuals or agencies are held ac-countable 
function poorly, information 
alone will not be enough. Of all econo-mies 
included in the research, only 63 
have specific means for filing an official 
complaint about land services. One is 
Malaysia, where the land registry and 
the cadastre allow users to file anony-mous 
complaints through their web-site, 
which are then sent directly to the 
director of the department.15 Another 
is Mauritius, where the website of the 
Registrar General Department enables 
users to fill out a form providing feed-back 
or filing a complaint.16 
WHERE IS COVERAGE 
COMPLETE? 
The utility of even the most reliable and 
transparent land administration sys-tem 
will be undermined if it covers only 
a limited area of the economy. Where 
land registries do not provide complete 
geographic coverage, companies and 
individuals cannot be sure whether the 
areas not covered at the registry might 
be relevant to their interests.17 For 
maximum effectiveness, the registry 
and cadastre should make records of 
all registered private land readily avail-able 
and the records should cover the 
entire economy.18 
Around the world, only 27% of econo-mies 
have a registry with full coverage 
of private land—and only 34% a ca-dastre 
with complete coverage (figure 
7.7). South Asia, Latin America and the 
Caribbean and Sub-Saharan Africa 
have the smallest shares of economies 
with full coverage of private land, while 
the OECD high-income group and 
Europe and Central Asia have the larg-est 
shares with full coverage. 
Several economies have increased the 
coverage of their land registry and 
cadastre by registering properties and 
the associated rights through either 
systematic adjudication or a more 
sporadic approach. Between 1984 
and 2004 Thailand implemented one 
of the world’s largest land titling pro-grams, 
using efficient, systematic land 
titling procedures and issuing more 
than 8.5 million titles.19 Recognized as 
very successful, the project has served 
as a model for other countries in East 
Asia and the Pacific.20 More recently, 
in 2014 Rwanda completed its process 
of regularizing land tenure, aimed 
at registering all land in the country. 
The effort required surveying all land 
parcels and providing land titles to all 
rightful claimants. It registered 10.3 
million parcels through a low-cost, 
community-based process starting 
in 2010.21 With the process complete, 
FIGURE 7.5 The accessibility of fee 
schedules for land registries varies 
across income groups 
Economies by type 
of access provided (%) 
100 
80 
60 
40 
20 
0 
High 
income 
Middle 
income 
Low 
income 
Online 
Public boards/ 
brochures 
In person 
Not publicly 
available 
Source: Doing Business database. 
FIGURE 7.6 Where do land registries 
have statistics on land transactions 
and a specific mechanism for filing a 
complaint? 
Share of economies with 
accountability mechanism (%) 
90 
80 
70 
60 
50 
40 
30 
20 
10 
0 
Statistics on the number of transactions 
Specific complaint mechanism 
High 
income 
Upper 
middle 
income 
Lower 
middle 
income 
Low 
income 
Source: Doing Business database.
64 DOING BUSINESS 2015 
80 
70 
60 
50 
40 
30 
20 
10 
Caribbean 
Economies by 
time required (%) 
100 
80 
60 
40 
20 
Central Asia 
income 
the land registry is now able to provide 
information on different categories of 
tenure, through a database searchable 
by parcel across the entire country. 
80 
70 
60 
50 
40 
30 
20 
10 
Caribbean 
Caribbean 
HOW TO DEAL WITH LAND 
DISPUTES? 
In many economies disputes over 
land can make up the lion’s share of 
all disputes in court.22 To prevent land 
disputes and better manage existing 
ones, the legal framework for land 
administration needs to assign clear 
responsibilities to the stakeholders 
involved in land transactions and pro-vide 
effective mechanisms of dispute 
resolution that can be implemented 
in a consistent way and are acces-sible 
to all.23 Data collected by Doing 
Business on the legal framework for 
land administration cover several 
aspects, including who is held respon-sible 
for verifying the identities of the 
parties to a land transaction, whether 
the property registration system is 
guaranteed, whether any specific com-pensation 
mechanism is in place, how 
long it takes to resolve a land dispute 
between 2 domestic companies in the 
first instance and whether statistics on 
land disputes are collected and made 
publicly available. 
To help avoid land disputes, it is es-sential 
to ensure the accuracy of the in-formation 
underlying land transactions 
and to identify cases of fraud—by veri-fying 
and authenticating the identity of 
parties to a property transaction and 
validating all property records. This can 
be done by the registrar or by profes-sional 
agents such as notaries and law-yers, 
whose legal responsibilities should 
be clearly specified in the law. In some 
economies the state requires a profes-sional 
agent—a public notary in France 
and Italy, a public officer in the Republic 
of Korea—to be fully responsible for the 
transaction. 
In many economies the state provides 
a guarantee over property registra-tion. 
Among all economies covered 
by the research, 149 have a property 
registration system backed by a state 
guarantee. The most advanced forms 
of guarantee indemnify individuals for 
losses suffered because of deficien-cies 
in information provided by the 
registry.24 In Shanghai, for example, 
the state will provide full compensation 
FIGURE 7.7 Land registries and cadastres provide the highest coverage of private 
land in OECD high-income economies and Europe and Central Asia 
0 
South Asia 
Latin America  
Sub-Saharan Africa 
Middle East  
North Africa 
East Asia  Pacific 
Europe  Central Asia 
OECD high income 
0 
South Asia 
Latin America  
Sub-Saharan Africa 
East Asia  Pacific 
Middle East  
North Africa 
Europe  Central Asia 
OECD high income 
Share of economies where land registry 
has full coverage (%) 
Share of economies where mapping 
system has full coverage (%) 
Source: Doing Business database. 
FIGURE 7.8 How long does it take to resolve a land dispute in the first instance? 
0 
1 year 2 years 3 years or more 
Latin America  
South Asia 
Sub-Saharan 
Africa 
Middle East  
North Africa 
East Asia  
Pacific 
Europe  
OECD high 
Note: Data refer to a standardized case involving a dispute over a property transfer between 2 domestic companies. 
Source: Doing Business database.
REGISTERING PROPERTY 65 
for losses due to a technical error by 
a public officer. In England and Wales 
indemnity is also payable for losses 
incurred because of a mistake in an 
official search or an official copy. 
Accuracy of information in land regis-tries 
can help avoid potential disputes. 
But when disputes do arise, alternative 
dispute resolution mechanisms—such 
as voluntary mediation procedures— 
can help deal with them at a pre-liminary 
stage, easing the burden on 
congested courts.25 A dozen economies 
have mediation procedures specifically 
for land disputes. One is Liberia, which 
instituted a program for resolving land 
disputes through mediation to fill a 
gap left by the virtual collapse of its 
court system after the civil war.26 The 
government set up the National Land 
Commission to address fundamental 
land tenure issues and develop interim 
measures for resolving land disputes. 
When land disputes end up in court, an 
efficient legal system should be able to 
provide a timely resolution. But time 
requirements vary considerably across 
economies. Obtaining a judgment in a 
standard land dispute takes less than 
a year in 58 economies, but up to 3 
years or more in another 55 economies. 
There is also much variation across 
regions. In 61% of economies in the 
OECD high-income group and 58% in 
Europe and Central Asia, land disputes 
can be resolved within a year. In 80% 
of economies in South Asia and 62% in 
Latin America and the Caribbean, the 
process usually takes 3 years or more 
(figure 7.8). 
Whether a judicial system provides 
official statistics on the number of land 
disputes filed and resolved can be an 
indicator of its overall quality—reflect-ing 
something about how well it func-tions 
and how transparent it is. Among 
all economies included in the research, 
about 20 have such statistics available. 
In Finland, for example, statistics show 
that 1,173 land disputes were settled 
FIGURE 7.9 Good land administration systems are associated with higher levels of 
domestic credit provided by the financial sector 
Domestic credit provided by 
financial sector (% of GDP) 
250 
200 
150 
100 
50 
0 
-50 
70 
60 
50 
40 
30 
20 
10 
in the district courts in 2012; these 
represented about 0.25% of all disputes 
resolved through court in the country. 
In Georgia 168 land disputes were 
-100 
0 5 10 15 20 25 30 
Score on overall quality of land administration 
Note: For an explanation of the scoring on the overall quality of land administration, see the note to figure 7.4. Domestic 
credit provided by the financial sector includes all credit to various sectors on a gross basis, with the exception of credit 
to the central government, which is net. The data are for the most recent year available. The correlation between the 
overall quality of land administration and domestic credit provided by the financial sector is 0.56. The relationship is 
significant at the 1% level after controlling for income per capita. The analysis is based on 150 observations. 
Source: Doing Business database; World Bank, World Development Indicators database. 
FIGURE 7.10 Economies with a good land administration system are likely to have 
lower inequality 
0 
0 5 10 15 20 25 30 
Score on overall quality of land administration 
Gini index 
Note: For an explanation of the scoring on the overall quality of land administration, see the note to figure 7.4. The 
Gini index measures the extent to which the distribution of income or consumption expenditure among individuals or 
households within an economy deviates from a perfectly equal distribution. A Gini index of 0 represents perfect equality, 
an index of 100 perfect inequality. The data are for the most recent year available. The correlation between the overall 
quality of land administration and the Gini index is −0.37. The relationship is significant at the 1% level after controlling for 
income per capita. The analysis is based on 123 observations. 
Source: Doing Business database; World Bank, World Development Indicators database.
66 DOING BUSINESS 2015 
resolved in 2013, accounting for 1.92% 
of all disputes settled by the courts of 
first instance. And in Latvia 324 land 
dispute claims were filed in 2013, rep-resenting 
0.91% of all claims submitted 
to the courts of first instance. 
WHY DOES THE QUALITY 
MATTER FOR ALL? 
A reliable, transparent, complete and 
secure land registration system plays 
an important part in supporting access 
to credit and economic growth for all. 
Providing a sound property registration 
system is a first step toward improving 
access to credit. Indeed, the higher the 
quality of the land administration sys-tem, 
the higher the level of domestic 
credit provided by the financial sector 
to the economy (figure 7.9). 
In addition, clear property boundaries 
and ownership are important factors in 
social stability and social development. 
If people feel secure in their homes 
and on their land, they are more likely 
to invest in them, such as by making 
improvements that benefit health and 
well-being. Having a safe property 
registration system for all is associated 
with lower levels of inequality (figure 
7.10). Economies with a reliable and 
transparent land administration sys-tem 
tend to have lower inequality and 
to be more inclusive. 
CONCLUSION 
Expanding the registering property 
indicators to measure the quality of 
land administration systems as well 
as the efficiency of property transac-tions 
enriches the substance of these 
indicators. It provides measures of 
key elements of land administration 
systems—elements that matter for 
all people in a society. New data on 
reliability, transparency, coverage 
and dispute resolution show much 
variation in the overall quality of land 
administration systems among the 170 
economies covered. The data also show 
that examples of good practice exist in 
all regions of the world—and will help 
policy makers identify those examples. 
NOTES 
This case study was written by Edgar Chavez, 
Laura Diniz, Frédéric Meunier, Parvina Rakhimova 
and Marilyne Youbi. 
1. UN-Habitat 2013. Title refers to the formal 
legal document serving as evidence of 
ownership. This document can take a range 
of forms. 
2. Galiani and Schargrodsky 2010. 
3. World Bank 1989. 
4. UN-Habitat 2013. 
5. UN-Habitat 2012. 
6. “Provincial Government of Khyber 
Pakhtunkhwa and UN-Habitat Inaugurates 
GIS Labs for Computerization and 
Digitization Process of Land Records,” 
United Nations Human Settlements 
Programme (UN-Habitat), October 3, 2012, 
http://www.fukuoka.unhabitat.org 
/projects/voices/pakistan/detail01_en.html. 
7. Hanstad 1998. 
8. UN-Habitat 2012. 
9. UNECE 2012. 
10. One definition of a transparent business 
environment is one in which individuals 
possess essential information about 
the environment in which they operate, 
meaning that information asymmetries do 
not place an unjustifiable burden on them 
(OECD 2002). 
11. Transparency International 2011. 
12. For more on the information available, 
see the website of Sweden’s mapping, 
cadastral and land registration authority 
(Lantmäteriet) at http://www.lantmateriet.se 
/en/Maps-and-geographic-information. 
13. For more on the information available, see 
the website of the Lithuanian Real Property 
Cadastre and Register at http:// 
www.registrucentras.lt. 
14. For more on the information available, see 
the website of the Land Registry of Panama 
at https://www.registro-publico.gob.pa 
/index.php/es/icons.html. 
15. For more information, see the website of the 
Department of the Director General of Land 
and Mines of Malaysia at http:// 
www.kptg.gov.my/?q=en/content 
/complaints-enquiries. 
16. For more information, see the website of the 
Registrar General Department of Mauritius 
at http://registrar.mof.gov.mu/English 
/Pages/About%20the%20department 
/Land.aspx. 
17. Deininger, Selod and Burns 2012. 
18. UNECE 2012. 
19. Burns 2004. 
20. Brits, Grant and Burns 2002. 
21. Gillingham and Buckle 2014. 
22. Wehrmann 2008. 
23. Deininger, Selod and Burns 2012. 
24. Deininger, Selod and Burns 2012. 
25. FAO 2012. 
26. Bruce 2013.
Doing Business 2015 
Going Beyond Efficiency 
Getting credit 
The importance of registries 
Small and medium-size enterpris-es 
account for the largest share 
of employment in the developing 
world. They are also more likely than 
large firms to be credit constrained.1 
These businesses need working capital 
to operate, to grow and to compete in 
the marketplace. So access to finance 
is crucial to their success. 
The Doing Business indicators on get-ting 
credit measure 2 types of institu-tions 
and systems that can facilitate 
access to finance and improve its 
allocation. One set of these indicators 
focuses on the secured transactions 
system, examining the legal rights 
of borrowers and lenders in secured 
transactions and bankruptcy laws. 
The second focuses on the credit 
reporting system, looking at the in-formation 
collected and distributed 
through credit bureaus or registries. 
Research has shown that these insti-tutions 
and systems work best when 
implemented together.2 
What is an effective secured transac-tions 
system? One that promotes the 
availability of credit by reducing the risk 
to lenders of accepting movable assets 
as collateral. This can be achieved by 
taking a functional approach to se-cured 
transactions and implementing 
modern collateral registries—such as 
those in Honduras and New Zealand— 
to ensure their publicity. 
What is an effective credit reporting 
system? One that provides creditors 
with the most relevant, reliable, timely 
and sufficient credit data as well as 
value added services. Among the many 
features offered by a modern credit 
reporting service provider are online 
access to credit information and the 
provision of credit scores. 
Doing Business collected new data this 
year to strengthen the understanding 
of secured transactions and credit 
reporting systems around the world. 
The strength of legal rights index has 
been expanded from 10 points to 12 to 
also cover the functional approach to 
secured transactions and more fea-tures 
of collateral registries. The depth 
of credit information index has been 
expanded from 6 points to 8 to also 
cover the existence of credit scoring 
and online platforms for exchanging 
credit data. 
WHY A FUNCTIONAL 
APPROACH TO SECURED 
TRANSACTIONS? 
For lenders considering a loan to a 
small or medium-size enterprise, one 
of the biggest deterrents is the pos-sibility 
that the borrower has hidden 
liens—that is, that the borrower has 
already given its assets as collateral 
to another lender. As more complex fi-nancial 
instruments develop and are 
adopted worldwide—such as factoring 
(where a business sells its invoices 
to a third party, called a factor, at a 
discount) or financial leases that cre-ate 
hidden rights over property held by 
the borrowing company—the need for 
ƒ Doing Business has expanded its 
measures of the legal rights of 
borrowers and lenders and the sharing 
of credit information. They now also 
cover the functional approach to 
secured transactions, more features 
of the collateral registry and the 
availability of credit scores and online 
access to credit information. 
ƒ A functional approach to secured 
transactions provides transparency and 
predictability for creditors—because 
the legal framework covers all rights 
in movable assets that secure the 
performance of an obligation, regardless 
of the type of transaction. Forty-seven 
of 189 economies have a functional 
approach as recorded by Doing Business. 
ƒ A modern collateral registry— 
centralized, notice-based and allowing 
online access—is important. Among 
189 economies, 18 have such a registry, 
while 25 have a notice-based registry 
and 28 an online registry. 
ƒ Credit bureaus or registries offering 
online access can provide faster service 
and better data quality. Online access 
is available in 119 of 126 economies 
with a functioning credit bureau or 
registry covering at least 5% of the 
adult population as recorded by Doing 
Business. 
ƒ Credit scores based on credit bureau or 
registry data provide highly predictive 
measures of a borrower’s future 
repayment capacity and so can help 
expand access to finance. They are 
offered in 64 of the 126 economies 
with a functioning credit bureau or 
registry covering at least 5% of the adult 
population.
68 DOING BUSINESS 2015 
a system that limits the impression of 
“false wealth” becomes paramount. 
One way to minimize the potential for 
secret liens is to adopt a functional 
approach to secured transactions. 
This requires legislation that covers 
all rights in movable assets that are 
created by agreement and that secure 
the payment or performance of an 
obligation, regardless of the type of 
transaction or the terminology used.3 
In this approach what matters is no 
longer the form that the agreement 
takes (whether a floating charge or a 
pledge agreement, for example) but the 
rights and obligations that it creates. 
These rights then need to be publicized 
through a reliable and affordable public 
registration system (figure 8.1). In a 
system that includes several registries, 
the registries need to be integrated to 
the greatest extent possible to ensure 
that potential creditors can easily 
retrieve all notices of security interests 
that have been recorded.4 
This functional approach to secured 
transactions, also known as the 
unitary model, has been promoted 
through model laws in regions as far 
apart as Eastern Europe and Latin 
America and the Caribbean (figure 
8.2).5 The functional approach has 
also been considered in some high-income 
economies whose current 
system poses no significant problems 
but where the legal community sees 
possible advantages in the approach.6 
In the European Union, as part of the 
efforts to harmonize private law, schol-ars 
from economies with different legal 
traditions have reached consensus on 
the importance of a single notion of 
security right—with pledges covered 
by the same rules and principles for 
creation, publicity and enforcement 
as assignments of claims, transfers 
of ownership, and sales and leaseback 
agreements.7 
The benefits of a functional approach 
have inspired legal reforms all over the 
world. In Belgium a new unitary regime 
will come into force in December 2014. 
The provisions on pledges in the coun-try’s 
civil code as well as the 1919 law 
relating to pledges of commercial assets 
will be abolished,8 and the distinction 
between the commercial pledge and 
civil pledge eliminated. The new legal 
framework will incorporate the provi-sions 
on retention of title now included 
in the country’s bankruptcy law and will 
formally recognize fiduciary transfer 
of title. This will create a single legal 
framework for all pledges over movable 
assets—a big step toward a functional 
approach to secured transactions. Once 
implemented, the reform will arguably 
be the first of its kind in Western Europe. 
Colombia established a modern legal 
framework for secured transactions in 
the past year. The new legal framework 
allows the use of all types of movable 
assets, present or future, as collateral 
to secure a loan. It also regulates the 
functional equivalents of loans secured 
with movable property, such as financial 
leases and sales with retention of title.9 
FIGURE 8.1 Recording all types of secured transactions in a collateral registry promotes transparency 
What are some 
transactions that can 
be recorded? 
Nonpossessory 
security interest 
Fiduciary transfer 
of title 
Financial 
lease 
Assignment of 
receivables 
Sale with retention 
of title 
What form does the 
transaction take? 
Debtor keeps title  possession 
of movable asset 
Note: Priority is established by time of registration of the security interest. 
Collateral 
registry 
Who has priority over 
claims on the asset? 
Debtor 
transfers 
title 
Bank 
Leasing 
company 
leases asset 
Debtor 
Company 
assigns 
receivables 
Bank 
Wholesaler 
sells asset  
keeps title 
Company 
Bank 
Bank 
Leasing 
company 
Bank 
Wholesaler
GETTING CREDIT 69 
Sub-Saharan Africa 
Latin America  Caribbean 
OECD high income 
Europe  Central Asia 
East Asia  Pacific 
Middle East  North Africa 
18 29 
7 25 
5 26 
5 21 
10 15 
This change is expected to increase 
transparency and protect the rights of 
creditors when taking movable property 
as collateral. 
Jamaica also established a new legal 
framework to modernize its secured 
transactions system. The aim is to 
improve the availability of credit to the 
private sector while minimizing the risk 
of nonpayment of loans. The Security 
Interests in Personal Property Act, 
which came into force on January 2, 
2014, repealed provisions governing tra-ditional 
securities under the Agricultural 
Loans Act, the Bills of Sale Act and the 
Debenture Registration Act. The new 
legal framework applies to all types of 
security documents, including pledges, 
leases and floating charges. 
Jamaica is following a path laid by other 
jurisdictions with a common law tradi-tion. 
The most recent previous example 
was Australia’s implementation of the 
Personal Property Security Act of 2009. 
The reform had a massive legal scope, re-placing 
77 commonwealth and state acts 
and regulations and affecting 30 com-monwealth, 
state and territory agencies. 
All these reforms entailed creating new 
collateral registries or transforming 
existing ones. To help in understanding 
how these institutions function, the 
Doing Business indicators on the legal 
rights of borrowers and lenders look at 
several features of their operation. 
A CRITICAL PIECE—THE 
COLLATERAL REGISTRY 
To be effective, an integrated legal 
framework for secured transactions 
needs to be accompanied by a modern 
collateral registry for movable assets. 
Such registries allow a lender to take 
security rights in an asset without 
having to take physical custody of it. 
The debtor retains title and posses-sion. 
Without registration of these 
transactions, there is no transparent 
security for the lender and no assur-ance 
that the lender is the only one 
laying claim to the asset. Collateral 
registries both enable potential credi-tors 
or buyers to discover any existing 
liens over property and allow them to 
register their own security interest, 
establishing priority over other credi-tors 
in case of the debtor’s default.10 
Studies show that a new collateral 
registry can have a substantial eco-nomic 
impact. In economies that 
introduce one, access to bank finance 
rises by about 8 percentage points on 
average, while interest rates decline 
by about 3 percentage points and the 
terms of loans increase by about 6 
months.11 Experience shows how ac-tive 
collateral registries can be, even 
in countries with small populations. 
In 5 such countries that recently cre-ated 
registries and reformed secured 
transactions laws—the Marshall 
Islands (2010), the Federated States 
of Micronesia (2007), the Solomon 
Islands (2009), Tonga (2011) and 
Vanuatu (2009)—the number of filings 
had reached a total of more than 
20,000 by January 31, 2014, while 
the number of searches had exceeded 
60,000.12 In Australia, whose 2009 re-form 
included implementing a new col-lateral 
registry, the number of filings 
exceeded 2 million in 2013 alone, while 
the number of searches exceeded 6 
million.13 Implementing and maintain-ing 
a modern and well-functioning col-lateral 
registry may entail significant 
financial and administrative efforts. It 
is encouraging to note that, costs not-withstanding, 
a number of low-income 
countries have found the associated 
investments to be fully justified when 
examined in light of other benefits for 
the economy at large. 
Key features of a modern 
collateral registry 
As model laws and legislative guides 
have evolved with technology over the 
years, they have encapsulated a set 
of good practices that serve as gener-ally 
accepted standards for modern 
collateral registries. These include using 
notice-based registration, allowing online 
access to data and centralizing registries. 
While traditional registries usually 
require a copy of the loan agreement 
or other documents, notice-based 
registries require no documentation 
other than a simple generic form that 
records the existence of a security 
interest, providing the names of the 
creditor and the debtor as well as a 
general description of the collateral 
asset and the obligation secured. This 
FIGURE 8.2—How many economies have adopted a functional approach to secured 
transactions? 
0 5 10 15 20 25 30 35 40 45 50 
South Asia 
Using functional approach Not using functional approach 
2 6 
20 
Number of economies 
Source: Doing Business database.
70 DOING BUSINESS 2015 
avoids the need for a specialist to 
review lengthy documents, which can 
be costly and time-consuming. It also 
improves the quality of registration: 
with less documentation, the potential 
for errors is minimized. Notice-based 
registration has also been successfully 
adopted for other registration sys-tems, 
such as patent and trademark 
registries. 
Online systems allow users to perform 
searches and register security interests 
from anywhere and at any time. Unlike 
with paper-based systems, there is 
no need for users to appear before the 
registrar and wait their turn to enter 
information in the registry index. Online 
registration also transfers the burden of 
preventing errors to the interested party. 
Centralized registries enable potential 
creditors to determine whether an as-set 
has been pledged as collateral by 
searching a single database, regard-less 
of the location of the borrower. To 
be effective, these registries also need 
to allow searches based on unique 
search criteria—such as a debtor’s 
unique identifier (or name, if no unique 
identifiers exist) or a serial number 
(for serial-numbered assets such as 
vehicles)—and they need to encom-pass 
both legal and natural persons 
as well as all types of assets. Where 
registries are not centralized, searches 
can be time-consuming and even 
useless. In the fragmented collateral 
registry system for chattel mortgages 
in the Philippines, for example, finding 
out whether an asset is mortgaged 
requires submitting a request to more 
than a hundred registries. 
Different legal traditions, 
different practices 
While the registration of collateral 
claims is common practice in many 
economies, the type and role of reg-istries 
may vary depending on the 
legal tradition. In some economies 
with a common law tradition, rights 
over movable property are customar-ily 
recorded in separate registries for 
incorporated and nonincorporated 
entities. For example, not all security 
instruments may be available to both 
companies and sole proprietorships or 
registered at the same place. 
In some civil law economies registra-tion 
of securities takes place at the 
local court of first instance or at the 
commercial registry. In many other 
economies there is no requirement at 
all to register security interests over 
movable property (figure 8.3). 
The strength of legal rights index 
is consistent with good practices 
in secured transactions law, such 
as allowing both incorporated and 
FIGURE 8.3 Which economies have collateral registries—and of which type? 
Note: The map reports operational collateral registries as recorded by Doing Business—those that are for all entities, are centralizied geographically and by asset type and have an 
electronic database indexed by the debtor’s name or unique identifier. Functional equivalents to traditional security interests include financial leases, sales with retention of title, 
assignments of receivables and fiduciary transfers of title, among others. Registries that are fully online allow searches, registrations, amendments and cancellations to be carried out 
online by any party with a legitimate right to do so. 
Source: Doing Business database.
GETTING CREDIT 71 
nonincorporated companies to create 
security interests over all categories 
of movable assets. Good practices 
also call for registering all types of 
security interests and functional 
equivalents at the same place—in-cluding 
financial leases, sales with 
retention of title, assignments of 
receivables, fiduciary transfers of title 
and tax liens—to ensure that they are 
not hidden from prospective creditors 
or buyers. The indicator focuses on the 
first 4 of these functional equivalents 
and rewards economies in the scor-ing 
if at least 3 of them are recorded 
at the same collateral registry. This 
unitary approach has increasingly 
become part of the secured transac-tions 
reforms in Central and Eastern 
Europe, most recently in Hungary. 
But because of different approaches 
in their implementation, the wave of 
reforms in the region has not led to 
consistent results.14 
WHY ARE CREDIT 
BUREAUS AND REGISTRIES 
IMPORTANT? 
Credit reporting service providers can 
be grouped into 2 main types: credit bu-reaus, 
which aim primarily to improve 
the quality and availability of data 
that creditors need to make informed 
decisions, and credit registries, which 
seek mainly to support banking super-vision 
while also improving the quality 
and availability of data for supervised 
financial intermediaries (figure 8.4). 
(In practice, many credit bureaus also 
support financial supervision activities, 
and some credit registries also aim 
to improve data for creditors.) While 
their primary objectives might differ, 
both types serve the same purpose: 
reducing information asymmetries to 
help increase access to credit. They 
also improve borrower discipline, lower 
interest rates and support bank super-vision 
and credit risk monitoring. 
Borrowers have more information 
about their past credit behavior and 
current financial situation than credi-tors 
do. This makes it hard for individu-als 
and small firms trying to get a loan 
to make their case to lenders. Banks 
are more likely to lend to larger firms, 
which usually are required to adopt 
international accounting standards, 
are more transparent and bear less risk 
of default.15 
By collecting information on indi-viduals 
and small firms, credit bureaus 
and registries provide banks with the 
information they need to assess cred-itworthiness. 
This information sharing 
helps poor people and micro and small 
businesses.16 It can especially benefit 
new entrepreneurs, by enabling formal 
credit providers to check their past 
repayment patterns and track their 
current credit behavior.17 A 2007 study 
found that in developing economies 
access to credit grew twice as fast 
FIGURE 8.4 How credit information flows in a system with both a credit registry and credit bureaus 
Data providers Service providers Products Users 
Credit card issuers 
Consumers 
Nonregulated financial 
institutions 
Credit card issuers 
Retailers 
Telecoms and utilities 
Public records 
Court judgments 
Credit registry 
Data bank 
Consumers or credit applicants 
Debt classification 
Credit bureau 1 
Credit bureau 2 
Credit bureau 3 
Reports 
Reports 
Credit scoring 
Antifraud 
Portfolio monitoring 
Statistics unit of 
central bank 
Supervisory unit of 
central bank 
Banks and 
regulated financial 
institutions 
Nonregulated 
financial 
institutions 
Retailers 
Telecoms and 
utilities 
Central bank 
Banks and regulated 
financial institutions 
Note: Some economies have only a credit registry, some have only one or more credit bureaus, and some have both a credit registry and one or more credit bureaus. Credit bureau 
networks tend to be more complex than credit registry networks because they generally include a larger variety of data providers and data users. 
Source: World Bank 2011a, p. 51.
72 DOING BUSINESS 2015 
for small firms as for large ones after 
new credit reporting systems were 
introduced.18 
Good credit reporting systems com-bined 
with strong rule of law can be a 
catalyst for growth in frontier econo-mies 
with many young firms and en-trepreneurial 
ventures. Research based 
on World Bank Enterprise Survey data 
from 123 countries found that in those 
with better credit reporting systems, 
younger firms have better access to 
bank finance than older firms do.19 
Credit information systems also reduce 
firms’ reliance on informal credit, whose 
high interest rates and lack of protec-tions 
can be destabilizing both to the 
firms and to the overall economy. 
Sharing credit information can improve 
borrower behavior and reduce interest 
rates. According to a study surveying 
more than a thousand consumers in 
the United States with primary or joint 
responsibility for paying bills, half said 
that they would be more likely to pay 
their bills on time if those payments 
were fully reported to credit bureaus 
and could affect their credit score.20 A 
study in Albania found that loans given 
after the launch of its credit registry 
were 3 percentage points less likely to 
turn problematic.21 And when credit re-porting 
compels borrowers to establish 
consistent repayment patterns, finan-cial 
institutions face less uncertainty 
in their debt exposure and can lower 
interest rates.22 
Credit information systems also help 
maintain the health of financial sys-tems, 
with credit registries enabling 
policy makers and regulators to monitor 
large flows of money and credit bureaus 
allowing them to assess developments 
in credit markets and interest rates. 
One study found that credit registries 
played a valuable role in calculating 
credit risk for capital and in supervising 
and checking banks’ internal ratings in 
Argentina, Brazil and Mexico.23 
Coverage by credit bureaus and regis-tries 
is extensive, encompassing more 
than 2 billion individuals and 120 million 
firms worldwide by January 2014.24 
The number of economies with a credit 
bureau covering at least 5% of the adult 
population as recorded by Doing Business 
grew from 49 of 145 economies in 2004 
to 94 of 189 in 2014—while the number 
with a credit registry covering at least 
5% increased from 22 of 145 economies 
to 58 of 189 (figure 8.5). Globally, 28 
economies have both a credit registry 
and a credit bureau covering at least 5% 
of the adult population. 
Coverage continues to grow as econo-mies 
establish or enhance credit report-ing 
systems. Several did so in the past 
year. In Jamaica 2 new credit bureaus, 
Creditinfo Jamaica and CRIF-NM Credit 
Assure Limited, having received licenses 
in 2012, began serving banks and finan-cial 
institutions in 2013. Thanks to the 
launch of their operations, Jamaica was 
the economy that made the biggest 
FIGURE 8.5 Which economies have a credit bureau or registry? 
Note: Coverage is the number of individuals and firms covered as a percentage of the adult population. The map reports operational credit reporting service providers as recorded by 
Doing Business that have a coverage of at least 0.1% of the adult population. 
Source: Doing Business database.
GETTING CREDIT 73 
improvement in credit reporting in 
2013/14. 
Three other economies also developed 
new credit reporting systems in the 
past year. The Democratic Republic 
of Congo’s central bank established a 
credit registry by launching an elec-tronic 
credit reporting system, YSYS– 
CERI, in April 2013. Tanzania’s central 
bank licensed the country’s first credit 
bureau, Creditinfo Tanzania, in June 
2013, and its second credit bureau, Dun 
 Bradstreet Credit Bureau Tanzania, in 
September 2013. Vietnam’s first credit 
bureau, Vietnam Credit Information, 
started operating in January 2014. By 
April it was providing credit informa-tion 
to 23 of 47 commercial banks in 
the country as well as market educa-tion 
and training. 
Some economies have development 
plans under way. In June 2013 the 
West African Economic and Monetary 
Union set up a legal framework pro-viding 
for the establishment of credit 
bureaus in member states. Two have 
adopted the law so far, Senegal in 
January 2014 and Côte d’Ivoire in 
March 2014. 
FEATURES OF MODERN 
CREDIT INFORMATION 
SYSTEMS 
The vast majority of credit reporting 
service providers offer online access 
to their databases, which provides 
data users with faster, more efficient 
service and can ensure better data 
quality. Many also provide credit 
scores based on credit bureau or credit 
registry data as a value added service. 
These scores are different from those 
developed on the basis of individual 
lenders’ data and provide a highly 
predictive measure of a borrower’s re-payment 
behavior. Online access and 
credit scoring are 2 of many features 
that define a modern credit reporting 
system. 
The efficiencies of online access 
More efficient credit reporting service 
providers share their data online. 
Offering online access for subscribed 
banks and financial institutions has 
become a must for many credit bureaus 
and registries. One way to do so is 
through an online platform accessed 
with a traditional internet browser. This 
kind of system allows a user to connect 
once it has validated the user’s log-in 
information. Once connected to the 
system, the user can retrieve credit 
reports autonomously. 
Another way to provide online access is 
through a system-to-system connec-tion, 
where the user’s system is con-nected 
to and integrated with the credit 
reporting service provider’s system. 
Both parties have software installed 
that allows host-to-host connectiv-ity 
without human interaction. Data 
are updated automatically, and users 
retrieve credit information by accessing 
their own system, with no need to log 
into the service provider’s system.25 
Online access to data is fast and 
can ensure transparency, data qual-ity 
and security. A system-to-system 
connection further ensures system ef-ficiency 
and high service standards for 
users because it eliminates data dupli-cation, 
reduces the risk of human error 
and allows the streamlining of work 
flows with appropriate business and 
validation rules. These advantages may 
encourage more data providers to share 
information with the credit bureaus and 
registries. 
Online access is widespread. In 119 of 
126 economies with a functioning credit 
bureau or registry covering at least 5% 
of the adult population as recorded by 
Doing Business, data users can access 
borrowers’ credit information online. 
Globally, data providers and users 
can exchange credit information elec-tronically 
in 94 of the economies with 
a credit bureau that covers at least 5% 
of the adult population—and in 50 of 
those with a credit registry that does so. 
In East Asia and the Pacific, Europe and 
Central Asia, Latin America and the 
Caribbean, the OECD high-income group 
and South Asia data providers and us-ers 
can exchange data electronically in 
all economies that have a functioning 
credit bureau or registry covering at 
FIGURE 8.6—How many economies have a credit bureau or registry providing online 
access to credit data? 
12 5 21 9 
20 1 11 
30 1 
25 1 
16 2 7 
11 2 5 2 
5 21 
0 5 10 15 20 25 30 35 40 45 50 
Sub-Saharan Africa 
Latin America  Caribbean 
OECD high income 
Europe  Central Asia 
East Asia  Pacific 
Middle East  North Africa 
South Asia 
Number of economies 
Credit bureau or registry exists 
but has less than 5% coverage 
No credit bureau or registry exists 
Credit bureau or registry with at least 
5% coverage exists and offers online access 
Credit bureau or registry with at least 
5% coverage exists but does not offer online access 
Note: Coverage is the number of individuals and firms covered as a percentage of the adult population. 
Source: Doing Business database.
74 DOING BUSINESS 2015 
least 5% of the adult population (figure 
8.6). In the Middle East and North Africa 
this is the case in about 85% of econo-mies 
that have such a credit bureau or 
registry, while in Sub-Saharan Africa it 
is the case in only 71%. 
Online access to credit reporting 
systems is growing in the developing 
world. Ethiopia’s central bank estab-lished 
a credit information center 
to allow banks to submit data and 
inquiries electronically. A pilot program 
was launched in August 2011 with 3 
commercial banks, and by April 2012 
the online system was fully imple-mented. 
Today 17 Ethiopian banks are 
registered as data users and provide 
monthly updates. The objective for 
the online system is to preserve and 
distribute 5 years of historical data on 
the repayment status of all loans. 
Bangladesh’s central bank (Bangla-desh 
Bank) launched an online system 
for its credit information bureau in July 
2011 to allow banks and other financial 
institutions to exchange information 
on borrowers and loan repayments 
electronically. Before, Bangladesh 
Bank had a semiautomatic system 
in place: banks provided information 
on computer disks and had to pick up 
printed copies of credit reports from 
Bangladesh Bank’s office. 
Paraguay’s central bank introduced a 
new online system in April 2011. This 
system is aimed at improving both 
the credit registry’s efficiency—by 
reducing the time it takes to verify 
credit information from one week to 
just a few minutes—and the accu-racy 
of data. The system, called Red 
de Comunicación Financiera, allows 
financial institutions to transfer data 
to the credit registry and access 
credit information on both firms and 
individuals. 
The predictive value of credit 
scores 
Many credit bureaus and registries pro-vide 
value added services to data users. 
These include credit scoring, marketing 
services, portfolio monitoring, fraud 
detection and debt collection. An impor-tant 
tool in expanding access to finance 
is credit scoring, a statistical method of 
evaluating the probability that a pro-spective 
borrower will fulfill the financial 
obligations associated with a loan. 
Credit scores based on credit bureau 
or credit registry data pool informa-tion 
across many creditors as well as 
some public information sources. They 
therefore include characteristics oth-erwise 
unavailable to any individual 
creditor, such as total exposure, num-ber 
of outstanding loans and previous 
defaults within the system. Credit 
scoring models typically incorporate 
historical data such as defaults, posi-tive 
payment behavior and previous 
inquiries. To sharpen the predictive 
value of credit scores, credit bureaus 
and registries also are increasingly 
collecting data from a wider range of 
sources (such as bankruptcies and 
court judgments). As a result, credit 
scores generally have a higher predic-tive 
value than assessments derived 
from credit histories alone.26 
Credit scores may improve market 
efficiency and provide borrowers with 
more opportunities to obtain credit. 
The availability of credit scores allows 
lenders that would otherwise not be 
capable of analyzing the raw credit 
data to extend credit to underserved 
markets at lower cost. 
Credit scoring based on credit bureau 
or credit registry data is offered in 64 of 
126 economies with a credit reporting 
service provider covering at least 5% 
of the adult population as measured 
by Doing Business. This value added 
product is most widely available in 
Latin America and the Caribbean and 
the OECD high-income group, offered 
in 80% of economies with a credit bu-reau 
or registry covering at least 5% of 
the adult population—compared with 
40% in Europe and Central Asia, 38% 
in the Middle East and North Africa, 
25% in East Asia and the Pacific and 
24% in Sub-Saharan Africa (figure 8.7). 
In South Asia credit scores are offered 
in only 1 of 5 economies with a credit 
reporting service provider covering at 
least 5% of the adult population. 
FIGURE 8.7—How many economies have a credit bureau or registry providing credit 
scores? 
15 
Number of economies 
Credit bureau or registry exists 
but has less than 5% coverage 
No credit bureau or registry exists 
1 
4 
4 
5 
10 
24 
16 
4 
12 
8 
Sub-Saharan Africa 
Latin America  Caribbean 
OECD high income 
Europe  Central Asia 
East Asia  Pacific 
Middle East  North Africa 
Credit bureau or registry with at least 
5% coverage exists and offers credit scores 
Credit bureau or registry with at least 
5% coverage exists but does not offer credit scores 
6 
4 
13 
2 
5 
2 
1 
21 
1 
2 
7 
1 
1 
11 
9 
0 5 10 15 20 25 30 35 40 45 50 
South Asia 
Note: Credit scores are those based on credit bureau or registry data. Coverage is the number of individuals and firms 
covered as a percentage of the adult population. 
Source: Doing Business database.
GETTING CREDIT 75 
Distance to frontier score 
for getting credit, 2014 
100 
80 
60 
40 
20 
WHAT ARE THE LINKS WITH 
ACCESS TO CREDIT? 
Where the legal framework provides 
stronger protection of secured creditors’ 
rights and credit reporting systems pro-vide 
more relevant, reliable, timely and 
sufficient data, the private sector tends 
to have better access to credit. Analysis 
of data collected for the strength of legal 
rights and depth of credit information 
indices confirms that economies that 
score high on these indices also have 
higher levels of domestic credit provided 
to the private sector by financial institu-tions 
(figure 8.8). 
The results show that both transparency 
in the secured transactions system and 
access to credit information—elements 
that create predictability for secured 
creditors and provide lenders with 
tools to assess the creditworthiness 
of borrowers—are associated with a 
higher level of private sector credit, 
and this leads to more business 
creation or expansion in the long term. 
Nevertheless, there are many other 
factors that constrain or enable firms’ 
access to credit, and these should be 
taken into account when analyzing an 
economy’s credit market. 
CONCLUSION 
Effective systems for secured transac-tions 
and credit reporting can improve 
access to finance for small and medium-size 
enterprises. This is confirmed by 
the data for the expanded indicators on 
getting credit, which this year also cover 
the functional approach to secured 
transactions, more features of the col-lateral 
registry and the availability of 
credit scores and online access to credit 
information. Analysis of these data 
shows a significant correlation between 
better performance on the getting 
credit indicators and higher levels of 
domestic credit provided to the private 
sector by financial institutions. Used in 
conjunction with other indicators mea-suring 
factors that affect firms’ access 
to credit, the getting credit indicators 
can contribute to a better understand-ing 
of credit markets. 
NOTES 
This case study was written by Iana Ashchian, 
Catrice Christ, Santiago Croci Downes, Salima 
Daadouche, Nan (Charlotte) Jiang, Magdalini 
Konidari and Yasmin Zand. 
1. Kuntchev and others 2012. 
2. Djankov, McLiesh and Shleifer 2007. 
3. UNCITRAL 2007. 
4. World Bank 2011b. 
5. The European Bank for Reconstruction and 
Development has used its 1994 Model Law on 
Secured Transactions to promote a functional 
approach in Eastern Europe, while the 
Organization of American States has used its 
2002 Model Inter-American Law on Secured 
Transactions to promote the approach in 
Latin America and the Caribbean. 
6. According to a discussion paper by the City 
of London Law Society (2012, p. 3), “the 
advantage of this approach would be that 
all aspects of the law relating to secured 
transactions could be set out in one place. 
This would make it more accessible to those 
involved in taking or granting security, 
including those from outside England who 
engage in cross-border financing. It could also 
result in useful clarification and simplification 
of the law.” 
7. Study Group on a European Civil Code and 
Research Group on EC Private Law (Acquis 
Group) 2009. 
8. The relevant provisions of the Belgian Civil 
Code are in articles 2071–84 on pledge. 
9. Law 1676, article 3. 
10. Alvarez de la Campa 2011. 
11. Love, Martínez Pería and Singh 2013. 
12. Asian Development Bank 2013. 
13. Data provided by the Australian Financial 
Security Authority. 
14. Tajti 2013. 
15. Jappelli and Pagano 2002; Behr, Entzian and 
Guettler 2011; Brown, Jappelli and Pagano 
2009. 
16. Luoto, McIntosh and Wydick 2004; Brown, 
Jappelli and Pagano 2009. 
17. Chavis, Klapper and Love 2010. 
18. Brown and Zehnder 2007. 
19. Chavis, Klapper and Love 2010. 
20. Turner and others 2009. 
21. Behr and Sonnekalb 2012. 
22. Brown and Zehnder 2007; Luoto, McIntosh 
and Wydick 2004; Brown, Jappelli and 
Pagano 2009; Behr, Entzian and Guettler 
2011. 
23. Powell and others 2004. 
24. Statistics refer to the number of individuals 
and firms covered in 126 economies with 
functioning credit bureaus and registries 
covering at least 5% of the adult population as 
recorded by Doing Business. 
25. IFC 2012. 
26. World Bank 2011a. 
FIGURE 8.8—Economies with stronger systems for secured transactions and credit 
reporting have higher levels of domestic credit provided to the private sector 
0 
0 40 80 120 160 200 240 280 320 
Domestic credit to private sector (% of GDP), 2013 
Note: Domestic credit to private sector refers to financial resources provided to the private sector by financial 
corporations, such as through loans, purchases of nonequity securities, and trade credits and other accounts 
receivable, that establish a claim for repayment. The correlation between the distance to frontier score for getting 
credit and domestic credit to private sector as a percentage of GDP is 0.34. The relationship is significant at the 1% 
level after controlling for income per capita. 
Source: Doing Business database; World Bank, World Development Indicators database.
Doing Business 2015 
Going Beyond Efficiency 
Protecting minority investors 
Going beyond related-party transactions 
Acorporation is a legal entity 
distinct from its founders. This 
essential separation enables a 
business to flourish or fail separately 
from the personal assets and interests 
of its members (whether owners, direc-tors 
or employees). The advantages of 
untying a business from its founders 
are such that the corporation has 
today become the most common form 
of commercial entity around the world. 
But the separation also creates risks. 
Without a proper structure and al-location 
of duties and rights, and 
without clarity in decision-making 
processes, corporations can quickly 
become incapable of generating any 
wealth. Without adequate safeguards, 
corporations can become vulnerable 
to abuse, with insiders using corpo-rate 
assets for personal gain to the 
detriment of other stakeholders. If 
such abuses become widespread in 
an economy, they can deter investors 
from participating in any corpora-tion. 
The quality of the rules and 
regulations governing corporations is 
therefore fundamental to functioning 
markets and wealth-generating eco-nomic 
activity. 
The Doing Business indicators on pro-tecting 
minority investors analyze the 
regulation of related-party transac-tions 
and shareholder access to judicial 
redress as a proxy for an economy’s 
overall corporate governance stan-dards 
and ease of access to financ-ing 
from capital markets. Stronger 
protection of minority shareholders in 
prejudicial related-party transactions 
is associated with a higher level of 
development in capital markets—as 
reflected by such indicators as higher 
market capitalization, larger numbers 
of listed domestic firms, more initial 
public offerings and lower private ben-efits 
of control.1 
For entrepreneurs seeking to develop or 
expand a business, access to external 
financing is a crucial concern. Stronger 
legal protection of minority investors 
increases the confidence of investors 
in markets, making them more likely 
to invest. Econometric research shows 
that investors’ willingness to provide 
entrepreneurs with equity capital is a 
significant factor in the development 
of financial markets, which in turn 
promotes economic development. 
Recent studies provide empirical 
evidence that corporate governance 
standards aimed at protecting minor-ity 
shareholders promote positive 
economic outcomes at the country 
and firm level. To that end, certain 
aspects of corporate governance are 
particularly important—such as board 
composition and independence, firm 
transparency and disclosure, and the 
rights of shareholders relative to the 
board of directors and management. 
Sound rules and regulations in these 
areas of corporate governance can 
minimize the agency problem between 
majority and minority shareholders as 
well as that between minority share-holders 
and the board of directors and 
management. 
ƒ Doing Business introduces 3 new 
measures of minority investor 
protections this year—indices 
on shareholders’ rights and role 
in major corporate decisions, on 
governance structure and on 
corporate transparency. 
ƒ Economies with the most developed 
securities markets tend to have the 
highest average scores on the 3 new 
indices. 
ƒ On average, OECD high-income 
economies offer the strongest 
protections as measured by the new 
indices and continue to provide the 
strongest protections as measured 
by the existing ones. 
ƒ Among 189 economies worldwide, 
India follows the largest share of the 
good practices measured by the new 
indices. 
ƒ On average, shareholders of listed 
companies are more protected than 
those of nonlisted companies. 
ƒ Overall, minority investors are 
more protected in economies that 
distinguish between shareholders of 
listed companies and shareholders 
of nonlisted ones.
PROTECTING MINORITY INVESTORS 77 
Specifically, greater shareholder protec-tion 
is associated with larger capital 
markets,2 a lower cost of capital, higher 
cash flows, more efficient firm-level re-source 
allocation3 and greater firm val-uation4 
and performance.5 In addition, 
numerous studies suggest that inves-tors 
will charge higher rates to provide 
financing if they are not assured of an 
adequate return or if they fear expro-priation 
by corporate insiders.6 In other 
words, greater shareholder protection 
reduces the cost of equity by mitigating 
the agency problem between minority 
shareholders and managers in relation 
to diverging interests in the allocation 
of company resources. Several other 
studies highlight the positive impact 
on firm-level resource allocation and 
long-term returns of having audit com-mittees, 
of ensuring the independence 
of the board and of having different 
people serve as chief executive officer 
(CEO) and chair of the board.7 
WHAT DO THE INDICATORS 
NOW MEASURE? 
Since their inception, the Doing 
Business indicators on protecting 
minority investors have been measur-ing 
minority shareholder protections 
against directors’ misuse of corporate 
assets for personal gain. This is done 
by positing specific sets of assump-tions 
about a transaction between 
2 companies that involves a clear 
conflict of interest. This transaction 
is tested against the regulations of 
each of the 189 economies covered by 
Doing Business to determine who can 
approve the transaction, what disclo-sure 
must be made, who can be held 
liable if the transaction causes losses, 
what sanctions decision makers incur 
and what evidence shareholders can 
obtain to help them win their case if 
they choose to initiate a legal action 
in court. 
Doing Business continues this exercise 
and, starting in this year’s report, also 
measures other aspects of corporate 
law that are unrelated to this trans-action 
but that are also indicative of 
the strength of protection of minor-ity 
shareholders. This is particularly 
important to identify additional areas 
of potential improvement for policy 
makers and to provide researchers 
with a broader set of data for analyz-ing 
the relationship between corporate 
governance and economic outcomes 
(box 9.1). 
The fundamental development goal of 
promoting greater access to finance 
for entrepreneurs by encouraging 
regulation conducive to investment in 
capital markets remains the same— 
and is indeed reinforced by the provi-sion 
of data on a more comprehensive 
array of issues. To expand the coverage 
of the indicators, the Doing Business 
team first used academic literature 
and institutional reports to identify 
regulatory good practices that sup-port 
the relevant policy goals (box 
9.2). The team then selected those 
that could be objectively measured 
and independently justified, that offer 
variation across economies and that 
lend themselves to data collection and 
verification through the annual Doing 
BOX 9.1 What is new in the 
protecting minority investors 
indicators? 
ě Name changed from protect-ing 
investors to clarify what is 
measured by the indicators— 
and what is not. 
ě Three indices added to mea-sure 
protections in matters 
beyond conflicts of interest: 
extent of shareholder rights 
index, strength of governance 
structure index and extent of 
corporate transparency index. 
ě Ease of shareholder suits index 
expanded to take into account 
the allocation of legal expenses. 
See the data notes for a detailed 
description of changes and addi-tions 
to the methodology. 
Business questionnaire on minority 
investor protections. 
Previously the protecting minority 
investors indicators assessed 18 com-ponents 
of the quality of regulations. 
Now 20 additional components that 
strengthen the rights of minority 
investors are measured, by 3 new in-dices: 
the extent of shareholder rights 
FIGURE 9.1 Shareholder rights in listed and nonlisted companies are consistent in most 
economies 
0 10 20 30 40 50 60 70 80 90 100 
Shareholders can remove directors 
before the end of their term. 
A company must obtain shareholders’ 
approval to issue new shares. 
Shareholders approve the election and 
dismissal of the external auditor. 
Shareholders representing 10% can call 
for an extraordinary meeting. 
Shares can be freely traded prior 
to a major corporate action. 
Shareholders have preemption 
rights on new shares. 
Shareholders have the right to amend bylaws 
or statutes with a simple majority. 
Share of economies where good practice applies (%) 
Listed companies Nonlisted companies 
Note: The good practices are those measured by the extent of shareholder rights index. 
Source: Doing Business database.
78 DOING BUSINESS 2015 
index, the strength of governance 
structure index and the extent of cor-porate 
transparency index. In addition, 
a new component on the allocation of 
legal expenses associated with share-holder 
litigation has been added to 
the existing ease of shareholder suits 
index.8 
Extent of shareholder rights 
index 
The ability of shareholders to influence 
important corporate decisions—such 
BOX 9.2 Standard setters and good practices 
Corporate governance practices around the world have been converging over the past 2 decades. This convergence is 
being driven by a group of global standard setters to which governments look for guidance on how to strengthen their 
corporate governance, financial reporting and securities regulations. It is also being driven by capital market trends— 
such as the growing use of cross-listings and dual listings—that lead to the adoption of common regulatory practices. 
Corporate governance 
The Organisation for Economic Co-operation and Development (OECD) has been establishing increasingly influential good 
practices in such areas as related-party transactions, conflicts of interest, approval requirements and disclosure obliga-tions. 
The methodology for the protecting minority investors indicators promotes good practices recommended by the 
OECD Principles of Corporate Governance.a 
For example, the indicators measure whether the division of responsibilities among shareholders, officers, directors, out-side 
auditors and regulators is clearly articulated in cases of conflict of interest, in line with OECD principle 1 on corporate 
governance (ensuring the basis for an effective corporate governance framework). They also capture the rights of minority 
shareholders to be informed about, and to participate in, general shareholder meetings and decisions relating to extraor-dinary 
transactions, consistent with principle 2 (rights of shareholders and key ownership functions). They investigate rules 
relating to insider trading and whether all shareholders of the same series of a class are treated equally, in line with prin-ciple 
3 (equitable treatment of shareholders). And the extent of disclosure index directly follows principle 5 (disclosure and 
transparency), while the extent of director liability index echoes principle 6 (responsibilities of the board). 
Financial reporting and accounting 
The convergence of accounting standards has helped develop good practices in financial reporting. Two organizations— 
the International Accounting Standards Board, an independent body that sets the International Financial Reporting 
Standards (IFRS), and the Financial Accounting Standards Board (FASB), a U.S.-based organization that develops the 
Generally Accepted Accounting Principles (US GAAP)—have focused on driving this convergence over the past 15 years, 
issuing unified accounting standards for use by companies worldwide in both domestic and cross-border financial 
reporting. 
IFRS and US GAAP principles mandate strict financial disclosure with the aim of reducing information asymmetries be-tween 
companies and investors. An important benefit of a single set of high-quality, globally accepted accounting stan-dards 
is that investors can understand and compare the financial results of any company in the world. For this reason 
many jurisdictions incorporate IFRS and, to a lesser extent, US GAAP into their domestic reporting systems.b 
Securities regulations 
The International Organization of Securities Commissions (IOSCO) is an association of organizations that regulate se-curities 
markets. Its more than 200 members, which oversee more than 95% of the world’s securities markets, coopera-tively 
develop, implement and promote standards of regulation, oversight and enforcement to protect both investors and 
markets.c 
Another important driver of convergence in securities regulations is the increase in cross-listings and dual listings. To appeal 
to more risk-averse investors, companies in emerging markets are listing on more developed stock exchanges—such as the 
London Stock Exchange, the New York Stock Exchange or NASDAQ—in addition to their home country exchanges. Research 
has found that cross-listing on a U.S. stock exchange by a non-U.S. firm is associated with a significantly positive stock 
price reaction in the home market.d One reason is that cross-listing in the United States forces firms incorporated in juris-dictions 
with poor investor protection and enforcement systems to commit themselves to higher standards of corporate 
governance—and this increases the companies’ valuation by attracting otherwise reluctant foreign investors. 
a. OECD 2004. 
b. U.S. Securities and Exchange Commission 2012. 
c. “Advancing the SEC’s Mission through International Organizations,” U.S. Securities and Exchange Commission, http://www.sec.gov/about/offices/oia/oia_intlorg.shtml. For 
more information on IOSCO, see its website at http://www.iosco.org/about/. 
d. Huang, Elkinawy and Jain 2013.
PROTECTING MINORITY INVESTORS 79 
as appointing and removing board 
members, issuing new stock and 
amending the company’s bylaws—is 
key to avoiding abuses by corporate 
insiders. In measuring this aspect Doing 
Business gives particular attention to 
the allocation of power between share-holders 
and management; studies have 
shown that greater power in the hands 
of shareholders can lead to greater 
management attention to shareholder 
interests and therefore to increased 
investment (figure 9.1). 
Strength of governance 
structure index 
Legally mandating separation 
between corporate constituencies can 
directly minimize potential agency 
conflicts. For example, risks associated 
with conflicts of interest increase 
exponentially when a CEO can also be 
chair of the board of directors or when 
there is no requirement for a minimum 
number of independent directors. Doing 
Business tracks legal requirements 
that strengthen the governance 
structure of companies, such as board 
independence, functional separation, 
audit and compensation committees, 
and limits on cross-shareholding and 
subsidiary ownership (figure 9.2).9 
Extent of corporate 
transparency index 
Greater access to corporate information 
can have beneficial effects for firms. For 
example, where companies are required 
to disclose information about their 
finances, about the remuneration of 
their managers and directors and about 
other directorships they hold, research 
has found that this transparency 
improves corporate governance and 
lowers the cost of investment in 
capital markets.10 Doing Business uses 
questions relating to a company’s audit 
and financial statements to measure 
the extent to which companies are 
required to accurately present their 
business and financial condition, based 
on current knowledge and future 
expectations. Access to complete and 
accurate financial information is crucial 
to efficiently deploying investor capital 
(figure 9.3). 
Allocation of legal expenses in 
shareholder litigation 
Comprehensive rights are moot 
without effective ways to assert them. 
In optimal regulatory environments, 
enforcement is the duty both of 
efficient government agencies with 
adequate resources and of private 
shareholders willing to initiate legal 
actions whenever they suspect 
that a company in which they have 
invested is being mismanaged by 
corporate insiders. But such lawsuits, 
which often target companies (and 
directors or managers) with deeper 
pockets, are unlikely to occur unless 
FIGURE 9.2 Some areas of corporate governance continue to be overlooked in some 
economies 
0 10 20 30 40 50 60 70 80 90 100 
Changes to voting rights of shares must be 
approved only by the affected shareholders. 
A buyer must make an offer to all shareholders 
upon acquiring 50% of the company. 
A company must have a 
separate audit committee. 
A subsidiary is barred from acquiring 
shares issued by its parent company. 
The CEO is barred from also being the 
chair of the board of directors. 
The board of directors must include 
independent board members. 
Cross-shareholding between 2 
independent companies is limited to 10%. 
Share of economies where good practice applies (%) 
Listed companies Nonlisted companies 
Note: The good practices are those measured by the strength of governance structure index. 
Source: Doing Business database. 
FIGURE 9.3 Corporate transparency could be enhanced in some areas 
0 10 20 30 40 50 60 70 80 90 100 
Annual financial statements must 
be audited by an external auditor. 
Financial statements must 
contain explanatory notes. 
Audit reports must be 
disclosed to the public. 
A company must disclose ownership 
stakes representing 10%. 
Board members' other positions and 
directorships must be disclosed. 
Managerial compensation must be 
disclosed on an individual basis. 
Share of economies where good practice applies (%) 
Listed companies Nonlisted companies 
Note: The good practices are those measured by the extent of corporate transparency index. 
Source: Doing Business database.
80 DOING BUSINESS 2015 
shareholder plaintiffs can recover their 
legal expenses or the payment of their 
expenses can be made contingent on 
a successful outcome. The indicators 
now measure whether legal expenses 
incurred by shareholder plaintiffs 
can be charged to the company and 
whether plaintiffs can pay attorney 
fees depending on the damages they 
recover in court. 
WHAT DO THE RESULTS 
SHOW? 
Overall, OECD high-income economies 
have the strongest protections of 
minority shareholders as measured by 
Doing Business. These economies have 
the highest average score both on the 
extent of conflict of interest regulation 
index, which is the average of 3 exist-ing 
indices of minority shareholder 
protections, and on the extent of 
shareholder governance index, which 
is the average of the 3 new ones (table 
9.1).11 The average scores for all regions 
except South Asia reflect stronger 
performance on protections from con-flicts 
of interest than on shareholder 
rights in corporate governance as 
measured by Doing Business, with the 
largest gap between the 2 dimensions 
in East Asia and the Pacific and Latin 
America and the Caribbean. 
Worldwide, India, France, Albania, 
Croatia and Switzerland have among 
the highest scores on the 3 new in-dices. 
Coincidentally, both India and 
Switzerland introduced legislation in 
the past year that directly addressed 
some of the new components mea-sured— 
India with a new companies 
act and Switzerland with a federal 
ordinance on abusive compensation. 
Among the regions with lower average 
scores on the 3 new indices, Sub- 
Saharan Africa suffers from having 
less developed securities regulations 
and capital markets, while the re-sults 
in East Asia and the Pacific and 
TABLE 9.1 OECD high-income economies offer the strongest protections overall and 
as measured by the new indices 
0 50 100 150 200 
Latin America and the Caribbean 
are attributable mostly to outdated 
company laws and the heterogeneity 
of the economies in these regions. In 
East Asia and the Pacific financial hubs 
with strong securities commissions 
and corresponding regulations—such 
as Hong Kong SAR, China; Singapore; 
and Malaysia—score well, in contrast 
with some of the smaller Pacific islands. 
A similar phenomenon is apparent in 
Latin America and the Caribbean when 
comparing Brazil and Colombia, which 
have the region’s highest scores, with 
such economies as Haiti, Grenada and 
St. Lucia. 
Globally, the results are in line with the 
results of research in this area sug-gesting 
positive correlations between 
Region 
Average score (0–10) 
Extent of conflict 
of interest 
regulation index 
Extent of 
shareholder 
governance index 
Strength of minority 
investor protection 
index 
OECD high income 6.4 6.2 6.3 
Europe  Central Asia 6.0 5.9 5.9 
South Asia 5.2 5.3 5.3 
East Asia  Pacific 5.5 4.5 5.0 
Middle East  North Africa 4.8 4.6 4.7 
Latin America  Caribbean 5.1 4.1 4.6 
Sub-Saharan Africa 4.8 4.4 4.6 
Note: The strength of minority investor protection index is the average of the 2 other indices shown here. The extent 
of conflict of interest regulation index is the average of the extent of disclosure, extent of director liability and ease 
of shareholder suits indices. The extent of shareholder governance index is the average of the extent of shareholder 
rights, strength of governance structure and extent of corporate transparency indices. For details on how the indices 
are constructed, see the data notes. 
Source: Doing Business database. 
FIGURE 9.4 Greater protection of minority shareholders is associated with greater 
market capitalization 
Distance to frontier score for protecting 
minority investors (0–100), 2014 
Market capitalization of listed companies (% of GDP), 2012 
100 
80 
60 
40 
20 
Note: The correlation between the distance to frontier score for protecting minority investors and market 
capitalization as a percentage of GDP is 0.34. The relationship is significant at the 5% level after controlling for 
income per capita. The sample includes 116 economies for which data on market capitalization are available. 
Source: Doing Business database; World Bank, World Development Indicators database.
PROTECTING MINORITY INVESTORS 81 
FIGURE 9.5 OECD high-income economies systematically offer more protection for 
shareholders of listed companies than for shareholders of nonlisted ones 
Economies by relative level of shareholder protection 
in listed and nonlisted companies (%) 
100 
75 
50 
25 
0 
31 7 21 15 16 17 17 
OECD high 
income 
1 
South 
Asia 
5 5 
Europe  
Central Asia 
Middle East  
North Africa 
30 
15 
9 
Higher protection in listed companies Same protection in listed and nonlisted companies 
Note: Shareholder protection is as measured by the extent of shareholder rights, strength of governance structure 
and extent of corporate transparency indices. The numbers shown in the bars are the number of economies in each 
category within each region. 
Source: Doing Business database. 
minority investor protection and eco-nomic 
outcomes: economies that have 
stronger regulation of related-party 
transactions and a greater minority 
shareholder role in corporate gover-nance 
also tend to have, for example, 
East Asia  
Pacific 
Latin 
America  
Caribbean 
Sub-Saharan 
Africa 
higher market capitalization (figure 
9.4). 
Moreover, economies that tend to have 
greater shareholder involvement in cor-porate 
governance, as measured by the 
3 new indices, also tend to have greater 
protection of minority shareholders in 
prejudicial related-party transactions, 
as measured by the 3 existing indices. 
The results thus confirm the validity 
of using the quality of regulation of 
related-party transactions as a proxy 
for the overall quality of corporate 
governance. 
Unsurprisingly, the economies that 
score best on the new indices have 
active stock exchanges with the 
requisite legal frameworks and 
enforcement agencies. Among the 189 
economies covered by Doing Business, 
124 apply stronger regulations to listed 
companies than to nonlisted ones, so 
that shareholders of listed companies 
are more protected.12 In all OECD high-income 
economies the regulations that 
apply to listed companies are more 
protective of minority shareholders, 
consistent with the more developed 
capital markets in these economies 
(figure 9.5). Sub-Saharan Africa is 
the only region where the majority of 
economies provide the same level of 
protection for minority shareholders 
in both types of companies, further 
confirming the link with the level of 
development of capital markets. 
But applying the same standards to 
both types of companies does not 
necessarily mean better overall pro-tection 
of shareholders. Somewhat 
counterintuitively, data show that the 
larger the gap, the better the overall 
protection: minority investors are 
more protected in economies that 
distinguish between shareholders 
of listed companies and sharehold-ers 
of nonlisted ones (figure 9.6). 
Indeed, economies that distinguish 
between these shareholder groups 
have adopted 55% on average of the 
good practices captured by the 3 new 
indices—while those that do not dis-tinguish 
have adopted 39% on average. 
FIGURE 9.6 Minority investors are more protected overall in economies that distinguish 
between shareholders of listed companies and shareholders of nonlisted ones 
Average share of good practices measured by 
the 3 new indices that apply (%) 
80 
70 
60 
50 
40 
30 
20 
10 
0 
Sub-Saharan 
Africa 
Latin 
America 
 Caribbean 
Middle East  
North Africa 
East Asia  
Pacific 
South 
Asia 
Europe  
Central Asia 
OECD high 
income 
Listed companies Nonlisted companies 
Note: The 3 new indices are the extent of shareholder rights, strength of governance structure and extent of corporate 
transparency indices. 
Source: Doing Business database.
82 DOING BUSINESS 2015 
CONCLUSION 
Results on the 3 new indices highlight 
great variation across the 189 econo-mies 
covered in the rights, responsibili-ties 
and protections afforded to minority 
shareholders, whether they are invest-ing 
in a nonlisted company or in a listed 
one. The new data set brings attention 
to areas of corporate governance that 
are often overlooked by policy makers. 
It also sheds light on the protection of 
shareholders in nonlisted companies, 
an aspect on which data are seldom 
collected and yet that could prove to be 
a particularly important area of legisla-tion 
and source of economic growth in 
economies with less developed stock 
exchanges and capital markets. 
More generally, the new indices should 
prove to be helpful in moving beyond 
a focus on the regulation of related-party 
transactions and identifying a 
broader array of features that could be 
lacking in the corporate law and securi-ties 
regulations of some economies— 
contributing to sounder regulations 
that both protect minority investors 
and enhance entrepreneurs’ access to 
equity finance. 
NOTES 
This case study was written by Nadine Abi 
Chakra and Hervé Kaddoura. 
1. Djankov, La Porta and others 2008. 
Private benefits of control are defined as 
the economic advantages of a majority 
ownership stake. 
2. Black and others 2010; Dharmapala and 
Khanna 2013. 
3. McLean, Zhang and Zhao 2012. 
4. Cremers and Ferrell forthcoming; 
Balasubramanian, Black and Khanna 2010; 
Caixe and Krauter 2013. 
5. Lima and Sanvicente 2013. 
6. Chen, Chen and Wei 2011. 
7. Malhotra, Poteau and Fritz 2013; Black and 
Kim 2012; Guo and Masulis 2013; Lo, Wong 
and Firth 2010; Hodgson and Ruel 2012. 
8. See the data notes for the full list of 
components added this year. 
9. Cross-shareholding refers to 2 independent 
companies acquiring shares in each other. 
10. Gilson 2000; Lima and Sanvicente 2013; 
Bartha, Konchitchkib and Landsmanc 2013; 
Lang, Lins and Maffett 2012. 
11. The 3 existing indices are the extent of 
disclosure, extent of director liability and 
ease of shareholder suits indices. 
12. For the purposes of the protecting minority 
investors indicators, nonlisted companies 
are defined as joint stock companies before 
they are listed on any stock exchange, 
or their functional equivalent under the 
respective legislation of the economies 
covered by Doing Business, and do not 
include other types of companies such 
as limited liability companies or sole 
proprietorships.
Doing Business 2015 
Going Beyond Efficiency 
Paying taxes 
Trends before and after the financial crisis 
Taxes matter for the economy. 
They provide the sustainable 
funding needed for social 
programs and public investments 
to promote economic growth and 
development and build a prosperous 
and orderly society. But policy makers 
face a difficult challenge in formulat-ing 
good tax policies: they need to 
find the right balance between raising 
revenue and ensuring that tax rates 
and the administrative burden of tax 
compliance do not deter participation 
in the system or discourage business 
activity. This balancing act is intensi-fied 
during periods of crisis. In an 
economic downturn some categories 
of public spending may automati-cally 
rise, putting pressure on deficits. 
Governments may at times need to 
deliver tax-based stimulus packages 
while also providing reassurance to 
markets that deficits will be reversed 
and public debt contained. 
WHY TAX POLICY MATTERS 
DURING CRISES 
The global financial crisis of 2008–09 
had a dramatic impact on national tax 
revenue and led to a sharp increase in 
deficits and public debt. The decline in 
revenue began in 2008, when general 
government revenue fell by an average 
of 0.7% of GDP worldwide. Revenue de-clined 
by another 1.1% of GDP in 2009.1 
The financial crisis led to a shrinking 
of economic activity and trade in most 
economies. 
Fiscal measures were part of the policy 
toolkit that governments brought to 
bear in supporting the recovery. Policy 
makers in most economies applied 
measures aimed at improving revenue 
collection while keeping the taxes lev-ied 
on businesses and households as 
low as possible, trying to strike a bal-ance 
between reducing the disincentive 
effects of high taxes and generating 
adequate resources to fund essential 
expenditures.2 Governments generally 
reduced the rates and broadened the 
base for corporate income tax while in-creasing 
the rates for the consumption 
tax or value added tax (VAT).3 
In the European Union, for example, 
most member countries raised per-sonal 
income tax rates—often tem-porarily, 
through general surcharges 
or through solidarity contributions 
from high-income earners. In addi-tion, 
several EU members reduced 
their corporate income tax rate and 
changed corporate tax bases. Most of 
these changes were aimed at providing 
tax relief for investment in physical 
capital or research and development 
(RD) while limiting the deductibility of 
other items. By contrast, EU members 
commonly increased VAT rates along 
with statutory rates for energy and 
environmental taxes and for alcohol 
and tobacco taxes.4 Some govern-ments 
opted to broaden the VAT base 
by applying VAT to goods and services 
that had previously been subject to 
a zero rate and levying the standard 
VAT rate on products that had had a 
reduced VAT rate.5 Unifying VAT rates 
ƒ Over the 9-year period ending in 
2012, the global average total tax 
rate as measured by Doing Business 
fell by 9.1 percentage points. Its 
rate of decline was fastest during 
the global financial crisis period 
(2008–10), averaging 1.8 percentage 
points a year, then started slowing 
in 2011. 
ƒ The average profit tax rate dropped 
sharply during the crisis period and 
then started to increase slightly 
in 2012. The average rate for labor 
taxes and mandatory contributions 
was stable throughout the 9-year 
period. 
ƒ The administrative burden of tax 
compliance has been steadily easing 
since 2004 with the growing use 
of electronic systems for filing and 
paying taxes. 
ƒ During the financial crisis there 
was an increase in the number of 
tax reforms. The pace of reform 
accelerated with the onset of the 
crisis, then slowed in subsequent 
periods.
84 DOING BUSINESS 2015 
across all goods and services increases 
revenue and reduces compliance and 
administrative costs.6 
Along with falling revenue, the global 
financial and economic crisis also led to 
growing tax compliance risks in some 
economies. Compliance with tax obli-gations 
and collection of tax revenue 
are important to support social pro-grams 
and services, for example. But 
in an economic downturn businesses 
tend to underreport tax liabilities, 
underpay the taxes due, fail to file their 
tax returns on time and even engage 
in transactions in the informal sector.7 
Many economies redesigned their tax 
systems during that period with the 
objective of easing compliance with tax 
obligations. 
BEFORE AND AFTER THE 
CRISIS—A 9-YEAR GLOBAL 
TAX PROFILE 
Doing Business has been monitoring 
how governments tax businesses 
through its paying taxes indicators for 
9 years, looking at both tax admin-istration 
and tax rates. The data give 
interesting insights into the tax policies 
implemented during the financial crisis 
of 2008–09. Doing Business looks at 
tax systems from the perspective of 
the business, through 3 indicators. 
The total tax rate measures all the tax-es 
and mandatory contributions that 
a standardized medium-size domestic 
company must pay in a given year as 
a percentage of its commercial profit.8 
These taxes and contributions include 
corporate income tax, labor taxes and 
mandatory contributions, property 
taxes, vehicle taxes, capital gains tax, 
environmental taxes and a variety of 
smaller taxes. The taxes withheld (such 
as personal income tax) or collected by 
the company and remitted to the tax 
authorities (such as VAT) but not borne 
by the company are excluded from the 
total tax rate calculation. 
Two other indicators measure the com-plexity 
of an economy’s tax compliance 
system. The number of payments 
reflects the total number of taxes 
and contributions paid, the method of 
payment, the frequency of filing and 
payment, and the number of agencies 
involved. The time indicator measures 
the hours per year required to comply 
with 3 major taxes: corporate income 
tax, labor taxes and mandatory contri-butions, 
and VAT or sales tax. 
The indicators show that for businesses 
around the world, paying taxes became 
easier and less costly over the 9 years 
from 2004 through 2012. 
Falling tax cost for businesses 
Globally, the total tax rate for the 
Doing Business case study company 
averaged 43.1% of commercial profit in 
2012.9 Over the 9-year period ending 
that year, the average total tax rate 
fell by 9.1 percentage points—around 
1 percentage point a year. Its rate of 
decline was fastest during the crisis 
period (2008–10), averaging 1.8 per-centage 
points a year, then started 
slowing in 2011. The total tax rate fell 
by an average of 0.3 percentage points 
in 2011. 
The average rate for all 3 types of taxes 
included in the total tax rate—profit, 
labor and “other” taxes—also fell over 
the 9 years (figure 10.1).10 “Other” taxes 
decreased the most, by 5.9 percentage 
points—followed by profit taxes (2.7 
percentage points) and labor taxes (0.5 
percentage points). 
The main driver of the drop in “other” 
taxes was the replacement of the 
cascading sales tax with VAT by a 
number of economies, many of them in 
Sub-Saharan Africa. Seven economies 
made this change during the 9 years, 
6 of them during the crisis period.11 This 
shift substantially reduces the tax cost 
for businesses: while a cascading sales 
tax is a turnover tax applied to the full 
value at every stage of production, a 
VAT is imposed only on the value added 
at each stage, and the final consumers 
bear the burden. 
While the total tax rate fell in all 
regions over the 9-year period, 
Sub-Saharan Africa had the biggest 
FIGURE 10.1 A global trend of steady decline in the total tax rate 
Global average total tax rate 
(% of commercial profit) 
Profit tax Labor tax Other taxes 
20 
19 
18 
17 
16 
15 
14 
13 
12 
11 
10 
2004 2005 2006 2007 2008 2009 2010 2011 2012 
Note: The data refer to the 174 economies included in DB2006 (2004). The Bahamas, Bahrain, Barbados, Brunei 
Darussalam, Cyprus, Kosovo, Liberia, Libya, Luxembourg, Malta, Montenegro, Myanmar, Qatar, San Marino and South 
Sudan were added in subsequent years. 
Source: Doing Business database.
PAYING TAXES 85 
decline. Its average total tax rate 
dropped by almost 17 percentage 
points between 2004 and 2012. This 
aligned the region more closely with 
the rest of the world, though its aver-age 
total tax rate still remains the 
highest, at 53.4% in 2012 (figure 10.2).12 
In addition, many African economies 
lowered rates for the profit tax, reduc-ing 
its share in the total tax rate. The 
size of the tax cost for businesses 
matters for investment and growth. 
Where taxes are high, businesses are 
more inclined to opt out of the formal 
sector. Given the disincentive effects 
associated with very high tax rates, 
the continual decline in the total tax 
rate has been a good trend for Africa. 
Other economies introduced new taxes 
during the 9-year period. For example, 
in 2010 Hungary introduced a sector-specific 
surtax on business activity in 
retail, telecommunications and energy 
supply. The new tax remained in force 
until December 31, 2012. In 2009 
Romania introduced a minimum 
income tax. Also in 2009, the Kyrgyz 
Republic introduced a new real estate 
tax that is set at 14,000 soms (about 
$270) per square meter and further 
adjusted depending on the city loca-tion, 
the property’s location within the 
city and the type of business. 
The average profit tax rate in most 
economies fell consistently between 
2004 and 2010, dropping most sharp-ly 
during the crisis period (2008–10), 
and then started to increase slightly 
in 2011 and 2012. The average rate 
for labor taxes and mandatory con-tributions 
remained stable throughout 
the 9-year period regardless of the 
financial crisis. In several economies 
this reflects concerns on the part of 
the authorities about the impact of 
aging populations and the need to 
strengthen the financial situation of 
pension systems. 
The 9-year trends for the 3 types of 
taxes included in the total tax rate are 
FIGURE 10.2 Among regions, Sub-Saharan Africa had the biggest reduction in the 
total tax rate 
Regional average total tax rate 
(% of commercial profit) 
80 
70 
60 
50 
40 
30 
20 
Sub-Saharan Africa 
Latin America  Caribbean South Asia Middle East  North Africa 
reflected in the changing composition 
of this rate. On average, labor taxes 
and mandatory contributions account 
for the largest share of the global total 
tax rate today, having risen from 32% 
of the total tax rate in 2004 to almost 
38% in 2012. The profit tax share rose 
slightly, while “other” taxes fell from 
10 
2004 2005 2006 2007 2008 2009 2010 2011 2012 
Europe  Central Asia East Asia  Pacific 
OECD high income 
Note: The data refer to the 174 economies included in DB2006 (2004). The Bahamas, Bahrain, Barbados, Brunei 
Darussalam, Cyprus, Kosovo, Liberia, Libya, Luxembourg, Malta, Montenegro, Myanmar, Qatar, San Marino and South 
Sudan were added in subsequent years. 
Source: Doing Business database. 
BOX 10.1 Using technology to make tax compliance easier 
Rolling out new information and communication technologies for filing and 
paying taxes and then educating taxpayers and tax officials in their use are 
not easy tasks for any government. But electronic tax systems, if implement-ed 
well and used by most taxpayers, benefit both tax authorities and firms. 
For tax authorities, electronic filing lightens workloads and reduces opera-tional 
costs such as for processing, handling and storing tax returns. This al-lows 
administrative resources to be allocated to other tasks, such as auditing 
or providing customer services. 
Electronic filing is also more convenient for users. It reduces the time and cost 
required to comply with tax obligations and eliminates the need for taxpayers 
to wait in line at the tax office.a It also allows faster refunds. And it can lead 
to a lower rate of errors. 
Electronic systems for filing and paying taxes have become more common 
worldwide. Of the 314 reforms making it easier or less costly to pay taxes 
that Doing Business has recorded since 2004, 88 included the introduction 
or enhancement of online filing and payment systems. These and other im-provements 
to simplify tax compliance reduced the administrative burden to 
comply with tax obligations. By 2012, 76 economies had fully implemented 
electronic systems for filing and paying taxes as measured by Doing Business. 
OECD high-income economies have the largest representation in this group. 
a. Bird and Zolt 2008.
86 DOING BUSINESS 2015 
Global average time 
(hours per year) 
130 
120 
110 
100 
90 
80 
70 
Global average 
payments (number) 
18 
16 
14 
12 
10 
8 
6 
4 
2 
32% of the total in 2004 to only 25% 
in 2012. 
Easing of the tax 
administrative burden 
To comply with tax obligations in 2012, 
the Doing Business case study company 
would have made 26.7 payments and 
put in 268 hours (nearly 7 weeks) on 
average. This reflects an easing of the 
administrative burden—with 7 fewer 
payments and 62 fewer hours than in 
2004. 
Consumption taxes have consistently 
been the most time consuming, re-quiring 
106 hours in 2012, with labor 
taxes and mandatory contributions 
not far behind (figure 10.3). Corporate 
income tax takes the least time. While 
corporate income tax can be complex, 
it often requires only one annual return. 
Labor and consumption taxes are often 
filed and paid monthly and involve re-petitive 
calculations for each employee 
and transaction. And consumption 
taxes in the form of VAT require filing 
information on both input and output 
ledgers. 
The administrative burden for all the 
types of taxes eased over the 9 years. 
But it eased the most for labor taxes 
and mandatory contributions, with the 
time for compliance dropping by 23 
hours on average and the number of 
payments by 4. This is thanks mainly to 
the introduction of electronic systems 
for filing and paying taxes and to ad-ministrative 
changes merging the filing 
and payment of labor taxes levied on 
the same tax base into one return and 
one payment. For labor and consump-tion 
taxes, with their requirements for 
repetitive calculations, the use of ac-counting 
software and electronic filing 
and payment systems can offer great 
potential time savings (box 10.1). 
In contrast to the total tax rate, the 
time for compliance declined the most 
just before the onset of the financial 
crisis for all 3 types of taxes: profit 
tax, labor tax and consumption taxes. 
The number of payments decreased 
steadily over the 9-year period. 
PATTERNS IN TAX 
REFORMS DURING THE 
CRISIS PERIOD 
Over the 9-year period ending in 2012, 
tax reforms peaked in 2008. Doing 
Business recorded 118 changes imple-mented 
that year making it easier or 
less costly to pay taxes (figure 10.4).13 
The pace of reform slowed in the period 
immediately after the crisis: in 2011 
Doing Business recorded only 43 such 
changes. 
Changes making it easier or 
less costly to pay taxes 
During the crisis period (2008–10) the 
most common changes affecting the 
paying taxes indicators were those 
cutting the corporate income tax rate 
(figure 10.5). Doing Business recorded 
58 such changes during the 3-year 
FIGURE 10.3 The administrative burden of compliance has eased for all types 
of taxes 
60 
2004 2005 2006 2007 2008 2009 2010 2011 2012 
Profit tax Labor tax Consumption taxes (sales and VAT) 
2004 2005 2006 2007 2008 2009 2010 2011 2012 
Profit tax Labor tax Other taxes 
0 
Note: The data refer to the 174 economies included in DB2006 (2004). The Bahamas, Bahrain, Barbados, Brunei 
Darussalam, Cyprus, Kosovo, Liberia, Libya, Luxembourg, Malta, Montenegro, Myanmar, Qatar, San Marino and South 
Sudan were added in subsequent years. 
Source: Doing Business database.
PAYING TAXES 87 
period. The next most common chang-es 
were those enhancing or introducing 
electronic systems for filing and paying 
taxes online—38 such changes were 
reported in total. These were aimed at 
easing the administrative burden of tax 
compliance to counter the greater risk 
of tax evasion during economic down-turns. 
Also common were changes to 
tax deductibility and depreciation rules 
that would respectively lower the tax 
cost for businesses and provide them 
with greater flexibility in planning their 
cash flow (with a total of 33 recorded). 
Reducing the corporate income tax 
rate was a change that many gov-ernments 
made during the financial 
crisis (box 10.2). In 2008–10 around 
47 economies cut their rates. Moldova 
temporarily reduced its rate from 15% 
to 0%, effectively eliminating any tax on 
profits in 2008–11, then set the rate at 
12% from January 1, 2012. Some econo-mies 
(Canada, Fiji, Greece, Indonesia, 
Slovenia, the United Kingdom) reduced 
their rates gradually, over several 
years. Others introduced temporary 
additional rate reductions. Vietnam cut 
its corporate income tax rate from 25% 
to 17.5% in 2009 as part of a stimulus 
package for small and medium-size 
businesses, then restored the standard 
rate for the following year. 
Other economies abolished their 
minimum income tax (France, Timor- 
Leste). Romania, having introduced 
a minimum income tax in May 2009, 
abolished it in October 2010. Some 
economies amended their income tax 
brackets rather than reducing rates. 
Portugal introduced tax brackets for 
profit tax in January 2009. Taxable 
corporate income up to €12,500 be-came 
subject to half the standard tax 
rate, while all income over this amount 
was taxed at the standard 25% rate. 
To stimulate investment in specific 
areas, some economies increased the 
percentage of allowance that could be 
applied on certain assets or allowed the 
FIGURE 10.4 An accelerating pace of tax reform during the global financial crisis 
Number of changes making it easier or less costly to pay 
taxes as measured by Doing Business 
Changes making it easier or less costly to pay 
taxes as measured by Doing Business, by type 
deduction of more expenses. Thailand, 
for example, encouraged capital invest-ment 
with accelerated depreciation for 
equipment and machinery acquired 
before December 2010. Australia 
introduced an investment allow-ance— 
an up-front deduction of 30% 
of the cost of new plant contracted 
for between January 1, 2009, and June 
30, 2009, and installed by June 30, 
East Asia  Pacific 
Europe  Central Asia 
OECD high income 
Latin America  Caribbean 
Middle East  North Africa 
South Asia 
Sub-Saharan Africa 
120 
100 
80 
60 
40 
20 
0 
2004 2005 2006 2007 2008 2009 2010 2011 2012 
Note: The data refer to the 174 economies included in DB2006 (2004). The Bahamas, Bahrain, Barbados, Brunei 
Darussalam, Cyprus, Kosovo, Liberia, Libya, Luxembourg, Malta, Montenegro, Myanmar, Qatar, San Marino and South 
Sudan were added in subsequent years. The changes shown for each year are those recorded from June 1 of that year 
to June 1 of the following year. 
Source: Doing Business database. 
FIGURE 10.5 During the crisis period many economies cut the corporate income tax 
rate while continuing to improve tax administration 
Abolished or merged taxes 
Introduced or enhanced electronic system 
Reduced labor taxes 
Made changes in tax depreciation or 
deductibility rules that reduced tax cost 
Reduced corporate income tax rate 
80 
70 
60 
50 
40 
30 
20 
10 
0 
2004 2005 2006 2007 2008 2009 2010 2011 2012 
Note: The data refer to the 174 economies included in DB2006 (2004). The Bahamas, Bahrain, Barbados, Brunei 
Darussalam, Cyprus, Kosovo, Liberia, Libya, Luxembourg, Malta, Montenegro, Myanmar, Qatar, San Marino and South 
Sudan were added in subsequent years. The changes shown for each year are those recorded from June 1 of that year 
to June 1 of the following year. The figure does not show all types of changes making it easier or less costly to pay 
taxes recorded by Doing Business. 
Source: Doing Business database.
88 DOING BUSINESS 2015 
BOX 10.2 The Republic of Korea—a comprehensive approach to supporting an economy in recession 
The 2008 global credit crunch and ensuing economic recession hit Korea hard. Heavily dependent on manufactured exports 
and closely integrated with other developed markets through both trade and financial links, the Korean economy contracted 
sharply in 2009 and public finances came under pressure. Reflecting diminished confidence in the short-term outlook, the 
value of the Korean won fell sharply. This helped lead to rapid consideration of a package of measures aimed at putting in 
place the conditions for a recovery. 
The government set priorities for tax policy: supporting low- and middle-income taxpayers, facilitating job creation, pro-moting 
investment and sustainable growth, rationalizing the tax system and ensuring the sustainability of public finances.a 
Measures to support low- and middle-income taxpayers included changes in both individual and corporate taxation (such 
as a special tax credit for small and medium-size enterprises). To support the continuation of family businesses, the govern-ment 
reduced the inheritance tax and allowed deductions of up to 10 billion won (about $10 million) when a small or medium-size 
enterprise is inherited, extending this to 50 billion won (about $50 million) in 2014. To help self-employed individuals 
who were forced to close their businesses in 2009, the government offered an exemption from paying delinquent taxes until 
the end of 2010 for those starting a new business or getting a new job. The exemption was further extended until the end of 
2014. To support local business development, it gave a corporate income tax deduction of 100% for the first 5 years and 50% 
for the next 2 years to companies relocating to Korea from abroad. To support future growth, it introduced RD incentives 
for companies and also increased the deductibility of education expenses for individuals. 
Korea also accelerated the implementation of some tax changes already in the pipeline. It reduced the corporate income tax 
rate for taxable income below 200 million won ($197,972) from 13% to 11% in 2008 and to 10% starting in 2010. For the up-per 
bracket (above 200 million won) it reduced the rate from 25% to 22% in 2009 and to 20% in 2010 and thereafter. Korea 
reduced the personal income tax rate by 1 percentage point for the middle bracket and by 2 percentage points for the top 
bracket while also increasing allowable deductions. 
In addition, Korea strengthened tax compliance regulation, imposing penalties on high-income earners for failure to issue 
cash receipts and introducing more severe punishment for frequent and high-profile tax evaders. It also increased the stat-ute 
2010. Austria introduced accelerated 
depreciation (30% for the first year) 
for tangible fixed assets produced or 
acquired within a specified time period. 
Spain introduced unlimited tax depre-ciation 
for investments made in new 
fixed assets and immovable property 
in 2009 and 2010, later extending this 
to investments made before December 
31, 2012. 
Changes making it more 
complex or costly to pay taxes 
Some economies introduced new 
taxes (16 in total in 2008–10). These 
were mostly small taxes such as en-vironmental 
taxes, vehicle taxes, road 
taxes and other social taxes. Finland 
increased energy taxes while cutting 
the income tax rate during the reces-sion. 
In 2011 Italy raised VAT and local 
property tax rates, though it also cut 
labor and corporate income tax rates. 
In 2010 Pakistan increased the VAT 
rate from 16% to 17% and raised the 
minimum tax rate from 0.5% to 1% 
levied on turnover. 
Other tax changes involved increases 
in labor taxes and mandatory contri-butions 
borne by the employer (figure 
10.6). Estonia increased the unemploy-ment 
insurance contribution rate twice 
during 2009, from 0.3% to 1% on June 1, 
2009, and to 1.4% on August 1, 2009. 
Iceland increased the social security 
contribution rate for employers from 
5.34% to 7% in July 2009—and the pen-sion 
contribution rate from 6% to 7%. 
CONCLUSION 
The financial crisis had a substantial 
impact on national tax revenue, leading 
in many economies to larger govern-ment 
deficits and higher levels of public 
debt. This may have helped trigger 
efforts to redesign tax systems, with 
governments aiming to strike the right 
balance between raising additional rev-enue 
and avoiding a greater tax burden 
on businesses. 
of limitation for prosecution for certain tax crimes. 
Supporters of Korea’s approach believe that it enabled the country to recover faster and more strongly from the global crisis 
than most other OECD countries.b Korea was one of only a handful of OECD countries that actually registered a reduction in 
public debt levels over the period 2009–13. Most other advanced economies saw rapid increases in public indebtedness as a 
result of policy interventions to deal with the effects of the financial crisis.c 
a. Korea, Ministry of Strategy and Finance 2012. 
b. OECD 2012. 
c. International Monetary Fund, World Economic Outlook Database.
PAYING TAXES 89 
Changes making it more complex or costly to pay 
taxes as measured by Doing Business, by type 
The data collected for the paying taxes 
indicators show a clear trend of in-creasing 
changes to tax policies during 
the crisis. Among the most common 
changes as measured by the indica-tors 
were those cutting the corporate 
income tax rate while increasing VAT 
rates and those enhancing or intro-ducing 
electronic systems for filing 
and paying taxes. Changes easing the 
administrative burden of tax compli-ance 
countered the greater risk of tax 
evasion that arises during economic 
downturns. In addition, governments 
introduced new tax deductibility and 
depreciation rules that would lower the 
tax cost for businesses, provide them 
with greater flexibility in planning their 
cash flow and stimulate investment in 
specific areas. 
NOTES 
This case study was written by Michelle- 
Christine Hanf, Joanna Nasr and Nadia Novik. 
1. World Bank, World Development Indicators 
database. 
2. OECD 2010b. 
3. Buti and Zourek 2012. 
4. Buti and Zourek 2012. 
5. Buti and Zourek 2012. 
6. OECD 2010a. 
7. Brondolo 2009. 
8. Commercial profit is net profit before all 
taxes borne. It differs from the conventional 
profit before tax, reported in financial 
statements. In computing profit before 
tax, many of the taxes borne by a firm are 
deductible. In computing commercial profit, 
these taxes are not deductible. Commercial 
profit therefore presents a clear picture of 
the actual profit of a business before any 
of the taxes it bears in the course of the 
fiscal year. It is computed as sales minus 
cost of goods sold, minus gross salaries, 
minus administrative expenses, minus 
other expenses, minus provisions, plus 
capital gains (from the property sale) minus 
interest expense, plus interest income and 
minus commercial depreciation. To compute 
the commercial depreciation, a straight-line 
depreciation method is applied, with the 
following rates: 0% for the land, 5% for the 
building, 10% for the machinery, 33% for the 
computers, 20% for the office equipment, 
20% for the truck and 10% for business 
development expenses. Commercial profit 
amounts to 59.4 times income per capita. 
9. This is an unweighted average across 189 
economies. 
10. The terms profit tax and corporate income 
tax are used interchangeably in this case 
study. “Other” taxes include small taxes 
such as vehicle taxes, environmental 
taxes, road taxes, property taxes, property 
transfer fees, taxes on checks and 
cascading sales tax. 
11. The 7 economies are Burundi, the 
Democratic Republic of Congo, Djibouti, The 
Gambia, the Seychelles, Sierra Leone and 
the Republic of Yemen. 
12. This is the average for all Sub-Saharan 
African economies included in Doing 
Business 2013 (45 in total). 
13. These reforms include both major and minor 
reforms as classified by Doing Business. 
These include changes in statutory rates, 
changes in deductibility of expenses and 
depreciation rules, administrative changes 
affecting time to comply with 3 major 
taxes (corporate income tax, labor taxes 
and mandatory contributions, and VAT or 
sales tax) and introduction or elimination of 
taxes. Under the paying taxes methodology, 
the tax system assessment for calendar 
year 2008 covers reforms recorded from 
June 1, 2008, to June 1, 2009, a period 
that includes the start of the financial 
crisis in September 2008 and the months 
immediately following it. 
FIGURE 10.6 Among other changes to tax systems during the crisis period, those 
introducing new taxes were the most common 
Introduced new tax 
Increased labor taxes 
Made changes in tax depreciation or 
deductibility rules that increased tax cost 
Increased corporate income tax rate 
18 
16 
14 
12 
10 
8 
6 
4 
2 
0 
2004 2005 2006 2007 2008 2009 2010 2011 2012 
Note: The data refer to the 174 economies included in DB2006 (2004). The Bahamas, Bahrain, Barbados, Brunei Darussalam, 
Cyprus, Kosovo, Liberia, Libya, Luxembourg, Malta, Montenegro, Myanmar, Qatar, San Marino and South Sudan were 
added in subsequent years. The changes shown for each year are those recorded from June 1 of that year to June 1 of the 
following year. The figure does not show all types of changes making it more complex or costly to pay taxes recorded by 
Doing Business. 
Source: Doing Business database.
Doing Business 2015 
Going Beyond Efficiency 
Enforcing contracts 
How judicial efficiency supports freedom of contract 
Freedom of contract is the abil-ity 
of adults and groups—such 
as corporations and other legal 
entities—to freely decide whether to 
enter into an enforceable agreement and 
to determine the rights and obligations 
of their bargain. This freedom is essential 
to an efficient economy: without it, and 
without enforcement of contracts, there 
would be little stability in financial ar-rangements, 
and uncertainty and lack 
of trust would discourage people from 
participating in economic life. 
This case study explores what freedom 
of contract means and examines how 
it is regulated in a sample of 34 econo-mies 
belonging to different regions and 
income groups, chosen mostly on the 
basis of the quality of the data col-lected 
by the Doing Business team in 
each economy.1 It also looks at judicial 
efficiency in contract resolution in the 
same 34 economies, using data for 
the enforcing contracts indicators 
as a proxy for judicial efficiency. Even 
substantial freedom of contract could 
become irrelevant without effective 
mechanisms for resolving commercial 
disputes, because firms would find 
themselves operating in an environ-ment 
where compliance with contrac-tual 
obligations is not the norm.2 As in 
previous years, the ranking on the ease 
of enforcing contracts continues to 
be based exclusively on the time, cost 
and procedural complexity of resolving 
commercial disputes before local first-instance 
courts. This year’s research 
on freedom of contract is a one-time 
exercise that will not be replicated in 
future editions of the report and has no 
implications for the data or rankings 
for enforcing contracts. Additionally, 
in carrying out this exercise the team 
does not intend to advocate in favor of 
more or less freedom of contract but 
instead aims to provide an overview of 
local regulations. 
In regulating freedom of contract, 
economies worldwide have had to 
draw the line between very extensive 
and very limited freedom of contract 
(figure 11.1). Most have drawn the line 
somewhere in between. Where freedom 
of contract is very narrowly regulated, 
most transactions fall within the strict 
schemes dictated by the law, leaving 
the contracting parties with limited 
negotiating power. But where it is not 
narrowly regulated, the law contains 
only the most common limitations 
(such as for public policy reasons and 
to prevent fraud and duress), allow-ing 
the parties to freely negotiate the 
terms of their agreement. 
Where there are few limitations to 
freedom of contract, 2 capable and 
consenting adults would be able to 
conclude a 10-year loan contract with 
an interest rate of 50% or even contract 
to sell a house worth $1 million for a 
penny. But they would not be able to 
circumvent public policy limitations 
and conclude a contract by which, for 
example, one of the parties sells himself 
as a slave or forces the other into an 
unwanted agreement—limitations of 
this sort have become widely accepted 
in modern law. While most would agree 
ƒ In regulating freedom of contract, 
authorities around the world have 
had to strike a balance between 
the desire to give contracting 
parties the ability to enter into 
mutually beneficial arrangements 
and the need to provide adequate 
safeguards against possible abuse. 
ƒ Worldwide, the most common 
limitations to freedom of contract 
stem from local legislation, through 
which the government attempts to 
draw a boundary between the use 
and misuse of bargaining power. 
Other limitations stem from the 
courts, which play a vital role in 
shaping freedom of contract by 
deciding whether or not to enforce 
certain agreements. 
ƒ In a sample of 34 economies, none 
allow the parties to a contract to 
exclude liability for gross negligence 
or for damages resulting in personal 
injury. Similarly, all of the economies 
consider contracts void or voidable 
if concluded in contravention of 
public policy or under duress, fraud 
or coercion. Only 4—the Democratic 
Republic of Congo, Pakistan, the 
Philippines and Sri Lanka—set no 
statutory limit on interest rates. 
Almost half (14) explicitly prohibit 
covenants restricting the alienation 
of real property. 
ƒ Even where there is considerable 
freedom of contract, slow resolution 
of contract disputes can impose 
implicit limitations. Without 
reasonably expeditious dispute 
resolution, the meaning of freedom 
of contract can be greatly eroded.
ENFORCING CONTRACTS 91 
that contracts contravening public 
policy should be illegitimate, some 
would disagree on whether the first 2 
contracts should be enforced. 
HOW THE LITERATURE 
DEFINES FREEDOM OF 
CONTRACT 
In the legal and economic literature 
there is wide consensus on a definition 
of freedom of contract, intended to 
be the power of contracting parties 
to freely determine the content of 
their agreement without interference 
from the government or from other 
individuals.3 The concept is generally 
given both a negative and a positive 
meaning. Negative freedom of contract 
is freedom from interference by the 
government or by other individuals, 
while positive freedom of contract is 
the ability of parties to freely deter-mine 
the content of an agreement.4 
While there is broad agreement on 
a general definition, every economy 
limits freedom of contract in different 
ways. In regulating these limitations, 
the main debate has centered on the 
role that should be played by the courts 
and by the state in general. In the late 
1800s and early 1900s legislators, 
influenced by classical contract theory, 
relied on the notion that only the parties 
to a contract can evaluate whether it 
is beneficial, leading to the idea that 
whether agreements are prudent and 
profitable should be determined not 
by the courts but by the parties them-selves. 
5 At the time, the private sphere 
represented a realm in which individual 
freedom and autonomy were protected 
from state intervention. Any legisla-tion 
that disturbed parties’ equality 
was seen as an arbitrary interference 
with liberty of contract, which no 
government could legally justify. In this 
context freedom of contract had few 
limitations; legislators were more con-cerned 
with protecting the sanctity of 
the bargain because they believed that 
maximizing individual profits through 
freedom of contract would promote 
efficiency in commercial markets.6 
During the mid-1900s, however, 
governments and courts started to 
acknowledge the tension between 
the parties’ desire for certainty and 
stability in private agreements and the 
need to ensure fairness for weak and 
vulnerable individuals; concepts such 
as fraud, duress and undue influence 
began to play a bigger role in court 
decisions on limitations to freedom of 
contract.7 In this context freedom of 
contract was no longer seen as abso-lute 
but instead as a liberty to be en-joyed 
within the framework of the law, 
designed to protect individuals from 
threats to health, safety, morals and 
welfare. The court decisions spurred 
a debate over the government’s role 
in imposing limitations on freedom of 
contract, and a more paternalistic ap-proach 
emerged. This entailed overrul-ing 
individuals’ contractual preferences 
for their own good, to protect them 
from the damaging consequences of 
their agreements.8 Several countries 
started to regulate contractual rela-tionships 
under the assumption that in 
certain circumstances people are un-able 
to identify their own preferences.9 
Today most economies regulate limita-tions 
to freedom of contract by pairing 
this paternalistic approach with a 
program of social justice animated 
by distributive motives, economic ef-ficiency 
and overall fairness, which has 
led to rules favoring some groups in the 
struggle for welfare.10 
U.S. labor law offers a great example 
of this evolution. In the late 1800s 
and early 1900s courts invalidated 
laws that limited freedom of contract, 
including laws with minimum wage 
requirements, laws with restrictions on 
maximum working hours or union par-ticipation 
and federal child labor laws.11 
In these cases the court assumed a 
near equality of bargaining power and 
found it anomalous that the law would 
favor one party over the other. This ap-proach 
dominated in the early 1900s 
and culminated in the 1905 decision 
Lochner v. New York, in which the court 
invalidated a New York law limiting the 
daily number of hours a baker could 
work. However, this Lochnerian freedom 
of contract, the freedom that required 
parties to live with their duly executed 
contracts however overreaching or 
disadvantageous to the weaker party, 
succumbed to the state’s interests.12 
During the late 1930s legislation and 
case law relying on the notion that 
countries should retain the right to 
protect individuals from entering into 
a contract against their health, safety 
or welfare started to emerge. Laws 
FIGURE 11.1 Spectrum of the possible limitations to freedom of contract 
Parties have little to no 
freedom in negotiating 
contract conditions 
because of numerous 
limitations imposed by law. 
All economies in the sample 
fall within this category. 
Parties have considerable 
freedom in negotiating 
contract conditions because 
the law limits freedom of 
contract only for reasons 
relating to public policy, 
fraud and duress. 
Very limited freedom 
of contract 
Midrange freedom 
of contract 
Very extensive freedom 
of contract
92 DOING BUSINESS 2015 
regulating child labor, maximum hours, 
health and safety, sexual and moral 
harassment, and nondiscrimination in 
recruitment and hiring were more and 
more often enforced by the courts. 
When distributive motives started to 
play a bigger role in labor laws, so did 
measures regulating minimum wage 
and retirement security. 
Today, despite the differences in ap-proaches 
to setting the boundary 
between the use and misuse of bargain-ing 
power, some limitations—such as 
those relating to voluntariness, freedom 
from coercion, and natural and legal 
capacity—are universally accepted. 
Worldwide, there are laws intended to 
prevent people from using force, secre-cy, 
duress or fraud to compel others to 
enter into contracts that they would not 
agree to under different circumstances. 
Similarly, there are contract rules in ef-fect 
to void agreements that appear to 
have been freely entered into but were 
not in actuality, because of the incapac-ity 
of one of the contracting parties. 
These limitations have become an in-dispensable 
part of any comprehensive 
definition of freedom of contract, now 
intended to be both freedom of the 
parties from interference by the state 
and freedom from imposition by one 
another.13 Among the 34 economies in 
the sample, all have legislation deeming 
contracts unenforceable for reasons of 
public policy, duress, coercion, fraud, 
incapacity or undue influence. 
WHY FREEDOM OF 
CONTRACT MATTERS 
FOR FIRMS 
Freedom of contract is a critical in-strument 
for economic progress and 
efficiency.14 Its unrestricted exercise by 
parties with equal bargaining power, 
comparable skills and good knowledge 
of relevant market conditions maximiz-es 
individual welfare and promotes the 
most efficient allocation of resources in 
the marketplace.15 In addition, freedom 
of contract contributes to the estab-lishment 
of a functional economy in 
which predictability is prized.16 
Worldwide, the most common limita-tions 
to freedom of contract stem from 
the government, through its attempt 
to draw a boundary between the 
use and misuse of bargaining power. 
Others stem from the courts, which 
play a vital role in shaping freedom 
of contract when deciding whether to 
enforce certain agreements. Indeed, 
people have true freedom of contract 
only if the courts enforce their agree-ments. 
17 Courts have a dual role in this 
context—both to protect individuals 
from unreasonable government regula-tions 
and to clarify and apply rightful 
limitations. Additionally, the judiciary 
must also make sure that freedom of 
contract remains meaningful by ensur-ing 
timely enforcement of contracts. 
WHAT METHODOLOGY WAS 
USED 
To investigate limitations to freedom of 
contract in the 34 sampled economies, 
the Doing Business team added several 
new questions to this year’s question-naire 
on enforcing contracts. These 
questions focus on 10 possible limita-tions 
to freedom of contract, relating 
to issues ranging from land transfers 
to consideration, choice of law and 
limited liability clauses (box 11.1). To ob-serve 
meaningful differences between 
economies, the team focused on issues 
that have been extensively debated 
throughout the relevant literature and 
case law, although a consensus has 
BOX 11.1 Possible limitations to freedom of contract explored through this 
year’s research 
O Statutory limits on interest rates 
O Limitations on consideration and on determination of contract price in 
future agreements 
O Limitations on clauses restricting land transfers 
O Limitations on “choice of law” clauses in commercial contracts (clauses 
specifying that any dispute arising under the contract will be determined 
in accordance with the law of a particular jurisdiction) 
O Limitations relating to asymmetry of power and to unconscionability (a 
doctrine in contract law referring to terms that are so one-sided in favor 
of a party with superior bargaining power that they are contrary to good 
conscience) 
O Limitations on disclaimers on implied warranties (guarantees that the 
item sold is merchantable and fit for the purpose intended) 
O Limitations on clauses allowing termination at will (clauses usually in-cluded 
in employment agreements that permit an employee or employer 
to terminate the employment relationship at any time for any or no reason 
at all) 
O Limitations on clauses limiting liability, such as for negligence (conduct 
that departs from what would be expected of a reasonably prudent person 
acting under similar circumstances) 
O Restrictions on terms included in standard-form contracts (contracts be-tween 
2 parties in which the terms and conditions are set by one of the 
parties and the other party has little or no ability to negotiate more favor-able 
terms) 
O Limitations for reasons relating to public policy, capacity, duress, coercion, 
fraud and undue influence
ENFORCING CONTRACTS 93 
been reached on most of them. The 
34 economies were chosen from the 
189 covered by Doing Business in a way 
that ensures a representative sample 
across regions and income groups. 
One area explored through this research 
deals with the limitations imposed 
by national laws on consideration, 
traditionally defined as anything of 
value promised to the other party when 
concluding a contract. Consideration 
often takes the form of money, though 
it does not have to. In the sale of a 
house, for example, the selling party’s 
consideration could be the purchase 
price or a promise to pay this price, 
while the buyer’s consideration could 
be the house. The team investigated 
whether local courts can exercise any 
scrutiny on the adequacy of consider-ation 
and whether the determination 
of consideration can be left to a future 
agreement between the parties. If 
freedom of contract is not restricted, 
courts should exercise no scrutiny on 
consideration as long as the parties 
willingly and knowingly accepted the 
terms of the contract. But if freedom of 
contract is restricted, courts may rule 
on the adequacy of consideration to 
ensure the fairness of all transactions 
carried out in the marketplace. 
The inclusion of choice-of-law clauses 
in international contracts was also ex-amined. 
These clauses specify that any 
dispute arising under the contract will 
be determined under the law of a par-ticular 
jurisdiction. Economies limiting 
freedom of contract in this area usually 
do not allow such clauses or allow them 
only if the parties have a relationship 
with the chosen jurisdiction. Those 
without strict limitations on freedom of 
contract do not forbid such provisions. 
Other areas of research included in this 
year’s questionnaire are somewhat 
more controversial from a social, eco-nomic 
and philosophical perspective. 
Two research questions in particular 
provide an interesting example of this 
controversy: whether an economy 
has any regulations setting a cap on 
interest rates and what rules govern 
asymmetry of power. These questions 
go to the heart of whether usury laws 
and laws governing an imbalance in 
bargaining power should legitimately 
impose limits on freedom of contract. 
Both sides of the debate have been 
defended at length. Those arguing in 
favor of these laws conclude that with-out 
them, free markets would produce 
perverse incentives to take excessive 
credit risks, which drive up the cost of 
the welfare system as a whole.18 Those 
arguing against them conclude that 
courts should enforce all voluntary 
contracts that do not produce nega-tive 
consequences for others—while 
redistribution of wealth should oc-cur 
through the welfare system, not 
through laws and regulations.19 
On the question of asymmetry of 
negotiating power, those who defend 
freedom of contract argue that if 
contracts signed between parties with 
unequal bargaining power were treated 
as invalid because of this asymmetry, 
those with more power would refuse 
to sign contracts with people with less 
power, leading to the exclusion of these 
people from the market.20 To capture 
the differences in the legal treatment 
of asymmetry of power in contracts, 
the team collected data on whether lo-cal 
laws contain restrictions on terms 
that can be used in standard-form 
contracts or on provisions allowing 
termination at will. In both cases, as 
in all other cases covered in this study, 
it is assumed that both parties have 
full legal capacity and entered into the 
contract freely. 
After analyzing the laws addressing 
these issues in the sampled econo-mies, 
the team counted the number of 
limitations to freedom of contract in 
each economy. The higher the number 
of limitations, the more limited the 
freedom of contract. The maximum 
number of limitations in the study is 
10. Any limitation, even in the form of 
an exception to a general principle, is 
counted; no relevance is given to the in-tensity 
of the limitation. For limitations 
on contract provisions restricting land 
transfers, for example, 1 point is given 
even if the limitations are not imposed 
on all transactions but apply only to 
those involving foreigners. 
In carrying out this exercise the team 
does not intend to advocate in favor of 
more or less freedom of contract but 
instead aims to provide an overview 
of local regulations. Furthermore, in 
counting the number of limitations 
the team does not intend to suggest 
that a lower number—connected with 
greater freedom of contract in laws 
and regulations—is more desirable. The 
sole purpose in providing the number 
of limitations is to understand how the 
sampled economies regulate freedom 
of contract, without giving any judg-ment 
on the quality of the regulations 
or on their desirability. 
WHAT THE RESULTS SHOW 
Among the 34 economies covered, 
Tunisia has the highest number of limi-tations 
to freedom of contract, with 8 
of the 10 limitations measured. At the 
opposite end of the spectrum is the 
Democratic Republic of Congo, with 
only 3 of the 10 limitations (figure 11.2). 
The results not only show that all 34 
economies have struck a balance be-tween 
the extremes of very limited and 
very extensive freedom of contract; 
they also reflect some consensus on 
the limitations that should be imposed. 
For example, none of the economies 
allow the parties to a contract to 
exclude liability for gross negligence 
or for damages resulting in personal 
injury. Similarly, none of them allow 
contracts concluded in contraven-tion 
of public policy or under duress, 
fraud or coercion. And only 4 of the 
economies—the Democratic Republic
94 DOING BUSINESS 2015 
FIGURE 11.2 The Democratic Republic of Congo has the fewest limitations to freedom of contract 
10 
9 
8 
7 
6 
5 
4 
3 
2 
1 
of Congo, Pakistan, the Philippines and 
Sri Lanka—set no statutory limit on 
interest rates. 
But there is less agreement on other 
limitations to freedom of contract. For 
example, there is great variation among 
the economies on whether the law pro-hibits 
covenants restricting alienation 
of real property. A clause of this type 
would, for example, forbid the buyer 
from selling the property for a certain 
number of years after purchasing it. Of 
the 34 economies, 14 explicitly prohibit 
this kind of covenant, though 9 of these 
14 economies allow restrictions on alien-ation 
of real property when foreigners 
are involved in the transaction. The rest 
of the economies allow these contract 
provisions. 
Among the 7 regions covered, Europe 
and Central Asia is the only one in which 
no variation was found in the number 
and type of limitations imposed on 
freedom of contract. All sampled econo-mies 
in the region have the following 6 
limitations: 
ƒ A cap is imposed by law on interest 
rates. 
ƒ Courts can exercise scrutiny on the 
adequacy of consideration. 
ƒ The determination of a contract 
price cannot be left to a future 
agreement, unless the contract 
already establishes how the price will 
be determined. 
ƒ Limitations are imposed by law 
on clauses that can be included in 
standard-form contracts. 
ƒ Liability for gross negligence cannot 
be excluded through mutual agree-ment 
of the parties. 
ƒ A contract cannot be agreed upon 
if its terms are against public policy 
or if one of the parties does not have 
full legal capacity. 
The other 6 regions show more variation 
in the number and type of limitations. 
Sub-Saharan Africa is a good example. 
While the Democratic Republic of Congo 
has the smallest number of limitations 
in the overall sample, with 3, Togo has 
one of the largest numbers, with 7. Togo 
is the only Sub-Saharan African econo-my 
in the sample that allows the courts 
to deny enforcement of a contract on 
the basis of inadequate consideration. 
In addition, only 2 of the 5 Sub-Saharan 
African economies in the sample do not 
limit the terms that can be included in 
a standard-form contract, while all 5 
allow termination at will, choice-of-law 
clauses and disclaimers on implied 
warranties as long as the seller was not 
acting in bad faith. 
Across all regions, only 3 economies 
forbid choice-of-law clauses in in-ternational 
contracts. All 3—Brazil, 
Colombia and Uruguay—are in Latin 
America and the Caribbean. 
Even where there is considerable 
freedom of contract, slow resolution 
of contract disputes can impose 
implicit limitations. Without reason-ably 
expeditious dispute resolution, 
the meaning of freedom of contract 
is eroded; parties might be able to 
conclude most contracts on their own 
terms, but long contract resolution 
times would ultimately frustrate that 
ability. 
In Singapore parties not only have 
broad negotiating power; they also 
have the certainty that their con-tracts 
will be enforced promptly. The 
country imposes few limitations on 
freedom of contract, and resolving 
Number of limitations to freedom of contract 
Tunisia 
Uruguay 
Togo 
Taiwan, China 
Greece 
Brazil 
Turkey 
Romania 
Poland 
Mozambique 
Malta 
Macedonia, FYR 
India 
Germany 
France 
Czech Republic 
Croatia 
Colombia 
Cambodia 
Bulgaria 
United Arab Emirates 
South Africa 
Lebanon 
Italy 
El Salvador 
China 
Bhutan 
Barbados 
Sri Lanka 
Singapore 
Philippines 
Pakistan 
Nigeria 
Congo, Dem. Rep. 
0 
Source: Doing Business database.
ENFORCING CONTRACTS 95 
Time to enforce a contract 
(days) 
Congo, Dem. Rep. 
Sri Lanka 
Pakistan 
2 3 4 5 6 7 8 9 
a standardized commercial dispute 
through the courts—from the filing 
of the case to the enforcement of the 
contract—takes 150 days as measured 
by Doing Business (figure 11.3), a global 
best practice. In Sri Lanka there are 
equally few limitations to freedom of 
contract, but resolving the standard-ized 
dispute through the courts takes 
1,318 days—almost 4 years. Parties 
might be able to include a wide array 
of covenants in their agreements, but 
long enforcement times can nullify 
the utility of those covenants. A slow 
contract resolution process frustrates 
freedom of contract. 
The Democratic Republic of Congo is 
another economy where long enforce-ment 
times frustrate freedom of 
contract. It limits freedom of contract 
only in the areas of future determina-tion 
of contract price, exclusion of li-ability 
for gross negligence, and public 
policy and legal capacity. But resolv-ing 
the standardized dispute takes 
610 days—almost 2 years. Pakistan 
provides a similar example: there are 
only 4 limitations to freedom of con-tract, 
but resolving the standardized 
dispute takes 976 days in Karachi. 
Freedom of contract and efficient 
contract enforcement are often mutu-ally 
dependent because one can lose 
meaning without the other, as shown 
in the examples above. Among the 34 
economies in the sample, however, 
there are cases where neither is prized. 
Greece is a clear example. Not only does 
Greece have one of the highest numbers 
of limitations (7), it also has among the 
longest resolution times in the sample. 
Resolving the standardized dispute in 
Athens takes 1,580 days—more than 4 
years. Similarly, in Tunisia, the economy 
with the highest number of limitations 
in the sample (8), enforcing a contract 
takes 565 days. 
CONCLUSION 
Freedom of contract and efficient con-tract 
enforcement matter to business-es. 
The exercise of freedom of contract 
by parties with similar negotiating 
power and good knowledge of market 
conditions promotes efficiency in the 
allocation of resources, maximizing in-dividual 
welfare and spurring efficiency 
in the marketplace.21 Efficient contract 
enforcement promotes investment by 
influencing the decisions of economic 
actors. By promoting investment, good 
judicial institutions can also contribute 
to economic growth and development. 
Indeed, an effective judiciary, by pro-viding 
a structured, timely and orderly 
framework for resolving disputes, fos-ters 
economic stability and growth. 
Moreover, efficient contract enforce-ment 
is essential to allow true freedom 
of contract. Even where the law allows 
extensive freedom of contract, the ben-efits 
of this can be greatly undermined 
if not matched by efficient contract en-forcement. 
Without that, the predict-ability 
of the legal framework—which is 
highly valued by firms operating in the 
market—would be compromised.22 
NOTES 
This case study was written by Erica Bosio and 
Tanya Maria Santillan. 
1. The 34 economies in the sample are 
Barbados; Bhutan; Brazil; Bulgaria; 
Cambodia; China; Colombia; the Democratic 
Republic of Congo; Croatia; the Czech 
Republic; El Salvador; France; Germany; 
Greece; India; Italy; Lebanon; the former 
Yugoslav Republic of Macedonia; Malta; 
Mozambique; Nigeria; Pakistan; the 
Philippines; Poland; Romania; Singapore; 
South Africa; Sri Lanka; Taiwan, China; 
Togo; Tunisia; Turkey; the United Arab 
Emirates; and Uruguay. 
2. Ramello and Voigt 2012. 
3. Braucher 1969. 
4. Berlin 1969. 
5. Eisenberg 1995; Edwards 2009; Marella 
2006. 
6. Scott 2002. 
7. Edwards 2009; DiMatteo and Rich 2006. 
8. Kronman 1983. 
9 Shapiro 1988; Marella 2006. 
10. Kennedy 1982, 2006; Kronman 1983. 
11. Adkins v. Children’s Hospital; Adair v. United 
States; Coppage v. Kansas; Hammer v. 
Dagenhart; Carter v. Carter Coal Company; 
Weber 2013. 
12. West Coast Hotel Co. v. Parrish; Weber 2013. 
13. Kennedy 1982. 
14. Basu 2006; Edwards 2009. 
15. Edwards 2009. 
16. Weber 2013. 
17. Kennedy 1982. 
18. Posner 1995. 
19. Pettit 1999; Posner 1995. 
20. Basu 2006. 
21. Edwards 2009. 
22. Brunetti, Kisunko and Weder 1997, 1998. 
FIGURE 11.3 Singapore is among the economies with both the fewest limitations to 
freedom of contract and the fastest contract resolution 
Tunisia 
Singapore 
Greece 
1,600 
1,400 
1,200 
1,000 
800 
600 
400 
200 
0 
Number of limitations to freedom of contract 
Source: Doing Business database.
Doing Business 2015 
Going Beyond Efficiency 
Resolving insolvency 
Measuring the strength of insolvency laws 
The word bankruptcy often evokes 
negative associations with fail-ure 
and shame. And fear of bank-ruptcy 
and its consequences can deter 
potential entrepreneurs from starting 
a new business venture. According to 
a recent survey on entrepreneurship, 
people from a range of social and de-mographic 
groups rank the possibility 
of going bankrupt as the greatest fear 
associated with starting a business, 
above irregular income and lack of job 
security.1 Yet evidence suggests that the 
exit of firms from the market is a neces-sary 
condition for economic growth, and 
efficient exit frameworks may in fact 
encourage greater entrepreneurial ac-tivity 
and new firm creation.2 Moreover, 
businesses started by previously failed 
entrepreneurs can grow faster than 
those started by first-timers.3 
While reducing the stigma associ-ated 
with bankruptcy may be difficult, 
policy makers can minimize the nega-tive 
effects of business failures and take 
advantage of their positive effects by 
adopting efficient and well-functioning 
bankruptcy laws. Several studies show 
a strong link between bankruptcy laws 
and credit market development, as 
reflected by such aspects as collateral 
eligibility requirements, access to loans 
to finance investments, access to long-term 
debt and the level of firms’ financ-ing 
relative to their size.4 And studies on 
the effects of bankruptcy reforms show 
that speeding up the resolution of debt 
disputes may increase the probability 
of timely repayment; that increasing 
the protection of creditors and their 
participation in bankruptcy proceedings 
may lead to a lower cost of debt and a 
higher aggregate level of credit; and that 
introducing reorganization proceedings 
may reduce the rate of business failure.5 
Moreover, efficient bankruptcy regimes 
with orderly procedures for the sale and 
distribution of debtors’ assets can have 
a positive effect on loan terms, leverage 
ratios and bank recovery rates.6 
Bankruptcy laws play such an im-portant 
role because they promote 
predictability for both creditors and 
entrepreneurs—by establishing the 
rules for the worst-case scenario. They 
allow entrepreneurs to determine the 
maximum risk associated with a failed 
venture.7 And they allow creditors to 
calculate the maximum risk associated 
with an unpaid loan. Collection of debt 
through bankruptcy proceedings may 
be the least attractive option for any 
creditor, because these proceedings in-volve 
several creditors trying to enforce 
their claims against the same debtor.8 
So, having transparent, enforceable 
rules on the types of decisions that 
creditors can influence during bank-ruptcy 
proceedings, on the priority of 
creditors and on other important issues 
is critical for lenders—and becomes a 
key factor for them in fixing interest 
rates and maturity terms for loans.9 
AN EXPANDED FOCUS FOR 
THE INDICATORS 
The Doing Business indicators on resolv-ing 
insolvency measure the efficiency 
ƒ Doing Business introduces a 
new component of the resolving 
insolvency indicator set this 
year, the strength of insolvency 
framework index. This indicator 
tests whether each economy has 
adopted internationally recognized 
good practices in the area of 
insolvency. 
ƒ The good practices underlying 
the new indicator are based on 
2 sources—the World Bank’s 
Principles for Effective Insolvency 
and Creditor/Debtor Regimes and 
the United Nations Commission on 
International Trade Law’s Legislative 
Guide on Insolvency Law. 
ƒ OECD high-income economies have 
the highest average score on the 
strength of insolvency framework 
index. South Asia is the region with 
the lowest average score on the 
index. 
ƒ Economies that have reformed 
their insolvency laws in the past 
several years score substantially 
higher on the strength of insolvency 
framework index than economies 
with outdated insolvency provisions. 
ƒ Economies with better insolvency 
laws as measured by Doing Business 
tend to have more credit available to 
the private sector.
RESOLVING INSOLVENCY 97 
of insolvency (bankruptcy) frameworks 
around the world. Until this year the 
focus was on capturing the time, cost 
and outcome of the most likely in-court 
proceeding involving a domestic 
debtor in each economy. These 3 
measures were then used to calculate 
the recovery rate—how much of its 
loan a secured creditor would be able to 
recover at the end of the proceedings. 
This year Doing Business has introduced 
an important change in methodology 
for the resolving insolvency indicators. 
Besides measuring the recovery rate, it 
now also tests whether each economy 
has adopted internationally recognized 
good practices in the area of insol-vency. 
A new indicator, the strength of 
insolvency framework index, measures 
good practices in accordance with 
principles developed by the World Bank 
and the United Nations Commission on 
International Trade Law (UNCITRAL)— 
the World Bank’s Principles for Effective 
Insolvency and Creditor/Debtor Regimes 
(referred to here as the “World Bank 
principles”) and UNCITRAL’s Legislative 
Guide on Insolvency Law (“UNCITRAL 
guide”).10 
The purpose behind expanding the 
scope of the methodology is to capture 
multiple aspects of the insolvency 
framework in each economy. The new 
strength of insolvency framework in-dex 
measures the quality of insolvency 
laws, while the previous methodology 
(recovery rate) captures the insolvency 
practice. Thus the expanded meth-odology 
will provide a more complete 
and balanced view of the insolvency 
framework in each economy by ad-dressing 
both the quality of the law 
and the efficiency of its implementa-tion. 
One of the findings this year is 
that economies with a higher quality 
of insolvency laws as measured by the 
strength of insolvency framework 
index experience on average higher 
recovery rates.11 Additionally, while 
the previous methodology focused 
mainly on secured creditors, the new 
index widens the reach of the resolving 
insolvency indicator set to debtors and 
unsecured creditors. 
Both the World Bank principles and the 
UNCITRAL guide avoid using the term 
bankruptcy and instead use the broader 
term insolvency. The 2 guidebooks 
generally agree on the objectives of an 
effective and efficient insolvency re-gime, 
and both provide specific recom-mendations 
on each of these objectives 
(the UNCITRAL guide, a multivolume 
publication, covers a multiplicity of op-tions). 
The good practices tested under 
the new indicator are closely linked 
with the objectives identified in both 
guidebooks and follow the provisions 
elaborated in them (table 12.1). 
The strength of insolvency frame-work 
index measures whether each 
economy has adopted internationally 
recognized good practices in 4 areas: 
commencement of insolvency pro-ceedings, 
management of the debtor’s 
assets, reorganization proceedings and 
creditor participation in insolvency 
proceedings. Each of these topics is 
addressed by a separate component 
index through several questions. 
ƒ The commencement of proceedings 
index measures what type of pro-ceedings 
(liquidation, reorganization 
or both) debtors and creditors can 
initiate and what standard is used 
to declare a debtor insolvent. 
ƒ The management of debtor’s assets 
index measures whether, during 
insolvency proceedings, a debtor can 
continue transactions essential to the 
survival of the business and terminate 
contracts that are overly burdensome; 
whether preferential and undervalued 
transactions made by the debtor prior 
to the commencement of insolvency 
can be avoided; and whether the debt-or 
can obtain new financing during 
insolvency proceedings to support its 
continuous operation. 
ƒ The reorganization proceedings index 
measures whether and how credi-tors 
vote on a reorganization plan 
and what protections are available 
to dissenting creditors. 
ƒ The creditor participation index 
measures whether creditors partici-pate 
in important decisions during 
insolvency proceedings, such as ap-pointment 
of the insolvency repre-sentative 
and sale of assets during 
the proceedings; whether creditors 
have access to information about 
the debtor and the proceedings; 
and whether creditors can object to 
decisions affecting their rights, such 
as approval of claims submitted by 
other creditors. 
The information used to compile the 
strength of insolvency framework in-dex 
was provided by private and public 
sector insolvency practitioners in each 
economy with reference to the appli-cable 
laws and regulations. The Doing 
Business team analyzed both primary 
and secondary sources in evaluating 
to what extent insolvency laws in each 
economy accord with internationally 
accepted good practices. Based on this 
analysis, the team assigned a score for 
each of the 4 component indices. The 
sum of these 4 scores is the score on 
the strength of insolvency framework 
index. (For a more detailed description 
of the scoring methodology, see the 
data notes.) 
WHERE ARE GOOD 
PRACTICES MOST 
COMMON? 
OECD high-income economies have 
the highest scores on average on the 
strength of insolvency framework 
index and on each of the 4 component 
indices (figure 12.1). Among the econo-mies 
in this region, Germany and the 
United States have the highest scores. 
Europe and Central Asia has the second 
highest average score on the strength 
of insolvency framework index, though 
there is a substantial difference be-tween 
the average score of Eastern and 
Central European economies and that
98 DOING BUSINESS 2015 
of Central Asian economies. Economies 
that have recently reformed their 
insolvency laws—such as Bulgaria, 
Romania, the former Yugoslav Republic 
of Macedonia and Montenegro—have 
the region’s highest scores, having 
implemented many of the good prac-tices 
measured by the index as part of 
their reform efforts. 
East Asia and the Pacific and Sub- 
Saharan Africa are tied with the 
third highest score. Economies 
with some of the highest scores in 
Sub-Saharan Africa are those that 
adopted the OHADA (Organization 
for the Harmonization of Business 
Law in Africa) Uniform Act Organizing 
Collective Proceedings for Wiping Off 
Debts. In East Asia and the Pacific 
there is great variation in the strength 
of insolvency frameworks. Economies 
that have recently amended their 
insolvency laws, such as China, 
Cambodia and the Philippines, receive 
high scores, while other economies 
have no formal insolvency framework, 
such as Palau and the Marshall Islands. 
The region with the lowest average 
score on the strength of insolvency 
framework index is South Asia. Very 
few economies in the region have 
insolvency laws that facilitate the 
continuation of the debtor’s busi-ness 
during insolvency proceedings. 
Economies in the Middle East and 
North Africa score only slightly better. 
Only 2 economies in this region have a 
reorganization framework, and many 
lack a designated insolvency law; in-stead, 
provisions related to insolvency 
are found in company laws and com-mercial 
codes. 
In Latin America and the Caribbean 
some economies have well-developed 
insolvency laws, such as Brazil, Mexico 
and Colombia, for example, all of which 
score relatively high on the strength of 
insolvency framework index. But most 
of the smaller economies in the region, 
particularly island economies, still use 
winding-up provisions in companies 
acts that have not been amended for 
several decades. 
This analysis shows that economies 
that have reformed their insolvency 
TABLE 12.1 Objectives of an effective insolvency regime as identified by the World 
Bank principles and the UNCITRAL guide and measured by the resolving insolvency 
indicators 
World Bank principles UNCITRAL guide Resolving insolvency indicators 
Integrate with a country’s 
broader legal and commercial 
systems 
Provision of certainty in 
the market to promote 
economic stability and 
growth 
Maximize the value of a firm’s 
assets and recoveries by 
creditors 
Maximization of value 
of assets 
New indicator tests whether the value of the 
debtor’s assets can be preserved by continuing 
contracts of the debtor essential to survival of 
its business, by rejecting overly burdensome 
contracts, by invalidating preferential and 
undervalued transactions and by obtaining 
post-commencement financing. 
Provide for the efficient 
liquidation of both nonviable 
businesses and businesses 
whose liquidation is likely to 
produce a greater return to 
creditors and reorganization 
of viable businesses 
Existing indicators test whether viable 
businesses can be reorganized and whether 
businesses in liquidation can be sold as a going 
concern. 
Strike a careful balance 
between liquidation and 
reorganization, allowing 
for easy conversion of 
proceedings from one 
proceeding to another 
Striking a balance 
between liquidation and 
reorganization 
New indicator tests whether creditors and 
debtors have access to both liquidation and 
reorganization proceedings and what the basis 
is for declaring a debtor insolvent. 
Provide for equitable 
treatment of similarly 
situated creditors, including 
similarly situated foreign 
and domestic creditors 
Ensuring equitable 
treatment of similarly 
situated creditors 
New indicator tests how similarly situated 
creditors vote on a reorganization plan and 
what treatment they receive under the plan. 
Provide for timely, efficient, 
and impartial resolution of 
insolvencies 
Provision for timely, 
efficient and impartial 
resolution of insolvency 
Existing indicators test how long the 
proceedings take and how much the 
proceedings cost for the creditors. 
Prevent the improper use of 
the insolvency system 
New indicator tests the basis for commencing 
insolvency proceedings. 
Prevent the premature 
dismemberment of a debtor’s 
assets by individual creditors 
seeking quick judgments 
Preservation of the 
insolvency estate 
to allow equitable 
distribution to creditors 
This principle is tested by the strength of legal 
rights index.a 
Provide a transparent 
procedure that contains, and 
consistently applies, clear 
risk allocation rules and 
incentives for gathering and 
dispensing information 
Ensuring a transparent 
and predictable 
insolvency law that 
contains incentives for 
gathering and dispensing 
information 
New indicator tests the level of creditor 
participation during insolvency proceedings, 
including their ability to request information 
and to challenge decisions directly affecting 
their rights. 
Recognize existing creditor 
rights and respect the 
priority of claims with a 
predictable and established 
process 
Recognition of existing 
creditor rights and 
establishment of clear 
rules for ranking of 
priority claims 
New indicator tests whether post-commencement 
creditors receive priority over 
existing creditors. This principle is also tested 
by the strength of legal rights index.b 
Establish a framework for 
cross-border insolvencies, 
with recognition of foreign 
proceedings 
Establishment of a 
framework for cross-border 
insolvency 
Because Doing Business focuses on domestic 
entities and transactions, the indicators do not 
test this principle. 
a. The strength of legal rights index (part of the getting credit indicator set) tests whether the insolvency framework 
includes automatic stay (moratorium) provisions, which suspend all individual creditor actions during insolvency. 
b. The strength of legal rights index tests the level of priority of secured creditors’ claims as compared with other 
claims—tax claims, employee claims, judgments. 
Source: Analysis based on World Bank (2011b) and UNCITRAL (2004).
RESOLVING INSOLVENCY 99 
Average recovery rate 
(cents on the dollar) 
16 100 
12 
8 
4 
laws in the past several years score 
substantially higher on the strength 
of insolvency framework index than 
economies that rely on old insolvency 
provisions in companies acts and 
commercial codes. 
WHAT ARE RELATIVE 
STRENGTHS AND 
WEAKNESSES? 
The strength of insolvency framework 
index can be a meaningful instrument 
for governments to use in reforming 
their insolvency system, because it 
enhances the ability to identify areas 
where each economy can improve. The 
data for the component indices point 
to 2 areas where many economies can 
improve: reorganization proceedings 
and creditor participation (figure 12.2). 
There is also room for improvement in 
the management of the debtor’s as-sets, 
to facilitate continuous operation 
during insolvency. 
A third of the economies covered by 
Doing Business have no formal judicial 
reorganization framework. This means 
that preservation of insolvent busi-nesses 
in these economies is virtually 
impossible, so that the only option for 
an insolvent debtor is to sell its assets. 
More than 40% of economies lack spe-cific 
provisions in their insolvency laws 
that would allow debtors to maintain 
contracts supplying essential goods and 
services during insolvency proceedings. 
While some of these economies require 
utilities to continue providing services to 
insolvent customers, for many debtors 
this is not enough to ensure continuous 
operation. For example, a manufactur-ing 
company must have raw materials 
to continue operating. And a retail 
business cannot operate without mer-chandise. 
If suppliers can cancel their 
contracts as soon as a debtor becomes 
insolvent, the debtor’s business op-erations 
must stop, greatly reducing the 
value of its assets. 
Many economies do not allow creditors 
to participate in important decisions 
throughout insolvency proceedings. 
Among the first and most important 
decisions made after insolvency 
proceedings begin is the appointment 
of an insolvency representative, who 
often has the authority to act on behalf 
of the debtor and make key decisions 
about the management of its assets. 
Almost 60% of economies exclude 
creditors from the process of choosing 
the insolvency representative. Lack of 
meaningful participation can affect 
creditors’ confidence in the system, 
making them less cooperative and 
more litigious and thus prolonging the 
proceedings. 
The data for the component indices 
also point to economies with particular 
strengths in the areas measured. For 
example, Germany is one of 51 econo-mies 
that receive full points on the 
commencement of proceedings index. 
The country has unified insolvency 
proceedings, which means that when 
a debtor or creditor files for insolvency, 
there is no requirement to specify 
whether liquidation or reorganization 
is requested. But a debtor may submit 
a reorganization plan together with 
its insolvency petition or at a later 
stage, and creditors may request the 
insolvency administrator to prepare 
a reorganization plan based on the 
financial evaluation of the company. 
The standard for initiating insolvency 
proceedings is flexible and includes 
both illiquidity (inability to pay debts 
as they mature) and overindebtedness 
(the debtor’s assets no longer cover 
existing liabilities). The German insol-vency 
framework also allows the com-mencement 
of insolvency proceedings 
when illiquidity is imminent, which may 
encourage debtors to file for insolvency 
before their financial circumstances 
become too dire. 
Japan is one of 26 economies that re-ceive 
full points on the management of 
debtor’s assets index. Reorganization 
and liquidation proceedings in Japan 
are covered by 2 separate laws. Both 
laws include provisions that facilitate 
the continuation of the debtor’s busi-ness 
during insolvency. For example, 
both prohibit the termination of 
FIGURE 12.1 OECD high-income economies have well-developed insolvency 
frameworks and the highest recovery rates 
0 
75 
50 
25 
0 
Average strength of 
insolvency framework index (0–16) 
Average strength of Average recovery rate 
insolvency framework index 
South 
Asia 
Middle East  
North Africa 
Latin America 
 Caribbean 
Sub-Saharan 
Africa 
East Asia 
 Pacific 
Europe  
Central Asia 
OECD 
high income 
Source: Doing Business database.
100 DOING BUSINESS 2015 
Average index score 
as % of best score 
100 
80 
60 
40 
20 
contracts on the sole ground that 
the debtor has become insolvent and 
allow the debtor (or an administrator 
or trustee in bankruptcy) to decide 
which contracts should be continued 
during insolvency and which should be 
terminated. This allows the business 
to receive essential goods and services 
that will enable it to survive while elimi-nating 
overly burdensome obligations 
that may threaten its operation. Both 
laws also allow the avoidance of pref-erential 
and undervalued transactions 
concluded before the commencement 
of proceedings. 
In addition, in both liquidation and 
reorganization proceedings the debtor 
(or an administrator or trustee in bank-ruptcy) 
is allowed to take new loans 
if necessary for continuation of the 
business, though approval of the court 
may be required. New loans are treated 
as common benefit claims and receive 
preference over the claims of general 
unsecured creditors but not over those 
of secured creditors, whose preference 
remains unchanged. Such provisions 
on post-commencement financing 
permit a debtor in financial difficulties 
to continue operating while they also 
recognize and preserve the priority 
of existing creditors with preferential 
claims. 
Cambodia is one of 17 economies that 
receive full points on the reorganization 
proceedings index. In 2007 Cambodia 
adopted a new insolvency law that, 
among other features, introduced a 
reorganization procedure. Under the 
new law, when a reorganization plan 
is proposed, all creditors whose rights 
are impaired or modified by the plan 
vote on whether to approve or reject it. 
This includes secured and preferential 
creditors, because they may represent 
a substantial share of the value of the 
debt and their participation may be 
necessary to achieve successful reor-ganization. 
But creditors whose rights 
are not affected do not have the right 
to vote, as this would grant them un-necessary 
influence. For the purposes 
of voting on the plan, creditors are 
classified into different classes based 
on their interests (secured claims, tax 
claims, unsecured claims). All creditors 
within a class must be treated equally, 
and at least one class must approve 
the plan. To ensure equitable treatment 
of dissenting creditors, the Cambodian 
law requires that they receive at least 
as much under the reorganization plan 
as they would receive in liquidation. 
Despite Cambodia’s adoption of a 
modern and comprehensive insolvency 
law, however, recovery rates remain 
very low. As this example illustrates, 
a modern law is not enough to achieve 
an efficient insolvency practice; effec-tive 
implementation and a developed 
judiciary framework are also essential. 
Switzerland is one of only 3 econo-mies 
that receive full points on the 
creditor participation index. The Swiss 
insolvency law allows creditors to 
participate in many important deci-sions 
during insolvency. For example, 
creditors can reject the administrator 
appointed by the court and must 
approve the handling of the debtor’s 
assets during insolvency proceedings. 
They can obtain copies of records re-lated 
to the insolvency proceedings so 
as to stay informed about every stage 
of the process. And they have the right 
to object to decisions directly affecting 
their rights—for example, they can 
dispute decisions accepting the claims 
of other creditors. 
WHAT ARE THE LINKS 
WITH CREDIT MARKET 
DEVELOPMENT? 
Analysis of the data collected for the 
strength of insolvency framework 
index confirms the connection many 
researchers have made between 
insolvency laws and credit market 
development. Economies that score 
well on the index have higher levels 
of credit provided to the private sec-tor 
by domestic financial institutions 
(figure 12.3). 
These results suggest that the quality 
of bankruptcy laws is important not 
for its own sake but as an indication of 
FIGURE 12.2 Two areas where many economies can improve are reorganization 
proceedings and creditor participation 
0 
Middle East South Asia 
 North Africa 
Latin America 
 Caribbean 
Sub-Saharan 
Africa 
East Asia 
 Pacific 
Europe  
Central Asia 
OECD 
high income 
Commencement of 
proceedings index 
Management of 
debtor’s assets index 
Reorganization 
proceedings index 
Creditor 
participation index 
Source: Doing Business database.
RESOLVING INSOLVENCY 101 
Strength of insolvency 
framework index (0–16), 2014 
0 50 100 150 200 250 300 
and perhaps a step toward a better-developed 
financial system. Where 
credit institutions and entrepreneurs 
can anticipate the outcome of the 
worst-case scenario—when a busi-ness 
fails to pay its loans and several 
creditors must compete for the best 
return—more banks will be willing 
to lend and more entrepreneurs will 
be willing to take on the challenge of 
starting a business. 
CONCLUSION 
Analysis of the data collected for the 
strength of insolvency framework 
index shows that economies with 
recent changes to their insolvency 
frameworks have better-quality laws. 
Among other economies, several still 
have no formal insolvency framework 
and many more rely on outdated 
companies acts and commercial 
codes for insolvency rules. Differences 
in regulatory quality are especially 
apparent in regions with emerging 
economies, such as Latin America and 
the Caribbean and East Asia and the 
Pacific. 
The strength of insolvency frame-work 
index can be a useful tool for 
governments seeking to reform their 
insolvency laws because it helps in 
identifying specific areas where in-solvency 
regulations are lacking. The 
results suggest that there is oppor-tunity 
in many economies to improve 
reorganization proceedings, facilitate 
the continuation of businesses during 
insolvency and allow greater par-ticipation 
by creditors in insolvency 
proceedings. 
NOTES 
This case study was written by Klaus Koch 
Saldarriaga, Olena Koltko and María Antonia 
Quesada Gámez. 
1. European Commission 2012. 
2. Cirmizi, Klapper and Uttamchandani 2010. 
3. Stam, Audretsch and Meijaard 2006. 
4. See Araujo, Ferreira and Funchal (2012) 
for a summary of different studies on the 
relationship between creditors’ rights and 
economic development. 
5. Klapper 2011. 
6. Cirmizi, Klapper and Uttamchandani 2010. 
7. Lee, Peng and Barney 2007. 
8. Haselmann, Pistor and Vig 2010. 
9. Qian and Strahan 2007. 
10. World Bank 2011b; UNCITRAL 2004. 
11. For more on the relationship between the 
strength of insolvency framework index 
and the recovery rate, see figure 1.7 and 
the related discussion in the overview. 
FIGURE 12.3 Economies with strong insolvency frameworks have higher levels of 
domestic credit provided to the private sector 
16 
12 
8 
4 
0 
Domestic credit to private sector (% of GDP), 2013 
Note: Domestic credit to private sector refers to financial resources provided to the private sector by financial 
corporations, such as through loans, purchases of nonequity securities, and trade credits and other accounts 
receivable, that establish a claim for repayment. The correlation between the strength of insolvency framework index 
and domestic credit to private sector as a percentage of GDP is 0.40. The relationship is significant at the 1% level 
after controlling for income per capita. 
Source: Doing Business database; World Bank, World Development Indicators database.
Doing Business 2015 
Going Beyond Efficiency 
Highlights from the Doing 
Business research conference 
Data produced by Doing Business 
have inspired and enabled 
abundant empirical research on 
critical questions puzzling economists, 
policy makers and international de-velopment 
professionals. Researchers 
have used these data to investigate 
the importance of business-friendly 
regulation for the creation of new 
firms, for the productivity and profit-ability 
of existing ones and for such key 
outcomes as growth, employment, in-vestment 
and informality. Since 2003, 
when the first Doing Business report 
was published, 2,024 research articles 
have been published in peer-reviewed 
academic journals and 5,098 working 
papers have been posted online.1 
As a stock-taking exercise, the World 
Bank Group convened an international 
research conference, “Doing Business: 
Past, Present and Future of Business 
Regulation,” in the winter of 2014.2 The 
conference brought together academ-ics, 
World Bank Group staff and de-velopment 
professionals from around 
the world to showcase and discuss the 
impact of regulatory reform and to of-fer 
guidance for the Doing Business proj-ect 
in the years to come. Researchers 
presented 28 papers in the 8 thematic 
sessions, covering such issues as entry 
regulation, entrepreneurship, innova-tion, 
financial infrastructure, foreign 
direct investment, trade, labor mar-kets, 
growth, corruption and transpar-ency 
in regulation. 
This chapter presents the main findings 
and methodology of selected papers 
from the conference. All these papers 
point to important practical implica-tions 
for policy makers—about how 
sensible regulation can help stimulate 
the creation of new firms, help attract 
investment, facilitate a reduction in 
unemployment, aid innovative firms 
and support greater lending to the 
private sector, and about how bribery 
and corruption act as “sand” and not 
“grease” in the wheels of policy imple-mentation 
(see table 13A.1 at the end of 
the chapter for a summary). 
WHAT MATTERS FOR 
ENTREPRENEURSHIP? 
Several papers look at factors that 
encourage or discourage entrepreneur-ship. 
Klapper, Love and Randall (2014) 
investigate the relationship between 
entrepreneurship and economic growth 
and the effect of the 2008–09 global 
financial crisis on new firm registration. 
The authors explore the change in new 
firm registrations in 109 countries over 
the period 2002–12, which includes 
precrisis, crisis and recovery periods 
related to the global financial crisis as 
well as myriad other economic fluctua-tions 
at the region and country level. 
They find strongly procyclical results: 
country-specific GDP growth is associ-ated 
with higher new firm registrations, 
even after the global macroeconomic 
shocks are controlled for. Moreover, 
they find that growth has a stronger 
association with entrepreneurship in 
economies with a higher level of finan-cial 
development and a better business 
ƒ Doing Business data have inspired 
and enabled abundant research: 
2,024 research articles published 
in peer-reviewed academic journals 
since 2003, and 5,098 working 
papers posted online. 
ƒ The World Bank Group convened an 
international research conference, 
“Doing Business: Past, Present and 
Future of Business Regulation,” in 
the winter of 2014. 
ƒ According to findings of research 
presented at the conference, 
business-friendly regulation has 
a positive association with the 
entry of new firms, the profits of 
innovative firms, reductions in 
unemployment, growth in bank 
lending, inflows of foreign direct 
investment and expansions in 
franchises. 
ƒ Striking a balance in the amount of 
regulation matters. Having some 
business entry regulation helps 
define the playing field for firms 
and reduces the cost of information 
search for those entering new 
markets. But too much regulation 
increases the cost of doing business, 
dissuading firms from entering 
markets at all and thus hurting 
economic development prospects. 
ƒ Corruption acts as “sand” and not 
“grease” in the wheels of policy 
implementation. Firms confronted 
with demands for bribes wait 
about 1.5 times as long to get a 
construction permit, operating 
license or electricity connection 
as firms that did not have to pay 
bribes.
HIGHLIGHTS FROM THE DOING BUSINESS RESEARCH CONFERENCE 103 
regulatory environment (as measured 
by the Doing Business indicators). 
One important policy implication of 
their findings is that fostering an effi-cient 
regulatory environment for the fi-nancial 
and private sector can contrib-ute 
to economic growth by aiding the 
efficient exit of insolvent firms during 
economic slowdowns and encouraging 
a speedier recovery in the formation of 
new firms during economic expansions. 
A growing body of empirical evidence 
based on cross-country variations 
shows that excessive regulation or 
burdensome legal procedures for start-ing 
a company can deter the entry of 
new firms and thus affect economic 
performance. But less is known about 
the effects on economic performance 
when the regulatory burden or entry 
regulation varies within countries—and 
as subnational Doing Business reports 
have shown, there is evidence of great 
variation in the regulatory burden 
within some countries. 
While most research in this area 
focuses on developing or emerging 
economies, Bripi (2013) focuses on 
Italy, analyzing how differences among 
provinces in the local regulatory burden 
affect firm creation. Italy is a particu-larly 
interesting case because it has 
great heterogeneity in entrepreneur-ship 
and economic performance, with 
marked differences between the more 
developed regions of the Center and 
North and the less developed ones of 
the South. 
The author analyzes differences in 
bureaucratic burdens across Italian 
provinces before a major reform (single 
notice) that reduced the number of 
procedures and the time for starting a 
business. In the period examined there 
was a negative correlation between 
the time and cost of procedures and 
the entry rate of small limited liability 
firms (figure 13.1). After controlling for 
the effect of additional variables, 
FIGURE 13.1 Bureaucratic time delays and costs are associated with lower entry by 
small limited liability firms across Italian provinces 
Entry rate of small limited liability firms, 
average for 2005–07 
Potenza 
Perugia 
Aosta 
including measures of local financial 
development and efficiency of bank-ruptcy 
procedures, the author finds 
that bureaucratic time delays (and, to 
a lesser extent, costs) due to inefficient 
regulatory procedures reduced the en-try 
rate in industries that should have 
“naturally” high entry rates relative 
to low-entry sectors. The estimates 
show robust evidence of the negative 
effect of time delays on the entry rate 
of small limited liability firms. The re-lationship 
between cost and the entry 
rate is also statistically significant, 
though it depends on the specification 
used. For example, the effect of cost 
is significant only in less developed 
provinces, in those with a higher level 
of corruption and in the service sectors 
(not in manufacturing). 
Overall, the results confirm the 
view that the regulatory burden on 
new start-ups matters for business 
creation. In particular, they provide 
evidence that the administrative 
burden in the years just before the 
reform was a significant obstacle 
Entry rate of small limited liability firms, 
average for 2005–07 
Perugia 
to entrepreneurship (and ultimately 
economic performance) in the heavily 
regulated provinces of the South rela-tive 
to the more lightly regulated ones 
of the Center and North of Italy. 
Audretsch, Belitski and Desai (2014) 
investigate how the overall business 
environment affects urban entrepre-neurship. 
They look at a few dimensions 
of the business environment (such as 
those measured by the Doing Business 
indicators on starting a business, regis-tering 
property, paying taxes, enforcing 
contracts and trading across borders) 
and types of regulatory reform (those 
affecting measures of time, cost and 
procedures)—and examine the links 
between these aspects and 2 measures 
of entrepreneurship, new business cre-ation 
and self-employment. 
The authors find that the national busi-ness 
environment is associated with 
both measures of entrepreneurship 
and that the type of regulatory reform 
can affect entrepreneurship outcomes. 
In particular, they find evidence that 
2 3 4 5 
6 
4 
2 
0 
-2 
2 3 4 5 
6 
4 
2 
0 
-2 
Veneto 
Trieste 
Bolzano 
Sardinia 
Napoli 
Trento 
Milano 
Bologna 
Ancona 
Torino 
Bari 
L’Aquila 
Firenze 
Roma 
Genova 
Catanzaro 
Campobasso 
Palermo 
Veneto 
Trieste 
Bolzano 
Sardinia 
Napoli 
Trento Bologna 
Milano 
Ancona Bari 
L’Aquila 
Torino 
Firenze 
Aosta 
Genova 
Potenza 
Campobasso 
Roma Catanzaro 
Palermo 
Log of time Log of cost 
Note: Entry rate is the ratio of the number of newly registered small limited liability firms to the total number of 
limited liability firms. 
Source: Bripi 2013.
104 DOING BUSINESS 2015 
specific regulatory dimensions (such 
as contract enforcement) as well as 
particular types of regulatory reform 
within each dimension (such as those 
affecting cost measures) are associ-ated 
with the rate of self-employment 
and new business creation. 
Audretsch, Belitski and Desai find 
evidence that different dimensions 
and pillars (time, cost, number of 
procedures) of the business environ-ment 
could have different effects on 
entrepreneurship. They also find that 
in some cases their 2 measures of en-trepreneurship 
(new business creation 
and self-employment) are affected dif-ferently 
by the same regulatory dimen-sion 
or same type of regulatory reform. 
CAN REGULATION 
ATTRACT INVESTMENT? 
Jovanovic and Jovanovic (2014) analyze 
whether business regulation—as mea-sured 
by Doing Business indicators— 
affects inflows of foreign direct 
investment in 28 Eastern European 
and Central Asian countries. They find 
that greater regulatory efficiency as 
measured by Doing Business indicators 
has a positive association with foreign 
direct investment inflows from OECD 
countries. For example, a country in 
which 9 documents are required to 
export is likely to have investment 
inflows around 37% lower than those in 
a country in which 7 such documents 
are required. This effect seems strong, 
so it may also include the effects of 
other barriers to trade, such as the 
cost or time to export, both of which 
are highly correlated with the number 
of documents required to export (with a 
correlation coefficient of around 0.75). 
The authors also find that a reduction 
in the cost of starting a business is 
positively associated with an increase 
in foreign direct investment inflows. 
Eight of the 9 sets of Doing Business 
indicators included in the analysis 
appear to have a statistically signifi-cant 
relationship with foreign direct in-vestment 
inflows (starting a business, 
dealing with construction permits, 
registering property, protecting minor-ity 
investors, paying taxes, trading 
across borders, enforcing contracts 
and resolving insolvency); none of the 
getting credit indicators do. The indica-tors 
measuring cost appear to be more 
important than those measuring time 
and number of procedures. The authors 
therefore conclude that governments 
may be able to attract foreign direct 
investment by creating a more efficient 
and more business-friendly regulatory 
environment. 
Hoffman, Munemo and Watson (2014) 
look at how different aspects of the 
business climate affect the location 
decisions of U.S. franchise companies. 
They find that a stable system of 
governance, citizen participation and 
good-quality public services all increase 
the chances of franchise location in a 
country. Of particular interest are the 
findings on business entry regulation. 
Having some regulation helps define 
the playing field for firms and reduces 
the cost of information search for 
those entering new markets. But too 
much regulation increases the cost of 
doing business, dissuading firms from 
entering markets at all and thus hurt-ing 
economic development prospects. 
Excessive taxation also discourages the 
entry of franchisors into a country. The 
findings suggest a diminishing return 
from regulation after a certain point. 
INNOVATION AND THE 
CONSTRAINTS OF RED 
TAPE 
Innovation is a key source of economic 
growth, so understanding the dynamics 
of innovative firms is important. Using 
firm-level panel data from emerging 
economies, Yang (2014) examines the 
relationship between the business 
climate and profitability for innovative 
and noninnovative firms. The author 
finds that in business climates where 
nonregulatory elements (such as 
infrastructure or levels of crime) are 
poor, innovative firms have higher 
profits than noninnovative firms. But in 
business climates where regulatory or 
governance-related elements (such as 
corruption or the time and cost to start 
a business) are poor, innovative firms 
have lower profits. 
Innovative firms tend to have more-educated 
managers, better tech-nologies 
and better access to finance, 
which may explain their greater ability 
to cope in poor business climates. But 
they may also suffer more from red 
tape. Innovative firms may experience 
greater friction as they attempt to 
expand or to enter new markets— 
because creating new products requires 
interactions with government officials 
to apply for licenses or permits, where 
firms can encounter bureaucratic de-lays 
or requests for bribes. 
HOW DEBT ENFORCEMENT 
CAN BOOST LENDING 
Legal protections of creditors’ rights 
are critical to support bank lending to 
the private sector. Judicial efficiency 
and substantive law defining creditors’ 
rights have been shown to be positively 
correlated with bank lending. But in 
India bank lending to the private sector 
has more than doubled in the past 2 
decades despite few improvements in 
judicial efficiency and substantive law. 
What explains the expansion in bank 
lending over this period? Rathinam 
(2014) looks at the short- and long-term 
effect of the introduction of debt 
recovery tribunals, a procedural law 
innovation that reduced the transac-tion 
cost of availing the law. These 
quasi-judicial bodies bypass the over-burdened 
civil courts in adjudicating fi-nancial 
disputes involving banks. Debt 
recovery tribunals were introduced in 
a staggered way across Indian states,
HIGHLIGHTS FROM THE DOING BUSINESS RESEARCH CONFERENCE 105 
allowing comparison of lending by 
banks with and without access to the 
tribunals. 
Rathinam finds that the introduction 
of debt recovery tribunals changed the 
perception of lenders in the short run: 
banks with access to tribunals loaned 
more than those without access. In the 
long run the debt recovery tribunals 
have had an effect on lending, even 
after both bank- and state-specific 
fixed effects are controlled for. This 
finding confirms the argument that 
good substantive law, if effectively en-forced, 
enhances investors’ and credi-tors’ 
confidence in the system, which 
results in a larger volume of credit and 
ultimately greater economic growth. 
While confirming the causal link from 
law to finance, the author also points to 
the role of procedural law in enhancing 
adjudication and thus the availability 
of credit to the private sector. 
CAN REGULATION HELP 
REDUCE UNEMPLOYMENT? 
Freund and Rijkers (forthcoming) in-vestigate 
the factors that lead to swift, 
substantial and sustained reductions 
in unemployment. The authors exam-ine 
the incidence and determinants of 
episodes of drastic reductions in the 
unemployment rate—reductions of 
at least 3.25 percentage points of the 
initial level that persist for a minimum 
of 3 years. They identify 43 such epi-sodes 
over a period of nearly 3 decades 
in 94 high-income, middle-income and 
transition economies. 
Unemployment reduction episodes 
often coincide with an acceleration of 
growth and an improvement in mac-roeconomic 
conditions. Such episodes 
are much more prevalent in countries 
with higher levels of unemployment 
and, given unemployment, are more 
likely in those with better regulation. 
An efficient legal system that enforces 
contracts expeditiously is particularly 
important for reducing unemployment. 
The authors’ findings suggest that 
while employment is largely related to 
the business cycle, better regulation 
can reduce the likelihood of high un-employment 
and promote a more rapid 
recovery if unemployment builds up. 
They also underscore the importance 
of effective contract enforcement 
and secure property rights in enabling 
growth in employment. 
CORRUPTION—SAND 
OR GREASE? 
Freund, Hallward-Driemeier and Rijkers 
(2014) investigate whether corruption 
accelerates policy implementation. 
The authors start by documenting 
striking differences between the time 
it takes to complete regulatory proce-dures 
in practice and the time it takes 
when complying with the law. These 
are shown in figure 13.2, which plots 
the 10th percentile, median and 90th 
percentile de facto log times to get a 
construction permit in a given country 
and year as reported by entrepreneurs 
in the World Bank Enterprise Surveys 
against the time it should take to 
complete all the formalities to build 
a warehouse according to the Doing 
Business indicators. The authors link 
this heterogeneity to the incidence of 
demands for bribes. 
The authors examine the relationship 
between requests for bribes and the 
time it takes to complete various 
regulatory requirements—getting a 
construction permit, obtaining an 
operating license, obtaining an electric-ity 
connection and clearing customs. 
They test 3 predictions implied by the 
“grease the wheels” hypothesis, which 
contends that bribes act as speed 
money: that all else being equal, firms 
confronted with requests for bribes 
should get things done faster; that 
firms with a higher opportunity cost 
of waiting are willing to pay more and 
consequently face shorter wait times; 
and that bribing is more beneficial 
where regulation is onerous. 
The data are inconsistent with all 3 
predictions. In the authors’ preferred 
specifications, all else being equal, firms 
confronted with demands for bribes 
wait about 1.5 times as long to get a 
construction permit, operating license 
FIGURE 13.2 A striking difference between the time it takes for construction 
permitting in practice and the time it takes when complying with the law 
Log of time to get a construction permit 
as measured by Enterprise Surveys 
6 
4 
2 
0 
Colombia, 2010 
Vanuatu, 2009 
Tonga, 2009 
4.0 4.5 5.0 5.5 6.0 6.5 
Log of time to deal with construction permits as measured by Doing Business 
10th percentile 50th percentile 90th percentile 
Note: The sample comprises 106 countries. Data are for the most recent year available. 
Source: Freund, Hallward-Driemeier and Rijkers 2014.
106 DOING BUSINESS 2015 
or electricity connection as firms that 
did not have to pay bribes—and they 
wait 1.2 times as long to clear customs 
when exporting and 1.4 times as long 
when importing. The results are robust 
to controlling for firm fixed effects and 
at odds with the notion that corruption 
enhances efficiency. 
CONCLUSION 
The research papers reviewed in this 
chapter show that business-friendly 
regulation is integral to economic 
growth and development.3 Where 
regulation is streamlined and judicious, 
it unleashes innovation, promotes the 
creation of jobs and helps attract for-eign 
direct investment. 
But while these papers answer many 
questions, they also pose many new 
ones. For example, Hoffman, Munemo 
and Watson (2014) suggest that an 
important area for future research is 
to find out what the right amount of 
regulation is for business entry. And 
the pioneering study by Audretsch, 
Belitski and Desai (2014) invites follow-up 
research on the impact of multiple 
dimensions of the national business 
environment on firms in different cit-ies. 
The expansion of the global Doing 
Business sample to the second largest 
business city in 11 large economies, 
along with the data published by the 
subnational Doing Business reports, will 
enable further research to explore the 
effects of business regulations across 
different cities within a country—and 
to better understand the reasons for 
differences in outcomes. 
NOTES 
1. Based on searches for citations of the 8 
background papers that form the basis for 
the Doing Business indicators in the Social 
Science Citation Index and Google Scholar 
(http://scholar.google.com). 
2. The conference took place at Georgetown 
University’s McDonough School of Business 
in Washington, DC. It was cosponsored 
by the U.S. Agency for International 
Development and the Kauffman 
Foundation. More information is available 
at http:// 
www.doingbusiness.org/special-features 
/conference. 
3. For a comprehensive review of the literature 
on the effects of business regulation, see 
Doing Business 2014.
HIGHLIGHTS FROM THE DOING BUSINESS RESEARCH CONFERENCE 107 
TABLE 13A.1 Summary of the main findings and methodology of selected papers from the Doing Business research conference 
Theme Main findings Methodology overview Data sources 
Entrepreneurship 
Klapper, Love and Randall (2014) 
GDP growth, especially if combined with a 
higher level of financial development and a 
better business regulatory environment, is 
associated with higher new firm registrations. 
The initial empirical exercise uses a simple model with 
entry density as the dependent variable and economic 
growth (as a proxy for the business cycle) as the main 
independent variable. The authors then investigate 
heterogeneity in the relationship between the business 
cycle and new firm registration. 
World Bank, Entrepreneurship Database; 
World Bank, World Development 
Indicators database; Doing Business 
database 
Entrepreneurship 
Bripi (2013) 
Bureaucratic time delays and, to a lesser extent, 
costs due to inefficient regulatory procedures 
can reduce the firm entry rate in industries that 
should have “naturally” high entry rates relative 
to low-entry sectors. 
The analysis focuses on cross-industry and cross-province 
interaction effects to investigate the impact 
of regulation on firm entry. 
Bank of Italy data set measuring the 
time and costs of regulation across 
Italian regions 
Entrepreneurship 
Audretsch, Belitski and Desai (2014) 
Specific national regulatory dimensions (such as 
contract enforcement) as well as different types 
of reform within a dimension (such as those 
affecting cost) are associated with the rate of 
new business start-ups and self-employment in 
European cities. 
Panel data random effects regression is used to 
examine how the business environment affects new 
business creation and self-employment in a panel of 
European cities. 
Eurostat Urban Audit database, regional 
and city statistics; Doing Business 
database 
Investment 
Jovanovic and Jovanovic (2014) 
Greater regulatory efficiency as measured 
by Doing Business indicators has a positive 
association with foreign direct investment flows 
from OECD countries to Eastern European and 
Central Asian countries. 
The analysis uses the generalized method of 
moments technique on data on bilateral foreign direct 
investment flows from 22 OECD countries to 28 
Eastern European and Central Asian countries during 
2004–11. 
World Bank, World Development 
Indicators database; Organisation for 
Economic Co-operation and Development 
data; International Monetary Fund 
(IMF), World Economic Outlook and 
International Financial Statistics 
databases; International Labour 
Organization data; Doing Business 
database 
Investment 
Hoffman, Munemo and Watson (2014) 
Having some business entry regulation helps 
define the playing field for firms and reduces the 
cost of information search for those entering 
new markets. But too much regulation increases 
the cost of doing business, dissuading firms 
from entering markets at all. 
The analysis tests several hypotheses using a model 
with franchise expansion (the number of units 
planned for a country in the future divided by its 
urban population) as the dependent variable and 
several independent variables, including the Doing 
Business distance to frontier measure, entry regulation 
(measured by the cost of business start-up procedures 
as a percentage of GNI per capita) and the national 
corporate tax rate (measured as a percentage of 
profits). Additional explanatory variables include 
economic development (measured by real GDP per 
capita), measures of media infrastructure and of 
governance, and a dummy variable estimating the 
impact of the 2008–09 financial crisis on franchise 
expansion. 
Press announcements by U.S. franchise 
companies on expansion plans or moves 
made into specific international markets 
during 2005–11 (to develop the sample); 
Doing Business database; World Bank, 
World Development Indicators database; 
Worldwide Governance Indicators 
Innovation 
Yang (2014) 
The profits of innovative firms are lower 
in business climates where regulatory or 
governance-related factors (such as corruption 
or the time and cost to start a business) are 
poor. 
The analysis exploits the panel structure of the data. 
A first-difference regression is estimated. A number 
of control variables are used, and further robustness 
checks are applied. 
World Bank Enterprise Surveys; Doing 
Business database; World Bank data 
catalog 
enforcement 
Debt 
Rathinam (2014) 
In India the introduction of debt recovery 
tribunals—a procedural law innovation that 
bypasses the overburdened civil courts in 
adjudicating financial disputes involving 
banks—explains increased bank lending. 
The analysis uses a differences-in-differences model 
and data on lending by commercial banks in India 
(including advances to the commercial sector and total 
secured loans extended) for the years before and after 
the introduction of debt recovery tribunals (1993 and 
1995). 
Centre for Monitoring Indian Economy, 
PROWESS database; Reserve Bank of 
India, annual accounts data on scheduled 
commercial banks
108 DOING BUSINESS 2015 
TABLE 13A.1 Summary of the main findings and methodology of selected papers from the Doing Business research conference 
Theme Main findings Methodology overview Data sources 
Unemployment 
Freund and Rijkers (forthcoming) 
Episodes of drastic reductions in the 
unemployment rate are much more prevalent 
in countries with higher levels of unemployment 
and, given unemployment, are more likely in 
those with better regulation. 
The authors use an event-studies approach to examine 
how countries achieved episodes of drastic reductions 
in the unemployment rate over the period 1980–2008. 
They examine the determinants of such episodes by 
estimating a probit model, with the potential for an 
unemployment reduction episode as the dependent 
variable. After performing several robustness checks, 
they use Bayesian model averaging to investigate 
which aspects of regulation matter most. 
World Bank, World Development 
Indicators database; IMF data; 
Worldwide Governance Indicators; 
Heritage Foundation’s Index of Economic 
Freedom; Doing Business database 
Corruption and transparency 
Freund, Hallward-Driemeier and Rijkers (2014) 
Firms confronted with demands for bribes wait 
about 1.5 times as long to get a construction 
permit, operating license or electricity 
connection as firms that did not have to pay 
bribes—and they wait 1.2 times as long to clear 
customs when exporting and 1.4 times as long 
when importing. 
The analysis tests 3 related hypotheses (whether 
bribe requests and the time to complete regulatory 
processes are positively correlated; and whether 
“greasing the wheels” is more evident for firms with 
the highest opportunity cost of waiting or in countries 
where regulations are most burdensome) by modeling 
the log of policy implementation time (the time it 
takes to export, import, get a construction permit 
or obtain an operating license) as a function of firm 
characteristics. A dummy variable indicating whether 
a bribe was solicited or expected is added. Results 
are robust to controlling for firm fixed effects and 
comparing within-firm heterogeneity in wait times for 
different government services. 
World Bank Enterprise Surveys; Doing 
Business database
Doing Business 2015 
Going Beyond Efficiency 
Akerlof, George A., and Robert J. Shiller. 
2009. Animal Spirits: How Human 
Psychology Drives the Economy, and 
Why It Matters for Global Capitalism. 
Princeton, NJ: Princeton University 
Press. 
Alvarez de la Campa, Alejandro. 2011. 
“Increasing Access to Credit through 
Reforming Secured Transactions in the 
MENA Region.” Policy Research Working 
Paper 5613, World Bank, Washington, 
DC. 
Araujo, Aloisio P., Rafael V. X. Ferreira and 
Bruno Funchal. 2012. “The Brazilian 
Bankruptcy Law Experience.” Journal of 
Corporate Finance 18 (4): 994–1004. 
Arrow, Kenneth J. 1963. Social Choice and 
Individual Value, 2nd ed. New York: John 
Wiley  Sons. 
Asian Development Bank. 2013. Pacific 
Private Sector Development Initiative: 
Progress Report 2013. Mandaluyong 
City, Philippines: Asian Development 
Bank. 
Aterido, Reyes, Mary Hallward-Driemeier 
and Carmen Pages. 2009. “Big 
Constraints to Small Firms’ Growth? 
Business Environment and Employment 
Growth across Firms.” Economic 
Development and Cultural Change 59 (3): 
609–47. 
Audretsch, David, Maksim Belitski 
and Sameeksha Desai. 2014. 
“Multidimensional Business 
Environment and Entrepreneurship 
in European Cities.” Paper presented 
at the conference “Doing Business: 
Past, Present and Future of Business 
Regulation,” Washington, DC, February 
20–21. 
Ayyagari, Meghana, Asli Demirguc-Kunt 
and Vojislav Maksimovic. 2014. “Who 
Creates Jobs in Developing Countries?” 
Small Business Economics 43 (1): 75–99. 
Balasubramanian, Bala, Bernard Black 
and Vikramaditya Khanna. 2010. “The 
Relation between Firm-Level Corporate 
Governance and Market Value: A Study 
of India.” Emerging Markets Review 11: 
319–40. 
Bartha, Mary, Yaniv Konchitchkib and 
Wayne Landsmanc. 2013. “Cost of 
Capital and Earnings Transparency.” 
Journal of Accounting and Economics 55 
(2–3): 206–24. 
Basu, Kaushik. 1983. “Cardinal Utility, 
Utilitarianism and a Class of Invariance 
Axioms in Welfare Analysis.” Journal of 
Mathematical Economics 12 (3): 193–206. 
. 2006. “Coercion, Contract and the 
Limits of the Market.” Social Choice and 
Welfare 29 (4): 559–79. 
. 2010. Beyond the Invisible Hand: 
Groundwork for a New Economics. 
Princeton, NJ: Princeton University 
Press. 
Behr, Patrick, Annekathrin Entzian and 
Andre Guettler. 2011. “How Do Lending 
Relationships Affect Access to Credit 
and Loan Conditions in Microlending?” 
Journal of Banking and Finance 35: 
2169–78. 
Behr, Patrick, and Simon Sonnekalb. 2012. 
“The Effect of Information Sharing 
between Lenders on Access to Credit, 
Cost of Credit, and Loan Performance— 
Evidence from a Credit Registry 
Introduction.” Journal of Banking and 
Finance 36: 3017–32. 
Berlin, Isaiah. 1969. “Two Concepts of 
Liberty.” In Four Essays on Liberty. 
Oxford: Oxford University Press. 
Besley, Timothy, and Robin Burgess, 2004. 
“Can Labor Regulation Hinder Economic 
Performance? Evidence from India.” 
Quarterly Journal of Economics 119 (1): 
91-134. 
Bird, Richard M., and Eric M. Zolt. 2008. 
“Technology and Taxation in Developing 
Countries: From Hand to Mouse.” 
Law-Econ Research Paper 08-07, UCLA 
School of Law, Los Angeles. 
Black, Bernard, and Woochan Kim. 2012. 
“The Effect of Board Structure on Firm 
Value: A Multiple Identification Strategy 
Approach Using Korean Data.” Journal of 
Financial Economics 104: 203–26. 
Black, Bernard, Woochan Kim, Hasung 
Jang and Kyung Suh Park. 2010. 
“How Corporate Governance Affects 
References
110 DOING BUSINESS 2015 
Firm Value: Evidence on Channels 
from Korea.” Finance Working Paper 
103/2005, European Corporate 
Governance Institute, Brussels. 
Botero, Juan C., Simeon Djankov, Rafael La 
Porta, Florencio Lopez-de-Silanes and 
Andrei Shleifer. 2004. “The Regulation 
of Labor.” Quarterly Journal of Economics 
119 (4): 1339–82. 
Bowles, Samuel. 2006. Microeconomics: 
Behavior, Institutions, and Evolution. 
Princeton, NJ: Princeton University 
Press. 
Branstetter, Lee G., Francisco Lima, 
Lowell J. Taylor and Ana Venâncio. 
2013. “Do Entry Regulations Deter 
Entrepreneurship and Job Creation? 
Evidence from Recent Reforms in 
Portugal.” Economic Journal. Published 
electronically July 16, 2013. doi:10.1111 
/ecoj.12044. 
Braucher, Robert. 1969. “Freedom of 
Contract and the Second Restatement.” 
Yale Law Journal 78 (4): 598–616. 
Bripi, Francesco. 2013. “The Role of 
Regulation on Entry: Evidence from the 
Italian Provinces.” Working Paper 932, 
Bank of Italy, Rome. 
Brits, Anne-Marie, Chris Grant and 
Anthony Burns. 2002. “Comparative 
Study of Land Administration Systems 
with Special Reference to Thailand, 
Indonesia and Karnataka (India).” 
Synthesis paper prepared for Asia 
Region, World Bank, Washington, DC. 
Brondolo, John. 2009. “Collecting Taxes 
during an Economic Crisis: Challenges 
and Policy Options.” IMF Staff Position 
Note 09/17, International Monetary 
Fund, Washington, DC. 
Brown, Martin, Tullio Jappelli and Marco 
Pagano. 2009. “Information Sharing 
and Credit: Firm-Level Evidence 
from Transition Countries.” Journal of 
Financial Intermediation 18: 151–72. 
Brown, Martin, and Christian Zehnder. 
2007. “Credit Registries, Relationship 
Banking, and Loan Repayment.” Journal 
of Money, Credit and Banking 39 (8): 
1883–918. 
Bruce, John. 2013. “Land and Conflict: 
Land Disputes and Land Conflicts.” 
Property Rights and Resource 
Governance Briefing Paper 12, U.S. 
Agency for International Development, 
Washington, DC. 
Bruhn, Miriam. 2011. “License to Sell: The 
Effect of Business Registration Reform 
on Entrepreneurial Activity in Mexico.” 
Review of Economics and Statistics 93 
(1): 382–86. 
Brunetti, Aymo, Gregory Kisunko and 
Beatrice Weder. 1997. “Institutional 
Obstacles for Doing Business: Region-by- 
Region Results from a Worldwide 
Survey of the Private Sector.” Policy 
Research Working Paper 1759, World 
Bank, Washington, DC. 
. 1998. “Credibility of Rules and 
Economic Growth: Evidence from 
a Worldwide Survey of the Private 
Sector.” World Bank Economic Review 12 
(3): 353–84. 
Burns, Anthony. 2004. “Thailand’s 20 Year 
Program to Title Rural Land.” World 
Development Report Background 
Paper, World Bank, Washington, DC. 
Buti, Marco, and Heinz Zourek. 2012. “Tax 
Reforms in EU Member States: Tax 
Policy Challenges for Economic Growth 
and Fiscal Sustainability.” Working 
Paper 34–2012, European Commission 
Directorate General for Taxation and 
Customs Union Directorate General 
for Economic and Financial Affairs, 
Luxembourg. 
Caixe, Daniel Ferreira, and Elizabeth 
Krauter. 2013. “The Influence of the 
Ownership and Control Structure on 
Corporate Market Value in Brazil.” 
Revista Contabilidade  Finanças 
(University of São Paulo) 24 (62): 
142–53. 
Chang, Roberto, Linda Kaltani and 
Norman Loayza. 2009. “Openness 
Can Be Good for Growth: The Role of 
Policy Complementarities.” Journal of 
Development Economics 90: 33–49. 
Chavis, Larry, Leora Klapper and Inessa 
Love. 2010. “Access to Financing and 
New Investments: Evidence from 
Europe.” In The Economics of Small 
Business: An International Perspective, 
edited by Giorgio Calcagnini and 
Ilario Favaretto, 115–32. London: 
Physica-Verlag. 
Chen, Kevin, Zhihong Chen and John Wei. 
2011. “Agency Costs of Free Cash Flows 
and the Effect of Shareholder Rights on 
the Implied Cost of Capital.” Journal of 
Financial and Quantitative Analysis 46: 
171–207. 
Cirmizi, Elena, Leora Klapper and Mahesh 
Uttamchandani. 2010. “The Challenges 
of Bankruptcy Reform.” Policy Research 
Working Paper 5448, World Bank, 
Washington, DC. 
City of London Law Society. 2012. 
“Discussion Paper: Secured 
Transactions Reform.” London. 
http://www.citysolicitors.org.uk 
/attachments/article/121 
/20121120-Secured-Transactions 
-Reform---discussion-paper.pdf. 
Cremers, Martijn, and Allen Ferrell. 
Forthcoming. “Thirty Years of 
Shareholder Rights and Firm Valuation.” 
Journal of Finance. 
Crone, Theodore M. 1982. “Elements of an 
Economic Justification for Municipal 
Zoning.” Federal Reserve Bank of 
Philadelphia, Philadelphia, PA. 
Cuzman, Ioan, Bogdan Dima and Stefana 
Maria Dima. 2010. “New Empirical 
Evidence on the Linkages between 
Governance and Growth.” Available at 
http://papers.ssrn.com/sol3/papers 
.cfm?abstract_id=1720702. 
Deininger, Klaus, Harris Selod and Anthony 
Burns. 2012. The Land Governance 
Assessment Framework: Identifying and 
Monitoring Good Practice in the Land 
Sector. Washington, DC: World Bank. 
de Sa, Liliana. 2005. “Business 
Registration Start-Up: A Concept Note.” 
International Finance Corporation and 
World Bank, Washington, DC. 
de Soto, Hernando. 2000. The Mystery of 
Capital: Why Capitalism Triumphs in the 
West and Fails Everywhere Else. New 
York: Basic Books. 
Dharmapala, Dhammika, and 
Vikramaditya Khanna. 2013. 
“Corporate Governance, Enforcement, 
and Firm Value.” Journal of Law, 
Economics and Organization 29 (5): 
1056–84. 
DiMatteo, Larry A., and Bruce L. 
Rich. 2006. “A Consent Theory of 
Unconscionability: An Empirical Study 
of Law in Action.” Florida University Law 
Review 33: 1067–118. 
Divanbeigi, Raian, and Rita Ramalho. 2014. 
“Business Regulations and Growth.” 
Draft paper, Doing Business Unit, World 
Bank Group, Washington, DC. 
Djankov, Simeon, Caroline Freund and 
Cong S. Pham. 2010. “Trading on Time.” 
Review of Economics and Statistics 92 
(1): 166–73. 
Djankov, Simeon, Tim Ganser, Caralee 
McLiesh, Rita Ramalho and Andrei 
Shleifer. 2010. “The Effect of 
Corporate Taxes on Investment and 
Entrepreneurship.” American Economic 
Journal: Macroeconomics 2 (3): 31–64. 
Djankov, Simeon, Oliver Hart, Caralee 
McLiesh and Andrei Shleifer. 2008. 
“Debt Enforcement around the World.” 
Journal of Political Economy 116 (6): 
1105–49. 
Djankov, Simeon, Rafael La Porta, 
Florencio Lopez-de-Silanes and Andrei 
Shleifer. 2002. “The Regulation of 
Entry.” Quarterly Journal of Economics 
117 (1): 1–37. 
. 2003. “Courts.” Quarterly Journal of 
Economics 118 (2): 453–517. 
. 2008. “The Law and Economics 
of Self-Dealing.” Journal of Financial 
Economics 88 (3): 430–65. 
Djankov, Simeon, Darshini Manraj, Caralee 
McLiesh and Rita Ramalho. 2005. 
“Doing Business Indicators: Why
REFERENCES 111 
Aggregate, and How to Do It.” World 
Bank, Washington, DC. 
Djankov, Simeon, Caralee McLiesh and 
Andrei Shleifer. 2007. “Private Credit 
in 129 Countries.” Journal of Financial 
Economics 84 (2): 299–329. 
Dreher, Axel, and Martin Gassebner. 2013. 
“Greasing the Wheels? The Impact of 
Regulations and Corruption on Firm 
Entry.” Public Choice 155 (3–4): 413–32. 
Dutz, Mark. 2014. “Productivity-Driven 
Growth and Shared Prosperity.” 
Background paper for World Bank and 
International Monetary Fund Global 
Monitoring Report 2014/2015: Ending 
Poverty and Sharing Prosperity. World 
Bank, Washington, DC. 
Edwards, Carolyn. 2009. “Freedom of 
Contract and Fundamental Fairness 
for Individual Parties: The Tug of War 
Continues.” University of Kentucky Law 
Review 77: 569–646. 
Eisenberg, Melvin Aron. 1995. “The 
Limits of Cognition and the Limits of 
Contract.” Stanford Law Review 47: 
211–60. 
European Commission. 2012. 
“Entrepreneurship in the EU and 
Beyond.” Flash Eurobarometer 354, 
European Commission, Brussels. http:// 
ec.europa.eu/public_opinion 
/flash/fl_354_en.pdf. 
FAO (Food and Agriculture Organization 
of the United Nations). 2012. Voluntary 
Guidelines on the Responsible Governance 
of Tenure of Land, Fisheries and Forests 
in the Context of National Food Security. 
Rome: FAO. 
Ferguson, William D. 2013. Collective 
Action and Exchange: A Game-Theoretic 
Approach to Contemporary Political 
Economy. Redwood City, CA: Stanford 
University Press. 
Foster, James, Mark McGillivray and 
Suman Seth. 2012. “Rank Robustness 
of Composite Indices: Dominance 
and Ambiguity.” OPHI Working Paper 
26b, Oxford Poverty and Human 
Development Initiative, Department of 
International Development, University 
of Oxford. http://www.ophi.org.uk 
/wp-content/uploads/ophi-wp-26b 
.pdf?0a8fd7. 
Freund, Caroline, Mary Hallward-Driemeier 
and Bob Rijkers. 2014. “Deals and 
Delays: Firm-Level Evidence on 
Corruption and Policy Implementation 
Times.” Policy Research Working Paper 
6949, World Bank, Washington, DC. 
Freund, Caroline, and Bob Rijkers. 
Forthcoming. “Unemployment 
Reduction Episodes in Rich, Middle- 
Income and Transition Economies.” 
Journal of Comparative Economics. 
Fritsch, Michael, and Florian Noseleit. 
2013. “Investigating the Anatomy of the 
Employment Effect of New Business 
Formation.” Cambridge Journal of 
Economics 37 (2): 349–77. 
Galiani, Sebastian, and Ernesto 
Schargrodsky. 2010. “Property Rights 
for the Poor: The Effects of Land 
Titling.” Journal of Public Economics 94 
(9): 700–29. 
Gillingham, Polly, and Felicity Buckle. 2014. 
“Rwanda Land Tenure Regularization 
Case Study.” Evidence on Demand. 
doi:10.12774/eod_hd.march2014. 
gillingham. 
Gilson, Ronald. 2000. “Transparency, 
Corporate Governance and Capital 
Markets.” OECD, Paris. 
Grannis, Jessica. 2011. “Adaptation Tool 
Kit: Sea-Level Rise and Coastal Land 
Use—How Governments Can Use Land- 
Use Practices to Adapt to Sea-Level 
Rise.” Georgetown Climate Center, 
Georgetown Law, Washington, DC. 
http://www.southernclimate.org 
/documents/resources/Adaptation 
_Tool_Kit_SLR.pdf. 
Guo, Lixiong, and Ronald W. Masulis. 2013. 
“Board Structure and Monitoring: New 
Evidence from CEO Turnovers.” Finance 
Working Paper 351/2013, European 
Corporate Governance Institute, 
Brussels. 
Hanstad, Tim. 1998. “Designing Land 
Registration Systems for Developing 
Countries.” American University 
International Law Review 13: 647–703. 
Haselmann, Rainer, Katharina Pistor and 
Vikrant Vig. 2010. “How Law Affects 
Lending.” Review of Financial Studies 23 
(2): 550–80. 
Hodgson, Paul, and Greg Ruel. 2012. 
“The Costs of a Combined Chair/CEO: 
Executive Summary.” GMI Ratings. 
http://www.gmiratings.com. 
Hoffman, Richard C., Jonathan Munemo 
and Sharon Watson. 2014. “Business 
Climate and International Franchise 
Expansion.” Paper presented at the 
conference “Doing Business: Past, 
Present and Future of Business 
Regulation,” Washington, DC, February 
20–21. 
Huang, Ying, Susan Elkinawy and 
Pankaj K. Jain. 2013. “Investor 
Protection and Cash Holdings: Evidence 
from US Cross-Listing.” Journal of 
Banking  Finance 37 (3): 937–51. 
Hüfner, Felix, and Jens Lundsgaard. 2007. 
“The Swedish Housing Market: Better 
Allocation via Less Regulation.” OECD 
Economics Department Working Paper 
559, OECD, Paris. 
IFC (International Finance Corporation). 
2012. Credit Reporting Knowledge Guide. 
Washington, DC: IFC. 
IMF (International Monetary Fund). 2009. 
World Economic Outlook: Crisis and 
Recovery. Washington, DC: IMF. 
Jappelli, Tullio, and Marco Pagano. 2002. 
“Information Sharing, Lending and 
Defaults: Cross-Country Evidence.” 
Journal of Banking and Finance 26: 
2017–45. 
Johnson, Simon. 2009. “The Quiet Coup.” 
Atlantic Monthly. May. http:// 
www.theatlantic.com/magazine 
/archive/2009/05/the-quiet-coup 
/307364. 
Jovanovic, Biljana, and Branimir Jovanovic. 
2014. “Ease of Doing Business and 
Investment in Eastern Europe and 
Central Asia.” Paper presented at 
the conference “Doing Business: Past, 
Present and Future of Business 
Regulation,” Washington, DC, February 
20–21. 
Kaplan, David, Eduardo Piedra and 
Enrique Seira. 2011. “Entry Regulation 
and Business Start-Ups: Evidence 
from Mexico.” Journal of Development 
Economics 95: 1501–15. 
Karkkainen, Bradley C. 1994. “Zoning: A 
Reply to the Critics.” Journal of Land 
Use  Environmental Law (Florida State 
University) 10 (1). http://www.law.fsu 
.edu/journals/landuse/vol101/karkkain 
.html#FNR6. 
Kaufmann, Daniel, and Aart Kraay. 2002. 
“Growth without Governance.” Economía 
3 (1): 169–229. 
Kennedy, Duncan. 1982. “Distributive 
and Paternalist Motives in Contract 
and Tort Law, with Special Reference 
to Compulsory Terms and Unequal 
Bargaining Power.” Maryland Law Review 
41 (4): 563–658. 
. 2006. “Thoughts on Coherence, 
Social Values and National Tradition 
in Private Law.” In The Politics of a 
European Civil Code, edited by 
Martijn W. Hesselink. The Hague: 
Kluwer Law International. 
Klapper, Leora. 2011. “Saving Viable 
Businesses.” Public Policy Journal Note 
328, World Bank Group, Washington, 
DC. 
Klapper, Leora, Raphael Amit, Mauro 
Guillen and Juan Quesada. 2010. 
“Entrepreneurship and Firm Formation 
across Countries.” In International 
Differences in Entrepreneurship, edited 
by Josh Lerner and Antoinette Schoar. 
Chicago: University of Chicago Press. 
Klapper, Leora, and Inessa Love. 2011. 
“The Impact of Business Environment 
Reforms on New Firm Registration.”
112 DOING BUSINESS 2015 
Policy Research Working Paper 5493, 
World Bank, Washington, DC. 
Klapper, Leora, Inessa Love and Douglas 
Randall. 2014. “New Firm Registration 
and the Business Cycle.” Policy 
Research Working Paper 6775, World 
Bank, Washington, DC. 
Korea, Ministry of Strategy and Finance. 
2012. Korean Taxation 2012. Seoul. 
KPMG. 2009. Competitive Alternatives: 
KPMG’s Guide to International 
Business Location. 
http://competitivealternatives.com. 
Kraay, Aart, and Norikazu Tawara. 2011. 
“Can Disaggregated Indicators Identify 
Governance Reform Priorities?” Policy 
Research Working Paper 5254, World 
Bank, Washington, DC. 
. 2013. “Can Specific Policy 
Indicators Identify Reform 
Priorities?” Journal of Economic 
Growth 18 (3): 253–83. 
Kronman, Anthony Townsend. 1983. 
“Paternalism and the Law of Contracts.” 
Yale Law Journal 92: 763–98. 
Kuntchev, Veselin, Rita Ramalho, Jorge 
Rodríguez-Meza and Judy S. Yang. 
2012. “What Have We Learned from the 
Enterprise Surveys regarding Access to 
Finance by SMEs?” Enterprise Analysis 
Unit, Finance and Private Sector 
Development Vice Presidency, World 
Bank Group, Washington, DC. 
Lang, Mark, Karl Lins and Mark Maffett. 
2012. “Transparency, Liquidity, and 
Valuation: International Evidence on 
When Transparency Matters Most.” 
Journal of Accounting Research 50 (3): 
729–74. 
La Porta, Rafael, and Andrei Shleifer. 
2008. “The Unofficial Economy and 
Economic Development.” Tuck School 
of Business Working Paper 2009-57, 
Dartmouth College, Hanover, NH. 
Available at http://ssrn.com 
/abstract=1304760. 
Lee, Seung-Hyun, Mike W. Peng and 
Jay B. Barney. 2007. “Bankruptcy Law 
and Entrepreneurship Development: A 
Real Options Perspective.” Academy of 
Management Review 32 (1): 257–72. 
Lima, Bruno Faustino, and Antonio Zoratto 
Sanvicente. 2013. “Quality of Corporate 
Governance and Cost of Equity in 
Brazil.” Journal of Applied Corporate 
Finance 25 (1): 72–80. 
Lo, Agnes, Raymond Wong and Michael 
Firth. 2010. “Can Corporate Governance 
Deter Management from Manipulating 
Earnings? Evidence from Related-Party 
Sales Transactions in China.” Journal of 
Corporate Finance 16: 225–35. 
Loayza, Norman V., Ana María Oviedo 
and Luis Servén. 2010. “Regulation 
and Macroeconomic Performance.” 
In Business Regulation and Economic 
Performance, edited by Norman V. 
Loayza and Luis Servén. Washington, 
DC: World Bank. 
Love, Inessa, María Soledad Martínez Pería 
and Sandeep Singh. 2013. “Collateral 
Registries for Movable Assets: Does 
Their Introduction Spur Firms’ Access 
to Bank Finance?” Policy Research 
Working Paper 6477, World Bank, 
Washington, DC. 
Luoto, Jill, Craig McIntosh and Bruce 
Wydick. 2004. “Credit Information 
Systems in Less-Developed Countries: 
Recent History and a Test.” Economic 
Development and Cultural Change 55 (2): 
313–34. 
Malhotra, D. K., Raymond Poteau and 
Joseph Fritz. 2013. “Does Corporate 
Governance Impact Performance? 
An Analysis of Dow Thirty Stocks.” 
International Journal of Business  
Economics Perspectives 8 (1): 62–75. 
Marella, Maria Rosaria. 2006. “The Old and 
the New Limits to Freedom of Contract 
in Europe.” European Review of Contract 
Law 2: 257–74. 
McLean, David, Tianyu Zhang and 
Mengxin Zhao. 2012. “Why Does the 
Law Matter? Investor Protection and 
Its Effects on Investment, Finance, 
and Growth.” Journal of Finance 67 
(1): 313–50. 
Monteiro, C. M. Joana, and Juliano J. 
Assunção. 2012. “Coming Out of the 
Shadows? Estimating the Impact 
of Bureaucracy Simplification and 
Tax Cut on Formality in Brazilian 
Microenterprises.” Journal of 
Development Economics 99: 105–15. 
Moss, Tim. 2014. “International Good 
Practices in Business Registers.” 
Presentation at Corporate Registers 
Forum, Rio de Janeiro, March 18. 
Motta, Marialisa, Ana María Oviedo and 
Massimiliano Santini. 2010. “An Open 
Door for Firms: The Impact of Business 
Entry Reforms.” Viewpoint 323, World 
Bank Group, Washington, DC. https:// 
www.wbginvestmentclimate.org 
/uploads/323-Business-entry-reforms 
.pdf. 
Moullier, Thomas. 2009. “Reforming 
Building Permits: Why Is It Important 
and What Can IFC Really Do?” 
International Finance Corporation, 
Washington, DC. 
Nataraj, Shantni, Francisco Perez-Arce, 
Sinduja Srinivasan and Krishna Kumar. 
2012. “What Is the Impact of Labour 
Market Regulation on Employment in 
LICs? How Does It Vary by Gender?” 
Rand Working Paper WR-957, Rand 
Corporation, Santa Monica, CA. 
Neumann, Brad. 2014. “Climate Change 
and Local Government: Zoning for 
Small Wind Energy, Part 1.” Michigan 
State University Extension, East 
Lansing, MI. http://msue.anr.msu.edu 
/news/climate_change_and_local 
_government_zoning_for_small_wind 
_energy. 
OECD (Organisation for Economic 
Co-operation and Development). 
2002. Foreign Direct Investment for 
Development: Maximising Benefits, 
Minimising Costs. Paris: OECD. 
. 2004. OECD Principles of Corporate 
Governance. Paris: OECD. 
. 2010a. Choosing a Broad Base–Low 
Rate Approach to Taxation. Tax Policy 
Study 19. Paris: OECD. 
. 2010b. Growth-Oriented Tax Policy 
Reform Recommendations. Tax Policy 
Study 20. Paris: OECD. 
. 2012. OECD Economic Surveys: 
Korea. Paris: OECD. 
Pettit, Mark. 1999. “Freedom, Freedom 
of Contract, and the Rise and the 
Fall.” Boston University Law Review 79: 
263–354. 
Pierre, Gaëlle, and Stefano Scarpetta. 
2007. “How Labor Market Policies Can 
Combine Workers’ Protection with Job 
Creation: A Partial Review of Some 
Key Issues and Policy Options.” Social 
Protection Discussion Paper 0716, 
World Bank, Washington, DC. 
Portugal-Perez, Alberto, and John S. 
Wilson. 2012. “Export Performance 
and Trade Facilitation Reform: Hard 
and Soft Infrastructure.”World 
Development 40 (7): 1295–307. 
Posner, Eric A. 1995. “Contract Law in 
the Welfare State: A Defense of the 
Unconscionability Doctrine, Usury 
Laws, and Related Limitations on the 
Freedom to Contract.” Journal of Legal 
Studies 24: 283–320. 
Powell, Andrew, Nataliya Mylenko, 
Margaret Miller and Giovanni Majnoni. 
2004. “Improving Credit Information, 
Bank Regulation and Supervision: On 
the Role and Design of Public Credit 
Registries.” Policy Research Working 
Paper 3443, World Bank, Washington, 
DC. 
Qian, Jun, and Philip E. Strahan. 2007. 
“How Laws and Institutions Shape 
Financial Contracts: The Case of 
Bank Loans.” Journal of Finance 62 (6): 
2803–34. 
Ramello, Giovanni, and Stephen Voigt. 
2012. “The Economics of Efficiency 
and the Judicial System.” International 
Review of Law and Economics 32: 1–2.
REFERENCES 113 
Rathinam, Francis Xavier. 2014. 
“Procedural Law and Bank Lending to 
Private Sector: Evidence from India.” 
Paper presented at the conference 
“Doing Business: Past, Present and 
Future of Business Regulation,” 
Washington, DC, February 20–21. 
Schaffner, Philip, and Jake Waxman. 2009. 
“Environmental Policy Green Zoning: 
Creating Sustainable Communities 
through Incentive Zoning.” Harvard 
Kennedy School, Cambridge, MA. 
http://www.hks.harvard.edu/var 
/ezp_site/storage/fckeditor/file/pdfs 
/centers-programs/centers/rappaport 
/paes/schaffner 
_waxman.pdf. 
Schneider, Friedrich. 2005. “The Informal 
Sector in 145 Countries.” Department of 
Economics, University Linz, Linz. 
Scott, Robert E. 2002. “The Rise and Fall 
of Article 2.” Louisiana Law Review 62: 
1009–64. 
Sen, Amartya. 1977. “On Weights and 
Measures: Informational Constraints in 
Social Welfare Analysis.” Econometrica 
49 (7): 1539–72. 
Shapiro, David L. 1988. “Courts, 
Legislatures and Paternalism.” Virginia 
Law Review 74: 519–74. 
Stam, Erik, David B. Audretsch and 
Joris Meijaard. 2006. “Renascent 
Entrepreneurship.” ERIM Report Series 
17, Erasmus Research Institute of 
Management, Erasmus University 
Rotterdam. 
Stiglitz, Joseph E., Amartya Sen and 
Jean-Paul Fitoussi. 2009. “Report by 
the Commission on the Measurement 
of Economic Performance and Social 
Progress.” http://www.stiglitz-sen 
-fitoussi.fr/documents/rapport 
_anglais.pdf. 
Study Group on a European Civil Code 
and Research Group on EC Private 
Law (Acquis Group). 2009. Principles, 
Definitions and Model Rules of European 
Private Law: Draft Common Frame 
of Reference. Vol. 6. Oxford: Oxford 
University Press. 
Swedish National Board of Housing, 
Building and Planning. 2013. The 
Housing Shortage and Rent Setting 
System: A Knowledge Base. Market 
Report. Stockholm. 
Tajti, Tibor. 2013. “Post-1990 Secured 
Transaction Law Reforms in Central 
and Eastern Europe.” Szegedi Közjegyzői 
Közlöny 2 (3): 14–21; 2 (4): 18–26. 
Transparency International. 2011. 
“Corruption in the Land Sector.” 
Working Paper 4. Berlin. 
Turner, Michael, Robin Varghese, Patrick 
Walker and Katrina Dusek. 2009. Credit 
Reporting Customer Payment Data: 
Impact on Customer Payment Behavior 
and Furnisher Costs and Benefits. Chapel 
Hill, NC: PERC Press. 
U.K. Companies House. 2013a. Companies 
House Annual Report  Accounts 2012/13. 
London: The Stationery Office. 
. 2013b. Companies Register 
Activities 2012–2013. London: 
Companies House. 
UNCITRAL (United Nations Commission 
on International Trade Law). 2004. 
Legislative Guide on Insolvency Law. New 
York: United Nations. 
. 2007. Legislative Guide on Secured 
Transactions. New York: United Nations. 
UNECE (United Nations Economic 
Commission for Europe). 2012. Policy 
Framework for Sustainable Real Estate 
Markets: Principles and Guidance for the 
Development of a Country’s Real Estate 
Sector. Geneva: UNECE. 
UN-Habitat (United Nations Human 
Settlements Programme). 2012. 
Managing Urban Land Information: 
Learning from Emergent Practices. 
Nairobi: UN-Habitat. 
. 2013. Tools to Support 
Transparency in Land Administration. 
Nairobi: UN-Habitat. 
U.S. Securities and Exchange Commission. 
2012. “Work Plan for the Consideration 
of Incorporating International Financial 
Reporting Standards into the Financial 
Reporting System for U.S. Issuers.” 
Final Staff Report, U.S. Securities and 
Exchange Commission, Washington, 
DC. http://www.sec.gov/spotlight 
/globalaccountingstandards 
/ifrs-work-plan-final-report.pdf. 
Weber, David P. 2013. “Restricting the 
Freedom of Contract: A Fundamental 
Prohibition.” Yale Human Rights  
Development Law Journal 16: 51–141. 
Wehrmann, Babette. 2008. Land Conflicts: 
A Practical Guide to Dealing with 
Land Disputes. Eschborn, Germany: 
Deutsche Gesellschaft für Technische 
Zusammenarbeit. 
Wille, John R., Karim O. Belayachi, 
Numa de Magalhaes and Frédéric 
Meunier. 2011. “Leveraging Technology 
to Support Business Registration 
Reform: Insights from Recent Country 
Experience.” Investment Climate in 
Practice Note 17, Investment Climate 
Department, World Bank Group, 
Washington, DC. 
World Bank. 1989. World Development Report 
1989: Financial Systems and Development. 
New York: Oxford University Press. 
. 2006. Doing Business in 2006: 
Creating Jobs. Washington, DC: World 
Bank. 
. 2011a. General Principles for Credit 
Reporting. Washington, DC: World Bank. 
. 2011b. Principles for Effective 
Insolvency and Creditor/Debtor Regimes. 
Revised. Washington, DC: World Bank. 
http://siteresources.worldbank.org 
/EXTGILD/Resources 
/5807554-1357753926066 
/ICRPrinciples-Jan2011[FINAL].pdf. 
. 2012. World Development Report 
2013: Jobs. Washington, DC: World 
Bank. 
. 2013a. Doing Business 2013: 
Smarter Regulations for Small and 
Medium-Size Enterprises. Washington, 
DC: World Bank. 
. 2013b. Doing Business 2014: 
Understanding Regulations for Small and 
Medium-Size Enterprises. Washington, 
DC: World Bank. 
. 2014a. A Measured Approach to 
Ending Poverty and Boosting Shared 
Prosperity: Concepts, Data, and the 
Twin Goals. Policy Research Report. 
Washington, DC: World Bank. 
. 2014b. Sweden’s Business Climate: 
Opportunities for Entrepreneurs through 
Improved Regulations. Washington, DC: 
World Bank. 
. 2014c. World Development 
Indicators 2014. Washington, DC: World 
Bank. 
. Forthcoming. World Development 
Report 2015: Mind and Society: How a 
Better Understanding of Human Behavior 
Can Improve Development Policy. 
Washington, DC: World Bank. 
World Bank and IMF (International 
Monetary Fund). 2014. Global Monitoring 
Report 2014/2015: Ending Poverty and 
Sharing Prosperity. Washington, DC: 
World Bank. 
World Bank Group, Investment Climate 
Advisory Services. 2009. How Many 
Stops in a One-Stop Shop? A Review 
of Recent Developments in Business 
Registration. Washington, DC: World 
Bank Group. 
. 2013. “Sustaining Investment 
Climate, and Making Rwanda a 
Favorite Business Destination.” World 
Bank Group, Washington, DC. 
World Bank Group, Investment Climate 
Department. 2013. Good Practices for 
Construction Regulation and Enforcement 
Reform: Guidelines for Reformers. 
Washington, DC: World Bank Group. 
Yang, Judy S. 2014. “The Business Climate, 
Innovation, and Firm Profitability.” 
Paper presented at the conference 
“Doing Business: Past, Present and 
Future of Business Regulation,” 
Washington, DC, February 20–21.
Doin Businss 2015 
Goin Bond Efficinc 
Dt nots 
Th indictors prsntd nd 
nld in Doin Businss m- 
sur businss rultion nd th 
protction of proprt rihts—nd thir 
ffct on businsss, spcill smll 
nd mdium-si domstic firms. First, 
th indictors documnt th complx-it 
 of rultion, such s th numbr 
of procdurs to strt  businss or 
to ristr  trnsfr of commrcil 
proprt. Scond, th u th tim 
nd cost to chiv  rultor ol 
or compl with rultion, such s th 
tim nd cost to nforc  contrct, 
o throuh bnkruptc or trd cross 
bordrs. Third, th msur th xtnt 
of ll protctions of proprt, for 
xmpl, th protctions of minorit 
invstors inst lootin b compn 
dirctors or th rn of ssts tht 
cn b usd s colltrl ccordin to 
scurd trnsctions lws. Fourth,  st 
of indictors documnts th tx burdn 
on businsss. Finll,  st of dt 
covrs diffrnt spcts of mplomnt 
rultion. Th 11 sts of indictors 
msurd in Doin Businss wr ddd 
ovr tim, nd th smpl of conomis 
nd citis xpndd (tbl 14.1). 
Th dt for ll sts of indictors in 
Doin Businss 2015 r for Jun 2014.1 
TABLE 14.1 Topics nd conomis covrd b ch Doin Businss rport 
Topic 
DB 
2004 
DB 
2005 
DB 
2006 
DB 
2007 
DB 
2008 
DB 
2009 
DB 
2010 
DB 
2011 
DB 
2012 
DB 
2013 
DB 
2014 
DB 
2015 
Gttin lctricit 
Dlin with 
construction 
prmits 
Trdin cross 
bordrs 
Pin txs 
Protctin minorit 
invstors 
Ristrin proprt 
Gttin crdit 
Rsolvin insolvnc 
Enforcin contrcts 
Lbor mrkt 
rultion 
Strtin  businss 
Numb	r of 
	conomi	s 133 145 155 175 178 181 183 183 183 185 189 189 
Not: Dt for th conomis ddd to th smpl ch r r bck-clcultd to th prvious r. Th xcptions 
r Kosovo nd Montnro, which wr ddd to th smpl ftr th bcm mmbrs of th World Bnk Group. 
In Doin Businss 2015, whil th numbr of conomis rmins th sm s in Doin Businss 2014, 11 citis hv bn 
ddd.
DATA NOTES 115 
METHODOLOGY 
Th Doin Businss dt r collctd in 
 stndrdid w. To strt, th Doin 
Businss tm, with cdmic dvisrs, 
dsins  qustionnir. Th qustion-n 
ir uss  simpl businss cs to 
nsur comprbilit cross conomis 
nd ovr tim—with ssumptions bout 
th ll form of th businss, its si, 
its loction nd th ntur of its opr- 
tions. Qustionnirs r dministrd 
to mor thn 10,700 locl xprts, 
includin lwrs, businss consultnts, 
ccountnts, friht forwrdrs, ov- 
rnmnt officils nd othr profssion- 
ls routinl dministrin or dvisin 
on ll nd rultor rquirmnts 
(tbl 14.2). Ths xprts hv sv- 
rl rounds of intrction with th Doin 
Businss tm, involvin confrnc 
clls, writtn corrspondnc nd visits 
b th tm. For Doin Businss 2015 
tm mmbrs visitd 26 conomis, 
includin 10 nw citis, to vrif dt 
nd rcruit rspondnts. Th dt from 
qustionnirs r subjctd to numr-ous 
rounds of vrifiction, ldin to 
rvisions or xpnsions of th inform- 
tion collctd. 
Th Doin Businss mthodolo offrs 
svrl dvnts. It is trnsprnt, 
usin fctul informtion bout wht 
Econom chrctristics 
Gross national income per capita 
Doin Businss 2015 rports 2013 incom pr cpit s publishd in th World 
Bnk’s World Dvlopmnt Indictors 2014. Incom is clcultd usin th Atls 
mthod (currnt U.S. dollrs). For cost indictors xprssd s  prcnt 
of incom pr cpit, 2013 ross ntionl incom (GNI) in U.S. dollrs is usd 
s th dnomintor. GNI dt bsd on th Atls mthod wr not vilbl 
from th World Bnk for Arntin, Th Bhms, Bhrin, Brbdos, Bruni 
Drusslm, Djibouti, Kuwit, Libˆ, Mˆnmr, Nw Zlnd, Omn, Sn 
Mrino, th Sˆrin Arb Rpublic, nd Wst Bnk nd GŽ. In ths css 
GDP or GNP pr cpit dt nd rowth rts from othr sourcs, such s 
th Intrntionl Montrˆ Fund’s World Economic Outlook dtbs nd th 
Economist Intllinc Unit, wr usd. 
Region and income group 
Doin Businss uss th World Bnk rionl nd incom roup clssific- 
tions, vilbl t http://dt.worldbnk.or/bout/countrˆ-clssifictions. 
Whil th World Bnk dos not ssin rionl clssifictions to hih-incom 
conomis, rionl vrs prsntd in fiurs nd tbls in th Doin 
Businss rport includ conomis from ll incom roups (low, lowr middl, 
uppr middl nd hih incom). For th purpos of th rport, hih-incom 
OECD conomis r ssind th “rionl” clssifiction OECD hih incom. 
Population 
Doin Businss 2015 rports midˆr 2013 popultion sttistics s publishd 
in World Dvlopmnt Indictors 2014. 
lws nd rultions s nd llow-in 
 multipl intrctions with locl 
rspondnts to clrif potntil mis-int 
rprttions of qustions. Hvin 
rprsnttiv smpls of rspondnts 
is not n issu; Doin Businss is not 
 sttisticl surv, nd th txts of 
th rlvnt lws nd rultions r 
collctd nd nswrs chckd for 
ccurc. Th mthodolo is inx-p 
nsiv nd sil rplicbl, so dt 
cn b collctd in  lr smpl of 
conomis. Bcus stndrd ssump-tions 
r usd in th dt collction, 
comprisons nd bnchmrks r vlid 
cross conomis. Finll, th dt not 
onl hihliht th xtnt of spcific 
rultor obstcls to businss but 
lso idntif thir sourc nd point to 
wht miht b rformd. 
LIMITS TO WHAT IS 
MEASURED 
Th Doin Businss mthodolo hs 5 
limittions tht should b considrd 
whn intrprtin th dt. First, for 
most conomis th collctd dt 
rfr to businsss in th lrst busi-n 
ss cit (which in som conomis 
TABLE 14.2 How mn xprts dos Doin Businss consult? 
Economi	s with iv	n numb	r of r	spond	nts (%) 
Indic­tor s	t R	spond	nts 1–2 3–5 5+ 
Strtin  businss 1,651 10 33 57 
Dlin with construction prmits 1,082 18 40 42 
Gttin lctricit 967 22 45 33 
Ristrin proprt 1,229 20 37 43 
Gttin crdit 1,538 10 25 65 
Protctin minorit invstors 1,117 25 37 38 
Pin txs 1,305 7 39 54 
Trdin cross bordrs 1,184 22 46 33 
Enforcin contrcts 1,314 18 42 40 
Rsolvin insolvnc 1,051 25 40 35 
Lbor mrkt rultion 1,134 23 40 37 
Tot­l 13,572 18 39 43
116 DOING BUSINESS 2015 
diffrs from th cpitl) nd m 
not b rprsnttiv of rultion 
in othr prts of th conom. (Th 
xcptions r 11 conomis tht hv 
 popultion of mor thn 100 million, 
whr Doin Businss, for th first tim 
this r, lso collctd dt for th 
scond lrst businss cit.)2 To d-dr 
ss this limittion, subntionl Doin 
Businss indictors wr crtd (box 
14.1). Scond, th dt oftn focus on 
 spcific businss form—nrll  
limitd libilit compn (or its ll 
quivlnt) of  spcifid si—nd 
m not b rprsnttiv of th ru-l 
tion on othr businsss, for xmpl, 
sol propritorships. Third, trnsc-tions 
dscribd in  stndrdid cs 
scnrio rfr to  spcific st of issus 
nd m not rprsnt th full st of 
issus tht  businss ncountrs. 
Fourth, th msurs of tim involv 
n lmnt of judmnt b th xprt 
rspondnts. Whn sourcs indict 
diffrnt stimts, th tim indictors 
rportd in Doin Businss rprsnt 
th mdin vlus of svrl rsponss 
ivn undr th ssumptions of th 
stndrdid cs. 
Finll, th mthodolo ssums 
tht  businss hs full informtion on 
wht is rquird nd dos not wst 
tim whn compltin procdurs. 
In prctic, compltin  procdur 
m tk lonr if th businss lcks 
informtion or is unbl to follow up 
promptl. Altrntivl, th businss 
m choos to disrrd som burdn-som 
 procdurs. For both rsons th 
tim dls rportd in Doin Businss 
2015 would diffr from th rcollction 
of ntrprnurs rportd in th World 
Bnk Entrpris Survs or othr firm-l 
vl survs. 
CHANGES IN WHAT IS 
MEASURED 
As prt of  2-r updt in mthod-olo 
, Doin Businss 2015 incorports 
7 importnt chns. First, th s of 
doin businss rnkin s wll s ll 
topic-lvl rnkins r now computd 
on th bsis of distnc to frontir 
scors (s th chptr on th distnc 
to frontir nd s of doin businss 
rnkin). Scond, for th 11 conomis 
with  popultion of mor thn 100 mil-lion, 
dt for  scond cit hv bn 
ddd to th dt st nd th rnkin 
clcultion. Third, for ttin crdit, 
th mthodolo hs bn rvisd for 
both th strnth of ll rihts indx 
nd th dpth of crdit informtion 
indx. Th numbr of points hs bn 
incrsd in both indics, from 10 to 
12 for th strnth of ll rihts indx 
nd from 6 to 8 for th dpth of crdit 
informtion indx. In ddition, onl 
crdit burus nd ristris tht covr 
t lst 5% of th dult popultion cn 
rciv  scor on th dpth of crdit 
informtion indx. 
Fourth, th nm of th protctin in-v 
stors indictor st hs bn chnd 
to protctin minorit invstors to 
bttr rflct its scop—nd th scop 
of th indictor st hs bn xpndd 
to includ shrholdrs’ rihts in 
corport ovrnnc bond rltd-p 
rt trnsctions. Fifth, th rsolvin 
insolvnc indictor st hs bn x-p 
ndd to includ n indx msurin 
th strnth of th ll frmwork 
for insolvnc. Sixth, th clcultion of 
th distnc to frontir scor for p- 
in txs hs bn chnd. Th totl 
tx rt componnt now ntrs th 
scor in  nonlinr fshion, in n p-pro 
ch diffrnt from tht usd for ll 
othr indictors (s th chptr on th 
distnc to frontir nd s of doin 
businss rnkin). 
Finll, th nm of th mplo- 
in workrs indictor st hs bn 
chnd to lbor mrkt rultion, 
nd th scop of this indictor st hs 
lso bn chnd. Th indictors now 
focus on lbor mrkt rultions p-pl 
in to th rtil sctor rthr thn 
th mnufcturin sctor, nd thir 
covr hs bn xpndd to includ 
rultions on lbor disputs nd on 
bnfits providd to workrs. Th lbor 
mrkt rultion indictors continu 
to b xcludd from th rt 
distnc to frontir scor nd rnkin 
on th s of doin businss. 
Bond ths chns thr r 3 othr 
updts in mthodolo. For pin 
txs, th finncil sttmnt vribls 
hv bn updtd to b proportionl 
to 2012 incom pr cpit; prviousl 
th wr proportionl to 2005 incom 
pr cpit. For nforcin contrcts, th 
vlu of th clim is now st t twic th 
incom pr cpit or $5,000, whichvr 
is rtr. For dlin with construction 
prmits, th cost of construction is 
now st t 50 tims incom pr cpit 
(bfor, th cost ws ssssd b th 
BOX 14.1 Subntionl Doin Businss indictors 
Subntionl Doin Businss studis point to diffrncs in businss rultion 
nd its implmnttion—s wll s in th pc of rultorˆ rform—cross 
citis in th sm conomˆ or rion. For svrl conomis subntionl stud-i 
s r now priodicllˆ updtd to msur chn ovr tim or to xpnd 
orphic covr to dditionl citis. 
This ˆr subntionl studis wr compltd in th Arb Rpublic of Eˆpt, 
Mxico nd Niri. In ddition, th orphic covr ws xpndd for 
onoin studis in th Dominicn Rpublic, Polnd, South Afric, Spin nd 
6 Cntrl Amricn countris. And for th first tim subntionl studis r 
incorportin  ndr prspctiv, ssssin prctics t public ristris in 
Niri nd nlˆŽin ll indictors from th World Bnk Group’s Womn, 
Businss nd th Lw rport on Cntrl Amric.
DATA NOTES 117 
Doin Businss rspondnts). In ddition, 
this indictor st no lonr includs 
th procdurs for obtinin  lndlin 
tlphon connction. 
DATA CHALLENGES AND 
REVISIONS 
Most lws nd rultions undrlin 
th Doin Businss dt r vilbl 
on th Doin Businss wbsit t http:// 
www.doinbusinss.or. All th smpl 
qustionnirs nd th dtils undrl- 
in th indictors r lso publishd on 
th wbsit. Qustions on th mth-odolo 
 nd chllns to dt cn b 
submittd throuh th wbsit’s “Ask 
 Qustion” function t http://www 
.doinbusinss.or. 
Doin Businss publishs 18,400 indic- 
tors (92 indictors pr conom) ch 
r. To crt ths indictors, th 
tm msurs mor thn 100,000 
dt points, ch of which is md 
vilbl on th Doin Businss wbsit. 
Historicl dt for ch indictor nd 
conom r vilbl on th wbsit, 
binnin with th first r th indi-c 
tor or conom ws includd in th 
rport. To provid  comprbl tim 
sris for rsrch, th dt st is bck-c 
lcultd to djust for chns in 
mthodolo nd n rvisions in dt 
du to corrctions. This r, howvr, 
th ttin crdit, pin txs nd 
lbor mrkt rultion indictors will 
b bck-clcultd for onl on r 
bcus of th sinificnt chns in 
mthodolo for ths indictors. 
Th wbsit lso mks vilbl ll 
oriinl dt sts usd for bckround 
pprs. Th corrction rt btwn 
Doin Businss 2014 nd Doin Businss 
2015 is 5.3%.3 
Govrnmnts submit quris on th 
dt nd provid nw informtion 
to Doin Businss. Durin th Doin 
Businss 2015 production ccl th 
tm rcivd 105 such quris from 
ovrnmnts. In ddition, th tm 
hld vidoconfrncs with ovrn-m 
nt rprsnttivs in 27 conomis 
nd in-prson mtins with ovrn-m 
nt rprsnttivs in 13 conomis. 
STARTING A BUSINESS 
Doin Businss rcords ll procdurs 
officill rquird, or commonl don 
in prctic, for n ntrprnur to strt 
up nd formll oprt n industril 
or commrcil businss, s wll s th 
tim nd cost to complt ths proc- 
durs nd th pid-in minimum cpitl 
rquirmnt (fiur 14.1). Ths proc- 
durs includ obtinin ll ncssr 
licnss nd prmits nd compltin 
n rquird notifictions, vrifictions 
or inscriptions for th compn nd 
mplos with rlvnt uthoritis. 
Th rnkin of conomis on th s 
of strtin  businss is dtrmind 
b sortin thir distnc to frontir 
scors for strtin  businss. Ths 
scors r th simpl vr of th 
distnc to frontir scors for ch of 
th componnt indictors (fiur 14.2). 
Th distnc to frontir msur illus-tr 
ts th distnc of n conom to 
th “frontir,” which is drivd from th 
most fficint prctic or hihst scor 
chivd on ch indictor. 
Aftr  stud of lws, rultions 
nd publicl vilbl informtion on 
businss ntr,  dtild list of proc- 
durs is dvlopd, lon with th tim 
nd cost to compl with ch procdur 
undr norml circumstncs nd th 
pid-in minimum cpitl rquirmnt. 
Subsquntl, locl incorportion lw- 
rs, notris nd ovrnmnt officils 
complt nd vrif th dt. 
Informtion is lso collctd on th 
squnc in which procdurs r to 
b compltd nd whthr procdurs 
m b crrid out simultnousl. It is 
ssumd tht n rquird informtion 
is rdil vilbl nd tht th ntr- 
prnur will p no bribs. If nswrs b 
locl xprts diffr, inquiris continu 
until th dt r rconcild. 
To mk th dt comprbl cross 
conomis, svrl ssumptions bout 
th businss nd th procdurs r 
usd. 
Assumptions about the 
business 
Th businss: 
ƒ Is  limitd libilit compn (or its 
ll quivlnt). If thr is mor 
thn on tp of limitd libilit 
compn in th conom, th lim-it 
d libilit form most common 
mon domstic firms is chosn. 
Informtion on th most common 
form is obtind from incorportion 
lwrs or th sttisticl offic. 
FIGURE 14.1 Wht r th tim, cost, pid-in minimum cpitl nd numbr of 
procdurs to †t  locl limitd libilit compn up nd runnin†? 
$ 
Cost 
(% of income per capita) 
Paid-in 
minimum 
capital 
Number of 
procedures 
Formal operation 
Preregistration Registration, Postregistration 
incorporation 
Time 
(days) 
Entrepreneur
118 Doing Business 2015 
Rankings are based on distance to 
frontier scores for 4 indicators 
ƒƒ Operates in the economy’s largest 
business city. For 11 economies the 
data are also collected for the sec-ond 
largest business city (see table 
14A.1 at the end of the data notes). 
ƒƒ Is 100% domestically owned and has 
5 owners, none of whom is a legal 
entity. 
ƒƒ Has start-up capital of 10 times 
income per capita, paid in cash. 
ƒƒ Performs general industrial or 
commercial activities, such as the 
production or sale to the public of 
products or services. The business 
does not perform foreign trade ac-tivities 
and does not handle products 
subject to a special tax regime, for 
example, liquor or tobacco. It is not 
using heavily polluting production 
processes. 
ƒƒ Leases the commercial plant or of-fices 
and is not a proprietor of real 
estate. 
ƒƒ Does not qualify for investment 
incentives or any special benefits. 
ƒƒ Has at least 10 and up to 50 
employees 1 month after the com-mencement 
of operations, all of 
them domestic nationals. 
ƒƒ Has a turnover of at least 100 times 
income per capita. 
ƒƒ Has a company deed 10 pages long. 
Procedures 
A procedure is defined as any interac-tion 
of the company founders with ex-ternal 
parties (for example, government 
agencies, lawyers, auditors or notaries). 
Interactions between company found-ers 
or company officers and employ-ees 
are not counted as procedures. 
Procedures that must be completed in 
the same building but in different offices 
or at different counters are counted 
separately. If founders have to visit the 
same office several times for different 
sequential procedures, each is counted 
separately. The founders are assumed 
to complete all procedures themselves, 
without middlemen, facilitators, ac-countants 
or lawyers, unless the use of 
such a third party is mandated by law 
or solicited by the majority of entrepre-neurs. 
If the services of professionals are 
required, procedures conducted by such 
professionals on behalf of the company 
are counted separately. Each electronic 
procedure is counted separately. If 2 
procedures can be completed through 
the same website but require separate 
filings, they are counted as 2 separate 
procedures. 
Both pre- and postincorporation pro-cedures 
that are officially required for 
an entrepreneur to formally operate a 
business are recorded (table 14.3). 
Procedures required for official corre-spondence 
or transactions with public 
agencies are also included. For example, 
if a company seal or stamp is required 
on official documents, such as tax dec-larations, 
obtaining the seal or stamp is 
counted. Similarly, if a company must 
open a bank account before registering 
for sales tax or value added tax, this 
transaction is included as a procedure. 
Shortcuts are counted only if they fulfill 4 
criteria: they are legal, they are available 
to the general public, they are used by 
the majority of companies, and avoiding 
them causes substantial delays. 
Only procedures required of all busi-nesses 
are covered. Industry-specific 
procedures are excluded. For example, 
procedures to comply with environmen-tal 
regulations are included only when 
they apply to all businesses conducting 
general commercial or industrial activi-ties. 
Procedures that the company un-dergoes 
to connect to electricity, water, 
gas and waste disposal services are not 
included. 
Time 
Time is recorded in calendar days. The 
measure captures the median duration 
that incorporation lawyers indicate is 
necessary in practice to complete a 
procedure with minimum follow-up with 
government agencies and no extra pay-ments. 
It is assumed that the minimum 
time required for each procedure is 1 
day, except for procedures that can be 
fully completed online, for which the 
time required is recorded as half a day. 
Figure 14.2 Starting a business: 
getting a local limited liability company 
up and running 
As % of income 
per capita, no 
bribes included 
Preregistration, 
registration and 
postregistration 
(in calendar days) 
Funds deposited in a 
bank or with a notary 
before registration, as % 
of income per capita 
Procedures are 
completed when 
final document 
is received 
25% 
Paid-in 
minimum 
capital 
25% 
Time 
25% 
Cost 
25% 
Procedures 
TABLE 14.3 What do the starting 
a business indicators measure? 
Procedures to legally start and operate a 
company (number) 
Preregistration (for example, name verification or 
reservation, notarization) 
Registration in the economy’s largest business 
citya 
Postregistration (for example, social security 
registration, company seal) 
Time required to complete each procedure 
(calendar days) 
Does not include time spent gathering 
information 
Each procedure starts on a separate day 
(2 procedures cannot start on the same day)— 
though procedures that can be fully completed 
online are an exception to this rule 
Procedure considered completed once final 
incorporation document is received 
No prior contact with officials 
Cost required to complete each procedure 
(% of income per capita) 
Official costs only, no bribes 
No professional fees unless services required by 
law 
Paid-in minimum capital (% of income per 
capita) 
Funds deposited in a bank or with a notary 
before registration (or within 3 months) 
a. For 11 economies the data are also collected for the 
second largest business city.
DATA NOTES 119 
Althouh procdurs m tk plc si-mult 
nousl, th cnnot strt on th 
sm d (tht is, simultnous proc- 
durs strt on conscutiv ds), in 
with th xcption of procdurs tht 
cn b full compltd onlin. A proc- 
dur is considrd compltd onc th 
compn hs rcivd th finl incorpo-r 
tion documnt, such s th compn 
ristrtion crtifict or tx numbr. If 
 procdur cn b cclrtd for n 
dditionl cost, th fstst procdur is 
chosn if tht option is mor bnficil 
to th conom’s rnkin. It is ssumd 
tht th ntrprnur dos not wst 
tim nd commits to compltin ch 
rminin procdur without dl. Th 
tim tht th ntrprnur spnds on 
thrin informtion is inord. It is 
ssumd tht th ntrprnur is wr 
of ll ntr rquirmnts nd thir s- 
qunc from th binnin but hs hd 
no prior contct with n of th officils. 
Cost 
Cost is rcordd s  prcnt of 
th conom’s incom pr cpit. It in-clud 
s ll officil fs nd fs for ll 
or profssionl srvics if such srvics 
r rquird b lw. Fs for purchs-in 
 nd lliin compn books 
r includd if ths trnsctions r 
rquird b lw. Althouh vlu ddd 
tx ristrtion cn b countd s  
sprt procdur, vlu ddd tx is 
not prt of th incorportion cost. Th 
compn lw, th commrcil cod, 
nd spcific rultions nd f schd-ul 
s r usd s sourcs for clcultin 
costs. In th bsnc of f schduls,  
ovrnmnt officr’s stimt is tkn 
s n officil sourc. In th bsnc 
of  ovrnmnt officr’s stimt, 
stimts b incorportion lwrs r 
usd. If svrl incorportion lwrs 
provid diffrnt stimts, th mdin 
rportd vlu is pplid. In ll css 
th cost xcluds bribs. 
Paid­in 
minimum capital 
Th pid-in minimum cpitl rquir- 
mnt rflcts th mount tht th n-tr 
prnur nds to dposit in  bnk or 
with  notr bfor ristrtion nd up 
to 3 months followin incorportion nd 
is rcordd s  prcnt of th con-om 
’s incom pr cpit. Th mount 
is tpicll spcifid in th commrcil 
cod or th compn lw. Mn cono-mi 
s rquir minimum cpitl but llow 
businsss to p onl  prt of it bfor 
ristrtion, with th rst to b pid f-t 
r th first r of oprtion. In Turk 
in Jun 2014, for xmpl, th minimum 
cpitl rquirmnt ws 10,000 Turkish 
lirs, of which on-fourth ndd to b 
pid bfor ristrtion. Th pid-in 
minimum cpitl rcordd for Turk is 
thrfor 2,500 Turkish lirs, or 12.14% 
of incom pr cpit. 
Th d
t
 dt
ils on st
rtin 
 businss c
n 
b found for 
ch conom 
t http://www 
.doinbusinss.or. This mthodolo w
s 
dvlopd b Dj
nkov 
nd othrs (2002) 

nd is 
doptd hr with minor ch
ns. 
DEALING WITH 
CONSTRUCTION PERMITS 
Doin Businss rcords ll procdurs 
rquird for  businss in th con-struction 
industr to build  wr- 
hous (fiur 14.3). Ths procdurs 
includ obtinin nd submittin ll 
rlvnt projct-spcific documnts 
(for xmpl, buildin plns, sit mps 
nd crtificts of urbnism) to th 
uthoritis; hirin xtrnl third-prt 
suprvisors, ninrs or inspctors 
(if ncssr); obtinin ll ncs-s 
r clrncs, licnss, prmits nd 
crtificts; submittin ll rquird 
notifictions; nd rqustin nd 
rcivin ll ncssr inspctions (un-l 
ss compltd b  privt, third-prt 
inspctor). Doin Businss lso rcords 
procdurs for obtinin connctions 
for wtr nd swr. Procdurs 
ncssr to ristr th wrhous 
so tht it cn b usd s colltrl or 
trnsfrrd to nothr ntit r lso 
countd. Th qustionnir divids th 
procss of buildin  wrhous into 
distinct procdurs nd solicits dt for 
clcultin th tim nd cost to com-pl 
t ch procdur. Th rnkin of 
conomis on th s of dlin with 
construction prmits is dtrmind b 
sortin thir distnc to frontir scors 
for dlin with construction prmits. 
Ths scors r th simpl vr of 
th distnc to frontir scors for ch 
of th componnt indictors (fiur 
14.4). 
Informtion is collctd from xprts 
in construction licnsin, includin 
rchitcts, civil ninrs, construction 
lwrs, construction firms, utilit sr-vic 
 providrs nd public officils who 
dl with buildin rultions, includin 
pprovls, prmit issunc nd inspc-tions. 
To mk th dt comprbl 
FIGURE 14.3 Wht r th tim, cost nd numbr of procdurs to compl with 
formlitis to build  wrhous? 
Completed 
warehouse 
Cost 
(% of warehouse value) 
Preconstruction Construction Postconstruction 
and utilities 
PPrreeccoonnssttrruuccttiioonn CCoonnssttrruuccttiioonn 
A business in the 
construction 
industry 
Number of 
procedures 
Time 
(days)
120 Doing Business 2015 
Rankings are based on distance to 
frontier scores for 3 indicators 
33.3% 
Time 
33.3% 
Cost 
33.3% 
Procedures 
across economies, several assumptions 
about the business, the warehouse proj-ect 
and the utility connections are used. 
Assumptions about the 
construction company 
The business (BuildCo): 
ƒƒ Is a limited liability company. 
ƒƒ Operates in the economy’s largest 
business city. For 11 economies the 
data are also collected for the sec-ond 
largest business city (see table 
14A.1). 
ƒƒ Is 100% domestically and privately 
owned. 
ƒƒ Has 5 owners, none of whom is a 
legal entity. 
ƒƒ Is fully licensed and insured to carry 
out construction projects, such as 
building warehouses. 
ƒƒ Has 60 builders and other employ-ees, 
all of them nationals with the 
technical expertise and professional 
experience necessary to obtain con-struction 
permits and approvals. 
ƒƒ Has at least 1 employee who is a 
licensed architect or engineer and 
registered with the local association 
of architects or engineers. 
ƒƒ Has paid all taxes and taken out 
all necessary insurance applicable 
to its general business activity (for 
example, accidental insurance for 
construction workers and third-person 
liability). 
ƒƒ Owns the land on which the ware-house 
will be built. 
Assumptions about the 
warehouse 
The warehouse: 
ƒƒWill be used for general storage 
activities, such as storage of books 
or stationery. The warehouse will 
not be used for any goods requiring 
special conditions, such as food, 
chemicals or pharmaceuticals. 
ƒƒWill have 2 stories, both above 
ground, with a total constructed 
area of 1,300.6 square meters 
(14,000 square feet). Each floor will 
be 3 meters (9 feet, 10 inches) high. 
ƒƒWill have road access and be lo-cated 
in the periurban area of the 
economy’s largest business city 
(that is, on the fringes of the city 
but still within its official limits). 
For 11 economies the data are also 
collected for the second largest 
business city. 
ƒƒWill not be located in a special eco-nomic 
or industrial zone. 
ƒƒWill be located on a land plot of 
929 square meters (10,000 square 
feet) that is 100% owned by BuildCo 
and is accurately registered in the 
cadastre and land registry. 
ƒƒ Is valued at 50 times income per 
capita.4 
ƒƒWill be a new construction (there 
was no previous construction on the 
land). 
ƒƒWill have complete architectural 
and technical plans prepared by a 
licensed architect. If preparation 
of the plans requires such steps as 
obtaining further documentation or 
getting prior approvals from exter-nal 
agencies, these are counted as 
procedures. 
ƒƒWill include all technical equipment 
required to be fully operational. 
ƒƒWill take 30 weeks to construct (ex-cluding 
all delays due to administra-tive 
and regulatory requirements). 
Assumptions about the utility 
connections 
The water and sewerage connections: 
ƒƒWill be 150 meters (492 feet) from 
the existing water source and sewer 
tap. If there is no water delivery 
infrastructure in the economy, a 
borehole will be dug. If there is no 
sewerage infrastructure, a septic 
tank in the smallest size available 
will be installed or built. 
ƒƒWill not require water for fire pro-tection 
reasons; a fire extinguishing 
system (dry system) will be used 
instead. If a wet fire protection sys-tem 
is required by law, it is assumed 
that the water demand specified 
below also covers the water needed 
for fire protection. 
ƒƒWill have an average water use of 
662 liters (175 gallons) a day and 
an average wastewater flow of 568 
liters (150 gallons) a day. 
ƒƒWill have a peak water use of 1,325 
liters (350 gallons) a day and a peak 
wastewater flow of 1,136 liters (300 
gallons) a day. 
ƒƒWill have a constant level of water 
demand and wastewater flow 
throughout the year. 
ƒƒWill be 1 inch in diameter for the wa-ter 
connection and 4 inches in diam-eter 
for the sewerage connection. 
Procedures 
A procedure is any interaction of the 
company’s employees or managers, 
or any party acting on behalf of the 
company, with external parties, includ-ing 
government agencies, notaries, 
the land registry, the cadastre, utility 
companies and public inspectors—or 
the hiring of private inspectors and 
technical experts apart from in-house 
architects and engineers. Interactions 
between company employees, such 
as development of the warehouse 
plans and inspections conducted by 
employees, are not counted as proce-dures. 
But interactions necessary to 
obtain any plans, drawings or other 
documents from external parties (in-cluding 
any documentation required 
Figure 14.4 Dealing with construction 
permits: building a warehouse 
Days to comply 
with formalities 
to build a 
warehouse 
As % of 
warehouse 
value, no 
bribes included 
Procedures are completed when final 
document is received; construction permits, 
inspections and utility connections included
DATA NOTES 121 
for th rchitct to prpr th plns), 
or to hv such documnts pprovd 
or stmpd b xtrnl prtis, r 
countd s procdurs. Procdurs tht 
th compn undros to connct th 
wrhous to wtr nd swr r 
includd. All procdurs tht r lll 
rquird, or tht r don in prctic 
b th mjorit of compnis, to build 
 wrhous r countd, vn if th 
m b voidd in xcptionl css 
(tbl 14.4). 
Time 
Tim is rcordd in clndr ds. Th 
msur cpturs th mdin durtion 
tht locl xprts indict is ncssr 
to complt  procdur in prctic. 
It is ssumd tht th minimum tim 
rquird for ch procdur is 1 d, 
xcpt for procdurs tht cn b full 
compltd onlin, for which th tim 
rquird is rcordd s hlf  d. 
Althouh procdurs m tk plc 
simultnousl, th cnnot strt on 
th sm d (tht is, simultnous 
procdurs strt on conscutiv ds), 
in with th xcption of procdurs 
tht cn b full compltd onlin. If  
procdur cn b cclrtd lll 
for n dditionl cost nd th cclr- 
td procdur is usd b th mjorit 
of compnis, th fstst procdur is 
chosn. It is ssumd tht BuildCo dos 
not wst tim nd commits to com-pl 
tin ch rminin procdur with-out 
dl. Th tim tht BuildCo spnds 
on thrin informtion is not tkn 
into ccount. It is ssumd tht BuildCo 
is wr of ll buildin rquirmnts nd 
thir squnc from th binnin. 
Cost 
Cost is rcordd s  prcnt of th 
wrhous vlu (ssumd to b 50 
tims incom pr cpit). Onl officil 
costs r rcordd. All th fs ssoci- 
td with compltin th procdurs to 
lll build  wrhous r rcordd, 
includin thos ssocitd with obtin-in 
 lnd us pprovls nd prcon-struction 
dsin clrncs; rcivin 
inspctions bfor, durin nd ftr 
construction; obtinin utilit connc-tions; 
nd ristrin th wrhous 
proprt. Nonrcurrin txs rquird 
for th compltion of th wrhous 
projct r lso rcordd. Sls txs 
(such s vlu ddd tx) or cpitl 
ins txs r not rcordd. Nor r 
dposits tht must b pid up front 
nd r ltr rfundd. Th buildin 
cod, informtion from locl xprts, 
nd spcific rultions nd f schd-ul 
s r usd s sourcs for costs. If 
svrl locl prtnrs provid diffrnt 
stimts, th mdin rportd vlu is 
usd. 
Th d
t
 dt
ils on d
lin with con-struction 
prmits c
n b found for 
ch 
conom 
t http://www.doinbusinss.or. 
GETTING ELECTRICITY 
Doin Businss rcords ll procdurs 
rquird for  businss to obtin  pr-m 
nnt lctricit connction nd sup-pl 
 for  stndrdid wrhous (fiur 
14.5). Ths procdurs includ pplic- 
tions nd contrcts with lctricit 
utilitis, ll ncssr inspctions nd 
clrncs from th utilit nd othr 
ncis, nd th xtrnl nd finl 
connction works. Th qustionnir di-vid 
s th procss of ttin n lctric-it 
 connction into distinct procdurs 
nd solicits dt for clcultin th tim 
nd cost to complt ch procdur. 
Th rnkin of conomis on th s 
of ttin lctricit is dtrmind b 
sortin thir distnc to frontir scors 
for ttin lctricit. Ths scors r 
th simpl vr of th distnc to 
TABLE 14.4 Wht do th dlin† 
with construction prmits indictors 
msur? 
Proc	dur	s to l	­ll‡ build ­ w­r	hous	 
(numb	r) 
Submittin ll rlvnt documnts nd obtinin 
ll ncssr clrncs, licnss, prmits nd 
crtificts 
Submittin ll rquird notifictions nd 
rcivin ll ncssr inspctions 
Obtinin utilit connctions for wtr nd 
swr 
Ristrin th wrhous ftr its compltion 
(if rquird for us s colltrl or for trnsfr of 
th wrhous) 
Tim	 r	quir	d to compl	t	 	­ch proc	dur	 
(c­l	nd­r d­‡s) 
Dos not includ tim spnt thrin 
informtion 
Ech procdur strts on  sprt d— 
thouh procdurs tht cn b full compltd 
onlin r n xcption to this rul 
Procdur considrd compltd onc finl 
documnt is rcivd 
No prior contct with officils 
Cost r	quir	d to compl	t	 	­ch proc	dur	 
(% of w­r	hous	 v­lu	) 
Officil costs onl, no bribs 
FIGURE 14.5 Doin Businss msurs th connction procss t th lvl of 
distribution utilitis 
Generation Transmission 
Distribution 
u New connections 
Network operation and maintenance 
Metering and billing 
Customer
122 Doing Business 2015 
frontier scores for each of the compo-nent 
indicators (figure 14.6). 
Data are collected from the electricity 
distribution utility, then completed and 
verified by electricity regulatory agen-cies 
and independent professionals 
such as electrical engineers, electrical 
contractors and construction compa-nies. 
The electricity distribution utility 
consulted is the one serving the area (or 
areas) where warehouses are located. If 
there is a choice of distribution utilities, 
the one serving the largest number of 
customers is selected. 
To make the data comparable across 
economies, several assumptions about 
the warehouse and the electricity con-nection 
are used. 
Assumptions about the 
warehouse 
The warehouse: 
ƒƒ Is owned by a local entrepreneur. 
ƒƒ Is located in the economy’s largest 
business city. For 11 economies the 
data are also collected for the sec-ond 
largest business city (see table 
14A.1). 
ƒƒ Is located in an area where similar 
warehouses are typically located. In 
this area a new electricity connection 
is not eligible for a special investment 
promotion regime (offering special 
subsidization or faster service, for 
example). 
ƒƒ Is located in an area with no physi-cal 
constraints. For example, the 
property is not near a railway. 
ƒƒ Is a new construction and is being 
connected to electricity for the first 
time. 
ƒƒ Has 2 stories, both above ground, 
with a total surface area of ap-proximately 
1,300.6 square meters 
(14,000 square feet). The plot of 
land on which it is built is 929 
square meters (10,000 square feet). 
ƒƒ Is used for storage of refrigerated 
goods. 
Assumptions about the 
electricity connection 
The electricity connection: 
ƒƒ Is a permanent one. 
ƒƒ Is a 3-phase, 4-wire Y, 140-kilovolt-ampere 
(kVA) (subscribed capacity) 
connection (where the voltage is 
120/208 V, the current would be 
400 amperes; where it is 230/400 
B, the current would be nearly 200 
amperes). 
ƒƒ Is 150 meters long. The connection 
is to either the low-voltage or the 
medium-voltage distribution net-work 
and either overhead or under-ground, 
whichever is more common 
in the area where the warehouse is 
located. 
ƒƒ Requires works that involve the 
crossing of a 10-meter road (such 
as by excavation or overhead lines) 
but are all carried out on public land. 
There is no crossing of other owners’ 
private property because the ware-house 
has access to a road. 
ƒƒ Includes only a negligible length in 
the customer’s private domain. 
ƒƒWill supply monthly electricity con-sumption 
of 0.07 gigawatt-hours 
(GWh). 
ƒƒ Does not involve work to install the 
internal electrical wiring. This has 
already been completed, up to and 
including the customer’s service 
panel or switchboard and installa-tion 
of the meter base. 
Procedures 
A procedure is defined as any interac-tion 
of the company’s employees or its 
main electrician or electrical engineer 
(that is, the one who may have done the 
internal wiring) with external parties, 
such as the electricity distribution util-ity, 
electricity supply utilities, govern-ment 
agencies, electrical contractors 
and electrical firms. Interactions be-tween 
company employees and steps 
related to the internal electrical wiring, 
such as the design and execution of the 
internal electrical installation plans, are 
not counted as procedures. Procedures 
that must be completed with the same 
utility but with different departments 
are counted as separate procedures 
(table 14.5). 
The company’s employees are as-sumed 
to complete all procedures 
themselves unless the use of a third 
party is mandated (for example, if only 
an electrician registered with the utility 
Figure 14.6 Getting electricity: 
obtaining an electricity connection 
Rankings are based on distance to 
frontier scores for 3 indicators 
Days to obtain 
an electricity 
connection 
As % of income 
per capita, no 
bribes included 
33.3% 
Time 
33.3% 
Cost 
33.3% 
Procedures 
Steps to file an application, prepare a 
design, complete works, obtain approvals, 
go through inspections, install a meter 
and sign a supply contract 
TABLE 14.5 What do the getting 
electricity indicators measure? 
Procedures to obtain an electricity connection 
(number) 
Submitting all relevant documents and obtaining 
all necessary clearances and permits 
Completing all required notifications and 
receiving all necessary inspections 
Obtaining external installation works and 
possibly purchasing material for these works 
Concluding any necessary supply contract and 
obtaining final supply 
Time required to complete each procedure 
(calendar days) 
Is at least 1 calendar day 
Each procedure starts on a separate day 
Does not include time spent gathering 
information 
Reflects the time spent in practice, with little 
follow-up and no prior contact with officials 
Cost required to complete each procedure 
(% of income per capita) 
Official costs only, no bribes 
Value added tax excluded
DATA NOTES 123 
is llowd to submit n ppliction). If 
th compn cn, but is not rquird 
to, rqust th srvics of profssion- 
ls (such s  privt firm rthr thn 
th utilit for th xtrnl works), ths 
procdurs r rcordd if th r 
commonl don. For ll procdurs, 
onl th most likl css (for xmpl, 
mor thn 50% of th tim th utilit 
hs th mtril) nd thos followd in 
prctic for connctin  wrhous to 
lctricit r countd. 
Time 
Tim is rcordd in clndr ds. Th 
msur cpturs th mdin durtion 
tht th lctricit utilit nd xprts 
indict is ncssr in prctic, rthr 
thn rquird b lw, to complt  
procdur with minimum follow-up nd 
no xtr pmnts. It is lso ssumd 
tht th minimum tim rquird for 
ch procdur is 1 d. Althouh pro-c 
durs m tk plc simultnousl, 
th cnnot strt on th sm d 
(tht is, simultnous procdurs strt 
on conscutiv ds). It is ssumd tht 
th compn dos not wst tim nd 
commits to compltin ch rminin 
procdur without dl. Th tim tht 
th compn spnds on thrin in-form 
tion is not tkn into ccount. It is 
ssumd tht th compn is wr of 
ll lctricit connction rquirmnts 
nd thir squnc from th binnin. 
Cost 
Cost is rcordd s  prcnt of th 
conom’s incom pr cpit. Costs 
r rcordd xclusiv of vlu ddd 
tx. All th fs nd costs ssocitd 
with compltin th procdurs to con-n 
ct  wrhous to lctricit r 
rcordd, includin thos rltd to 
obtinin clrncs from ovrnmnt 
ncis, pplin for th connction, 
rcivin inspctions of both th sit 
nd th intrnl wirin, purchsin 
mtril, ttin th ctul connction 
works nd pin  scurit dposit. 
Informtion from locl xprts nd 
spcific rultions nd f schd-ul 
s r usd s sourcs for costs. If 
svrl locl prtnrs provid diffrnt 
stimts, th mdin rportd vlu 
is usd. In ll css th cost xcluds 
bribs. 
Security deposit 
Utilitis rquir scurit dposits s  
urnt inst th possibl filur 
of customrs to p thir consump-tion 
bills. For this rson th scurit 
dposit for  nw customr is most 
oftn clcultd s  function of th 
customr’s stimtd consumption. 
Doin Businss dos not rcord th full 
mount of th scurit dposit. If th 
dposit is bsd on th customr’s 
ctul consumption, this bsis is 
th on ssumd in th cs stud. 
Rthr thn th full mount of th 
scurit dposit, Doin Businss r- 
cords th prsnt vlu of th losss 
in intrst rnins xprincd b 
th customr bcus th utilit holds 
th scurit dposit ovr  prolond 
priod, in most css until th nd of 
th contrct (ssumd to b ftr 5 
rs). In css whr th scurit d- 
posit is usd to covr th first monthl 
consumption bills, it is not rcordd. To 
clcult th prsnt vlu of th lost 
intrst rnins, th nd-2013 lndin 
rts from th Intrntionl Montr 
Fund’s Intrn
tion
l Fin
nci
l St
tistics 
r usd. In css whr th scurit 
dposit is rturnd with intrst, th 
diffrnc btwn th lndin rt 
nd th intrst pid b th utilit is 
usd to clcult th prsnt vlu. 
In som conomis th scurit dposit 
cn b put up in th form of  bond: 
th compn cn obtin from  bnk 
or n insurnc compn  urnt 
issud on th ssts it holds with tht 
finncil institution. In contrst to th 
scnrio in which th customr ps 
th dposit in csh to th utilit, in 
this scnrio th compn dos not 
los ownrship control ovr th full 
mount nd cn continu usin it. In 
rturn th compn will p th bnk 
 commission for obtinin th bond. 
Th commission chrd m vr 
dpndin on th crdit stndin of 
th compn. Th bst possibl crdit 
stndin nd thus th lowst possibl 
commission r ssumd. Whr  
bond cn b put up, th vlu rcordd 
for th dposit is th nnul commis-sion 
tims th 5 rs ssumd to b 
th lnth of th contrct. If both op-tions 
xist, th chpr ltrntiv is 
rcordd. 
In Hondurs in Jun 2014  customr r- 
qustin  140-kVA lctricit connc-tion 
would hv hd to put up  scurit 
dposit of 118,434 Hondurn lmpirs 
(L) in csh or chck, nd th dposit 
would hv bn rturnd onl t th 
nd of th contrct. Th customr could 
instd hv invstd this mon t th 
prvilin lndin rt of 20.08%. Ovr 
th 5 rs of th contrct this would 
impl  prsnt vlu of lost intrst 
rnins of L 70,998.58. In contrst, if 
th customr chos to sttl th dposit 
with  bnk urnt t n nnul rt 
of 2.5%, th mount lost ovr th 5 rs 
would b just L 14,804.30. 
Th d
t
 dt
ils on ttin lctricit 
c
n b found for 
ch conom 
t http:// 
www.doinbusinss.or. 
REGISTERING PROPERTY 
Doin Businss rcords th full s- 
qunc of procdurs ncssr for 
 businss (th bur) to purchs  
proprt from nothr businss (th 
sllr) nd to trnsfr th proprt titl 
to th bur’s nm so tht th bur 
cn us th proprt for xpndin its 
businss, us th proprt s colltrl 
in tkin nw lons or, if ncssr, 
sll th proprt to nothr businss. 
Th procss strts with obtinin th 
ncssr documnts, such s  cop 
of th sllr’s titl if ncssr, nd 
conductin du dilinc if rquird. 
Th trnsction is considrd complt 
whn it is opposbl to third pr-ti 
s nd whn th bur cn us th
124 Doing Business 2015 
Land  2-story 
warehouse 
property, use it as collateral for a bank 
loan or resell it (figure 14.7). The ranking 
of economies on the ease of register-ing 
property is determined by sorting 
their distance to frontier scores for 
registering property. These scores are 
the simple average of the distance to 
frontier scores for each of the compo-nent 
indicators (figure 14.8). 
Every procedure required by law or nec-essary 
in practice is included, whether 
it is the responsibility of the seller or 
the buyer or must be completed by a 
third party on their behalf. Local prop-erty 
lawyers, notaries and property 
registries provide information on pro-cedures 
as well as the time and cost to 
complete each of them. The registering 
property indicators do not measure the 
accessibility of property registration 
systems, the legal security offered by 
formal registration, the use of informal 
property registration systems or the 
equity of land policies. 
To make the data comparable across 
economies, several assumptions about 
the parties to the transaction, the 
property and the procedures are used. 
Assumptions about the parties 
The parties (buyer and seller): 
ƒƒ Are limited liability companies. 
ƒƒ Are located in the periurban area 
of the economy’s largest business 
city. For 11 economies the data are 
also collected for the second largest 
business city (see table 14A.1). 
ƒƒ Are 100% domestically and privately 
owned. 
ƒƒ Have 50 employees each, all of 
whom are nationals. 
ƒƒ Perform general commercial activities. 
Assumptions about the 
property 
The property: 
ƒƒ Has a value of 50 times income per 
capita. The sale price equals the 
value. 
ƒƒ Is fully owned by the seller. 
ƒƒ Has no mortgages attached and 
has been under the same ownership 
for the past 10 years. 
ƒƒ Is registered in the land registry or 
cadastre, or both, and is free of title 
disputes. 
ƒƒ Is located in a periurban commercial 
zone, and no rezoning is required. 
ƒƒ Consists of land and a building. The 
land area is 557.4 square meters 
(6,000 square feet). A 2-story ware-house 
of 929 square meters (10,000 
square feet) is located on the land. 
The warehouse is 10 years old, is in 
good condition and complies with 
all safety standards, building codes 
and other legal requirements. It has 
no heating system. The property of 
land and building will be transferred 
in its entirety. 
Rankings are based on distance to 
frontier scores for 3 indicators 
33.3% 
Time 
33.3% 
Cost 
33.3% 
Procedures 
ƒƒWill not be subject to renovations 
or additional building following the 
purchase. 
ƒƒ Has no trees, natural water sources, 
natural reserves or historical monu-ments 
of any kind. 
ƒƒWill not be used for special purpos-es, 
and no special permits, such as 
for residential use, industrial plants, 
waste storage or certain types of 
agricultural activities, are required. 
ƒƒ Has no occupants, and no other 
party holds a legal interest in it. 
Procedures 
A procedure is defined as any interac-tion 
of the buyer or the seller, their 
agents (if an agent is legally or in 
practice required) or the property with 
external parties, including government 
agencies, inspectors, notaries and law-yers. 
Interactions between company 
officers and employees are not con-sidered. 
All procedures that are legally 
or in practice required for registering 
property are recorded, even if they may 
be avoided in exceptional cases (table 
14.6). It is assumed that the buyer fol-lows 
the fastest legal option available 
and used by the majority of property 
owners. Although the buyer may use 
lawyers or other professionals where 
Figure 14.7 What are the time, cost and number of procedures required to transfer 
property between 2 local companies? 
Number of 
procedures 
Buyer can use 
the property, 
resell it or use 
it as collateral 
Preregistration Registration Postregistration 
Time 
(days) 
Cost 
(% of property value) 
Seller with property 
registered and no 
title disputes 
Figure 14.8 Registering property: 
transfer of property between 2 local 
companies 
Days to 
transfer 
property 
As % of property 
value, no bribes 
included 
Steps to check encumbrances, obtain 
clearance certificates, prepare deed and 
transfer title so that the property can be 
occupied, sold or used as collateral
Data Notes 125 
necessary in the registration process, 
it is assumed that the buyer does not 
employ an outside facilitator in the 
registration process unless legally or in 
practice required to do so. 
Time 
Time is recorded in calendar days. The 
measure captures the median dura-tion 
that property lawyers, notaries or 
registry officials indicate is necessary 
to complete a procedure. It is assumed 
that the minimum time required for 
each procedure is 1 day, except for 
procedures that can be fully completed 
online, for which the time required is 
recorded as half a day. Although proce-dures 
may take place simultaneously, 
they cannot start on the same day, 
again with the exception of procedures 
that can be fully completed online. It is 
assumed that the buyer does not waste 
time and commits to completing each 
remaining procedure without delay. If a 
procedure can be accelerated for an ad-ditional 
cost, the fastest legal procedure 
available and used by the majority of 
property owners is chosen. If procedures 
can be undertaken simultaneously, it is 
assumed that they are. It is assumed 
that the parties involved are aware of all 
requirements and their sequence from 
the beginning. Time spent on gathering 
information is not considered. 
Cost 
Cost is recorded as a percentage of the 
property value, assumed to be equiva-lent 
to 50 times income per capita. 
Only official costs required by law are 
recorded, including fees, transfer taxes, 
stamp duties and any other payment to 
the property registry, notaries, public 
agencies or lawyers. Other taxes, such 
as capital gains tax or value added tax, 
are excluded from the cost measure. 
Both costs borne by the buyer and 
those borne by the seller are included. 
If cost estimates differ among sources, 
the median reported value is used. 
The data details on registering property 
can be found for each economy at http:// 
www.doingbusiness.org. 
GETTING CREDIT 
Doing Business measures the legal 
rights of borrowers and lenders with re-spect 
to secured transactions through 
one set of indicators and the sharing 
of credit information through another. 
The first set of indicators measures 
whether certain features that facilitate 
lending exist within the applicable col-lateral 
and bankruptcy laws. The sec-ond 
set measures the coverage, scope 
and accessibility of credit information 
available through credit reporting ser-vice 
providers such as credit bureaus 
or credit registries (figure 14.9). The 
ranking of economies on the ease of 
getting credit is determined by sorting 
their distance to frontier scores for 
getting credit. These scores are the 
distance to frontier score for the sum 
of the strength of legal rights index and 
the depth of credit information index 
(figure 14.10). 
Legal rights 
The data on the legal rights of borrow-ers 
and lenders are gathered through 
a questionnaire administered to 
financial lawyers and verified through 
analysis of laws and regulations as 
well as public sources of information 
on collateral and bankruptcy laws. 
Questionnaire responses are verified 
through several rounds of follow-up 
communication with respondents as 
well as by contacting third parties and 
consulting public sources. The ques-tionnaire 
data are confirmed through 
teleconference calls or on-site visits in 
all economies. 
Figure 14.9 Do lenders have credit information on entrepreneurs seeking credit? Is 
the law favorable to borrowers and lenders using movable assets as collateral? 
Movable 
asset 
Collateral 
registry Lender Credit bureaus 
and registries 
Potential 
borrower 
What types can be 
used as collateral? 
Can lenders access 
credit information 
on borrowers? 
Can movable assets be 
used as collateral? 
Credit information 
TABLE 14.6 What do the registering 
property indicators measure? 
Procedures to legally transfer title on 
immovable property (number) 
Preregistration procedures (for example, 
checking for liens, notarizing sales agreement, 
paying property transfer taxes) 
Registration procedures in the economy’s largest 
business citya 
Postregistration procedures (for example, filing 
title with municipality) 
Time required to complete each procedure 
(calendar days) 
Does not include time spent gathering 
information 
Each procedure starts on a separate day— 
though procedures that can be fully completed 
online are an exception to this rule 
Procedure considered completed once final 
document is received 
No prior contact with officials 
Cost required to complete each procedure 
(% of property value) 
Official costs only, no bribes 
No value added or capital gains taxes included 
a. For 11 economies the data are also collected for the 
second largest business city.
126 DOING BUSINESS 2015 
Rankings are based on distance to frontier 
scores for the sum of 2 indicators 
100% 
Sum of strength of 
legal rights index (0–12) 
and 
depth of credit 
information index 
(0–8) 
Strength of legal rights index 
Th strnth of ll rihts indx m- 
surs th dr to which colltrl 
nd bnkruptc lws protct th rihts 
of borrowrs nd lndrs nd thus 
fcilitt lndin (tbl 14.7). Th indx 
for th first tim this r includs 12 
componnts rthr thn 10. For ch 
conom it is first ssssd whthr  
unitr scurd trnsctions sstm 
xists. Thn 2 cs scnrios, cs A 
nd cs B, r usd to dtrmin how 
 nonpossssor scurit intrst is 
crtd, publicid nd nforcd c-cordin 
 to th lw. Spcil mphsis 
is ivn to how th colltrl ristr 
oprts (if ristrtion of scurit in-t 
rsts is possibl). Th cs scnrios 
involv  scurd borrowr, th comp- 
n ABC, nd  scurd lndr, BiBnk. 
In som conomis th ll frmwork 
for scurd trnsctions will llow onl 
cs A or cs B (not both) to ppl. 
Both css xmin th sm st of 
ll provisions rltin to th us of 
movbl colltrl. 
Svrl ssumptions bout th scurd 
borrowr (ABC) nd lndr (BiBnk) 
r usd: 
ƒ ABC is  domstic limitd libilit 
compn. 
ƒ ABC hs up to 50 mplos. 
ƒ ABC hs its hdqurtrs nd onl 
bs of oprtions in th conom’s 
lrst businss cit. For 11 cono-mi 
s th dt r lso collctd for 
th scond lrst businss cit 
(s tbl 14A.1). 
ƒ Both ABC nd BiBnk r 100% 
domsticll ownd. 
Th cs scnrios lso involv 
ssumptions. In cs A, s collt- 
rl for th lon, ABC rnts BiBnk 
 nonpossssor scurit intrst in 
on ctor of movbl ssts, for 
xmpl, its mchinr or its invntor. 
ABC wnts to kp both possssion 
nd ownrship of th colltrl. In 
conomis whr th lw dos not l-low 
nonpossssor scurit intrsts 
in movbl proprt, ABC nd BiBnk 
us  fiducir trnsfr-of-titl r-r 
nmnt (or  similr substitut for 
nonpossssor scurit intrsts). 
In cs B, ABC rnts BiBnk  busi-n 
ss chr, ntrpris chr, flot-in 
 chr or n chr tht ivs 
BiBnk  scurit intrst ovr ABC’s 
combind movbl ssts (or s much 
of ABC’s movbl ssts s possibl). 
ABC kps ownrship nd possssion 
of th ssts. 
Th strnth of ll rihts indx 
covrs functionl quivlnts to scu-rit 
 ovr movbl ssts (for xmpl, 
lsin or rsrvtion of titl) onl in 
its first componnt, to ssss how in-t 
rtd or unifid th conom’s ll 
frmwork for scurd trnsctions is. 
Th strnth of ll rihts indx 
includs 10 spcts rltd to ll 
rihts in colltrl lw nd 2 spcts 
in bnkruptc lw. A scor of 1 is 
ssind for ch of th followin 
fturs of th lws: 
ƒ Th conom hs n intrtd or 
unifid ll frmwork for scurd 
trnsctions tht xtnds to th 
crtion, publicit nd nforcmnt 
of 4 functionl quivlnts to s- 
curit intrsts in movbl ssts: 
fiducir trnsfr of titl; finncil 
lss; ssinmnt or trnsfr of 
rcivbls; nd sls with rtn-tion 
of titl. 
ƒ Th lw llows  businss to rnt 
 nonpossssor scurit riht in  
sinl ctor of movbl ssts 
(such s mchinr or invntor), 
without rquirin  spcific dscrip-tion 
of th colltrl. 
ƒ Th lw llows  businss to rnt 
 nonpossssor scurit riht in 
substntill ll its movbl ssts, 
without rquirin  spcific dscrip-tion 
of th colltrl. 
ƒ A scurit riht cn b ivn ovr 
futur or ftr-cquird ssts 
nd xtnds utomticll to th 
products, procds or rplcmnts 
of th oriinl ssts. 
ƒ A nrl dscription of dbts nd 
oblitions is prmittd in th col-l 
trl rmnt nd in ristr- 
tion documnts, ll tps of dbts 
nd oblitions cn b scurd b- 
twn th prtis, nd th colltrl 
rmnt cn includ  mximum 
mount for which th ssts r 
ncumbrd. 
ƒ A colltrl ristr or ristrtion 
institution for scurit intrsts 
rntd ovr movbl proprt b 
incorportd nd nonincorportd 
FIGURE 14.10 Gttin† crdit: colltrl 
ruls nd crdit informtion 
Regulations on nonpossessory security 
interests in movable property 
Scope, quality and accessibility of credit 
information through credit bureaus and registries 
Not: Crdit buru covr nd crdit ristr 
covr r msurd but do not count for th 
rnkins. 
TABLE 14.7 Wht do th †ttin† 
crdit indictors msur? 
Str	nth of l	­l rihts ind	x (0–12) 
Protction of rihts of borrowrs nd lndrs 
throuh colltrl lws 
Protction of scurd crditors’ rihts throuh 
bnkruptc lws 
D	pth of cr	dit inform­tion ind	x (0–8) 
Scop nd ccssibilit of crdit informtion 
distributd b crdit ristris nd crdit 
burus 
Cr	dit bur	­u cov	r­	 (% of ­dults) 
Numbr of individuls nd firms listd in th 
lrst crdit buru s prcnt of dult 
popultion 
Cr	dit r	istr‡ cov	r­	 (% of ­dults) 
Numbr of individuls nd firms listd in  crdit 
ristr s prcnt of dult popultion
DATA NOTES 127 
ntitis is in oprtion, unifid o- 
rphicll nd with n lc-tronic 
dtbs indxd b dbtors’ 
nms. 
ƒ Th colltrl ristr is  notic- 
bsd ristr— ristr tht fils 
onl  notic of th xistnc of  
scurit intrst (not th undrlin 
documnts) nd dos not prform  
ll rviw of th trnsction. Th 
ristr lso publicis functionl 
quivlnts to scurit intrsts. 
ƒ Th colltrl ristr hs modrn 
fturs such s thos tht llow 
scurd crditors (or thir rprsn-t 
tivs) to ristr, srch, mnd or 
cncl scurit intrsts onlin. 
ƒ Scurd crditors r pid first (for 
xmpl, bfor tx clims nd m-plo 
 clims) whn  dbtor dfults 
outsid n insolvnc procdur. 
ƒ Scurd crditors r pid first (for 
xmpl, bfor tx clims nd 
mplo clims) whn  businss 
is liquidtd. 
ƒ Scurd crditors r subjct to 
n utomtic st on nforcmnt 
procdurs whn  dbtor ntrs 
 court-suprvisd rornition 
procdur, but th lw protcts 
scurd crditors’ rihts b provid-in 
 clr rounds for rlif from th 
utomtic st (for xmpl, if th 
movbl proprt is in dnr) or 
sttin  tim limit for it. 
ƒ Th lw llows prtis to r in 
th colltrl rmnt tht th 
lndr m nforc its scurit 
riht out of court; th lw llows 
public nd privt uctions nd lso 
prmits th scurd crditor to tk 
th sst in stisfction of th dbt. 
As  rsult of chns introducd 
this r, th first componnt of th 
indx rplcs on rltin to ll 
limittions on who cn prticipt in  
scurit rmnt. Two componnts 
wr ddd, on wht tp of colltrl 
ristr oprts in th conom nd 
on how it oprts. Th scorin now 
pnlis conomis for not hvin n 
utomtic st on nforcmnt durin 
rornition procdurs so s to 
nsur tht  vibl businss cn con-tinu 
 to oprt. And th indx tks 
into ccount nw lmnts rltin to 
out-of-court nforcmnt procdurs 
(such s th tps of uctions llowd). 
Th indx rns from 0 to 12, with 
hihr scors indictin tht colltrl 
nd bnkruptc lws r bttr d- 
sind to xpnd ccss to crdit. 
Credit information 
Th dt on th shrin of crdit 
informtion r built in 2 sts. 
First, bnkin suprvision uthoritis 
nd public informtion sourcs r 
survd to confirm th prsnc of  
crdit rportin srvic providr, such 
s  crdit buru or crdit ristr. 
Scond, whn pplicbl,  dtild 
qustionnir on th crdit buru’s 
or crdit ristr’s structur, lws nd 
ssocitd ruls is dministrd to th 
ntit itslf. Qustionnir rsponss 
r vrifid throuh svrl rounds of 
follow-up communiction with rspon-d 
nts s wll s b contctin third 
prtis nd consultin public sourcs. 
Th qustionnir dt r confirmd 
throuh tlconfrnc clls or on-sit 
visits in ll conomis. 
Depth of credit information 
index 
Th dpth of crdit informtion indx 
msurs ruls nd prctics ffctin 
th covr, scop nd ccssibilit 
of crdit informtion vilbl throuh 
ithr  crdit buru or  crdit r- 
istr. A scor of 1 is ssind for ch 
of th followin 8 fturs of th crdit 
buru or crdit ristr (or both): 
ƒ Dt on both firms nd individuls 
r distributd. 
ƒ Both positiv crdit informtion 
(for xmpl, oriinl lon mounts, 
outstndin lon mounts nd  
pttrn of on-tim rpmnts) nd 
ntiv informtion (for xmpl, 
lt pmnts nd th numbr nd 
mount of dfults) r distributd. 
ƒ Dt from rtilrs nd utilit com-p 
nis r distributd in ddition to 
dt from finncil institutions. 
ƒ At lst 2 rs of historicl dt 
r distributd. Crdit burus nd 
ristris tht distribut mor thn 
10 rs of ntiv dt or rs 
dt on dfults s soon s th r 
rpid obtin  scor of 0 for this 
componnt.5 
ƒ Dt on lon mounts blow 1% of 
incom pr cpit r distributd. 
ƒ B lw, borrowrs hv th riht 
to ccss thir dt in th lrst 
crdit buru or ristr in th 
conom. Crdit burus nd r- 
istris tht chr mor thn 1% of 
incom pr cpit for borrowrs to 
inspct thir dt obtin  scor of 
0 for this componnt.6 
ƒ Dt usrs cn ccss borrowrs’ 
crdit informtion onlin (for x- 
mpl, throuh n onlin pltform, 
 sstm-to-sstm connction or 
both).7 
ƒ Buru or ristr crdit scors r 
offrd s  vlu ddd srvic to 
hlp dt usrs ssss th crdit-worthin 
ss of borrowrs.8 
Prviousl th dpth of crdit infor-m 
tion indx covrd onl th first 
6 fturs listd bov. Th indx 
rns from 0 to 8, with hihr vlus 
indictin th vilbilit of mor crdit 
informtion, from ithr  crdit buru 
or  crdit ristr, to fcilitt lndin 
dcisions. If th crdit buru or ristr 
is not oprtionl or covrs lss thn 5% 
of th dult popultion, th scor on th 
dpth of crdit informtion indx is 0. 
In Lithuni, for xmpl, both  crdit 
buru nd  crdit ristr oprt. 
Both distribut dt on firms nd in-dividu 
ls ( scor of 1). Both distribut 
positiv nd ntiv informtion ( 
scor of 1). Althouh th crdit ristr 
dos not distribut dt from rtil- 
rs or utilitis, th crdit buru dos 
( scor of 1). Both distribut t lst 
2 rs of historicl dt ( scor of 
1). Althouh th crdit ristr hs
128 DOING BUSINESS 2015 
 thrshold of 1,000 liti, th crdit 
buru distributs dt on lons of 
n vlu ( scor of 1). Borrowrs 
hv th riht to ccss thir dt in 
both th crdit buru nd th crdit 
ristr fr of chr onc  r ( 
scor of 1). Both ntitis provid dt 
usrs ccss to dtbss throuh n 
onlin pltform ( scor of 1). Althouh 
th crdit ristr dos not provid 
crdit scors, th crdit buru dos ( 
scor of 1). Addin ths numbrs ivs 
Lithuni  scor of 8 on th dpth of 
crdit informtion indx. 
Credit bureau coverage 
Crdit buru covr rports th 
numbr of individuls nd firms 
listd in  crdit buru’s dtbs s 
of Jnur 1, 2014, with informtion on 
thir borrowin histor from th pst 
5 rs. Th numbr is xprssd s  
prcnt of th dult popultion (th 
popultion  15 nd bov in 2013 
ccordin to th World Bnk’s World 
Dvlopmnt Indic
tors). A crdit buru 
is dfind s  privt firm or nonprofit 
ornition tht mintins  dtbs 
on th crditworthinss of borrowrs 
(individuls or firms) in th finncil 
sstm nd fcilitts th xchn 
of crdit informtion mon crditors. 
(Mn crdit burus support bnkin 
nd ovrll finncil suprvision ctivi-ti 
s in prctic, thouh this is not thir 
primr objctiv.) Crdit invstitiv 
burus nd crdit rportin firms 
tht do not dirctl fcilitt inform- 
tion xchn mon bnks nd othr 
finncil institutions r not considrd. 
If no crdit buru oprts, th covr- 
 vlu is 0.0%. 
Credit registry coverage 
Crdit ristr covr rports th 
numbr of individuls nd firms listd 
in  crdit ristr’s dtbs s of 
Jnur 1, 2014, with informtion on 
thir borrowin histor from th pst 
5 rs. Th numbr is xprssd s  
prcnt of th dult popultion (th 
popultion  15 nd bov in 2013 
ccordin to th World Bnk’s World 
Dvlopmnt Indic
tors). A crdit ristr 
is dfind s  dtbs mnd b 
th public sctor, usull b th cntrl 
bnk or th suprintndnt of bnks, 
tht primril ssists bnkin suprvi-sion 
whil t th sm tim fcilittin 
th xchn of crdit informtion 
mon bnks nd othr rultd 
finncil institutions. If no ristr opr- 
ts, th covr vlu is 0.0%. 
Th d
t
 dt
ils on ttin crdit c
n b 
found for 
ch conom 
t http://www 
.doinbusinss.or. Th initi
l mthodol-o 
 w
s dvlopd b Dj
nkov, McLish 

nd Shlifr (2007) 
nd is 
doptd hr 
with minor ch
ns. 
PROTECTING MINORITY 
INVESTORS 
Doin Businss msurs th protction 
of minorit invstors from conflicts of 
intrst throuh on st of indictors 
nd shrholdrs’ rihts in corport 
ovrnnc throuh nothr (tbl 
14.8). Th dt com from  qustion-n 
ir dministrd to corport nd 
scuritis lwrs nd r bsd on 
scuritis rultions, compn lws, 
civil procdur cods nd court ruls of 
vidnc. Th rnkin of conomis on 
th strnth of minorit invstor pro-t 
ctions is dtrmind b sortin thir 
distnc to frontir scors for protct-in 
 minorit invstors. Ths scors r 
th simpl vr of th distnc to 
frontir scors for th xtnt of conflict 
of intrst rultion indx nd th 
xtnt of shrholdr ovrnnc indx 
(fiur 14.11). 
Protection of shareholders 
from conflicts of interest 
Th xtnt of conflict of intrst rul- 
tion indx msurs th protction of 
shrholdrs inst dirctors’ misus 
of corport ssts for prsonl in b 
distinuishin 3 dimnsions of rul- 
tion tht ddrss conflicts of intrst: 
trnsprnc of rltd-prt trnsc-tions 
(xtnt of disclosur indx), shr- 
holdrs’ bilit to su nd hold dirctors 
libl for slf-dlin (xtnt of dirctor 
libilit indx) nd ccss to vidnc 
nd lloction of ll xpnss in 
TABLE 14.8 Wht do th protctin† minorit invstors indictors msur? 
Ext	nt of disclosur	 ind	x (0–10) Ext	nt of sh­r	hold	r rihts ind	x (0–10.5) 
Rviw nd pprovl rquirmnts for rltd-p 
rt trnsctions 
Shrholdrs’ rihts nd rol in mjor corport 
dcisions 
Intrnl, immdit nd priodic disclosur 
rquirmnts for rltd-prt trnsctions 
Ext	nt of dir	ctor li­bilit‡ ind	x (0–10) Str	nth of ov	rn­nc	 structur	 ind	x (0–10.5) 
Minorit shrholdrs’ bilit to su nd hold 
Govrnnc sfurds protctin shrholdrs 
intrstd dirctors libl for prjudicil rltd-p 
from undu bord control nd ntrnchmnt 
rt trnsctions 
Avilbl ll rmdis (dms, disormnt 
of profits, fins, imprisonmnt, rscission of 
trnsctions) 
E­s	 of sh­r	hold	r suits ind	x (0–10) Ext	nt of corpor­t	 tr­nsp­r	nc‡ ind	x (0–9) 
Accss to intrnl corport documnts Corport trnsprnc on ownrship stks, 
compnstion, udits nd finncil prospcts 
Evidnc obtinbl durin tril 
Alloction of ll xpnss 
Ext	nt of conflict of int	r	st r	ul­tion ind	x (0–10) Ext	nt of sh­r	hold	r ov	rn­nc	 ind	x (0–10) 
Sum of th xtnt of disclosur, xtnt of dirctor 
libilit nd s of shrholdr suits indics, 
dividd b 3 
Sum of th xtnt of shrholdr rihts, strnth 
of ovrnnc structur nd xtnt of corport 
trnsprnc indics, dividd b 3 
Str	nth of minorit‡ inv	stor prot	ction ind	x (0–10) 
Simpl vr of th xtnt of conflict of intrst rultion nd xtnt of shrholdr ovrnnc indics
Data Notes 129 
Figure 14.11 Protecting minority 
investors: shareholders’ rights in 
conflicts of interest and corporate 
governance 
Rankings are based on distance to 
frontier scores for 2 indicators 
shareholder litigation (ease of share-holder 
suits index). To make the data 
comparable across economies, several 
assumptions about the business and 
the transaction are used (figure 14.12). 
Assumptions about the 
business 
The business (Buyer): 
ƒƒ Is a publicly traded corporation 
listed on the economy’s most im-portant 
stock exchange. If the num-ber 
of publicly traded companies 
listed on that exchange is less than 
10, or if there is no stock exchange 
in the economy, it is assumed that 
Buyer is a large private company 
with multiple shareholders. 
ƒƒ Has a board of directors and a chief 
executive officer (CEO) who may 
legally act on behalf of Buyer where 
permitted, even if this is not specifi-cally 
required by law. 
ƒƒ Has a supervisory board (appli-cable 
to economies with a 2-tier 
board system) on which 60% of the 
shareholder-elected members have 
been appointed by Mr. James, who is 
Buyer’s controlling shareholder and a 
member of Buyer’s board of directors. 
ƒƒ Is a manufacturing company. 
ƒƒ Has its own distribution network. 
Assumptions about the 
transaction 
ƒƒMr. James owns 60% of Buyer 
and elected 2 directors to Buyer’s 
5-member board. 
ƒƒMr. James also owns 90% of Seller, 
a company that operates a chain of 
retail hardware stores. Seller recently 
closed a large number of its stores. 
ƒƒMr. James proposes that Buyer pur-chase 
Seller’s unused fleet of trucks 
to expand Buyer’s distribution of its 
food products, a proposal to which 
Buyer agrees. The price is equal to 
10% of Buyer’s assets and is higher 
than the market value. 
ƒƒ The proposed transaction is part 
of the company’s ordinary course 
of business and is not outside the 
authority of the company. 
ƒƒ Buyer enters into the transaction. 
All required approvals are obtained, 
and all required disclosures made 
(that is, the transaction is not 
fraudulent). 
ƒƒ The transaction causes damages to 
Buyer. Shareholders sue Mr. James 
and the other parties that approved 
the transaction. 
Extent of disclosure index 
The extent of disclosure index has 5 
components: 
ƒƒWhich corporate body can provide 
legally sufficient approval for the 
transaction. A score of 0 is assigned 
if it is the CEO or the managing 
director alone; 1 if the board of 
directors, the supervisory board 
or shareholders must vote and 
Mr. James is permitted to vote; 
2 if the board of directors or the 
supervisory board must vote and 
Mr. James is not permitted to vote; 
3 if shareholders must vote and Mr. 
James is not permitted to vote. 
ƒƒWhether immediate disclosure of the 
transaction to the public, the regula-tor 
or the shareholders is required. A 
score of 0 is assigned if no disclosure 
is required; 1 if disclosure on the 
terms of the transaction is required 
but not on Mr. James’s conflict of 
interest; 2 if disclosure on both the 
terms and Mr. James’s conflict of 
interest is required.9 
ƒƒWhether disclosure in the annual 
report is required. A score of 0 is 
assigned if no disclosure on the 
transaction is required; 1 if disclo-sure 
on the terms of the transaction 
is required but not on Mr. James’s 
conflict of interest; 2 if disclosure 
on both the terms and Mr. James’s 
conflict of interest is required. 
ƒƒWhether disclosure by Mr. James 
to the board of directors or the su-pervisory 
board is required. A score 
of 0 is assigned if no disclosure is 
required; 1 if a general disclosure of 
the existence of a conflict of interest 
is required without any specifics; 2 
if full disclosure of all material facts 
relating to Mr. James’s interest in the 
Buyer-Seller transaction is required. 
ƒƒWhether it is required that an exter-nal 
body, for example, an external 
auditor, review the transaction 
Figure 14.12 How well are minority shareholders protected from conflicts of 
interest? 
Extent of disclosure 
Disclosure and approval requirements 
Extent of director liability 
Ability to sue directors for damages 
Ease of shareholder suits 
Access by shareholders to documents 
plus other evidence for trial 
90% ownership, 
sits on board of 
directors 
Mr. James 
60% ownership, 
sits on board of 
directors 
Company B 
(seller) 
Company A 
(buyer) 
Transaction 
involving conflict 
of interest 
Lawsuit 
Minority 
shareholders 
50% 
Extent of 
conflict of 
interest 
regulation 
index 
50% 
Extent of 
shareholder 
governance 
index
130 DOING BUSINESS 2015 
bfor it tks plc. A scor of 0 is 
ssind if no; 1 if s. 
Th indx rns from 0 to 10, with 
hihr vlus indictin rtr disclo-sur 
. In Polnd, for xmpl, th bord of 
dirctors must pprov th trnsction 
nd Mr. Jms is not llowd to vot ( 
scor of 2). Bur is rquird to disclos 
immditl ll informtion ffctin 
th stock pric, includin th conflict of 
intrst ( scor of 2). In its nnul r- 
port Bur must lso disclos th trms 
of th trnsction nd Mr. Jms’s own- 
rship in Bur nd Sllr ( scor of 2). 
Bfor th trnsction Mr. Jms must 
disclos his conflict of intrst to th 
othr dirctors, but h is not rquird to 
provid spcific informtion bout it ( 
scor of 1). Polnd dos not rquir n 
xtrnl bod to rviw th trnsction 
( scor of 0). Addin ths numbrs 
ivs Polnd  scor of 7 on th xtnt 
of disclosur indx. 
Extent of director liability 
index 
Th xtnt of dirctor libilit indx hs 
7 componnts:10 
ƒ Whthr  shrholdr plintiff is 
bl to hold Mr. Jms libl for th 
dm th Bur-Sllr trnsc-tion 
cuss to th compn. A 
scor of 0 is ssind if Mr. Jms 
cnnot b hld libl or cn b hld 
libl onl for frud, bd fith or 
ross nlinc; 1 if Mr. Jms cn 
b hld libl onl if h influncd 
th pprovl of th trnsction or 
ws nlint; 2 if Mr. Jms cn 
b hld libl whn th trnsction 
is unfir or prjudicil to th othr 
shrholdrs. 
ƒ Whthr  shrholdr plintiff is 
bl to hold th pprovin bod (th 
CEO, mmbrs of th bord of dirc-tors 
or mmbrs of th suprvisor 
bord) libl for th dm th 
trnsction cuss to th compn. 
A scor of 0 is ssind if th p-provin 
 bod cnnot b hld libl 
or cn b hld libl onl for frud, 
bd fith or ross nlinc; 1 if th 
pprovin bod cn b hld libl for 
nlinc; 2 if th pprovin bod 
cn b hld libl whn th trnsc-tion 
is unfir or prjudicil to th 
othr shrholdrs. 
ƒ Whthr  court cn void th trns- 
ction upon  succssful clim b  
shrholdr plintiff. A scor of 0 is 
ssind if rscission is unvilbl 
or is vilbl onl in cs of frud, 
bd fith or ross nlinc; 1 if r- 
scission is vilbl whn th trns- 
ction is opprssiv or prjudicil to 
th othr shrholdrs; 2 if rscission 
is vilbl whn th trnsction is 
unfir or ntils  conflict of intrst. 
ƒ Whthr Mr. Jms ps dms 
for th hrm cusd to th com-p 
n upon  succssful clim b th 
shrholdr plintiff. A scor of 0 is 
ssind if no; 1 if s. 
ƒ Whthr Mr. Jms rps profits 
md from th trnsction upon  
succssful clim b th shrholdr 
plintiff. A scor of 0 is ssind if 
no; 1 if s. 
ƒ Whthr both fins nd imprison-m 
nt cn b pplid inst Mr. 
Jms. A scor of 0 is ssind if 
no; 1 if s. 
ƒ Whthr shrholdr plintiffs r 
bl to su dirctl or drivtivl for 
th dm th trnsction cuss 
to th compn. A scor of 0 is s-si 
nd if suits r unvilbl or r 
vilbl onl for shrholdrs hold-in 
 mor thn 10% of th compn’s 
shr cpitl; 1 if dirct or drivtiv 
suits r vilbl for shrholdrs 
holdin 10% of shr cpitl. 
Th indx rns from 0 to 10, with 
hihr vlus indictin rtr libilit 
of dirctors. Assumin tht th prjudi-ci 
l trnsction ws dul pprovd nd 
disclosd, in ordr to hold Mr. Jms li- 
bl in Pnm, for xmpl,  plintiff 
must prov tht Mr. Jms influncd 
th pprovin bod or ctd nli- 
ntl ( scor of 1). To hold th othr 
dirctors libl,  plintiff must prov 
tht th ctd nlintl ( scor of 
1). Th prjudicil trnsction cnnot 
b voidd ( scor of 0). If Mr. Jms 
is found libl, h must p dms 
( scor of 1) but h is not rquird to 
disor his profits ( scor of 0). Mr. 
Jms cnnot b find nd imprisond 
( scor of 0). Dirct or drivtiv suits 
r vilbl for shrholdrs hold-in 
 10% of shr cpitl ( scor of 1). 
Addin ths numbrs ivs Pnm 
 scor of 4 on th xtnt of dirctor 
libilit indx. 
Ease of shareholder suits index 
Th s of shrholdr suits indx hs 
6 componnts: 
ƒ Wht rn of documnts is vil- 
bl to th shrholdr plintiff 
from th dfndnt nd witnsss 
durin tril. A scor of 1 is ssind 
for ch of th followin tps of 
documnts vilbl: informtion 
tht th dfndnt hs indictd 
h intnds to rl on for his d- 
fns; informtion tht dirctl 
provs spcific fcts in th plin-tiff’s 
clim; nd n informtion 
rlvnt to th subjct mttr of 
th clim. 
ƒ Whthr th plintiff cn dirctl 
xmin th dfndnt nd wit-n 
sss durin tril. A scor of 0 is 
ssind if no; 1 if s, with prior p-prov 
l of th qustions b th jud; 
2 if s, without prior pprovl. 
ƒ Whthr th plintiff cn obtin ct- 
oris of rlvnt documnts from 
th dfndnt without idntifin 
ch documnt spcificll. A scor 
of 0 is ssind if no; 1 if s. 
ƒ Whthr shrholdrs ownin 10% 
of th compn’s shr cpitl hv 
th riht to inspct th trnsction 
documnts bfor filin suit or r- 
qust tht  ovrnmnt inspctor 
invstit th Bur-Sllr trns- 
ction without filin suit. A scor of 
0 is ssind if no; 1 if s.11 
ƒ Whthr th stndrd of proof for 
civil suits is lowr thn tht for  
criminl cs. A scor of 0 is s-si 
nd if no; 1 if s. 
ƒ Whthr shrholdr plintiffs 
cn rcovr thir ll xpnss
DATA NOTES 131 
from th compn. A scor of 0 
is ssind if no; 1 if plintiffs cn 
rcovr thir ll xpnss from 
th compn onl upon  succss-ful 
outcom of thir ll ction 
or if pmnt of thir ttorn 
fs is continnt on  succssful 
outcom; 2 if plintiffs cn rcovr 
thir ll xpnss from th com-p 
n rrdlss of th outcom of 
thir ll ction.12 
Th indx rns from 0 to 10, with 
hihr vlus indictin rtr pow- 
rs of shrholdrs to chlln th 
trnsction. In Croti, for xmpl, 
th plintiff cn ccss documnts 
tht th dfndnt intnds to rl on 
for his dfns ( scor of 1). Th plin-tiff 
cn xmin th dfndnt nd 
witnsss durin tril, without prior 
pprovl of th qustions b th court 
( scor of 2). Th plintiff must sp- 
cificll idntif th documnts bin 
souht (for xmpl, th Bur-Sllr 
purchs rmnt of Jul 15, 2006) 
nd cnnot simpl rqust ctoris 
(for xmpl, ll documnts rltd 
to th trnsction) ( scor of 0). A 
shrholdr holdin 10% of Bur’s 
shrs cn rqust tht  ovrnmnt 
inspctor rviw suspctd mismn- 
mnt b Mr. Jms nd th CEO 
without filin suit in court ( scor of 
1). Th stndrd of proof for civil suits 
is th sm s tht for  criminl cs 
( scor of 0). Th plintiff cn rcovr 
ll xpnss from th compn onl 
upon  succssful outcom of th l- 
l ction ( scor of 1). Addin ths 
numbrs ivs Croti  scor of 5 on 
th s of shrholdr suits indx. 
Extent of conflict of interest 
regulation index 
Th xtnt of conflict of intrst 
rultion indx is th sum of th 
xtnt of disclosur indx, th xtnt 
of dirctor libilit indx nd th s 
of shrholdr suits indx. Th indx is 
dividd b 3 so tht it rns from 0 
to 10. Hihr vlus indict stronr 
rultion of conflicts of intrst. 
Shareholders’ rights in 
corporate governance 
Th xtnt of shrholdr ovrnnc 
indx msurs shrholdrs’ rihts in 
corport ovrnnc b distinuish-in 
 3 dimnsions of ood ovrnnc: 
shrholdrs’ rihts nd rol in mjor 
corport dcisions (xtnt of shr- 
holdr rihts indx), ovrnnc sf- 
urds protctin shrholdrs from 
undu bord control nd ntrnchmnt 
(strnth of ovrnnc structur 
indx) nd corport trnsprnc 
on ownrship stks, compnstion, 
udits nd finncil prospcts (xtnt 
of corport trnsprnc indx).13 
Extent of shareholder rights 
index 
For ch componnt of th xtnt of 
shrholdr rihts indx,  scor of 0 
is ssind if th nswr is no; 1 if it 
is s; nd 1.5 if it would lso ppl if 
Bur wr  privtl hld joint stock 
compn not listd on n stock x-ch 
n. Th indx hs 7 componnts: 
ƒ Whthr shrholdrs hv th 
riht to mnd Bur’s blws or 
sttuts with  simpl mjorit. 
ƒ Whthr shrholdrs ownin 10% 
of Bur’s shr cpitl hv th 
riht to cll for n xtrordinr 
mtin of shrholdrs. 
ƒ Whthr shrholdrs hv th 
riht to rmov mmbrs of Bur’s 
bord of dirctors bfor th nd of 
thir trm. 
ƒ Whthr Bur must obtin its 
shrholdrs’ pprovl vr tim it 
issus nw shrs. 
ƒ Whthr shrholdrs r uto-m 
ticll rntd prmption or 
subscription rihts vr tim Bur 
issus nw shrs. 
ƒ Whthr shrholdrs r rquird 
b lw to pprov th lction nd 
dismissl of th xtrnl uditor. 
ƒ Whthr shrholdrs hv th 
riht to frl trd shrs prior to  
mjor corport ction or mtin of 
shrholdrs. 
Strength of governance 
structure index 
For ch componnt of th strnth 
of ovrnnc structur indx,  scor 
of 0 is ssind if th nswr is no; 1 
if it is s; nd 1.5 if it would lso p-pl 
 if Bur wr  privtl hld joint 
stock compn not listd on n stock 
xchn. Th indx hs 7 componnts: 
ƒ Whthr th CEO is brrd from 
lso bin chir of th bord of 
dirctors. 
ƒ Whthr th bord of dirctors must 
includ indpndnt bord mmbrs. 
ƒ Whthr Bur must hv  sp- 
rt udit committ. 
ƒ Whthr chns to th votin 
rihts of  sris or clss of shrs 
must b pprovd onl b th hold- 
rs of th ffctd shrs. 
ƒ Whthr  potntil cquirr must 
mk  tndr offr to ll shrhold- 
rs upon cquirin 50% of Bur. 
ƒ Whthr cross-shrholdin b- 
twn 2 indpndnt compnis is 
limitd to 10% of outstndin shrs. 
ƒ Whthr  subsidir is brrd from 
cquirin shrs issud b its pr- 
nt compn. 
Extent of corporate 
transparency index 
For ch componnt of th xtnt of 
corport trnsprnc indx,  scor 
of 0 is ssind if th nswr is no; 1 if 
it is s; nd 1.5 if it would lso ppl if 
Bur wr  privtl hld joint stock 
compn not listd on n stock x-ch 
n. Th indx hs 6 componnts: 
ƒ Whthr Bur must disclos own- 
rship stks rprsntin 10%. 
ƒ Whthr Bur must disclos in-form 
tion bout bord mmbrs’ 
othr dirctorships s wll s 
bsic informtion on thir primr 
mplomnt. 
ƒ Whthr Bur must disclos 
th compnstion of individul 
mnrs. 
ƒ Whthr Bur must hv its n-nu 
l finncil sttmnts uditd 
b n xtrnl uditor.
132 Doing Business 2015 
ƒƒWhether financial statements must 
contain explanatory notes on sig-nificant 
accounting policies, trends, 
risks, uncertainties and other fac-tors 
influencing the reporting. 
ƒƒWhether audit reports must be 
disclosed to the public. 
Extent of shareholder 
governance index 
The extent of shareholder governance 
index is the sum of the extent of 
shareholder rights index, the strength 
of governance structure index and 
the extent of corporate transparency 
index. The index is divided by 3 so that 
it ranges from 0 to 10. Higher values 
indicate stronger rights of shareholders 
in corporate governance. 
Strength of minority investor 
protection index 
The strength of minority investor 
protection index is the average of the 
extent of conflict of interest regulation 
index and the extent of shareholder 
governance index. The index ranges 
from 0 to 10, rounded to the near-est 
decimal place, with higher values 
indicating stronger minority investor 
protections. 
The data details on protecting minority 
investors can be found for each economy 
at http://www.doingbusiness.org. The 
initial methodology was developed by 
Djankov, La Porta and others (2008). The 
extent of shareholder governance index 
was introduced in Doing Business 2015. 
PAYING TAXES 
Doing Business records the taxes 
and mandatory contributions that a 
medium-size company must pay in a 
given year as well as measures of the 
administrative burden of paying taxes 
and contributions (figure 14.13). The 
project was developed and implemented 
in cooperation with PwC.14 Taxes and 
contributions measured include the 
profit or corporate income tax, social 
Figure 14.13 What are the time, total tax rate and number of payments necessary 
for a local medium-size company to pay all taxes? 
Total tax rate Time 
contributions and labor taxes paid by 
the employer, property taxes, prop-erty 
transfer taxes, dividend tax, capital 
gains tax, financial transactions tax, 
waste collection taxes, vehicle and road 
taxes, and any other small taxes or fees. 
The ranking of economies on the ease 
of paying taxes is determined by sort-ing 
their distance to frontier scores 
for paying taxes. These scores are 
the simple average of the distance to 
frontier scores for each of the compo-nent 
indicators (figure 14.14), with a 
threshold and a nonlinear transforma-tion 
applied to one of the component 
indicators, the total tax rate.15 The 
threshold is defined as the highest 
total tax rate among the top 15% of 
economies in the ranking on the total 
tax rate. It is calculated and adjusted 
on a yearly basis. This year’s threshold 
is 26.1%. All economies with a total tax 
rate below this threshold receive the 
same score as the economy at the 
threshold. The threshold is not based 
on any economic theory of an “optimal 
tax rate” that minimizes distortions or 
maximizes efficiency in an economy’s 
overall tax system. Instead, it is mainly 
empirical in nature, set at the lower 
end of the distribution of tax rates 
levied on medium-size enterprises in 
the manufacturing sector as observed 
through the paying taxes indicators. 
To prepare, file and 
pay value added or 
sales tax, profit tax 
and labor taxes and 
contributions 
Rankings are based on distance to 
frontier scores for 3 indicators 
33.3% 
Time 
33.3% 
Total 
tax rate 
33.3% 
Payments 
This reduces the bias in the total tax 
rate indicator toward economies that 
do not need to levy significant taxes 
on companies like the Doing Business 
standardized case study company be-cause 
they raise public revenue in other 
ways—for example, through taxes on 
foreign companies, through taxes on 
sectors other than manufacturing or 
from natural resources (all of which are 
outside the scope of the methodology). 
Doing Business measures all taxes and 
contributions that are government 
Number of payments 
(per year) 
Hours 
per year 
% of profit 
before all taxes 
Figure 14.14 Paying taxes: tax 
compliance for a local manufacturing 
company 
Number of hours 
per year to prepare, 
file returns and pay 
taxes 
Firm tax liability 
as % of profits 
before all taxes 
borne 
Number of tax payments per year 
Note: All economies below the threshold receive the 
same score in the total tax rate component as the 
economies at the threshold.
DATA NOTES 133 
mndtd (t n lvl—fdrl, stt 
or locl) nd tht ppl to th stndrd-i 
d businss nd hv n impct in its 
finncil sttmnts. In doin so, Doin 
Businss os bond th trditionl 
dfinition of  tx. As dfind for th 
purposs of ovrnmnt ntionl c-counts, 
txs includ onl compulsor, 
unrquitd pmnts to nrl ov- 
rnmnt. Doin Businss dprts from 
this dfinition bcus it msurs 
imposd chrs tht ffct businss 
ccounts, not ovrnmnt ccounts. 
On min diffrnc rlts to lbor 
contributions. Th Doin Businss m- 
sur includs ovrnmnt-mndtd 
contributions pid b th mplor 
to  rquitd privt pnsion fund or 
workrs’ insurnc fund. It includs, 
for xmpl, Austrli’s compulsor 
suprnnution urnt nd work- 
rs’ compnstion insurnc. For th 
purpos of clcultin th totl tx 
rt (dfind blow), onl txs born 
r includd. For xmpl, vlu ddd 
txs r nrll xcludd (providd 
tht th r not irrcovrbl) bcus 
th do not ffct th ccountin prof-its 
of th businss—tht is, th r not 
rflctd in th incom sttmnt. Th 
r, howvr, includd for th purpos 
of th complinc msurs (tim nd 
pmnts), s th dd to th burdn of 
complin with th tx sstm. 
Doin Businss uss  cs scnrio to 
msur th txs nd contributions 
pid b  stndrdid businss nd 
th complxit of n conom’s tx 
complinc sstm. This cs scnrio 
uss  st of finncil sttmnts nd 
ssumptions bout trnsctions md 
ovr th cours of th r. In ch 
conom tx xprts from  numbr 
of diffrnt firms (in mn conomis 
ths includ PwC) comput th txs 
nd mndtor contributions du in 
thir jurisdiction bsd on th stn-d 
rdid cs stud fcts. Informtion 
is lso compild on th frqunc of 
filin nd pmnts s wll s th 
tim tkn to compl with tx lws 
in n conom. To mk th dt 
comprbl cross conomis, svrl 
ssumptions bout th businss nd 
th txs nd contributions r usd. 
Th mthodolo for th pin txs 
indictors hs bnfitd from discus-sion 
with mmbrs of th Intrntionl 
Tx Dilou nd othr stkholdrs. 
This hs ld to  rfinmnt of th 
qustions on th tim to p txs, th 
collction of dditionl dt on th l- 
bor tx wd for furthr rsrch nd 
th introduction of  thrshold pplid 
to th totl tx rt for th purpos of 
clcultin th rnkin on th s of 
pin txs. 
Assumptions about the 
business 
Th businss: 
ƒ Is  limitd libilit, txbl com-p 
n. If thr is mor thn on tp 
of limitd libilit compn in th 
conom, th limitd libilit form 
most common mon domstic 
firms is chosn. Th most common 
form is rportd b incorportion 
lwrs or th sttisticl offic. 
ƒ Strtd oprtions on Jnur 1, 
2012. At tht tim th compn 
purchsd ll th ssts shown in 
its blnc sht nd hird ll its 
workrs. 
ƒ Oprts in th conom’s lrst 
businss cit. For 11 conomis th 
dt r lso collctd for th scond 
lrst businss cit (s tbl 14A.1). 
ƒ Is 100% domsticll ownd nd hs 
5 ownrs, ll of whom r nturl 
prsons. 
ƒ At th nd of 2012, hs  strt-up 
cpitl of 102 tims incom pr 
cpit. 
ƒ Prforms nrl industril or 
commrcil ctivitis. Spcificll, 
it producs crmic flowrpots 
nd slls thm t rtil. It dos not 
prticipt in forin trd (no im-port 
or xport) nd dos not hndl 
products subjct to  spcil tx r- 
im, for xmpl, liquor or tobcco. 
ƒ At th binnin of 2013, owns 2 
plots of lnd, 1 buildin, mchinr, 
offic quipmnt, computrs nd 1 
truck nd lss 1 truck. 
ƒ Dos not qulif for invstmnt in-c 
ntivs or n bnfits prt from 
thos rltd to th  or si of 
th compn. 
ƒ Hs 60 mplos—4 mnrs, 8 
ssistnts nd 48 workrs. All r 
ntionls, nd 1 mnr is lso n 
ownr. Th compn ps for d-dition 
l mdicl insurnc for m-plo 
s (not mndtd b n lw) 
s n dditionl bnfit. In ddition, 
in som conomis rimbursbl 
businss trvl nd clint ntr-t 
inmnt xpnss r considrd 
frin bnfits. Whn pplicbl, it 
is ssumd tht th compn ps 
th frin bnfit tx on this x-p 
ns or tht th bnfit bcoms 
txbl incom for th mplo. 
Th cs stud ssums no d-dition 
l slr dditions for mls, 
trnsporttion, duction or othrs. 
Thrfor, vn whn such bnfits 
r frqunt, th r not ddd to 
or rmovd from th txbl ross 
slris to rriv t th lbor tx or 
contribution clcultion. 
ƒ Hs  turnovr of 1,050 tims in-com 
 pr cpit. 
ƒ Mks  loss in th first r of 
oprtion. 
ƒ Hs  ross mrin (prtx) of 20% 
(tht is, sls r 120% of th cost of 
oods sold). 
ƒ Distributs 50% of its nt profits s 
dividnds to th ownrs t th nd 
of th scond r. 
ƒ Slls on of its plots of lnd t  
profit t th binnin of th scond 
r. 
ƒ Is subjct to  sris of dtild 
ssumptions on xpnss nd 
trnsctions to furthr stndrdi 
th cs. All finncil sttmnt 
vribls r proportionl to 2012 
incom pr cpit (this is n updt 
from prvious rs, whn th 
vribls wr proportionl to 2005 
incom pr cpit). For xmpl, 
th ownr who is lso  mnr 
spnds 10% of incom pr cpit
134 DOING BUSINESS 2015 
on trvlin for th compn (20% 
of this ownr’s xpnss r purl 
privt, 20% r for ntrtinin 
customrs, nd 60% r for busi-n 
ss trvl). 
Assumptions about the taxes 
and contributions 
ƒ All th txs nd contributions 
rcordd r thos pid in th 
scond r of oprtion (clndr 
r 2013). A tx or contribution 
is considrd distinct if it hs  
diffrnt nm or is collctd b  
diffrnt nc. Txs nd contri-butions 
with th sm nm nd 
nc, but chrd t diffrnt 
rts dpndin on th businss, 
r countd s th sm tx or 
contribution. 
ƒ Th numbr of tims th compn 
ps txs nd contributions in  
r is th numbr of diffrnt txs 
or contributions multiplid b th 
frqunc of pmnt (or withhold-in 
) for ch tx. Th frqunc of 
pmnt includs dvnc p- 
mnts (or withholdin) s wll s 
rulr pmnts (or withholdin). 
Tax payments 
Th tx pmnts indictor rflcts 
th totl numbr of txs nd con-tributions 
pid, th mthod of p- 
mnt, th frqunc of pmnt, th 
frqunc of filin nd th numbr of 
ncis involvd for th stndrd-i 
d cs stud compn durin th 
scond r of oprtion (tbl 14.9). 
It includs txs withhld b th com-p 
n, such s sls tx, vlu ddd 
tx nd mplo-born lbor txs. 
Ths txs r trditionll collctd 
b th compn from th consumr or 
mplo on bhlf of th tx ncis. 
Althouh th do not ffct th incom 
sttmnts of th compn, th dd 
to th dministrtiv burdn of com-pl 
in with th tx sstm nd so r 
includd in th tx pmnts msur. 
Th numbr of pmnts tks into 
ccount lctronic filin. Whr full 
lctronic filin nd pmnt is llowd 
nd it is usd b th mjorit of mdi-um- 
si businsss, th tx is countd 
s pid onc  r vn if filins nd 
pmnts r mor frqunt. For p- 
mnts md throuh third prtis, such 
s tx on intrst pid b  finncil 
institution or ful tx pid b  ful dis-tributor, 
onl on pmnt is includd 
vn if pmnts r mor frqunt. 
Whr 2 or mor txs or contributions 
r fild for nd pid jointl usin th 
sm form, ch of ths joint p- 
mnts is countd onc. For xmpl, if 
mndtor hlth insurnc contribu-tions 
nd mndtor pnsion contri-butions 
r fild for nd pid tothr, 
onl on of ths contributions would 
b includd in th numbr of pmnts. 
Time 
Tim is rcordd in hours pr r. Th 
indictor msurs th tim tkn to 
prpr, fil nd p 3 mjor tps of 
txs nd contributions: th corport 
incom tx, vlu ddd or sls tx, 
nd lbor txs, includin proll txs 
nd socil contributions. Prprtion 
tim includs th tim to collct ll 
informtion ncssr to comput 
th tx pbl nd to clcult 
th mount pbl. If sprt c-countin 
 books must b kpt for tx 
purposs—or sprt clcultions 
md—th tim ssocitd with ths 
procsss is includd. This xtr tim 
is includd onl if th rulr ccount-in 
 work is not nouh to fulfill th 
tx ccountin rquirmnts. Filin 
tim includs th tim to complt ll 
ncssr tx rturn forms nd fil 
th rlvnt rturns t th tx uthor-it 
. Pmnt tim considrs th hours 
ndd to mk th pmnt onlin 
or in prson. Whr txs nd contri-butions 
r pid in prson, th tim 
includs dls whil witin. 
Total tax rate 
Th totl tx rt msurs th 
mount of txs nd mndtor con-tributions 
born b th businss in th 
scond r of oprtion, xprssd 
s  shr of commrcil profit. Doin 
Businss 2015 rports th totl tx 
rt for clndr r 2013. Th totl 
mount of txs born is th sum of ll 
th diffrnt txs nd contributions 
pbl ftr ccountin for llowbl 
dductions nd xmptions. Th txs 
withhld (such s prsonl incom tx) 
or collctd b th compn nd rmit-t 
d to th tx uthoritis (such s vlu 
ddd tx, sls tx or oods nd sr-vic 
 tx) but not born b th compn 
r xcludd. Th txs includd cn b 
dividd into 5 ctoris: profit or cor-por 
t incom tx, socil contributions 
nd lbor txs pid b th mplor 
(for which ll mndtor contributions 
r includd, vn if pid to  privt 
ntit such s  rquitd pnsion fund), 
proprt txs, turnovr txs nd 
othr txs (such s municipl fs nd 
vhicl txs). Ful txs r no lonr 
includd in th totl tx rt bcus of 
th difficult of computin ths txs 
in  consistnt w for ll conomis 
covrd. Th ful tx mounts r in 
TABLE 14.9 Wht do th pin† txs 
indictors msur? 
T­x p­‡m	nts for ­ m­nuf­cturin comp­n‡ in 
2013 (numb	r p	r ‡	­r ­djust	d for 	l	ctronic 
­nd joint filin ­nd p­‡m	nt) 
Totl numbr of txs nd contributions pid, 
includin consumption txs (vlu ddd tx, 
sls tx or oods nd srvic tx) 
Mthod nd frqunc of filin nd pmnt 
Tim	 r	quir	d to compl‡ with 3 m­jor t­x	s 
(hours p	r ‡	­r) 
Collctin informtion nd computin th tx 
pbl 
Compltin tx rturn forms, filin with propr 
ncis 
Arrnin pmnt or withholdin 
Prprin sprt mndtor tx ccountin 
books, if rquird 
Tot­l t­x r­t	 (% of profit b	for	 ­ll t­x	s) 
Profit or corport incom tx 
Socil contributions nd lbor txs pid b th 
mplor 
Proprt nd proprt trnsfr txs 
Dividnd, cpitl ins nd finncil trnsctions 
txs 
Wst collction, vhicl, rod nd othr txs
DATA NOTES 135 
most css vr smll, nd msurin 
ths mounts is oftn complictd 
bcus th dpnd on ful consump-tion. 
Ful txs continu to b countd 
in th numbr of pmnts. 
Th totl tx rt is dsind to pro-vid 
  comprhnsiv msur of th 
cost of ll th txs  businss brs. 
It diffrs from th sttutor tx rt, 
which mrl provids th fctor to b 
pplid to th tx bs. In computin 
th totl tx rt, th ctul tx p- 
bl is dividd b commrcil profit. 
Dt for Kiribti r providd s n 
xmpl (tbl 14.10). 
Commrcil profit is ssntill nt 
profit bfor ll txs born. It diffrs 
from th convntionl profit bfor tx, 
rportd in finncil sttmnts. In 
computin profit bfor tx, mn of 
th txs born b  firm r dductibl. 
In computin commrcil profit, ths 
txs r not dductibl. Commrcil 
profit thrfor prsnts  clr pictur 
of th ctul profit of  businss bfor 
n of th txs it brs in th cours 
of th fiscl r. 
Commrcil profit is computd s 
sls minus cost of oods sold, minus 
ross slris, minus dministrtiv 
xpnss, minus othr xpnss, minus 
provisions, plus cpitl ins (from th 
proprt sl) minus intrst xpns, 
plus intrst incom nd minus com-m 
rcil dprcition. To comput th 
commrcil dprcition,  striht-lin 
 dprcition mthod is pplid, 
with th followin rts: 0% for th 
lnd, 5% for th buildin, 10% for th 
mchinr, 33% for th computrs, 
20% for th offic quipmnt, 20% for 
th truck nd 10% for businss dvl-opm 
nt xpnss. Commrcil profit 
mounts to 59.4 tims incom pr 
cpit. 
Th mthodolo for clcultin th 
totl tx rt is brodl consistnt 
with th Totl Tx Contribution frm- 
work dvlopd b PwC nd th clcu-l 
tion within this frmwork for txs 
born. But whil th work undrtkn 
b PwC is usull bsd on dt r- 
civd from th lrst compnis in 
th conom, Doin Businss focuss 
on  cs stud for  stndrdid 
mdium-si compn. 
Th d
t
 dt
ils on p
in t
xs c
n b 
found for 
ch conom 
t http://www 
.doinbusinss.or. This mthodolo w
s 
dvlopd b Dj
nkov 
nd othrs (2010). 
TRADING ACROSS 
BORDERS 
Doin Businss msurs th tim nd 
cost (xcludin triffs) ssocitd with 
xportin nd importin  stndrd-i 
d cro of oods b s trnsport. 
Th tim nd cost ncssr to com-pl 
t 4 prdfind sts (documnt 
prprtion; customs clrnc nd 
inspctions; inlnd trnsport nd hn-dlin 
; nd port nd trminl hndlin) for 
xportin nd importin th oods r 
rcordd; howvr, th tim nd cost for 
s trnsport r not includd. All docu-m 
nts ndd b th trdr to xport or 
import th oods cross th bordr r 
lso rcordd. Th procss of xportin 
oods rns from pckin th oods 
into th continr t th wrhous to 
thir dprtur from th port of xit. 
Th procss of importin oods rns 
from th vssl’s rrivl t th port 
of ntr to th cro’s dlivr t th 
wrhous. For lndlockd conomis, 
sinc th sport is loctd in th trnsit 
conom, th tim, cost nd documnts 
ssocitd with th procsss t th 
inlnd bordr r lso includd. It is 
ssumd tht th pmnt is md b 
lttr of crdit, nd th tim, cost nd 
documnts rquird for th issunc or 
dvisin of  lttr of crdit r tkn 
into ccount (fiur 14.15). 
Th rnkin of conomis on th s of 
trdin cross bordrs is dtrmind b 
sortin thir distnc to frontir scors 
for trdin cross bordrs. Ths scors 
r th simpl vr of th distnc 
to frontir scors for ch of th com-pon 
nt indictors (fiur 14.16). 
Locl friht forwrdrs, shippin 
lins, customs brokrs, port officils 
nd bnks provid informtion on 
rquird documnts, cost nd tim to 
xport nd import. To mk th dt 
comprbl cross conomis, svrl 
ssumptions bout th businss nd 
th trdd oods r usd. 
Assumptions about the traded 
goods 
Th trdd product trvls in  dr- 
cro, 20-foot, full continr lod.16 
It wihs 10 tons nd is vlud t 
$20,000. Th product: 
ƒ Is not hrdous nor dos it includ 
militr itms. 
ƒ Dos not rquir rfrirtion or n 
othr spcil nvironmnt. 
TABLE 14.10 Computin† th totl tx rt for Kiribti 
T‡p	 of t­x 
(t­x b­s	) 
St­tutor‡ 
r­t	 
r 
(%) 
St­tutor‡ 
t­x b­s	 
b 
($A) 
Actu­l t­x 
p­‡­bl	 
	 = r × b 
($A) 
Comm	rci­l 
profit* 
c 
($A) 
Tot­l t­x r­t	 
t = 	/c 
(%) 
Corport incom tx 
(txbl incom) 
20.0–35.0 109,381 33,283 137,156 24.3 
Emplor-pid socil 
scurit contributions 
(txbl ws) 
7.5 154,711 11,603 137,156 8.5 
Tot­l 44,886 32.7 
* Profit bfor ll txs born. 
Not: Commrcil profit is ssumd to b 59.4 tims incom pr cpit. $A is Austrlin dollr. 
Sourc: Doin Businss dtbs.
136 Doing Business 2015 
Rankings are based on distance to 
frontier scores for 3 indicators 
33.3% 
Documents 
to export 
and import 
33.3% 
Time to 
export and 
import 
33.3% 
Cost to export 
and import 
ƒƒ Does not require any special phy-tosanitary 
or environmental safety 
standards other than accepted 
international standards. 
ƒƒ Is one of the economy’s leading 
export or import products. 
Assumptions about the 
business 
The business: 
ƒƒ Is located in the economy’s largest 
business city. For 11 economies the 
data are also collected for the sec-ond 
largest business city (see table 
14A.1). 
ƒƒ Is a private, limited liability company. 
ƒƒ Does not operate in an export 
processing zone or an industrial 
estate with special export or import 
privileges. 
ƒƒ Conducts export and import ac-tivities 
but does not have any special 
accreditation, such as an authorized 
economic operator status. 
ƒƒ Is 100% domestically owned. 
Documents 
It is assumed that a new contract is 
drafted per shipment and that the 
contract has already been agreed 
upon and executed by both parties. All 
documents required by law or common 
practice by relevant agencies—includ-ing 
government ministries, customs 
authorities, port authorities and other 
control agencies—per export and im-port 
shipment are taken into account 
(table 14.11). For landlocked economies, 
documents required by authorities in 
the transit economy are also included. 
Since payment is by letter of credit, 
all documents required by banks for 
the issuance or securing of a letter of 
credit are also taken into account. 
Documents that are requested at the 
time of clearance but that are valid 
for a year or longer or do not require 
renewal per shipment (for example, 
an annual tax clearance certificate) 
are not included. Documents that are 
required by customs authorities purely 
for purposes of preferential treatment 
but are not required for any other 
purpose by any of the authorities in the 
process of trading are not included. For 
example, if a certificate of origin is only 
presented to qualify for a preferential 
tariff rate under trade agreements, the 
document is not counted. It is assumed 
that the exporter will always obtain a 
certificate of origin for its trade partner, 
and the time and cost associated with 
obtaining this certificate are therefore 
included in the time and cost of docu-ment 
preparation to export. 
Time 
The time for exporting and importing 
is recorded in calendar days. The time 
calculation for each of the 4 predefined 
stages starts from the moment the 
stage is initiated and runs until it is 
completed. Fast-track procedures 
applying only to firms located in an 
export processing zone, or only to cer-tain 
accredited firms under authorized 
economic operator programs, are not 
taken into account because they are 
not available to all trading companies. 
Sea transport time is not included. It 
is assumed that neither the exporter 
nor the importer wastes time and 
that each commits to completing the 
process without delay. It is assumed 
that document preparation, inland 
transport and handling, customs clear-ance 
and inspections, and port and 
terminal handling require a minimum 
time of 1 day each and cannot take 
place simultaneously. The waiting time 
that occurs in practice—for example, in 
queues to obtain a service or during the 
moving of the cargo at the seaport—is 
included in the measure. 
Cost 
Cost measures the fees levied on a 
20-foot container in U.S. dollars. All 
fees charged by government agencies 
and the private sector to a trader in the 
process of exporting and importing the 
goods are taken into account. These 
include but are not limited to costs 
Figure 14.15 How much time, how many documents and what cost to export and 
import by sea transport? 
Full, 20-foot container 
To export 
Time 
Cost 
Documents 
Time 
Cost 
Documents 
To import 
Import 
Export 
Port and terminal 
handling 
Customs and 
border agencies 
Inland transport 
Figure 14.16 Trading across borders: 
exporting and importing by sea transport 
All documents 
required by 
customs and other 
agencies 
Document preparation, 
customs clearance and 
inspections, port and 
terminal handling, inland 
transport and handling 
US$ per 20-foot container, no 
bribes or tariffs included
Data Notes 137 
for documents, administrative fees for 
customs clearance and inspections, 
customs broker fees, port-related 
charges and inland transport costs. 
The exporter is responsible for the 
incurred costs related to exporting 
the goods until they depart from the 
exporting economy, and the importer 
is responsible for the incurred costs 
related to importing from the moment 
the goods arrive at the seaport in the 
importing economy. The cost does not 
include customs tariffs and duties or 
costs related to sea transport. Only 
official costs are recorded. 
The data details on trading across borders 
can be found for each economy at http:// 
www.doingbusiness.org. This methodology 
was developed by Djankov, Freund and 
Pham (2010) and is adopted here with 
minor changes. 
ENFORCING CONTRACTS 
Indicators on enforcing contracts 
measure the efficiency of the judicial 
system in resolving a commercial 
dispute. The data are built by following 
the step-by-step evolution of a com-mercial 
sale dispute before local courts 
(figure 14.17). The data are collected 
through study of the codes of civil 
procedure and other court regulations 
as well as questionnaires completed 
by local litigation lawyers and judges. 
The ranking of economies on the ease 
of enforcing contracts is determined by 
sorting their distance to frontier scores 
for enforcing contracts. These scores 
are the simple average of the distance 
to frontier scores for each of the com-ponent 
indicators (figure 14.18). 
The name of the relevant court in each 
economy—the court in the largest 
business city with jurisdiction over 
the standardized commercial dispute 
described below—is published at 
http://www.doingbusiness.org/data 
/exploretopics/enforcing-contracts. 
For 11 economies for which the data are 
also collected for the second largest 
business city, the name of the relevant 
court in that city is given as well. 
Assumptions about the case 
ƒƒ The value of the claim is equal to 
200% of the economy’s income 
per capita or $5,000, whichever is 
greater.17 
ƒƒ The dispute concerns a lawful 
transaction between 2 businesses 
(Seller and Buyer), both located in 
the economy’s largest business 
city. For 11 economies the data are 
also collected for the second larg-est 
business city (see table 14A.1). 
Pursuant to a contract between 
the businesses, Seller sells some 
custom-made furniture to Buyer 
worth 200% of the economy’s in-come 
per capita or $5,000, which-ever 
is greater. After Seller delivers 
the goods to Buyer, Buyer refuses 
to pay the contract price, alleging 
that the goods are not of adequate 
quality. Because they were custom-made, 
Seller is unable to sell them 
to anyone else. 
ƒƒ Seller (the plaintiff) sues Buyer (the 
defendant) to recover the amount 
under the sales agreement. The 
dispute is brought before the court 
located in the economy’s largest 
business city with jurisdiction over 
commercial cases worth 200% 
of income per capita or $5,000, 
whichever is greater. As noted, 
for 11 economies the data are also 
Figure 14.17 What are the time, cost 
and number of procedures to resolve a 
commercial dispute through the courts? 
Court 
Filing  
service 
Trial  
judgment 
Enforcement 
Company A 
(seller  
plaintiff) 
Company B 
(buyer  
defendant) 
Time 
Cost 
Number of 
procedures 
Commercial 
dispute 
Figure 14.18 Enforcing contracts: 
resolving a commercial dispute through 
the courts 
Rankings are based on distance to 
frontier scores for 3 indicators 
Attorney, court and 
enforcement costs as 
% of claim value 
Days to resolve 
commercial sale dispute 
through the courts 
33.3% 
Time 
33.3% 
Cost 
33.3% 
Procedures 
Steps to file claim, obtain judgment 
and enforce it 
TABLE 14.11 What do the trading 
across borders indicators measure? 
Documents required to export and import 
(number) 
Bank documents 
Customs clearance documents 
Port and terminal handling documents 
Transport documents 
Time required to export and import (days) 
Obtaining, filling out and submitting all the 
documents 
Inland transport and handling 
Customs clearance and inspections 
Port and terminal handling 
Does not include sea transport time 
Cost required to export and import 
(US$ per container) 
All documentation 
Inland transport and handling 
Customs clearance and inspections 
Port and terminal handling 
Official costs only, no bribes
138 DOING BUSINESS 2015 
collctd for th scond lrst 
businss cit (s tbl 14A.1). 
ƒ At th outst of th disput, Sllr 
dcids to ttch Bur’s movbl 
ssts (for xmpl, offic quip-m 
nt nd vhicls) bcus Sllr 
frs tht Bur m hid its ssts 
or othrwis bcom insolvnt. 
ƒ Th clim is disputd on th mrits 
bcus of Bur’s lltion tht 
th qulit of th oods ws not 
dqut. Bcus th court cn-not 
dcid th cs on th bsis of 
documntr vidnc or ll titl 
lon, n xprt opinion is ivn on 
th qulit of th oods. If it is stn-d 
rd prctic in th conom for 
ch prt to cll its own xprt wit-n 
ss, th prtis ch cll on xprt 
witnss. If it is stndrd prctic for 
th jud to ppoint n indpndnt 
xprt, th jud dos so. In this cs 
th jud dos not llow opposin 
xprt tstimon. 
ƒ Followin th xprt opinion, th 
jud dcids tht th oods d- 
livrd b Sllr wr of dqut 
qulit nd tht Bur must p 
th contrct pric. Th jud thus 
rndrs  finl judmnt tht is 
100% in fvor of Sllr. 
ƒ Bur dos not ppl th jud- 
mnt. Sllr dcids to strt nforc-in 
 th judmnt s soon s th 
tim lloctd b lw for ppl 
lpss. 
ƒ Sllr tks ll rquird stps for 
prompt nforcmnt of th jud- 
mnt. Th mon is succssfull 
collctd throuh  public sl of 
Bur’s movbl ssts (for xm-pl 
, offic quipmnt nd vhicls). 
Procedures 
Th list of procdurl stps compild 
for ch conom trcs th chronol-o 
 of  commrcil disput bfor th 
rlvnt court. A procdur is dfind s 
n intrction, rquird b lw or com-monl 
 crrid out in prctic, btwn 
th prtis or btwn thm nd th 
jud or court officr. Othr procdurl 
stps, intrnl to th court or btwn 
th prtis nd thir counsl, m 
b countd s wll. Procdurl stps 
includ stps to fil nd srv th cs, 
stps to ssin th cs to  jud, 
stps for tril nd judmnt nd stps 
ncssr to nforc th judmnt 
(tbl 14.12). 
To indict ovrll fficinc, 1 proc- 
dur is subtrctd from th totl num-b 
r for conomis tht hv spcilid 
commrcil courts or divisions, nd 
1 procdur for conomis tht llow 
lctronic filin of th initil complint. 
Som procdurl stps tht r prt 
of othrs r not countd in th totl 
numbr of procdurs. 
Time 
Tim is rcordd in clndr ds, 
countd from th momnt th plintiff 
dcids to fil th lwsuit in court 
until pmnt. This includs both th 
ds whn ctions tk plc nd 
th witin priods in btwn. Th 
vr durtion of 3 diffrnt sts 
of disput rsolution is rcordd: th 
compltion of srvic of procss (tim 
to fil nd srv th cs), th issu- 
nc of judmnt (tim for tril nd to 
obtin th judmnt) nd th rcovr 
of th clim vlu throuh  public sl 
(tim for nforcmnt of th judmnt). 
Cost 
Cost is rcordd s  prcnt of 
th clim, ssumd to b quivlnt to 
200% of incom pr cpit or $5,000, 
whichvr is rtr. Thr tps of 
costs r rcordd: court costs, nforc- 
mnt costs nd vr ttorn fs. 
Court costs includ ll costs tht Sllr 
(plintiff) must dvnc to th court, 
rrdlss of th finl cost born b 
Sllr. Enforcmnt costs r ll costs 
tht Sllr (plintiff) must dvnc to 
nforc th judmnt throuh  public 
sl of Bur’s movbl ssts, rrd-l 
ss of th finl cost born b Sllr. 
Avr ttorn fs r th fs tht 
Sllr (plintiff) must dvnc to  lo-c 
l ttorn to rprsnt Sllr in th 
stndrdid cs. Bribs r not tkn 
into ccount. 
Th d
t
 dt
ils on nforcin contr
cts c
n 
b found for 
ch conom 
t http://www 
.doinbusinss.or. This mthodolo w
s 
dvlopd b Dj
nkov 
nd othrs (2003) 

nd is 
doptd hr with minor ch
ns. 
RESOLVING INSOLVENCY 
Doin Businss studis th tim, cost 
nd outcom of insolvnc procdins 
involvin domstic ntitis. In ddition, 
this r it introducs  nw msur, 
th strnth of insolvnc frmwork 
indx, vlutin th dquc nd 
intrit of th ll frmwork ppli-c 
bl to liquidtion nd rornition 
procdins. Th dt for th rsolvin 
insolvnc indictors r drivd from 
qustionnir rsponss b locl insol-v 
nc prctitionrs nd vrifid throuh 
 stud of lws nd rultions s wll 
s public informtion on bnkruptc 
sstms. Th rnkin of conomis 
on th s of rsolvin insolvnc is 
dtrmind b sortin thir distnc to 
frontir scors for rsolvin insolvnc. 
Ths scors r th simpl vr of 
th distnc to frontir scors for th 
rcovr rt nd th strnth of insol-v 
nc frmwork indx (fiur 14.19). 
TABLE 14.12 Wht do th nforcin† 
contrcts indictors msur? 
Proc	dur	s to 	nforc	 ­ contr­ct throuh th	 
courts (numb	r) 
Stps to fil nd srv th cs 
Stps for tril nd judmnt 
Stps to nforc th judmnt 
Tim	 r	quir	d to compl	t	 proc	dur	s 
(c­l	nd­r d­‡s) 
Tim to fil nd srv th cs 
Tim for tril nd to obtin th judmnt 
Tim to nforc th judmnt 
Cost r	quir	d to compl	t	 proc	dur	s (% of 
cl­im) 
Avr ttorn fs 
Court costs 
Enforcmnt costs
DATA NOTES 139 
Rankings are based on distance to 
frontier scores for 2 indicators 
Debt recovery in insolvency 
To mk th dt on th tim, cost nd 
outcom of insolvnc procdins 
comprbl cross conomis, svrl 
ssumptions bout th businss nd 
th cs r usd. 
Assumptions bout th 
businss 
Th businss: 
ƒ Is  limitd libilit compn. 
ƒ Oprts in th conom’s lrst 
businss cit. For 11 conomis th 
dt r lso collctd for th sc-ond 
lrst businss cit (s tbl 
14A.1). 
ƒ Is 100% domsticll ownd, with 
th foundr, who is lso chirmn of 
th suprvisor bord, ownin 51% 
(no othr shrholdr holds mor 
thn 5% of shrs). 
ƒ Hs downtown rl stt, whr it 
runs  hotl, s its mjor sst. 
ƒ Hs  profssionl nrl mnr. 
ƒ Hs 201 mplos nd 50 suppli- 
rs, ch of which is owd mon for 
th lst dlivr. 
ƒ Hs  10-r lon rmnt 
with  domstic bnk scurd b  
mort ovr th hotl’s rl s-t 
t proprt. A univrsl businss 
chr (n ntrpris chr) is lso 
ssumd in conomis whr such 
colltrl is rconid. If th lws 
of th conom do not spcificll 
provid for n ntrpris chr 
but contrcts commonl us som 
othr provision to tht ffct, this 
provision is spcifid in th lon 
rmnt. 
ƒ Hs obsrvd th pmnt schdul 
nd ll othr conditions of th lon 
up to now. 
ƒ Hs  mrkt vlu, oprtin s  
oin concrn, of 100 tims incom 
pr cpit or $200,000, whichvr 
is rtr. Th mrkt vlu of th 
compn’s ssts, if sold picml, 
is 70% of th mrkt vlu of th 
businss. 
Assumptions bout th cs 
Th businss is xprincin liquidit 
problms. Th compn’s loss in 2013 
rducd its nt worth to  ntiv 
fiur. It is Jnur 1, 2014. Thr is no 
csh to p th bnk intrst or prin-cip 
l in full, du th nxt d, Jnur 
2. Th businss will thrfor dfult 
on its lon. Mnmnt blivs tht 
losss will b incurrd in 2014 nd 
2015 s wll. But it xpcts 2014 csh 
flow to covr ll oprtin xpnss, 
includin supplir pmnts, slris, 
mintnnc costs nd txs, thouh 
not principl or intrst pmnts to 
th bnk. 
Th mount outstndin undr th 
lon rmnt is xctl qul to 
th mrkt vlu of th hotl businss 
nd rprsnts 74% of th compn’s 
totl dbt. Th othr 26% of its dbt is 
hld b unscurd crditors (supplirs, 
mplos, tx uthoritis). 
Th compn hs too mn crditors 
to notit n informl out-of-court 
workout. Th followin options r 
vilbl:  judicil procdur imd t 
th rhbilittion or rornition of 
th compn to prmit its continud 
oprtion;  judicil procdur imd 
t th liquidtion or windin-up of 
th compn; or  dbt nforcmnt 
procdur (forclosur or rcivrship) 
inst th compn. 
Assumptions bout th prtis 
Th bnk wnts to rcovr s much 
s possibl of its lon, s quickl nd 
chpl s possibl. Th unscurd 
crditors will do vrthin prmittd 
undr th pplicbl lws to void 
 picml sl of th ssts. Th 
mjorit shrholdr wnts to kp 
th compn oprtin nd undr his 
control. Mnmnt wnts to kp 
th compn oprtin nd prsrv 
its mplos’ jobs. All th prtis r 
locl ntitis or citins; no forin 
prtis r involvd. 
Tim 
Tim for crditors to rcovr thir 
crdit is rcordd in clndr rs 
(tbl 14.13). Th priod of tim m- 
surd b Doin Businss is from th 
compn’s dfult until th pmnt 
of som or ll of th mon owd to th 
bnk. Potntil dl tctics b th 
FIGURE 14.19 Rsolvin† insolvnc: 
rcovr rt nd strn†th of insolvnc 
frmwork 
50% 
Recovery 
rate 
50% 
Strength of 
insolvency 
framework 
index 
TABLE 14.13 Wht do th indictors 
on dbt rcovr in insolvnc 
msur? 
Tim	 r	quir	d to r	cov	r d	bt (‡	­rs) 
Msurd in clndr rs 
Appls nd rqusts for xtnsion r includd 
Cost r	quir	d to r	cov	r d	bt (% of d	btor’s 
	st­t	) 
Msurd s prcnt of stt vlu 
Court fs 
Fs of insolvnc dministrtors 
Lwrs’ fs 
Assssors’ nd uctionrs’ fs 
Othr rltd fs 
Outcom	 
Whthr th businss continus oprtin s 
 oin concrn or whthr its ssts r sold 
picml 
R	cov	r‡ r­t	 for s	cur	d cr	ditors (c	nts on 
th	 doll­r) 
Msurs th cnts on th dollr rcovrd b 
scurd crditors 
Prsnt vlu of dbt rcovrd 
Officil costs of th insolvnc procdins r 
dductd 
Dprcition of furnitur is tkn into ccount 
Outcom for th businss (survivl or not) ffcts 
th mximum vlu tht cn b rcovrd
140 DOING BUSINESS 2015 
Time Cost Outcome 
prtis, such s th filin of diltor 
ppls or rqusts for xtnsion, r 
tkn into considrtion. 
Cost 
Th cost of th procdins is r- 
cordd s  prcnt of th vlu 
of th dbtor’s stt. Th cost is cl-cul 
td on th bsis of qustionnir 
rsponss nd includs court fs nd 
ovrnmnt lvis; fs of insolvnc 
dministrtors, uctionrs, sss-sors 
nd lwrs; nd ll othr fs 
nd costs. 
Outcome 
Rcovr b crditors dpnds on 
whthr th hotl businss mrs 
from th procdins s  oin 
concrn or th compn’s ssts r 
sold picml. If th businss kps 
oprtin, 100% of th hotl vlu is 
prsrvd. If th ssts r sold pic- 
ml, th mximum mount tht cn 
b rcovrd is 70% of th vlu of th 
hotl. 
Recovery rate 
Th rcovr rt is rcordd s cnts 
on th dollr rcoupd b scurd 
crditors throuh rornition, 
liquidtion or dbt nforcmnt (for- 
closur or rcivrship) procdins 
(fiur 14.20). Th clcultion tks 
into ccount th outcom: whthr th 
businss mrs from th procdins 
s  oin concrn or th ssts r 
sold picml. Thn th costs of th 
procdins r dductd (1 cnt for 
ch prcnt point of th vlu of 
th dbtor’s stt). Finll, th vlu 
lost s  rsult of th tim th mon 
rmins tid up in insolvnc procd-in 
s is tkn into ccount, includin 
th loss of vlu du to dprcition 
of th hotl furnitur. Consistnt with 
intrntionl ccountin prctic, th 
nnul dprcition rt for furnitur 
is tkn to b 20%. Th furnitur is s-sum 
d to ccount for  qurtr of th 
totl vlu of ssts. Th rcovr rt 
is th prsnt vlu of th rminin 
procds, bsd on nd-2013 lndin 
rts from th Intrntionl Montr 
Fund’s Intrn
tion
l Fin
nci
l St
tistics, 
supplmntd with dt from cntrl 
bnks nd th Economist Intllinc 
Unit. 
If n conom hd ro css  r 
ovr th pst 5 rs involvin  judi-ci 
l rornition, judicil liquidtion 
or dbt nforcmnt procdur (for- 
closur or rcivrship), th conom 
rcivs  “no prctic” mrk on th 
tim, cost nd outcom indictors. This 
mns tht crditors r unlikl to 
rcovr thir mon throuh  forml 
ll procss. Th rcovr rt for “no 
prctic” conomis is ro. In ddi-tion, 
 “no prctic” conom rcivs 
 scor of 0 on th strnth of insol-v 
nc frmwork indx vn if its ll 
frmwork includs provisions rltd 
to insolvnc procdins (liquidtion 
or rornition). 
Strength of insolvency 
framework 
Th strnth of insolvnc frmwork 
indx is bsd on 4 othr indics: 
commncmnt of procdins indx, 
mnmnt of dbtor’s ssts indx, 
rornition procdins indx nd 
crditor prticiption indx (fiur 
14.21; tbl 14.14). 
Commencement of 
proceedings index 
Th commncmnt of procdins 
indx hs 3 componnts: 
ƒ Whthr dbtors cn initit both 
liquidtion nd rornition pro-c 
dins. A scor of 1 is ssind if 
dbtors cn initit both tps of 
procdins; 0.5 if th cn initi- 
t onl on of ths tps (ithr 
liquidtion or rornition); 0 
if th cnnot initit insolvnc 
procdins. 
ƒ Whthr crditors cn initit both 
liquidtion nd rornition pro-c 
dins. A scor of 1 is ssind if 
crditors cn initit both tps of 
procdins; 0.5 if th cn initi- 
t onl on of ths tps (ithr 
liquidtion or rornition); 0 
if th cnnot initit insolvnc 
procdins. 
ƒ Wht stndrd is usd for com-m 
ncmnt of insolvnc procd-in 
s. A scor of 1 is ssind if  
liquidit tst (th dbtor is nr- 
ll unbl to p its dbts s th 
FIGURE 14.20 Rcovr rt is  function of th tim, cost nd outcom of insolvnc 
procdin†s †inst  locl compn 
Secured creditor 
with unpaid claim Recovery rate 
Reorganization, liquidation 
or foreclosure proceedings 
FIGURE 14.21 Strn†th of insolvnc 
frmwork indx msurs th qulit 
of insolvnc lws tht †ovrn rltions 
btwn dbtors, crditors nd th court 
Management of 
debtor’s assets 
index 
Commencement 
of proceedings 
index 
Reorganization 
proceedings index 
Creditor 
participation 
index 
Court 
Creditors Debtor
DATA NOTES 141 
mtur) is usd; 0.5 if th blnc 
sht tst (th libilitis of th 
dbtor xcd its ssts) is usd; 
1 if both th liquidit nd blnc 
sht tsts r vilbl but onl 
on is rquird to initit insolvnc 
procdins; 0.5 if both tsts r 
rquird; 0 if  diffrnt tst is usd. 
Th indx rns from 0 to 3, with 
hihr vlus indictin rtr ccss 
to insolvnc procdins. In Bulri, 
for xmpl, dbtors cn initit both 
liquidtion nd rornition procd-in 
s ( scor of 1), s cn crditors ( 
scor of 1). Th stndrd for commnc-in 
 insolvnc procdins is tht th 
dbtor cnnot p its dbts s th 
mtur ( scor of 1). Addin ths 
numbrs ivs Bulri  scor of 3 
on th commncmnt of procdins 
indx. 
Management of debtor’s 
assets index 
Th mnmnt of dbtor’s ssts 
indx hs 6 componnts: 
ƒ Whthr th dbtor (or n insol-v 
nc rprsnttiv on its bhlf) 
cn continu prformin contrcts 
ssntil to th dbtor’s survivl. 
A scor of 1 is ssind if s; 0 if 
continution of contrcts is not 
possibl or if th lw contins no 
provisions on this subjct. 
ƒ Whthr th dbtor (or n insolvn-c 
 rprsnttiv on its bhlf) cn 
rjct ovrl burdnsom contrcts. 
A scor of 1 is ssind if s; 0 if r- 
jction of contrcts is not possibl. 
ƒ Whthr trnsctions ntrd into 
bfor commncmnt of insolvn-c 
 procdins tht iv prfrnc 
to on or svrl crditors cn b 
voidd ftr procdins r initi- 
td. A scor of 1 is ssind if s; 
0 if voidnc of such trnsctions 
is not possibl. 
ƒ Whthr undrvlud trnsctions 
ntrd into bfor commncmnt 
of insolvnc procdins cn b 
voidd ftr procdins r initi- 
td. A scor of 1 is ssind if s; 
0 if voidnc of such trnsctions 
is not possibl. 
ƒ Whthr th insolvnc frmwork 
includs spcific provisions tht llow 
th dbtor (or n insolvnc rprsn-t 
tiv on its bhlf), ftr commnc- 
mnt of insolvnc procdins, to 
obtin finncin ncssr to func-tion 
durin th procdins. A scor 
of 1 is ssind if s; 0 if obtinin 
post-commncmnt finncin is 
not possibl or if th lw contins no 
provisions on this subjct. 
ƒ Whthr post-commncmnt fi-n 
ncin rcivs priorit ovr ordinr 
unscurd crditors durin distribu-tion 
of ssts. A scor of 1 is ssind 
if s; 0.5 if post-commncmnt fi-n 
ncin is rntd suprpriorit ovr 
ll crditors, scurd nd unscurd; 
0 if no priorit is rntd to post-comm 
ncmnt finncin. 
Th indx rns from 0 to 6, with 
hihr vlus indictin mor dvnt- 
ous trtmnt of th dbtor’s ssts 
from th prspctiv of th compn’s 
stkholdrs. In Rwnd, for xmpl, 
dbtors cn continu ssntil con-tr 
cts ( scor of 1) nd rjct burdn-som 
 ons ( scor of 1) durin insol-v 
nc procdins. But th insolvnc 
frmwork contins no provisions on 
ithr prfrntil trnsctions ( scor 
of 0) or undrvlud ons ( scor of 
0). Post-commncmnt finncin is 
vilbl undr th lws of Rwnd ( 
scor of 1) nd rcivs priorit onl ovr 
ordinr unscurd crditors ( scor of 
1). Addin ths numbrs ivs Rwnd 
 scor of 4 on th mnmnt of 
dbtor’s ssts indx. 
Reorganization proceedings 
index 
Th rornition procdins indx 
hs 3 componnts: 
ƒ Whthr th rornition pln is 
votd on onl b th crditors whos 
rihts r modifid or ffctd b th 
pln. A scor of 1 is ssind if s; 
0.5 if ll crditors vot on th pln, 
rrdlss of its impct on thir 
intrsts; 0 if crditors do not vot 
on th pln or if rornition is not 
vilbl. 
ƒ Whthr crditors ntitld to vot 
on th pln r dividd into clsss, 
ch clss vots sprtl nd th 
crditors within ch clss r trt- 
d qull. A scor of 1 is ssind 
if th votin procdur hs ths 3 
fturs; 0 if th votin procdur 
dos not hv ths 3 fturs or if 
rornition is not vilbl. 
ƒ Whthr th insolvnc frmwork 
rquirs tht dissntin crditors r- 
civ s much undr th rorni- 
tion pln s th would hv rcivd 
in liquidtion. A scor of 1 is ssind 
if s; 0 if no such provisions xist or 
if rornition is not vilbl. 
Th indx rns from 0 to 3, with 
hihr vlus indictin rtr com-pli 
nc with intrntionll ccptd 
TABLE 14.14 Wht do th indictors 
on th strn†th of th insolvnc 
frmwork msur? 
Comm	nc	m	nt of proc		dins ind	x (0–3) 
Avilbilit of liquidtion nd rorni‡tion to 
dbtors nd crditors 
Stndrds for commncmnt of insolvnc 
procdins 
M­n­	m	nt of d	btor’s ­ss	ts ind	x (0–6) 
Continution nd rjction of contrcts durin 
insolvnc 
Avoidnc of prfrntil nd undrvlud 
trnsctions 
Post-commncmnt crdit 
R	or­ni›­tion proc		dins ind	x (0–3) 
Approvl nd contnt of th rorni‡tion pln 
Cr	ditor p­rticip­tion ind	x (0–4) 
Crditors’ prticiption in nd rihts durin 
liquidtion nd rorni‡tion procdins 
Str	nth of insolv	nc‡ fr­m	work ind	x (0–16) 
Sum of th commncmnt of procdins, 
mnmnt of dbtor’s ssts, rorni‡tion 
procdins nd crditor prticiption indics
142 DOING BUSINESS 2015 
prctics. Nicru, for xmpl, hs 
no judicil rornition procd-in 
s nd thrfor rcivs  scor of 
0 on th rornition procdins 
indx. In Estoni, nothr xmpl, onl 
crditors whos rihts r ffctd b 
th rornition pln r llowd to 
vot ( scor of 1). Th rornition 
pln divids crditors into clsss, 
ch clss vots sprtl nd crdi-tors 
within th sm clss r trtd 
qull ( scor of 1). But thr r no 
provisions rquirin tht th rturn to 
dissntin crditors b qul to wht 
th would hv rcivd in liquidtion 
( scor of 0). Addin ths numbrs 
ivs Estoni  scor of 2 on th ror- 
nition procdins indx. 
Creditor participation index 
Th crditor prticiption indx hs 4 
componnts: 
ƒ Whthr crditors prticipt in th 
slction of n insolvnc rprsn-t 
tiv. A scor of 1 is ssind if s; 
0 if no. 
ƒ Whthr crditors r rquird to 
pprov th sl of substntil s-s 
ts of th dbtor in th cours of 
insolvnc procdins. A scor of 1 
is ssind if s; 0 if no. 
ƒ Whthr n individul crditor hs 
th riht to ccss informtion 
bout insolvnc procdins, 
ithr b rqustin it from n 
insolvnc rprsnttiv or b r- 
viwin th officil rcords. A scor 
of 1 is ssind if s; 0 if no. 
ƒ Whthr n individul crditor cn 
objct to  dcision of th court or 
of th insolvnc rprsnttiv to 
pprov or rjct clims inst th 
dbtor brouht b th crditor itslf 
nd b othr crditors. A scor of 1 
is ssind if s; 0 if no. 
Th indx rns from 0 to 4, with 
hihr vlus indictin rtr pr-ticip 
tion of crditors. In Iclnd, for 
xmpl, th court ppoints th insol-v 
nc rprsnttiv, without crditors’ 
pprovl ( scor of 0). Th insolvnc 
rprsnttiv dcids uniltrll on 
th sl of th dbtor’s ssts ( scor 
of 0). An crditor cn inspct th 
rcords kpt b th insolvnc rpr- 
snttiv ( scor of 1). And n crditor 
is llowd to chlln  dcision of th 
insolvnc rprsnttiv to pprov ll 
clims if this dcision ffcts th crdi-tor’s 
rihts ( scor of 1). Addin ths 
numbrs ivs Iclnd  scor of 2 on 
th crditor prticiption indx. 
Strength of insolvency 
framework index 
Th strnth of insolvnc frmwork 
indx is th sum of th scors on th 
commncmnt of procdins indx, 
mnmnt of dbtor’s ssts indx, 
rornition procdins indx nd 
crditor prticiption indx. Th indx 
rns from 0 to 16, with hihr vlus 
indictin insolvnc lisltion tht is 
bttr dsind for rhbilittin vibl 
firms nd liquidtin nonvibl ons. 
This mthodolo w
s dvlopd b 
Dj
nkov, H
rt 
nd othrs (2008) 
nd 
is 
doptd hr with svr
l ch
ns. 
Th strnth of insolvnc fr
mwork 
indx w
s introducd in Doin Businss 
2015. Th bst pr
ctics tstd in 
this indx wr dvlopd on th b
sis 
of th World B
nk’s Principls for 
Effctiv Insolvnc nd Crditor/ 
Dbtor Rims 
nd th Unitd N
tions 
Commission on Intrn
tion
l Tr
d L
w’s 
Lisltiv Guid on Insolvnc Lw. 
LABOR MARKET 
REGULATION 
Doin Businss msurs flxibilit in 
th rultion of mplomnt, sp- 
cificll s it ffcts th hirin nd 
rdundnc of workrs nd th riidit 
of workin hours (fiur 14.22). This 
r, for th first tim, th indictors 
msurin flxibilit in lbor mrkt 
rultions focus on thos ffctin 
th food rtil industr, usin  stn-d 
rdid cs stud of  cshir in  
suprmrkt. Also nw is tht Doin 
Businss collcts dt on rultions 
pplin to mplos hird throuh 
tmporr-work ncis s wll 
s on thos pplin to prmnnt 
mplos or mplos hird on fixd-t 
rm contrcts. Th indictors lso 
covr dditionl rs of lbor mrkt 
rultion, includin socil protction 
schms nd bnfits s wll s lbor 
disputs. 
Ovr th priod from 2007 to 2011 
improvmnts wr md to lin 
th mthodolo for th lbor mr-k 
t rultion indictors (formrl 
th mploin workrs indictors) 
with th lttr nd spirit of th 
Intrntionl Lbour Ornition 
(ILO) convntions. Onl 6 of th 188 
ILO convntions covr rs msurd 
b Doin Businss: mplo trmin- 
tion, wknd work, holid with 
FIGURE 14.22 How flxibl r hirin†, work schdulin† nd rdundnc ruls? 
Work 
scheduling 
2. 
1. Hiring 3.Redundancy
DATA NOTES 143 
p, niht work, protction inst 
unmplomnt nd mdicl cr nd 
sicknss bnfits. Th Doin Businss 
mthodolo is full consistnt with 
ths 6 convntions. Th ILO convn-tions 
covrin rs rltd to th 
lbor mrkt rultion indictors 
do not includ th ILO cor lbor 
stndrds—8 convntions covrin 
th riht to collctiv brinin, th 
limintion of forcd lbor, th boli-tion 
of child lbor nd quitbl trt-m 
nt in mplomnt prctics. 
Btwn 2009 nd 2011 th World 
Bnk Group workd with  consult- 
tiv roup—includin lbor lwrs, 
mplor nd mplo rprsnt- 
tivs, nd xprts from th ILO, 
th Ornistion for Economic Co-op 
rtion nd Dvlopmnt (OECD), 
civil socit nd th privt sctor—to 
rviw th mthodolo for th lbor 
mrkt rultion indictors nd x-plor 
 futur rs of rsrch.18 A full 
rport with th conclusions of th con-sult 
tiv roup, lon with th mthod-olo 
 it proposd, is vilbl t http:// 
www.doinbusinss.or/mthodolo 
/lbor-mrkt-rultion. 
Doin Businss 2015 prsnts th dt 
for th lbor mrkt rultion indic- 
tors in n nnx. Th rport dos not 
prsnt rnkins of conomis on 
ths indictors or includ th topic 
in th rt distnc to frontir 
scor or rnkin on th s of doin 
businss. Dtild dt collctd on 
lbor mrkt rultions r vilbl 
on th Doin Businss wbsit (http:// 
www.doinbusinss.or). Th dt on 
lbor mrkt rultions r bsd on 
 dtild qustionnir on mplo- 
mnt rultions tht is compltd 
b locl lwrs nd public officils. 
Emplomnt lws nd rultions s 
wll s scondr sourcs r rviwd 
to nsur ccurc. 
To mk th dt comprbl cross 
conomis, svrl ssumptions bout 
th workr nd th businss r usd. 
Assumptions about the worker 
Th workr: 
ƒ Is  cshir in  suprmrkt or 
rocr stor. 
ƒ Is  full-tim mplo. 
ƒ Is not  mmbr of th lbor union, 
unlss mmbrship is mndtor. 
Assumptions about the 
business 
Th businss: 
ƒ Is  limitd libilit compn (or th 
quivlnt in th conom). 
ƒ Oprts  suprmrkt or rocr 
stor in th conom’s lrst busi-n 
ss cit. For 11 conomis th dt 
r lso collctd for th scond 
lrst businss cit (s tbl 14A.1). 
ƒ Hs 60 mplos. 
ƒ Is subjct to collctiv brinin 
rmnts if such rmnts 
covr mor thn 50% of th food 
rtil sctor nd th ppl vn to 
firms tht r not prt to thm. 
ƒ Abids b vr lw nd rultion 
but dos not rnt workrs mor 
bnfits thn thos mndtd b 
lw, rultion or (if pplicbl) col-l 
ctiv brinin rmnts. 
Ri‘idit’ of mplo’mnt 
Riidit of mplomnt covrs 3 
rs: difficult of hirin, riidit of 
hours nd difficult of rdundnc 
(tbl 14.15). 
Difficult of hirin covrs 4 rs: 
(i) whthr fixd-trm contrcts r 
prohibitd for prmnnt tsks; (ii) 
th mximum cumultiv durtion 
of fixd-trm contrcts; (iii) th 
minimum w for  cshir,  19, 
with 1 r of work xprinc; nd (iv) 
th rtio of th minimum w to th 
vr vlu ddd pr workr.19 
Riidit of hours covrs 7 rs: (i) 
whthr th workwk cn xtnd to 
50 hours or mor (includin ovrtim) 
2 months in  r to rspond to  
ssonl incrs in worklod; (ii) th 
mximum numbr of ds llowd in 
th workwk; (iii) th prmium for 
TABLE 14.15 Wht do th lbor 
mrkt r†ultion indictors includ? 
Riidit‡ of 	mplo‡m	nt 
Difficult of hirin 
Whthr fixd-trm contrcts r prohibitd for 
prmnnt tsks 
Mximum durtion of fixd-trm contrcts, 
includin rnwls 
Minimum w pplicbl to th workr ssumd 
in th cs stud (US$/month) 
Rtio of minimum w to vlu ddd pr 
workr 
Riidit of hours 
Whthr 50-hour workwks r prmittd for 2 
months in  r du to n incrs in worklod 
Allowd mximum lnth of th workwk in 
ds nd hours, includin ovrtim 
Prmium for niht work (% of hourl p) 
Prmium for work on  wkl rst d (% of 
hourl p) 
Whthr thr r rstrictions on niht work nd 
wkl holid work 
Pid nnul vction ds for workrs with 1 
r of tnur, 5 rs of tnur nd 10 rs 
of tnur 
Difficult of r
dund
nc 
Lnth of th mximum probtionr priod (in 
months) for prmnnt mplos 
Whthr rdundnc is llowd s rounds for 
trmintion 
Whthr third-prt notifiction is rquird for 
trmintion of  rdundnt workr or roup of 
workrs 
Whthr third-prt pprovl is rquird for 
trmintion of  rdundnt workr or roup of 
workrs 
Whthr mplor is oblitd to rssin or 
rtrin nd to follow priorit ruls for rdundnc 
nd rmplomnt 
R	dund­nc‡ cost (w		ks of s­l­r‡) 
Notic rquirmnts, svrnc pmnts nd 
pnltis du whn trmintin  rdundnt 
workr, xprssd in wks of slr 
Soci­l prot	ction sch	m	s ­nd b	n	fits 
Whthr n unmplomnt protction schm 
xists 
Whthr th lw rquirs mplors to provid 
hlth insurnc for prmnnt mplos 
L­bor disput	s 
Avilbilit of courts or court sctions 
spcili‡in in lbor disputs 
niht work (s  prcnt of hourl 
p); (iv) th prmium for work on 
 wkl rst d (s  prcnt 
of hourl p); (v) whthr thr r
144 DOING BUSINESS 2015 
rstrictions on niht work; (vi) whthr 
thr r rstrictions on wkl holid 
work; nd (vii) th vr pid n-nu 
l lv for workrs with 1 r of 
tnur, 5 rs of tnur nd 10 rs 
of tnur. 
Difficult of rdundnc looks t 9 
qustions: (i) wht th lnth is in 
months of th mximum probtion- 
r priod; (ii) whthr rdundnc is 
disllowd s  bsis for trmintin 
workrs; (iii) whthr th mplor 
nds to notif  third prt (such s 
 ovrnmnt nc) to trmint 
1 rdundnt workr; (iv) whthr th 
mplor nds to notif  third prt 
to trmint  roup of 9 rdundnt 
workrs; (v) whthr th mplor 
nds pprovl from  third prt to 
trmint 1 rdundnt workr; (vi) 
whthr th mplor nds pprovl 
from  third prt to trmint  roup 
of 9 rdundnt workrs; (vii) whthr 
th lw rquirs th mplor to rs-si 
n or rtrin  workr bfor mkin 
th workr rdundnt; (viii) whthr 
priorit ruls ppl for rdundncis; 
nd (ix) whthr priorit ruls ppl for 
rmplomnt. 
Redundancy cost 
Rdundnc cost msurs th cost 
of dvnc notic rquirmnts, sv- 
rnc pmnts nd pnltis du 
whn trmintin  rdundnt workr, 
xprssd in wks of slr. Th vr- 
 vlu of notic rquirmnts nd 
svrnc pmnts pplicbl to  
workr with 1 r of tnur,  workr 
with 5 rs nd  workr with 10 rs 
is considrd. On month is rcordd s 
4 nd 1/3 wks. 
Social protection schemes and 
benefits 
Doin Businss collcts dt on th 
xistnc of unmplomnt protction 
schms s wll s dt on whthr 
mplors r lll rquird to pro-vid 
 hlth insurnc for mplos 
with prmnnt contrcts. 
Labor disputes 
Doin Businss sssss th mch- 
nisms vilbl to rsolv lbor dis-put 
s. Mor spcificll, it collcts dt 
on wht courts would b comptnt to 
hr lbor disputs nd whthr th 
comptnt courts r spcilid in 
rsolvin lbor disputs. 
Th d
t
 dt
ils on l
bor m
rkt rul
- 
tion c
n b found for 
ch conom 
t 
http://www.doinbusinss.or. Th Doin 
Businss wbsit 
lso provids historic
l 
d
t
 sts. Th mthodolo w
s dvl-op 
d b Botro 
nd othrs (2004). Doin 
Businss 2015 dos not prsnt r
nkins 
of conomis on th l
bor m
rkt rul
- 
tion indic
tors. 
NOTES 
1. Th dt for pin txs rfr to Jnur– 
Dcmbr 2013. 
2. Ths r Bnldsh, Bril, Chin, Indi, 
Indonsi, Jpn, Mxico, Niri, Pkistn, 
th Russin Fdrtion nd th Unitd 
Stts. 
3. This corrction rt rflcts chns tht 
xcd 5% up or down. 
4. This ssumption is nw in Doin Businss 
2015. 
5. This componnt is rvisd in Doin Businss 
2015. Th prvious mthodolo ssind  
point if mor thn 2 rs of historicl dt 
wr distributd. Similrl, crdit burus 
nd ristris tht rsd dt on dfults 
s soon s th wr rpid obtind  
scor of 0. 
6. This componnt is rvisd in Doin Businss 
2015. Th prvious mthodolo ssind 
 point if borrowrs hv th riht b lw 
to ccss thir dt in th lrst crdit 
buru or ristr in th conom. 
7. This componnt is nw in Doin Businss 
2015. 
8. This componnt is nw in Doin Businss 
2015. 
9. This qustion is usull rultd b stock 
xchn or scuritis lws. Points r 
wrdd onl to conomis with mor thn 
10 listd firms in thir most importnt stock 
xchn. 
10. Whn vlutin th rim of libilit for 
compn dirctors for  prjudicil rltd-p 
rt trnsction, Doin Businss ssums 
tht th trnsction ws dul disclosd nd 
pprovd. Doin Businss dos not msur 
dirctor libilit in th vnt of frud. 
11. This componnt is rvisd in Doin Businss 
2015; it combins 2 prviousl sprt 
componnts. 
12. This componnt is nw in Doin Businss 
2015. 
13. This componnt is nw in Doin Businss 
2015. 
14. PwC rfrs to th ntwork of mmbr firms 
of PricwtrhousCooprs Intrntionl 
Limitd (PwCIL) or, s th contxt rquirs, 
individul mmbr firms of th PwC 
ntwork. Ech mmbr firm is  sprt 
ll ntit nd dos not ct s nt of 
PwCIL or n othr mmbr firm. PwCIL 
dos not provid n srvics to clints. 
PwCIL is not rsponsibl or libl for th 
cts or omissions of n of its mmbr 
firms nor cn it control th xrcis of thir 
profssionl judmnt or bind thm in n 
w. No mmbr firm is rsponsibl or 
libl for th cts or omissions of n othr 
mmbr firm nor cn it control th xrcis 
of nothr mmbr firm’s profssionl 
judmnt or bind nothr mmbr firm or 
PwCIL in n w. 
15. Th nonlinr distnc to frontir for th 
totl tx rt is qul to th distnc to 
frontir for th totl tx rt to th powr of 
0.8. 
16. Whil diffrnt tps of continrs r usd 
round th world, th 2 most importnt 
r 20-foot nd 40-foot continrs. Us 
of 40-foot continrs is rowin, but this 
r’s rsrch confirms tht 20-foot 
continrs r still common in th mjorit 
of conomis. Accordin to rspondnts 
qustiond in ch of th 189 conomis 
covrd b Doin Businss, 20-foot nd 
40-foot continrs r qull common in 
49% of th conomis, 20-foot continrs 
r mor common in 29%, nd 40-foot 
continrs r mostl rlid on in onl 10%. 
For th rminin 12% of conomis no 
dt on th us of th 2 tps of continrs 
wr vilbl. Th trdin cross bordrs 
indictors will continu to b bsd on 20- 
foot continrs bcus this si rmins 
th most rlvnt for intrntionl trd 
cross th lob. 
17. This ssumption is rvisd in Doin Businss 
2015. 
18. For th trms of rfrnc nd composition 
of th consulttiv roup, s World 
Bnk, “Doin Businss Emploin Workrs 
Indictor Consulttiv Group,” http://www 
.doinbusinss.or. 
19. Th vr vlu ddd pr workr is th 
rtio of n conom’s GNI pr cpit to th 
workin- popultion s  prcnt of 
th totl popultion.
DATA NOTES 145 
TABLE 14A.1 Citis covrd in ch conom b th Doin Businss rport 
Econom‡ Cit‡ or citi	s Econom‡ Cit‡ or citi	s Econom‡ Cit‡ or citi	s 
Afhnistn Kbul Grc Athns Pkistn Krchi, Lhor 
Albni Tirn Grnd St. Gor’s Plu Koror 
Alri Alirs Gutml Gutml Cit Pnm Pnm Cit 
Anol Lund Guin Conkr Ppu Nw Guin Port Morsb 
Antiu nd Brbud St. John’s Guin-Bissu Bissu Pru Asunción 
Arntin Bunos Airs Gun Gortown Pru Lim 
Armni Yrvn Hiti Port-u-Princ Philippins Qu‡on Cit 
Austrli Sdn Hondurs Tucilp Polnd Wrsw 
Austri Vinn Hon Kon SAR, Chin Hon Kon SAR Portul Lisbon 
A‡rbijn Bku Hunr Budpst Purto Rico (U.S.) Sn Jun 
Bhms, Th Nssu Iclnd Rkjvik Qtr Doh 
Bhrin Mnm Indi Mumbi, Dlhi Romni Buchrst 
Bnldsh Dhk, Chitton Indonsi Jkrt, Surb Russin Fdrtion Moscow, St. Ptrsbur 
Brbdos Bridtown Irn, Islmic Rp. Thrn Rwnd Kili 
Blrus Minsk Irq Bhdd Smo Api 
Blium Brussls Irlnd Dublin Sn Mrino Sn Mrino 
Bli‡ Bli‡ Cit Isrl Tl Aviv Sao Tomé nd Príncip Sao Tomé 
Bnin Cotonou Itl Rom Sudi Arbi Ridh 
Bhutn Thimphu Jmic Kinston Snl Dkr 
Bolivi L P‡ Jpn Toko, Osk Srbi Blrd 
Bosni nd Hr‡ovin Srjvo Jordn Ammn Schlls Victori 
Botswn Gboron K‡khstn Almt Sirr Lon Frtown 
Br‡il Sao Pulo, Rio d Jniro Kn Nirobi Sinpor Sinpor 
Bruni Drusslm Bndr Sri Bwn Kiribti Trw Slovk Rpublic Brtislv 
Bulri Sofi Kor, Rp. Soul Slovni Ljubljn 
Burkin Fso Oudouou Kosovo Pristin Solomon Islnds Honir 
Burundi Bujumbur Kuwit Kuwit Cit South Afric Johnnsbur 
Cbo Vrd Pri Kr‡ Rpublic Bishkk South Sudn Jub 
Cmbodi Phnom Pnh Lo PDR Vintin Spin Mdrid 
Cmroon Doul Ltvi Ri Sri Lnk Colombo 
Cnd Toronto Lbnon Birut St. Kitts nd Nvis Bsstrr 
Cntrl Africn Rpublic Bnui Lsotho Msru St. Luci Cstris 
Chd N’Djmn Libri Monrovi St. Vincnt nd th Grndins Kinstown 
Chil Sntio Lib Tripoli Sudn Khrtoum 
Chin Shnhi, Bijin Lithuni Vilnius Surinm Prmribo 
Colombi Boota Luxmbour Luxmbour Sw‡ilnd Mbbn 
Comoros Moroni Mcdoni, FYR Skopj Swdn Stockholm 
Cono, Dm. Rp. Kinshs Mdscr Antnnrivo Swit‡rlnd Zurich 
Cono, Rp. Br‡‡vill Mlwi Blntr Srin Arb Rpublic Dmscus 
Cost Ric Sn José Mlsi Kul Lumpur Tiwn, Chin Tipi 
Côt d’Ivoir Abidjn Mldivs Mlé Tjikistn Dushnb 
Croti Zrb Mli Bmko Tn‡ni Dr s Slm 
Cprus Nicosi Mlt Vlltt Thilnd Bnkok 
C‡ch Rpublic Pru Mrshll Islnds Mjuro Timor-Lst Dili 
Dnmrk Copnhn Muritni Noukchott Too Lomé 
Djibouti Djibouti Vill Muritius Port Louis Ton Nuku’lof 
Dominic Rosu Mxico Mxico Cit, Montrr Trinidd nd Tobo Port of Spin 
Dominicn Rpublic Snto Domino Micronsi, Fd. Sts. Islnd of Pohnpi Tunisi Tunis 
Ecudor Quito Moldov Chisinau T urk Istnbul 
Ept, Arb Rp. Ciro Monoli Ulnbtr Und Kmpl 
El Slvdor Sn Slvdor Montnro Podoric Ukrin Kiv 
Equtoril Guin Mlbo Morocco Csblnc Unitd Arb Emirts Dubi 
Eritr Asmr Mo‡mbiqu Mputo Unitd Kindom London 
Estoni Tllinn Mnmr Ynon Unitd Stts Nw York Cit, Los Anls 
Ethiopi Addis Abb Nmibi Windhok Uruu Montvido 
Fiji Suv Npl Kthmndu U‡bkistn Tshknt 
Finlnd Hlsinki Nthrlnds Amstrdm Vnutu Port-Vil 
Frnc Pris Nw Zlnd Aucklnd Vn‡ul, RB Crcs 
Gbon Librvill Nicru Mnu Vitnm Ho Chi Minh Cit 
Gmbi, Th Bnjul Nir Nim Wst Bnk nd G‡ Rmllh 
Gori Tbilisi Niri Los, Kno Ymn, Rp. Sn’ 
Grmn Brlin Norw Oslo Zmbi Lusk 
Ghn Accr Omn Musct Zimbbw Hrr
Doing Business 2015 
Going Beyond Efficiency 
Distance to frontier and ease 
of doing business ranking 
This year’s report presents re-sults 
for 2 aggregate measures: 
the distance to frontier score 
and the ease of doing business rank-ing, 
which for the first time this year 
is based on the distance to frontier 
score. The ease of doing business 
ranking compares economies with one 
another; the distance to frontier score 
benchmarks economies with respect 
to regulatory best practice, showing 
the absolute distance to the best 
performance on each Doing Business in-dicator. 
When compared across years, 
the distance to frontier score shows 
how much the regulatory environment 
for local entrepreneurs in an economy 
has changed over time in absolute 
terms, while the ease of doing business 
ranking can show only how much the 
regulatory environment has changed 
relative to that in other economies. 
DISTANCE TO FRONTIER 
The distance to frontier score cap-tures 
the gap between an economy’s 
performance and a measure of best 
practice across the entire sample of 31 
indicators for 10 Doing Business topics 
(the labor market regulation indicators 
are excluded). For starting a business, 
for example, Canada and New Zealand 
have the smallest number of proce-dures 
required (1), and New Zealand the 
shortest time to fulfill them (0.5 days). 
Slovenia has the lowest cost (0.0), 
and Australia, Colombia and 110 other 
economies have no paid-in minimum 
capital requirement (table 15.1). 
Calculation of the distance to 
frontier score 
Calculating the distance to frontier 
score for each economy involves 2 
main steps. First, individual component 
indicators are normalized to a common 
unit where each of the 31 component 
indicators y (except for the total tax 
rate) is rescaled using the linear trans-formation 
(worst − y)/(worst − frontier). 
In this formulation the frontier repre-sents 
the best performance on the indi-cator 
across all economies since 2005 
or the third year in which data for the 
indicator were collected. For legal indi-cators 
such as those on getting credit 
or protecting minority investors, the 
frontier is set at the highest possible 
value. For the total tax rate, consistent 
with the use of a threshold in calculat-ing 
the rankings on this indicator, the 
frontier is defined as the total tax rate 
at the 15th percentile of the overall 
distribution for all years included in the 
analysis. For the time to pay taxes the 
frontier is defined as the lowest time 
recorded among all economies that 
levy the 3 major taxes: profit tax, labor 
taxes and mandatory contributions, 
and value added tax (VAT) or sales tax. 
In addition, the cost to export and cost 
to import for each year are divided by 
the GDP deflator, to take the general 
price level into account when bench-marking 
these absolute-cost indica-tors 
across economies with different 
inflation trends. The base year for the 
deflator is 2013 for all economies. 
In the same formulation, to mitigate 
the effects of extreme outliers in the
DISTANCE TO FRONTIER AND EASE OF DOING BUSINESS RANKING 147 
distributions of the rescaled data for 
most component indicators (very few 
economies need 700 days to complete 
the procedures to start a business, but 
many need 9 days), the worst perfor-mance 
is calculated after the removal 
of outliers. The definition of outliers 
is based on the distribution for each 
component indicator. To simplify the 
process, 2 rules were defined: the 95th 
percentile is used for the indicators 
with the most dispersed distributions 
(including time, cost, minimum capital 
and number of payments to pay taxes), 
and the 99th percentile is used for 
number of procedures and number of 
documents to trade. No outlier was re-moved 
for component indicators bound 
by definition or construction, including 
legal index scores (such as the depth 
of credit information index, extent of 
conflict of interest regulation index and 
strength of insolvency framework in-dex) 
and the recovery rate (figure 15.1). 
Second, for each economy the scores 
obtained for individual indicators are 
aggregated through simple averaging 
into one distance to frontier score, first 
for each topic and then across all 10 
topics: starting a business, dealing with 
construction permits, getting electric-ity, 
registering property, getting credit, 
protecting minority investors, paying 
taxes, trading across borders, enforc-ing 
contracts and resolving insolvency. 
More complex aggregation methods— 
such as principal components and un-observed 
components—yield a ranking 
nearly identical to the simple average 
used by Doing Business.1 Thus Doing 
Business uses the simplest method: 
weighting all topics equally and, within 
each topic, giving equal weight to each 
of the topic components.2 
An economy’s distance to frontier 
score is indicated on a scale from 0 to 
100, where 0 represents the worst per-formance 
and 100 the frontier. All dis-tance 
to frontier calculations are based 
on a maximum of 5 decimals. However, 
indicator ranking calculations and the 
TABLE 15.1 What is the frontier in regulatory practice? 
Topic and indicator Who sets the frontier Frontier 
Worst 
performance 
Starting a business 
Procedures (number) Canada; New Zealand 1 18a 
Time (days) New Zealand 0.5 100b 
Cost (% of income per capita) Slovenia 0.0 200.0b 
Minimum capital (% of income per capita) Australia; Colombiac 0.0 400.0b 
Dealing with construction permits 
Procedures (number) Hong Kong SAR, China 5 30a 
Time (days) Singapore 26 373b 
Cost (% of warehouse value) Qatar 0.0 20.0b 
Getting electricity 
Procedures (number) Germany; Korea, Rep.d 3 9a 
Time (days) Korea, Rep. 18 248b 
Cost (% of income per capita) Japan 0.0 8,100.0b 
Registering property 
Procedures (number) Georgia; Norway; 
Portugal; Sweden 
1 13a 
Time (days) Georgia; New Zealand; 
Portugal 
1 210b 
Cost (% of property value) Saudi Arabia 0.0 15.0b 
Getting credit 
Strength of legal rights index (0–12) Colombia; Montenegro; 
New Zealand 
12 0e 
Depth of credit information index (0–8) Ecuador; United 
Kingdomf 
8 0e 
Protecting minority investors 
Extent of conflict of interest regulation index 
(0–10) 
No economy has 
attained the frontier yet. 
10 0e 
Extent of shareholder governance index (0–10) No economy has 
attained the frontier yet. 
10 0e 
Paying taxes 
Payments (number per year) Hong Kong SAR, China; 
Saudi Arabia 
3 63b 
Time (hours per year) Singapore 49g 696b 
Total tax rate (% of profit) Singapore 26.1h 84.0b 
Trading across borders 
Documents to export (number) France; Ireland 2 11a 
Time to export (days) Denmark; Estonia; 
Singapore 
6 54b 
Cost to export (US$ per container), deflated Timor-Leste 410.0 5,000.0b 
Documents to import (number) France; Ireland 2 15a 
Time to import (days) Singapore 4 66b 
Cost to import (US$ per container), deflated Singapore 368.4 6,000.0b 
(continued)
148 DOING BUSINESS 2015 
ease of doing business ranking calcu-lations 
are based on 2 decimals. 
The difference between an economy’s 
distance to frontier score in any 
previous year and its score in 2014 
illustrates the extent to which the 
economy has closed the gap to the 
regulatory frontier over time. And in 
any given year the score measures 
how far an economy is from the best 
performance at that time. 
Treatment of the total tax rate 
This year, for the first time, the total 
tax rate component of the paying 
taxes indicator set enters the distance 
to frontier calculation in a different 
way than any other indicator. The 
distance to frontier score obtained for 
the total tax rate is transformed in a 
nonlinear fashion before it enters the 
distance to frontier score for paying 
taxes. As a result of the nonlinear 
transformation, an increase in the 
total tax rate has a smaller impact on 
the distance to frontier score for the 
total tax rate—and therefore on the 
distance to frontier score for paying 
taxes—for economies with a below-average 
total tax rate than it would 
have in the calculation done in previ-ous 
years (line B is smaller than line A 
in figure 15.2). And for economies with 
an extreme total tax rate (a rate that 
is very high relative to the average), an 
increase has a greater impact on both 
these distance to frontier scores than 
before (line D is bigger than line C in 
figure 15.2). 
The nonlinear transformation is not 
based on any economic theory of an 
“optimal tax rate” that minimizes dis-tortions 
or maximizes efficiency in an 
economy’s overall tax system. Instead, 
it is mainly empirical in nature. The 
nonlinear transformation along with 
the threshold reduces the bias in the 
indicator toward economies that do 
not need to levy significant taxes on 
companies like the Doing Business 
standardized case study company 
because they raise public revenue in 
other ways—for example, through 
taxes on foreign companies, through 
taxes on sectors other than manufac-turing 
or from natural resources (all 
of which are outside the scope of the 
methodology). In addition, it acknowl-edges 
the need of economies to collect 
taxes from firms. 
Calculation of scores for 
economies with 2 cities covered 
For each of the 11 economies for which 
a second city was added in this year’s 
report, the distance to frontier score is 
calculated as the population-weighted 
average of the distance to frontier 
scores for the 2 cities covered (table 
15.2). This is done for the aggregate 
score, the score for each topic and the 
scores for all the component indicators 
for each topic. 
TABLE 15.1 What is the frontier in regulatory practice? (continued) 
Topic and indicator Who sets the frontier Frontier 
Worst 
performance 
Enforcing contracts 
Procedures (number) Singapore 21 53a 
Time (days) Singapore 120 1,340b 
Cost (% of claim) Bhutan 0.1 89.0b 
Resolving insolvency 
Recovery rate (cents on the dollar) Japan 92.9 0.0e 
Strength of insolvency framework index (0–16) No economy has 
attained the frontier yet. 
16 0e 
a. Worst performance is defined as the 99th percentile among all economies in the Doing Business sample. 
b. Worst performance is defined as the 95th percentile among all economies in the Doing Business sample. 
c. One hundred and ten other economies also have a minimum capital requirement of 0.0. 
d. In 11 other economies it also takes only 3 procedures to get an electricity connection. 
e. Worst performance refers to the worst value recorded. 
f. Twenty-two other economies also score 8 on the depth of credit information index. 
g. Defined as the lowest time recorded among all economies in the Doing Business sample that levy the 3 major taxes: profit 
tax, labor taxes and mandatory contributions, and VAT or sales tax. 
h. Defined as the highest total tax rate among the 15% of economies with the lowest total tax rate in the Doing Business sample. 
Source: Doing Business database. 
TABLE 15.2 Weights used in calculating 
the distance to frontier scores for 
economies with 2 cities covered 
Economy City 
Weight 
(%) 
Bangladesh Dhaka 78 
Chittagong 22 
Brazil São Paulo 61 
Rio de Janeiro 39 
China Shanghai 55 
Beijing 45 
India Mumbai 47 
Delhi 53 
Indonesia Jakarta 78 
Surabaya 22 
Japan Tokyo 65 
Osaka 35 
Mexico Mexico City 83 
Monterrey 17 
Nigeria Lagos 77 
Kano 23 
Pakistan Karachi 65 
Lahore 35 
Russian 
Federation 
Moscow 70 
St. Petersburg 30 
United States New York 60 
Los Angeles 40 
Source: United Nations, Department of Economic and 
Social Affairs, Population Division, World Urbanization 
Prospects, 2014 Revision, “File 12: Population of Urban 
Agglomerations with 300,000 Inhabitants or More in 
2014, by Country, 1950–2030 (thousands),” http://esa 
.un.org/unpd/wup/CD-ROM/Default.aspx.
DISTANCE TO FRONTIER AND EASE OF DOING BUSINESS RANKING 149 
Variability of economies’ 
scores across topics 
Each indicator set measures a differ-ent 
aspect of the business regulatory 
environment. The distance to frontier 
scores and associated rankings of an 
economy can vary, sometimes signifi-cantly, 
across indicator sets. The aver-age 
correlation coefficient between the 
10 indicator sets included in the aggre-gate 
distance to frontier score is 0.37, 
and the coefficients between 2 sets of 
indicators range from 0.19 (between 
getting electricity and registering 
property) to 0.60 (between protecting 
minority investors and resolving insol-vency). 
These correlations suggest that 
economies rarely score universally well 
or universally badly on the indicators 
(table 15.3). 
Consider the example of Portugal. Its 
aggregate distance to frontier score is 
76.03. Its score is 96.27 for starting a 
business and 85.20 for trading across 
borders. But its score is only 59.17 for 
protecting minority investors and 45.00 
for getting credit. 
Figure 2.1 in the chapter “About Doing 
Business” illustrates the degree of vari-ability 
for each economy’s performance 
across the different areas of business 
regulation covered by Doing Business. 
The figure draws attention to econo-mies 
with a particularly uneven perfor-mance 
by showing, for each economy, 
the distance between the average of its 
highest 3 distance to frontier scores and 
the average of its lowest 3 across the 10 
topics included in this year’s aggregate 
distance to frontier score. While a rela-tively 
small distance between these 2 
averages suggests a broadly consistent 
approach across the areas of business 
regulation measured by Doing Business, 
a relatively large distance suggests a 
more uneven approach, with greater 
room for improvement in some areas 
than in others. 
Variation in performance across the 
indicator sets is not at all unusual. It 
FIGURE 15.1 How are distance to frontier scores calculated for indicators? 
Two examples 
A time-and-motion topic: dealing with construction permits 
Distance to frontier 
score for procedures 
Best performance 
(frontier): 
10 points 
Worst performance: 
0 points 
Regulatory frontier 
Regulatory frontier 
0 1 2 3 4 5 6 7 8 9 10 
reflects differences in the degree of 
priority that government authorities 
give to particular areas of business 
regulation reform and in the ability 
of different government agencies to 
deliver tangible results in their area of 
responsibility. 
Worst 
performance 
(99th percentile): 
30 procedures 
Best performance 
(frontier): 
5 procedures 
Economies that improved the 
most across 3 or more Doing 
Business topics in 2013/14 
Doing Business 2015 uses a simple 
method to calculate which economies 
improved the ease of doing business 
the most. First, it selects the economies 
100 
80 
60 
40 
20 
0 
0 5 10 15 20 25 30 35 
A legal topic: protecting minority investors 
100 
80 
60 
40 
20 
0 
Procedures (number) 
Distance to frontier score for extent 
of shareholder governance index 
Extent of shareholder governance index (0–10) 
Source: Doing Business database.
150 DOING BUSINESS 2015 
that in 2013/14 implemented regulatory 
reforms making it easier to do business 
in 3 or more of the 10 topics included 
in this year’s aggregate distance to 
frontier score.3 Twenty-one economies 
meet this criterion: Azerbaijan; Benin; 
the Democratic Republic of Congo; 
Côte d’Ivoire; the Czech Republic; 
Regulatory frontier 
Greece; India; Ireland; Kazakhstan; 
Lithuania; the former Yugoslav Republic 
of Macedonia; Poland; Senegal; the 
Seychelles; Spain; Switzerland; Taiwan, 
China; Tajikistan; Togo; Trinidad and 
Tobago; and the United Arab Emirates. 
Second, Doing Business sorts these 
economies on the increase in their 
distance to frontier score from the pre-vious 
year using comparable data. 
Selecting the economies that 
implemented regulatory reforms in 
at least 3 topics and had the biggest 
improvements in their distance to 
frontier scores is intended to highlight 
economies with ongoing, broad-based 
reform programs. The improvement in 
the distance to frontier score is used 
to identify the top improvers because 
this allows a focus on the absolute 
improvement—in contrast with the rela-tive 
improvement shown by a change in 
rankings—that economies have made 
in their regulatory environment for 
business. 
EASE OF DOING BUSINESS 
RANKING 
The ease of doing business ranking 
ranges from 1 to 189. The ranking of 
economies is determined by sorting the 
aggregate distance to frontier scores, 
rounded to 2 decimals. 
FIGURE 15.2 How the nonlinear transformation affects the distance to frontier score 
for the total tax rate 
Total tax rate (%) 
Distance to frontier score 
for total tax rate 
0 10 20 30 40 50 60 70 80 90 100 
100 
80 
60 
40 
20 
0 
A 
B 
C 
D 
Linear distance to frontier 
score for total tax rate 
Nonlinear distance to frontier 
score for total tax rate 
Note: The nonlinear distance to frontier score for the total tax rate is equal to the distance to frontier score for the 
total tax rate to the power of 0.8. 
Source: Doing Business database. 
TABLE 15.3 Correlations between economy distance to frontier scores for Doing Business topics 
Dealing with 
construction 
permits 
Getting 
electricity 
Registering 
property 
Getting 
credit 
Protecting 
minority 
investors 
Paying 
taxes 
Trading 
across 
borders 
Enforcing 
contracts 
Resolving 
insolvency 
Starting a business 0.29 0.28 0.35 0.44 0.48 0.51 0.43 0.43 0.48 
Dealing with 
construction permits 0.33 0.31 0.21 0.23 0.35 0.34 0.27 0.22 
Getting electricity 0.19 0.23 0.20 0.41 0.53 0.29 0.31 
Registering property 0.42 0.45 0.37 0.20 0.49 0.40 
Getting credit 0.51 0.27 0.32 0.38 0.56 
Protecting minority 
investors 0.37 0.35 0.37 0.60 
Paying taxes 0.42 0.33 0.35 
Trading across 
borders 0.28 0.49 
Enforcing contracts 0.48 
Source: Doing Business database.
DISTANCE TO FRONTIER AND EASE OF DOING BUSINESS RANKING 151 
NOTES 
1. See Djankov, Manraj and others (2005). 
Principal components and unobserved 
components methods yield a ranking nearly 
identical to that from the simple average 
method because both these methods assign 
roughly equal weights to the topics, since 
the pairwise correlations among indicators 
do not differ much. An alternative to the 
simple average method is to give different 
weights to the topics, depending on which 
are considered of more or less importance in 
the context of a specific economy. 
2. For getting credit, indicators are weighted 
proportionally, according to their 
contribution to the total score, with a 
weight of 60% assigned to the strength of 
legal rights index and 40% to the depth of 
credit information index. Indicators for all 
other topics are assigned equal weights. 
3. Changes making it more difficult to do 
business are subtracted from the total 
number of those making it easier to do 
business.
Doing Business 2015 
Going Beyond Efficiency 
Summaries of Doing Business 
reforms in 2013/14 
Doing Business reforms affecting all 
sets of indicators included in this year’s 
report, implemented from June 2013 to 
June 2014. 
 Reform making it easier to do busi-ness 
 Change making it more difficult to do 
business 
Afghanistan 
 Starting a business 
Afghanistan made starting a busi-ness 
more difficult by increasing the 
publication fees and prolonging the 
time required for registration. 
Albania 
 Starting a business 
Albania made starting a business 
easier by lowering registration fees. 
 Dealing with construction permits 
Albania made dealing with construc-tion 
permits easier by resuming the 
issuance of construction permits 
and by consolidating the land permit 
and construction permit into a single 
construction development permit. 
 Registering property 
Albania made transferring property 
easier by establishing effective time 
limits and computerizing the records 
on immovable property. 
 Getting credit 
Albania weakened its secured trans-actions 
system through an amend-ment 
to the Securing Charges Law 
that does not allow intangible assets 
to be secured with a nonpossessory 
pledge. 
 Paying taxes 
Albania made paying taxes more 
costly for companies by increasing 
the corporate income tax rate. 
Algeria 
 Trading across borders 
Algeria made trading across borders 
easier by upgrading infrastructure at 
the port of Algiers. 
Argentina 
 Dealing with construction permits 
Argentina made dealing with con-struction 
permits more costly by 
increasing several fees. 
Armenia 
 Starting a business 
Armenia made starting a business 
easier by streamlining postregistra-tion 
procedures. 
Austria 
 Starting a business 
Austria made starting a business 
easier by reducing the minimum 
capital requirement, which in turn 
reduced the paid-in minimum capital 
Reforms affecting the labor market regulation indicators are included here but do not affect the ranking on the ease of 
doing business.
SUMMARIES OF DOING BUSINESS REFORMS IN 2013/14 153 
requirement, and by lowering notary 
fees. 
Azerbaijan 
 Starting a business 
Azerbaijan made starting a business 
easier by reducing the time to obtain 
an electronic signature for online tax 
registration. 
 Registering property 
Azerbaijan made transferring prop-erty 
easier by introducing an online 
procedure for obtaining the nonen-cumbrance 
certificate. 
 Paying taxes 
Azerbaijan made paying taxes eas-ier 
for companies by introducing an 
electronic system for filing and pay-ing 
social insurance contributions. 
Bahamas, The 
 Dealing with construction permits 
The Bahamas made dealing with 
construction permits more costly by 
increasing the building permit fees. 
 Enforcing contracts 
The Bahamas made enforcing 
contracts easier by introducing new 
rules of civil procedure focused on 
streamlining and simplifying court 
proceedings and ensuring less costly 
resolution of disputes. 
Bahrain 
 Registering property 
Bahrain made registering property 
easier by reducing the registration 
fee. 
 Getting credit 
Bahrain improved access to credit 
information by approving the credit 
bureau’s collection of data on firms. 
Bangladesh 
 Trading across borders 
Bangladesh made trading across 
borders easier by introducing a 
fully automated, computerized 
customs data management system, 
ASYCUDA (Automated System for 
Customs Data) World. This reform 
applies to both Chittagong and 
Dhaka. 
Belarus 
 Paying taxes 
Belarus made paying taxes easier 
for companies by introducing an 
electronic system for filing and pay-ing 
contributions for the obligatory 
insurance for work accidents—and 
by simplifying the filing require-ments 
for corporate income tax and 
value added tax (VAT). On the other 
hand, it increased the ecological tax 
rate and made bad debt provisions 
nondeductible for purposes of the 
corporate income tax. 
Belgium 
 Resolving insolvency 
Belgium made resolving insolvency 
more difficult by establishing addi-tional 
requirements for commencing 
reorganization proceedings, includ-ing 
the submission of documents 
verified by external parties. 
Labor market regulation 
Belgium increased the notice period 
for redundancy dismissals. 
Benin 
 Starting a business 
Benin made starting a business 
easier by reducing the minimum 
capital requirement and the fees to 
be paid at the one-stop shop. 
 Protecting minority investors 
Benin strengthened minority in-vestor 
protections by introducing 
greater requirements for disclosure 
of related-party transactions to the 
board of directors and by making it 
possible for shareholders to inspect 
the documents pertaining to related-party 
transactions and to appoint 
auditors to conduct an inspection of 
such transactions. 
 Trading across borders 
Benin made trading across borders 
easier by reducing the number of 
documents needed for imports. 
 Enforcing contracts 
Benin made enforcing contracts 
easier by creating a commercial sec-tion 
within its court of first instance. 
Bolivia 
 Trading across borders 
Bolivia made trading across borders 
more difficult by increasing customs 
clearance time. 
Brunei Darussalam 
 Dealing with construction permits 
Brunei Darussalam made dealing 
with construction permits easier by 
consolidating final inspections. 
 Paying taxes 
Brunei Darussalam made paying 
taxes easier for companies by al-lowing 
joint filing and payment of 
supplemental contributory pen-sion 
and employee provident fund 
contributions and by introducing 
an online system for paying these 2 
contributions. 
Bulgaria 
 Starting a business 
Bulgaria made starting a business 
easier by lowering registration fees. 
Burkina Faso 
 Protecting minority investors 
Burkina Faso strengthened minority 
investor protections by introducing 
greater requirements for disclosure 
of related-party transactions to the 
board of directors and by making it 
possible for shareholders to inspect 
the documents pertaining to related-party 
transactions and to appoint 
auditors to conduct an inspection of 
such transactions.
154 DOING BUSINESS 2015 
Cabo Verde 
 Getting credit 
Cabo Verde improved its credit infor-mation 
system by adopting a new 
law providing for the establishment 
of credit bureaus. 
Labor market regulation 
Cabo Verde introduced a minimum 
wage. 
Cameroon 
 Getting credit 
Cameroon improved its credit 
information system by passing 
regulations that provide for the 
establishment and operation of a 
credit registry database. 
 Protecting minority investors 
Cameroon strengthened minority 
investor protections by introducing 
greater requirements for disclosure 
of related-party transactions to the 
board of directors and by making it 
possible for shareholders to inspect 
the documents pertaining to related-party 
transactions and to appoint 
auditors to conduct an inspection of 
such transactions. 
Central African Republic 
 Protecting minority investors 
The Central African Republic 
strengthened minority investor pro-tections 
by introducing greater re-quirements 
for disclosure of related-party 
transactions to the board of 
directors and by making it possible 
for shareholders to inspect the docu-ments 
pertaining to related-party 
transactions and to appoint auditors 
to conduct an inspection of such 
transactions. 
 Trading across borders 
The Central African Republic made 
trading across borders more difficult 
by increasing border checks and 
security controls at the border post 
with Cameroon. 
Chad 
 Protecting minority investors 
Chad strengthened minority inves-tor 
protections by introducing 
greater requirements for disclosure 
of related-party transactions to the 
board of directors and by making it 
possible for shareholders to inspect 
the documents pertaining to related-party 
transactions and to appoint 
auditors to conduct an inspection of 
such transactions. 
China 
 Starting a business 
China made starting a business eas-ier 
by eliminating both the minimum 
capital requirement and the require-ment 
to obtain a capital verification 
report from an auditing firm. This 
reform applies to both Beijing and 
Shanghai. 
 Paying taxes 
China made paying taxes easier for 
companies by enhancing the elec-tronic 
system for filing and paying 
taxes and adopting new communi-cation 
channels within its taxpayer 
service, changes applying to both 
Beijing and Shanghai. In addition, 
China made paying taxes less costly 
for companies in Shanghai by reduc-ing 
the social security contribution 
rate. 
Colombia 
 Registering property 
Colombia made transferring prop-erty 
easier by eliminating the need 
for a provisional registration. 
 Getting credit 
Colombia improved access to credit 
by adopting a new secured transac-tions 
law that establishes a func-tional 
approach to secured transac-tions 
and a centralized, notice-based 
collateral registry. The law broadens 
the range of assets that can be 
used as collateral, allows a general 
description of assets granted as col-lateral, 
establishes clear priority rules 
inside bankruptcy for secured credi-tors, 
sets out grounds for relief from 
a stay of enforcement actions by 
secured creditors during reorganiza-tion 
procedures and allows out-of-court 
enforcement of collateral. 
 Paying taxes 
Colombia made paying taxes more 
complicated for companies by in-troducing 
a new profit tax (CREE), 
though it also reduced the corporate 
income tax rate and payroll taxes. 
Comoros 
 Protecting minority investors 
The Comoros strengthened minority 
investor protections by introducing 
greater requirements for disclosure 
of related-party transactions to the 
board of directors and by making it 
possible for shareholders to inspect 
the documents pertaining to related-party 
transactions and to appoint 
auditors to conduct an inspection of 
such transactions. 
Congo, Dem. Rep. 
 Starting a business 
The Democratic Republic of Congo 
made starting a business easier by 
creating a one-stop shop. 
 Dealing with construction permits 
The Democratic Republic of Congo 
made dealing with construction 
permits more costly by increasing 
the building permit fee. 
 Getting electricity 
In the Democratic Republic of Congo 
the utility in Kinshasa made getting 
electricity easier by reducing the 
number of approvals required for 
new connections and reducing the 
burden of the security deposit. 
 Getting credit 
The Democratic Republic of Congo 
improved access to credit informa-tion 
by establishing a credit registry.
SUMMARIES OF DOING BUSINESS REFORMS IN 2013/14 155 
 Protecting minority investors 
The Democratic Republic of Congo 
strengthened minority investor pro-tections 
by introducing greater re-quirements 
for disclosure of related-party 
transactions to the board of 
directors and by making it possible 
for shareholders to inspect the docu-ments 
pertaining to related-party 
transactions and to appoint auditors 
to conduct an inspection of such 
transactions. 
 Paying taxes 
The Democratic Republic of Congo 
made paying taxes easier for com-panies 
by simplifying corporate 
income tax returns and abolishing 
the minimum tax payable depending 
on a company’s size. On the other 
hand, it increased the rate for the 
minimum lump-sum tax applied to 
annual revenue. 
Congo, Rep. 
 Protecting minority investors 
The Republic of Congo strengthened 
minority investor protections by 
introducing greater requirements for 
disclosure of related-party transac-tions 
to the board of directors and by 
making it possible for shareholders 
to inspect the documents pertaining 
to related-party transactions and 
to appoint auditors to conduct an 
inspection of such transactions. 
 Paying taxes 
The Republic of Congo made paying 
taxes easier for companies by reduc-ing 
the corporate income tax rate and 
by abolishing the tax on the rental 
value of business premises and the 
tax on company-owned cars. 
Costa Rica 
 Getting electricity 
Costa Rica reduced the time required 
for getting electricity by improving 
the coordination between different 
departments at the utility. 
 Paying taxes 
Costa Rica made paying taxes easier 
for companies by implementing an 
electronic system for filing corporate 
income tax and VAT. 
Côte d’Ivoire 
 Starting a business 
Côte d’Ivoire made starting a busi-ness 
easier by reducing the mini-mum 
capital requirement, lowering 
registration fees and enabling the 
one-stop shop to publish notices of 
incorporation. 
 Registering property 
Côte d’Ivoire made transferring 
property easier by digitizing its land 
registry system and lowering the 
property registration tax. 
 Getting credit 
Côte d’Ivoire improved its credit 
information system by introducing 
regulations that govern the licensing 
and operation of credit bureaus. 
 Protecting minority investors 
Côte d’Ivoire strengthened minority 
investor protections by introducing 
greater requirements for disclosure 
of related-party transactions to the 
board of directors and by making it 
possible for shareholders to inspect 
the documents pertaining to related-party 
transactions and to appoint 
auditors to conduct an inspection of 
such transactions. 
 Trading across borders 
Côte d’Ivoire made trading across 
borders easier by simplifying the 
processes for producing the inspec-tion 
report and by reducing port and 
terminal handling charges at the 
port of Abidjan. 
Croatia 
 Starting a business 
Croatia made starting a business 
easier by reducing notary fees. 
 Dealing with construction permits 
Croatia made dealing with construc-tion 
permits easier by reducing the 
requirements and fees for building 
permits and carrying out the final 
building inspection more promptly. 
 Paying taxes 
Croatia made paying taxes more 
complicated for companies by rais-ing 
the health insurance contribu-tion 
rate, increasing the Croatian 
Chamber of Commerce fees and 
introducing more detailed filing 
requirements for VAT. On the other 
hand, it abolished the contribution to 
the Croatian Chamber of Commerce. 
 Trading across borders 
Croatia made trading across borders 
easier by implementing a new elec-tronic 
customs system. 
Labor market regulation 
Croatia lifted the 3-year limit on 
the duration of first-time fixed-term 
contracts. 
Cyprus 
 Getting credit 
Cyprus improved its credit informa-tion 
system by adopting a central 
bank directive eliminating the mini-mum 
threshold for loans to be in-cluded 
in credit bureaus’ databases. 
 Paying taxes 
Cyprus made paying taxes easier for 
companies by reducing the number 
of provisional tax installments for 
corporate income tax. 
Czech Republic 
 Starting a business 
The Czech Republic made starting 
a business easier by substantially 
reducing the minimum capital re-quirement 
and the paid-in minimum 
capital requirement. 
 Getting credit 
The Czech Republic improved access 
to credit by adopting a new legal 
regime on secured transactions that
156 DOING BUSINESS 2015 
allows the registration of receivables 
at the collateral registry and per-mits 
out-of-court enforcement of 
collateral. 
 Enforcing contracts 
The Czech Republic made enforcing 
contracts easier by amending its civil 
procedure code and modifying the 
monetary jurisdictions of its courts. 
Denmark 
 Starting a business 
Denmark made starting a business 
easier by reducing the paid-in mini-mum 
capital requirement. 
Djibouti 
 Dealing with construction permits 
Djibouti made dealing with construc-tion 
permits less time-consuming by 
streamlining the review process for 
building permits. 
Dominican Republic 
 Dealing with construction permits 
The Dominican Republic made deal-ing 
with construction permits more 
costly by increasing the building 
permit fees. 
 Getting credit 
The Dominican Republic improved 
its credit information system by 
enacting a new law regulating the 
protection of personal data and 
the operation of credit reporting 
institutions. 
 Protecting minority investors 
The Dominican Republic strength-ened 
minority investor protections 
by introducing greater shareholder 
rights and requirements for greater 
corporate transparency. 
 Trading across borders 
The Dominican Republic made trad-ing 
across borders easier by reducing 
the number of documents required 
for exports and imports. 
Ecuador 
 Protecting minority investors 
Ecuador strengthened minority 
investor protections by introducing 
greater requirements for disclosure 
of related-party transactions as well 
as a requirement that a potential 
acquirer make a tender offer to all 
shareholders upon acquiring voting 
shares. 
 Trading across borders 
Ecuador made trading across bor-ders 
easier by upgrading to a new 
electronic data interchange system 
called ECUAPASS. 
Egypt, Arab Rep. 
 Protecting minority investors 
The Arab Republic of Egypt strength-ened 
minority investor protections 
by introducing additional require-ments 
for approval of related-party 
transactions and greater require-ments 
for disclosure of such trans-actions 
to the stock exchange. 
Equatorial Guinea 
 Protecting minority investors 
Equatorial Guinea strengthened 
minority investor protections by 
introducing greater requirements for 
disclosure of related-party transac-tions 
to the board of directors and by 
making it possible for shareholders 
to inspect the documents pertaining 
to related-party transactions and 
to appoint auditors to conduct an 
inspection of such transactions. 
Finland 
Labor market regulation 
Finland eliminated the requirement 
to notify a third party before dis-missing 
a redundant employee or 
group of redundant employees. 
France 
 Starting a business 
France made starting a business 
easier by reducing the time it takes 
to register a company at the one-stop 
shop (Centre de Formalités des 
Entreprises). 
Labor market regulation 
France substantially amended its la-bor 
market regulations, including the 
provisions dealing with large-scale 
collective redundancy processes. 
Gabon 
 Registering property 
Gabon made transferring property 
more costly by increasing the prop-erty 
registration tax rate. 
 Protecting minority investors 
Gabon strengthened minority in-vestor 
protections by introducing 
greater requirements for disclosure 
of related-party transactions to the 
board of directors and by making it 
possible for shareholders to inspect 
the documents pertaining to related-party 
transactions and to appoint 
auditors to conduct an inspection of 
such transactions. 
 Paying taxes 
Gabon made paying taxes easier for 
companies by introducing an elec-tronic 
system for filing and paying 
VAT. 
Gambia, The 
 Starting a business 
The Gambia made starting a busi-ness 
easier by eliminating the re-quirement 
to pay stamp duty. 
 Protecting minority investors 
The Gambia strengthened minority 
investor protections by clarifying the 
duties of directors and providing new 
venues and remedies for minority 
shareholders seeking redress for op-pressive 
conduct. 
Georgia 
Labor market regulation 
Georgia reduced the maximum 
duration of fixed-term contracts
SUMMARIES OF DOING BUSINESS REFORMS IN 2013/14 157 
and introduced a notice period for 
redundancy dismissals. 
Germany 
 Starting a business 
Germany made starting a business 
more difficult by increasing notary 
fees. 
 Registering property 
Germany made transferring prop-erty 
more costly by increasing the 
property transfer tax rate. 
Ghana 
 Dealing with construction permits 
Ghana made dealing with construc-tion 
permits less time-consuming by 
streamlining the process to obtain a 
building permit. 
 Trading across borders 
Ghana made trading across borders 
easier by upgrading infrastructure at 
the port of Tema. 
Greece 
 Starting a business 
Greece made starting a business 
easier by lowering registration costs. 
 Registering property 
Greece made transferring prop-erty 
easier by reducing the property 
transfer tax rate and eliminating 
the requirement for a municipal tax 
clearance certificate. 
 Enforcing contracts 
Greece made enforcing contracts 
easier by introducing an electronic 
filing system for court users. 
Guatemala 
 Starting a business 
Guatemala made starting a business 
easier by eliminating certain registra-tion 
fees and reducing the time to 
publish a notice of incorporation. 
 Paying taxes 
Guatemala made paying taxes eas-ier 
and less costly for companies by 
enhancing the electronic system for 
filing and paying corporate income 
tax and VAT and by reducing the 
capital gains and corporate income 
tax rates. On the other hand, it also 
made paying taxes more compli-cated 
by introducing a new form for 
capital gains tax. 
Guinea 
 Registering property 
Guinea made registering property 
easier by reorganizing the records 
at the land registry and reducing the 
notary fees. 
 Protecting minority investors 
Guinea strengthened minority investor 
protections by introducing greater 
requirements for disclosure of 
related-party transactions to the 
board of directors and by making it 
possible for shareholders to inspect 
the documents pertaining to related-party 
transactions and to appoint 
auditors to conduct an inspection of 
such transactions. 
Guinea-Bissau 
 Protecting minority investors 
Guinea-Bissau strengthened minority 
investor protections by introducing 
greater requirements for disclosure 
of related-party transactions to the 
board of directors and by making it 
possible for shareholders to inspect 
the documents pertaining to related-party 
transactions and to appoint 
auditors to conduct an inspection of 
such transactions. 
Honduras 
 Dealing with construction permits 
Honduras made dealing with con-struction 
permits more costly by 
increasing the building permit fees. 
Hong Kong SAR, China 
 Starting a business 
Hong Kong SAR, China, made start-ing 
a business more difficult by 
increasing the registration fee. 
 Protecting minority investors 
Hong Kong SAR, China, strength-ened 
minority investor protections 
by introducing requirements for 
directors to provide more detailed 
disclosure of conflicts of interest to 
the other board members. 
Hungary 
 Starting a business 
Hungary made starting a business 
more difficult by increasing the paid-in 
minimum capital requirement. 
 Getting credit 
Hungary improved access to credit 
by adopting a new legal regime 
on secured transactions that 
implements a functional approach 
to secured transactions, extends se-curity 
interests to the products and 
proceeds of the original asset and 
establishes a modern, notice-based 
collateral registry. 
 Paying taxes 
Hungary made paying taxes easier 
and less costly for companies by 
abolishing the special tax that had 
been temporarily introduced in 2010 
and by reducing the vehicle tax rate. 
Iceland 
 Starting a business 
Iceland made starting a business 
easier by offering faster online 
procedures. 
 Registering property 
Iceland made transferring property 
more costly by increasing the stamp 
duty rate. 
India 
 Starting a business 
India made starting a business 
easier by considerably reducing the
158 DOING BUSINESS 2015 
registration fees, but also made it 
more difficult by introducing a re-quirement 
to file a declaration before 
the commencement of business 
operations. These changes apply to 
both Delhi and Mumbai. 
 Getting electricity 
In India the utility in Mumbai made 
getting electricity less costly by re-ducing 
the security deposit for a new 
connection. 
 Protecting minority investors 
India strengthened minority inves-tor 
protections by requiring greater 
disclosure of conflicts of interest 
by board members, increasing the 
remedies available in case of preju-dicial 
related-party transactions and 
introducing additional safeguards 
for shareholders of privately held 
companies. This reform applies to 
both Delhi and Mumbai. 
Indonesia 
 Starting a business 
Indonesia made starting a business 
easier by allowing the Ministry of 
Law and Human Rights to electroni-cally 
issue the approval letter for 
the deed of establishment. This 
reform applies to both Jakarta and 
Surabaya. 
 Getting electricity 
In Indonesia the electricity company 
in Jakarta made getting electric-ity 
easier by eliminating the need 
for electrical contractors to obtain 
multiple certificates guaranteeing 
the safety of internal installations— 
though it also increased the cost by 
introducing a security deposit for 
new connections. 
 Paying taxes 
Indonesia made paying taxes less 
costly for companies by reducing 
employers’ health insurance contri-bution 
rate. This reform applies to 
both Jakarta and Surabaya. 
 Trading across borders 
In Indonesia trading across borders 
became more difficult because of 
insufficient infrastructure at the 
Tanjung Priok Port Jakarta. This 
change applies to both Jakarta and 
Surabaya. 
Iran, Islamic Rep. 
 Starting a business 
The Islamic Republic of Iran made 
starting a business easier by stream-lining 
the name reservation and 
company registration procedures. 
 Getting electricity 
The Islamic Republic of Iran made 
getting electricity easier by eliminat-ing 
the need for customers to obtain 
an excavation permit for electricity 
connection works. 
Ireland 
 Registering property 
Ireland made transferring property 
easier by enhancing its computer-ized 
system at the land registry and 
implementing an online system for 
the registration of title. 
 Getting credit 
Ireland improved its credit informa-tion 
system by passing a new act 
that provides for the establishment 
and operation of a credit registry. 
 Enforcing contracts 
Ireland made enforcing contracts 
easier by modifying the monetary 
jurisdictions of its courts. 
Israel 
 Paying taxes 
Israel made paying taxes more 
costly for companies by increasing 
the profit tax rate. 
Italy 
 Starting a business 
Italy made starting a business eas-ier 
by reducing both the minimum 
capital requirement and the paid-in 
minimum capital requirement and by 
streamlining registration procedures. 
Labor market regulation 
Italy relaxed the conditions for using 
fixed-term contracts but reduced 
their maximum duration to 36 
months. 
Jamaica 
 Starting a business 
Jamaica made starting a business 
easier by consolidating forms, but 
also made it more time-consuming 
as a result of delays in the imple-mentation 
of the electronic interface 
with different agencies. 
 Getting electricity 
Jamaica made getting electricity 
less expensive by reducing the cost 
of external connection works. 
 Getting credit 
Jamaica improved access to credit 
by establishing credit bureaus and 
by adopting a new secured trans-actions 
law that implements a 
functional approach to secured 
transactions, broadens the range 
of assets that can be used as col-lateral, 
allows a general description 
of assets granted as collateral and 
establishes a modern, notice-based 
collateral registry. 
 Paying taxes 
Jamaica made paying taxes more 
costly for companies by introducing 
a new minimum business tax. 
Jordan 
 Trading across borders 
Jordan made trading across borders 
easier by improving infrastructure at 
the port of Aqaba. 
Kazakhstan 
 Registering property 
Kazakhstan made registering 
property easier by introducing ef-fective 
time limits and an expedited 
procedure.
SUMMARIES OF DOING BUSINESS REFORMS IN 2013/14 159 
 Paying taxes 
Kazakhstan made paying taxes 
more complicated for companies by 
introducing a mandatory contribu-tion 
to the National Chamber of 
Entrepreneurs and by increasing the 
vehicle and environmental taxes. 
 Trading across borders 
Kazakhstan made trading across 
borders easier by opening a new 
border station and railway link that 
helped reduce congestion at the 
border with China. 
 Enforcing contracts 
Kazakhstan made enforcing con-tracts 
easier by introducing an elec-tronic 
filing system for court users. 
 Resolving insolvency 
Kazakhstan made resolving insolven-cy 
easier by clarifying and simplifying 
provisions on liquidation and reorga-nization, 
introducing the concept of 
creditors’ meetings, expanding the 
rights of creditors during insolvency 
proceedings, authorizing payment in 
kind to secured creditors and clarify-ing 
the process for submitting credi-tors’ 
claims. 
Kenya 
 Dealing with construction permits 
Kenya made dealing with construc-tion 
permits more costly by increas-ing 
the building permit fees. 
 Getting credit 
Kenya improved its credit informa-tion 
system by passing legislation 
that allows the sharing of both posi-tive 
and negative credit information 
and establishes guidelines for the 
treatment of historical data. 
 Paying taxes 
Kenya made paying taxes more 
costly for companies by increasing 
employers’ social security contribu-tion 
rate. 
Kiribati 
 Paying taxes 
Kiribati made paying taxes more 
complicated for companies by intro-ducing 
VAT. 
Korea, Rep. 
 Registering property 
The Republic of Korea made trans-ferring 
property easier by reducing 
the time needed to buy housing 
bonds and to register the property 
transfer. 
 Protecting minority investors 
Korea strengthened minority inves-tor 
protections by increasing the 
level of transparency expected 
from companies on managerial 
compensation. 
Kosovo 
 Dealing with construction permits 
Kosovo made dealing with construc-tion 
permits easier by establishing a 
new phased inspection scheme and 
substantially reducing the building 
permit fee. 
 Registering property 
Kosovo made transferring property 
more difficult by increasing the fee 
for the registration of property 
transactions. 
 Enforcing contracts 
Kosovo made enforcing contracts 
easier by introducing a private bailiff 
system. 
Kuwait 
 Starting a business 
Kuwait made starting a business 
more difficult by increasing the com-mercial 
license fee. 
Lao PDR 
 Getting credit 
The Lao People’s Democratic Republic 
improved access to credit by 
implementing a modern, unified, 
notice-based collateral registry. 
 Protecting minority investors 
Lao PDR strengthened minority 
investor protections by introducing 
requirements for directors to dis-close 
in detail their conflicts of inter-est 
to the other board members and 
for companies to promptly disclose 
related-party transactions to the 
Securities Commission and to in-clude 
the information in their annual 
reports. 
Latvia 
 Starting a business 
Latvia made starting a business 
more difficult by increasing registra-tion 
fees, bank fees and notary fees. 
 Paying taxes 
Latvia made paying taxes easier for 
companies by simplifying the VAT 
return, enhancing the electronic 
system for filing corporate income 
tax returns and reducing employers’ 
social security contribution rate. 
Lithuania 
 Starting a business 
Lithuania made starting a business 
easier by eliminating the need to 
have a company seal and speeding 
up the VAT registration at the State 
Tax Inspectorate. 
 Dealing with construction permits 
Lithuania made dealing with con-struction 
permits easier by reducing 
the time required for processing 
building permit applications. 
 Enforcing contracts 
Lithuania made enforcing contracts 
easier by introducing an electronic 
filing system for court users. 
Macedonia, FYR 
 Starting a business 
The former Yugoslav Republic of 
Macedonia made starting a business
160 DOING BUSINESS 2015 
easier by making online registration 
free of charge. 
 Protecting minority investors 
FYR Macedonia strengthened minor-ity 
investor protections by requiring 
prior review of related-party trans-actions 
by an external auditor. 
 Resolving insolvency 
FYR Macedonia made resolving 
insolvency easier by establishing a 
framework for electronic auctions 
of debtors’ assets, streamlining and 
tightening the time frames for insol-vency 
proceedings and the appeals 
process and establishing a frame-work 
for out-of-court restructurings. 
Madagascar 
 Dealing with construction permits 
Madagascar made dealing with con-struction 
permits easier by reducing 
the time needed to obtain a building 
permit. 
Malawi 
 Starting a business 
Malawi made starting a business 
easier by streamlining company 
name search and registration and by 
eliminating the requirement for in-spection 
of company premises before 
issuance of a business license. 
 Getting electricity 
Malawi reduced the time required 
to get electricity by engaging sub-contractors 
to carry out external 
connection works. 
Mali 
 Dealing with construction permits 
Mali made dealing with construction 
permits easier by reducing the time 
needed to obtain a geotechnical 
study. 
 Protecting minority investors 
Mali strengthened minority investor 
protections by introducing greater 
requirements for disclosure of 
related-party transactions to the 
board of directors and by making it 
possible for shareholders to inspect 
the documents pertaining to related-party 
transactions and to appoint 
auditors to conduct an inspection of 
such transactions. 
Malta 
 Starting a business 
Malta made starting a business 
easier by creating an electronic link 
between the Registrar of Companies 
and the Inland Revenue Department 
to facilitate issuance of a tax identi-fication 
number. 
Mauritania 
 Starting a business 
Mauritania made starting a busi-ness 
easier by creating a one-stop 
shop and eliminating the publication 
requirement and the fee to obtain a 
tax identification number. 
 Getting credit 
Mauritania improved its credit 
information system by lowering the 
minimum threshold for loans to be 
included in the registry’s database. 
Mauritius 
 Starting a business 
Mauritius made starting a business 
easier by reducing trade license fees. 
 Enforcing contracts 
Mauritius made enforcing contracts 
easier by introducing an electronic 
filing system for court users. 
Labor market regulation 
Mauritius reduced the maximum 
duration of fixed-term contracts. 
Mexico 
 Getting credit 
Mexico improved access to credit by 
amending its insolvency proceedings 
law and establishing clear grounds 
for relief from a stay of enforcement 
actions by secured creditors dur-ing 
reorganization procedures. This 
reform applies to both Mexico City 
and Monterrey. 
 Resolving insolvency 
Mexico made resolving insolvency 
easier by clarifying several rules, 
shortening the time extensions 
allowed during reorganization, facili-tating 
the electronic submission of 
documents and improving the legal 
rights of creditors and other parties 
involved in bankruptcy procedures. 
This reform applies to both Mexico 
City and Monterrey. 
Moldova 
 Starting a business 
Moldova made starting a business 
easier by abolishing the minimum 
capital requirement. 
 Paying taxes 
Moldova made paying taxes easier 
for companies by introducing an 
electronic system for filing and pay-ing 
social security contributions. 
On the other hand, it increased the 
minimum salary used for calculat-ing 
the environmental tax liability. 
Furthermore, Moldova increased the 
employers’ health insurance contri-bution 
rate and introduced new filing 
requirements for VAT. 
Mongolia 
 Protecting minority investors 
Mongolia strengthened minority 
investor protections by introducing 
a requirement for public joint stock 
companies to publicly disclose 
related-party transactions within 2 
business days. 
 Paying taxes 
Mongolia made paying taxes easier 
for companies by introducing an 
electronic system for filing corporate 
income tax, VAT and social security 
contributions.
SUMMARIES OF DOING BUSINESS REFORMS IN 2013/14 161 
Montenegro 
 Dealing with construction permits 
Montenegro made dealing with 
construction permits substantially 
less costly by reducing the fee for 
the provision of utilities on construc-tion 
land and eliminating the fee for 
obtaining urban development and 
technical requirements from the 
municipality. 
Morocco 
 Trading across borders 
Morocco made trading across bor-ders 
easier by reducing the number 
of export documents required. 
Mozambique 
 Registering property 
Mozambique made registering 
property easier by streamlining 
procedures at the land registry and 
municipality. 
 Resolving insolvency 
Mozambique made resolving insol-vency 
easier by introducing a court-supervised 
reorganization procedure 
and a mechanism for prepackaged 
reorganizations, by clarifying rules 
on the appointment and qualifica-tions 
of insolvency administrators 
and by strengthening creditors’ 
rights. 
Myanmar 
 Trading across borders 
Myanmar made trading across bor-ders 
easier by reducing the number 
of documents required for exports 
and imports. 
Namibia 
 Paying taxes 
Namibia made paying taxes more 
complicated for companies by intro-ducing 
a new vocational education 
and training levy. 
Nepal 
 Dealing with construction permits 
Nepal made dealing with construc-tion 
permits easier by implementing 
a new electronic building permit 
system. 
New Zealand 
 Getting credit 
New Zealand improved access to 
credit information by beginning to 
distribute both positive and negative 
credit information. 
Nicaragua 
 Starting a business 
Nicaragua made starting a business 
easier by combining multiple regis-tration 
procedures. 
 Getting credit 
Nicaragua improved access to credit 
information by starting to provide 
credit scores to banks and financial 
institutions. 
Niger 
 Protecting minority investors 
Niger strengthened minority inves-tor 
protections by introducing 
greater requirements for disclosure 
of related-party transactions to the 
board of directors and by making it 
possible for shareholders to inspect 
the documents pertaining to related-party 
transactions and to appoint 
auditors to conduct an inspection of 
such transactions. 
Norway 
 Starting a business 
Norway made starting a business 
easier by eliminating the require-ment 
for limited liability companies 
to have their balance sheet examined 
by an external auditor if the capital 
is paid in cash. 
Pakistan 
 Trading across borders 
Pakistan made trading across bor-ders 
easier by introducing a fully au-tomated, 
computerized system (the 
Web-Based One Customs system) 
for the submission and processing of 
export and import documents. This 
reform applies to both Lahore and 
Karachi. 
Palau 
 Trading across borders 
Palau made trading across borders 
easier by improving the system for 
calculating customs duties and 
thereby reducing customs clearance 
time. 
Panama 
 Getting credit 
Panama improved access to credit 
through a new law broadening the 
range of assets that can be used 
as collateral, allowing a general 
description of assets granted as col-lateral 
and allowing out-of-court 
enforcement of collateral. 
Philippines 
 Trading across borders 
In the Philippines trading across bor-ders 
became more difficult because 
of a new city ordinance restricting 
truck traffic in Manila. 
Poland 
 Getting electricity 
Poland made getting electricity less 
costly by revising the fee structure 
for new connections. 
 Registering property 
Poland made transferring property 
easier by introducing online proce-dures 
and reducing notary fees. 
 Trading across borders 
Poland made trading across borders 
easier by implementing a new termi-nal 
operating system at the port of 
Gdansk.
162 DOING BUSINESS 2015 
Portugal 
 Paying taxes 
Portugal made paying taxes less 
costly for companies by reducing the 
corporate income tax rate and intro-ducing 
a reduced corporate tax rate 
for a portion of the taxable profits 
of qualifying small and medium-size 
enterprises. 
 Enforcing contracts 
Portugal made enforcing contracts 
easier by adopting a new code of civil 
procedure designed to reduce case 
backlogs, streamline court proce-dures, 
enhance the role of judges and 
speed up the resolution of standard 
civil and commercial disputes. 
Labor market regulation 
Portugal reduced the amount of sev-erance 
pay per year of service and 
increased the maximum cumulative 
duration of fixed-term contracts. 
Puerto Rico (U.S.) 
 Dealing with construction permits 
Puerto Rico (territory of the United 
States) made dealing with construc-tion 
permits easier by introducing 
the option of hiring authorized pri-vate 
professionals to carry out the 
fire safety recommendations and 
issue the fire safety and environ-mental 
health certificates. 
Romania 
 Paying taxes 
Romania made paying taxes easier 
for companies, with the majority 
now using the electronic system for 
filing and paying taxes. 
Russian Federation 
 Starting a business 
The Russian Federation made start-ing 
a business easier by eliminating 
the requirement to deposit the charter 
capital before company registration 
as well as the requirement to notify 
tax authorities of the opening of a 
bank account. This reform applies to 
both Moscow and St. Petersburg. 
 Registering property 
Russia made transferring property 
easier by eliminating the requirement 
for notarization and introducing 
tighter time limits for completing the 
property registration. This reform 
applies to both Moscow and St. 
Petersburg. 
Rwanda 
 Starting a business 
Rwanda made starting a business 
more difficult by requiring com-panies 
to buy an electronic billing 
machine from a certified supplier, 
but also made it easier by launching 
free mandatory online registration. 
 Dealing with construction permits 
Rwanda made dealing with construc-tion 
permits easier by eliminating 
the fee for obtaining a freehold title 
and by streamlining the process for 
obtaining an occupancy permit. 
 Getting electricity 
In Rwanda the electricity company 
made getting electricity less costly 
by eliminating several fees. 
 Getting credit 
Rwanda improved access to credit 
by establishing clear priority rules 
outside bankruptcy for secured credi-tors 
and establishing clear grounds 
for relief from a stay of enforcement 
actions by secured creditors during 
reorganization procedures. 
Samoa 
 Dealing with construction permits 
Samoa made dealing with construc-tion 
permits more costly by increas-ing 
the building permit fees. 
San Marino 
 Registering property 
San Marino made transferring prop-erty 
easier by lowering the property 
registration tax rate. 
São Tomé and Príncipe 
 Starting a business 
São Tomé and Príncipe made start-ing 
a business easier by eliminating 
the minimum capital requirement 
for business entities with no need to 
obtain a commercial license. 
Senegal 
 Starting a business 
Senegal made starting a business 
easier by reducing the minimum 
capital requirement. 
 Dealing with construction permits 
Senegal made dealing with construc-tion 
permits less time-consuming 
by reducing the time for processing 
building permit applications. 
 Registering property 
Senegal made transferring property 
easier by replacing the requirement 
for authorization from the tax 
authority with a notification require-ment 
and by creating a single step 
for the property transfer at the land 
registry. 
 Getting credit 
Senegal improved its credit informa-tion 
system by introducing regula-tions 
developed by the West African 
Economic and Monetary Union that 
govern the licensing and operation of 
credit bureaus. 
 Protecting minority investors 
Senegal strengthened minority 
investor protections by introducing 
greater requirements for disclosure 
of related-party transactions to the 
board of directors; by making it pos-sible 
for shareholders to inspect the 
documents pertaining to related-party 
transactions and to appoint 
auditors to conduct an inspection of 
such transactions; and by making it 
possible for shareholder plaintiffs to 
request from the other party, and 
from witnesses, documents relevant 
to the subject matter of the claim 
during the trial.
SUMMARIES OF DOING BUSINESS REFORMS IN 2013/14 163 
 Paying taxes 
Senegal made paying taxes easier 
for companies by abolishing the 
vehicle tax and making it possible to 
download the declaration forms for 
VAT online. 
Serbia 
 Registering property 
Serbia made transferring property 
more difficult by eliminating the ex-pedited 
procedure for registering a 
property transfer. 
Seychelles 
 Paying taxes 
The Seychelles made paying taxes 
easier for companies by reducing 
the business tax rate applicable to 
income above 1 million Seychelles 
rupees ($77,700) and by introducing 
a simplified new tax return allowing 
joint filing and payment of the busi-ness 
tax, VAT and corporate social 
responsibility tax. On the other hand, 
it increased employers’ pension fund 
contribution rate. 
 Enforcing contracts 
The Seychelles made enforcing 
contracts easier by establishing a 
commercial court, implementing 
and refining its case management 
system, introducing court-annexed 
mediation and addressing schedul-ing 
conflicts within the courts. 
 Resolving insolvency 
The Seychelles made resolving 
insolvency easier by introducing a 
reorganization procedure, provisions 
on the avoidance of undervalued 
transactions and the possibility to 
request post-commencement fi-nancing 
during the reorganization. 
Sierra Leone 
 Getting electricity 
Sierra Leone made getting electric-ity 
easier by eliminating the need 
for customers to submit an applica-tion 
letter inquiring about a new 
connection before submitting an 
application—and made the process 
faster by improving staffing at the 
utility. 
 Registering property 
Sierra Leone made registering prop-erty 
easier by introducing a fast-track 
procedure. 
 Getting credit 
Sierra Leone improved its credit 
information system by beginning to 
distribute both positive and negative 
data and by increasing the system’s 
coverage rate. 
 Paying taxes 
Sierra Leone made paying taxes 
more complicated for companies by 
introducing a capital gains tax. 
Singapore 
 Enforcing contracts 
Singapore made enforcing contracts 
easier by introducing a new electron-ic 
litigation system that streamlines 
litigation proceedings. 
Slovak Republic 
 Starting a business 
The Slovak Republic made starting a 
business easier by reducing the time 
needed to register with the district 
court and eliminating the need (and 
therefore the fee) for the verification 
of signatures by a notary public. 
 Getting credit 
The Slovak Republic improved its 
credit information system by imple-menting 
a new law on the protection 
of personal data. 
Slovenia 
 Resolving insolvency 
Slovenia made resolving insolvency 
easier by introducing a simplified 
reorganization procedure for small 
companies and a preventive re-structuring 
procedure for medium-size 
and large ones, by allowing 
creditors greater participation in 
the management of the debtor and 
by establishing provisions for an 
increase in share capital through 
debt-equity swaps. 
Solomon Islands 
 Getting electricity 
The Solomon Islands made getting 
electricity easier by improving pro-curement 
practices for the materials 
needed to establish new connections. 
South Africa 
 Getting credit 
South Africa made access to credit 
information more difficult by intro-ducing 
regulations requiring credit 
bureaus to remove negative credit 
information from their databases, 
such as adverse information on 
consumer behavior or enforcement 
action accumulated on a consumer’s 
record before April 1, 2014. 
 Enforcing contracts 
South Africa made enforcing 
contracts easier by amending the 
monetary jurisdiction of its lower 
courts and introducing voluntary 
mediation. 
Spain 
 Starting a business 
Spain made starting a business 
easier by introducing an electronic 
system linking several public agen-cies 
and thereby simplifying busi-ness 
registration. 
 Registering property 
Spain made transferring prop-erty 
easier by reducing the property 
transfer tax rate. 
 Paying taxes 
Spain made paying taxes less costly 
for companies by reducing the statu-tory 
corporate income tax rate. 
 Resolving insolvency 
Spain made resolving insolvency 
easier by introducing new rules 
for out-of-court restructuring, 
introducing provisions applicable to
164 DOING BUSINESS 2015 
prepackaged reorganizations and 
making insolvency proceedings more 
public. 
Sri Lanka 
 Paying taxes 
Sri Lanka made paying taxes more 
costly for companies by increas-ing 
the reduced corporate income 
tax rate for qualifying small and 
medium-size enterprises. 
St. Kitts and Nevis 
 Dealing with construction permits 
St. Kitts and Nevis made dealing with 
construction permits more costly by 
increasing the building permit fees. 
 Paying taxes 
St. Kitts and Nevis made paying 
taxes less costly for companies by 
reducing the corporate income tax 
rate. 
St. Lucia 
 Trading across borders 
St. Lucia made trading across 
borders easier by implementing the 
ASYCUDA World electronic system 
for the submission of export and 
import documents and by reducing 
the number of export documents 
required. 
Suriname 
 Starting a business 
Suriname made starting a business 
easier by introducing an online sys-tem 
for obtaining trade licenses. 
Swaziland 
 Starting a business 
Swaziland made starting a business 
easier by shortening the notice and 
objection period for obtaining a new 
trade license. 
 Paying taxes 
Swaziland made paying taxes less 
costly for companies by reducing the 
corporate income tax rate. 
Sweden 
 Registering property 
Sweden made registering prop-erty 
easier by fully implementing 
a new online system for property 
registration. 
Switzerland 
 Starting a business 
Switzerland made starting a busi-ness 
easier by introducing online 
procedures. 
 Protecting minority investors 
Switzerland strengthened minority 
investor protections by increasing 
the level of transparency required 
from publicly traded companies. 
 Resolving insolvency 
Switzerland made resolving in-solvency 
easier by introducing a 
moratorium period while the debtor 
is preparing a composition (reor-ganization) 
agreement, allowing 
creditors greater participation in 
the composition (reorganization) 
procedure and clarifying claw-back 
provisions applicable to voidable 
transactions. 
Taiwan, China 
 Getting electricity 
Taiwan, China, made getting elec-tricity 
easier by eliminating site 
inspections. 
 Getting credit 
Taiwan, China, improved access to 
credit information by beginning to 
include data from utility companies 
in credit reports. 
 Paying taxes 
Taiwan, China, made paying taxes 
easier for companies by introducing 
an electronic system for paying the 
vehicle license tax. 
Tajikistan 
 Starting a business 
Tajikistan made starting a business 
easier by enabling the Statistics 
Agency to issue the statistics code 
for the new business at the time of 
registration. 
 Dealing with construction permits 
Tajikistan made dealing with con-struction 
permits less costly by 
reducing the fee to obtain the archi-tectural 
planning assignment. 
 Getting credit 
Tajikistan improved access to credit 
information by beginning to provide 
credit scores. 
 Paying taxes 
Tajikistan made paying taxes easier 
for companies by introducing an 
electronic system for filing and pay-ing 
corporate income tax, VAT and 
labor taxes. 
Tanzania 
 Getting credit 
Tanzania improved access to 
credit information by creating credit 
bureaus. 
 Paying taxes 
Tanzania made paying taxes more 
complicated for companies by 
introducing an excise tax on money 
transfers. On the other hand, it made 
paying taxes less costly by reducing 
the rate of the skill and development 
levy. 
 Trading across borders 
Tanzania made trading across bor-ders 
easier by upgrading infrastruc-ture 
at the port of Dar es Salaam. 
Thailand 
 Dealing with construction permits 
Thailand made dealing with con-struction 
permits less time-consum-ing 
by introducing a fast-track ap-proval 
process for building permits 
for smaller buildings.
SUMMARIES OF DOING BUSINESS REFORMS IN 2013/14 165 
Timor-Leste 
 Starting a business 
Timor-Leste made starting a busi-ness 
easier by creating a one-stop 
shop. 
Togo 
 Starting a business 
Togo made starting a business 
easier by enabling the one-stop shop 
to publish notices of incorporation 
and eliminating the requirement to 
obtain an economic operator card. 
 Registering property 
Togo made transferring property 
easier by lowering the property reg-istration 
tax rate. 
 Protecting minority investors 
Togo strengthened minority investor 
protections by introducing greater 
requirements for disclosure of 
related-party transactions to the 
board of directors and by making it 
possible for shareholders to inspect 
the documents pertaining to related-party 
transactions and to appoint 
auditors to conduct an inspection of 
such transactions. 
 Paying taxes 
Togo made paying taxes less costly 
for companies by reducing the pay-roll 
tax rate. 
Trinidad and Tobago 
 Starting a business 
Trinidad and Tobago made starting a 
business easier by introducing online 
systems for employer registration 
and tax registration. 
 Getting credit 
Trinidad and Tobago improved 
access to credit by adopting the 
Bankruptcy and Insolvency Act, 
which establishes clear grounds for 
relief from a stay of enforcement 
actions by secured creditors during 
reorganization procedures as well as 
a time limit for the stay. 
 Resolving insolvency 
Trinidad and Tobago made resolving 
insolvency easier by introducing a 
formal mechanism for rehabilitation, 
establishing a public office respon-sible 
for the general administration 
of insolvency proceedings and clari-fying 
the rules on appointment of 
trustees. 
Tunisia 
 Paying taxes 
Tunisia made paying taxes less 
costly for companies by reducing the 
corporate income tax rate. 
 Trading across borders 
In Tunisia trading across borders 
became more difficult because of a 
deterioration in port infrastructure 
(for example, in loading and unload-ing 
equipment) and inadequate 
terminal space. 
Turkey 
 Starting a business 
Turkey made starting a business 
more difficult by increasing the no-tary 
and company registration fees. 
 Paying taxes 
Turkey made paying taxes more 
costly for companies by increasing 
employers’ social security contribu-tion 
rate. 
 Enforcing contracts 
Turkey made enforcing contracts 
easier by introducing an electronic 
filing system for court users. 
Uganda 
 Trading across borders 
Uganda made trading across bor-ders 
easier by implementing the 
ASYCUDA World electronic system 
for the submission of export and 
import documents. 
 Resolving insolvency 
Uganda made resolving insolvency 
easier by consolidating all provisions 
related to corporate insolvency in 
one law, establishing provisions on 
the administration of companies (re-organization), 
clarifying standards 
on the professional qualifications of 
insolvency practitioners and intro-ducing 
provisions allowing the avoid-ance 
of undervalued transactions. 
Ukraine 
 Paying taxes 
Ukraine made paying taxes easier 
for companies by introducing an 
electronic system for filing and pay-ing 
labor taxes. On the other hand, it 
increased the environmental tax. 
United Arab Emirates 
 Registering property 
The United Arab Emirates made 
transferring property easier by 
introducing new service centers and 
a standard contract for property 
transactions. 
 Getting credit 
In the United Arab Emirates the 
credit bureau improved access to 
credit information by starting to 
exchange credit information with a 
utility. 
 Protecting minority investors 
The United Arab Emirates strength-ened 
minority investor protections 
by introducing additional approval 
requirements for related-party 
transactions and greater require-ments 
for disclosure of such trans-actions 
to the stock exchange; by 
introducing a requirement that 
interested directors be held liable 
in a related-party transaction that 
is unfair or constitutes a conflict of 
interest; and by making it possible 
for shareholders to inspect the docu-ments 
pertaining to a related-party 
transaction, appoint auditors to 
inspect the transaction and request 
a rescission of the transaction if it 
should prove to be unfair.
166 DOING BUSINESS 2015 
United Kingdom 
 Starting a business 
The United Kingdom made starting 
a business easier by speeding up tax 
registration. 
 Paying taxes 
The United Kingdom made paying 
taxes less costly for companies by 
reducing the corporate income tax 
rate. On the other hand, it increased 
the landfill tax. 
United States 
 Starting a business 
In the United States starting a busi-ness 
became easier in New York City 
thanks to faster online procedures. 
Uruguay 
 Trading across borders 
Uruguay made trading across 
borders easier by implementing a 
risk-based inspection system that 
reduced customs clearance time for 
both exports and imports. 
 Enforcing contracts 
Uruguay made enforcing contracts 
easier by simplifying and speeding 
up the proceedings for commercial 
disputes. 
Uzbekistan 
 Protecting minority investors 
Uzbekistan strengthened minority 
investor protections by introducing 
a requirement for public joint stock 
companies to disclose information 
about related-party transactions in 
their annual report; setting higher 
standards for disclosure of such 
transactions to the board of direc-tors; 
and establishing the right of 
shareholders to receive all docu-ments 
related to such transactions. 
 Trading across borders 
Uzbekistan made trading across 
borders easier by reducing the 
number of documents to export and 
import and by making it possible to 
submit documents electronically. 
Vanuatu 
 Registering property 
Vanuatu made property transfers 
faster by digitizing its land registry 
system and hiring and training new 
staff. 
Venezuela, RB 
 Starting a business 
República Bolivariana de Venezuela 
made starting a business more dif-ficult 
by increasing incorporation 
costs. 
Vietnam 
 Getting credit 
Vietnam improved its credit infor-mation 
system by establishing a 
new credit bureau. 
 Paying taxes 
Vietnam made paying taxes less 
costly for companies by reducing the 
corporate income tax rate. 
West Bank and Gaza 
 Paying taxes 
West Bank and Gaza made paying 
taxes easier for companies by intro-ducing 
the option to make either 1 or 
4 advance payments of corporate 
income tax. 
Yemen, Rep. 
 Trading across borders 
In the Republic of Yemen trading 
across borders became more dif-ficult 
as a result of inefficient port 
operation. 
Zambia 
 Registering property 
Zambia made transferring property 
more difficult by increasing the prop-erty 
transfer tax rate. 
 Getting credit 
In Zambia the credit bureau im-proved 
access to credit information 
by starting to exchange credit infor-mation 
with retailers and utilities. 
 Paying taxes 
Zambia made paying taxes easier for 
companies by abolishing the medical 
levy and by introducing an online 
system for filing corporate income 
tax, VAT and some labor taxes. At 
the same time, it also increased the 
property transfer tax.
Reform making it easier to do business  Change making it more difficult to do business 
Country tables 
AFGHANISTAN South Asia GNI per capita (US$) 700 
Ease of doing business rank (1–189) 183 Overall distance to frontier (DTF) score (0–100) 41.16 Population (m) 30.6 
 Starting a business (rank) 24 Registering property (rank) 183 Trading across borders (rank) 184 
DTF score for starting a business (0–100) 93.54 DTF score for registering property (0–100) 33.33 DTF score for trading across borders (0–100) 9.21 
Procedures (number) 3 Procedures (number) 9 Documents to export (number) 10 
Time (days) 7 Time (days) 250 Time to export (days) 86 
Cost (% of income per capita) 15.1 Cost (% of property value) 5.0 Cost to export (US$ per container) 5,045 
Minimum capital (% of income per capita) 0.0 Documents to import (number) 10 
Getting credit (rank) 89 Time to import (days) 91 
Dealing with construction permits (rank) 185 DTF score for getting credit (0–100) 45.00 Cost to import (US$ per container) 5,680 
DTF score for dealing with construction permits (0–100) 30.14 Strength of legal rights index (0–12) 9 
Procedures (number) 11 Depth of credit information index (0–8) 0 Enforcing contracts (rank) 183 
Time (days) 323 Credit bureau coverage (% of adults) 0.0 DTF score for enforcing contracts (0–100) 31.29 
Cost (% of warehouse value) 57.4 Credit registry coverage (% of adults) 0.0 Procedures (number) 46 
Time (days) 1,642 
Getting electricity (rank) 141 Protecting minority investors (rank) 189 Cost (% of claim) 25.0 
DTF score for getting electricity (0–100) 61.09 DTF score for protecting minority investors (0–100) 10.00 
Procedures (number) 5 Extent of conflict of interest regulation index (0–10) 1.7 Resolving insolvency (rank) 159 
Time (days) 114 Extent of shareholder governance index (0–10) 0.3 DTF score for resolving insolvency (0–100) 23.60 
Cost (% of income per capita) 3,373.9 Strength of minority investor protection index (0–10) 1.0 Time (years) 2.0 
Cost (% of estate) 25 
Paying taxes (rank) 79 Recovery rate (cents on the dollar) 26.4 
DTF score for paying taxes (0–100) 74.39 Strength of insolvency framework index (0–16) 3 
Payments (number per year) 20 
Time (hours per year) 275 
Total tax rate (% of profit) 35.8 
ALBANIA Europe  Central Asia GNI per capita (US$) 4,700 
Ease of doing business rank (1–189) 68 Overall distance to frontier (DTF) score (0–100) 66.06 Population (m) 2.8 
 Starting a business (rank) 41  Registering property (rank) 118 Trading across borders (rank) 95 
DTF score for starting a business (0–100) 91.86 DTF score for registering property (0–100) 60.67 DTF score for trading across borders (0–100) 72.48 
Procedures (number) 5 Procedures (number) 6 Documents to export (number) 7 
Time (days) 4.5 Time (days) 22 Time to export (days) 19 
Cost (% of income per capita) 10.0 Cost (% of property value) 9.9 Cost to export (US$ per container) 745 
Minimum capital (% of income per capita) 0.0 Documents to import (number) 8 
 Getting credit (rank) 36 Time to import (days) 18 
 Dealing with construction permits (rank) 157 DTF score for getting credit (0–100) 65.00 Cost to import (US$ per container) 730 
DTF score for dealing with construction permits (0–100) 56.50 Strength of legal rights index (0–12) 7 
Procedures (number) 19 Depth of credit information index (0–8) 6 Enforcing contracts (rank) 102 
Time (days) 228 Credit bureau coverage (% of adults) 0.0 DTF score for enforcing contracts (0–100) 57.14 
Cost (% of warehouse value) 3.3 Credit registry coverage (% of adults) 16.7 Procedures (number) 39 
Time (days) 525 
Getting electricity (rank) 152 Protecting minority investors (rank) 7 Cost (% of claim) 34.9 
DTF score for getting electricity (0–100) 58.34 DTF score for protecting minority investors (0–100) 72.50 
Procedures (number) 6 Extent of conflict of interest regulation index (0–10) 7.3 Resolving insolvency (rank) 44 
Time (days) 177 Extent of shareholder governance index (0–10) 7.2 DTF score for resolving insolvency (0–100) 61.37 
Cost (% of income per capita) 472.6 Strength of minority investor protection index (0–10) 7.3 Time (years) 2.0 
Cost (% of estate) 10 
 Paying taxes (rank) 131 Recovery rate (cents on the dollar) 41.5 
DTF score for paying taxes (0–100) 64.75 Strength of insolvency framework index (0–16) 12.5 
Payments (number per year) 34 
Time (hours per year) 357 
Total tax rate (% of profit) 30.7 
Note: For resolving insolvency, an economy for which “no practice” is recorded for time and cost receives a score of 0 on the strength of insolvency framework index even if its legal framework includes provisions related to 
insolvency proceedings (liquidation or reorganization). Most indicator sets refer to a case scenario in the largest business city of an economy, except for 11 economies for which the data are a population-weighted average 
for the 2 largest business cities. See the data notes for more details.
168 DOING BUSINESS 2015 
 Reform making it easier to do business  Change making it more difficult to do business 
ALGERIA Middle East  North Africa GNI per capita (US$) 5,290 
Ease of doing business rank (1–189) 154 Overall distance to frontier (DTF) score (0–100) 50.69 Population (m) 39.2 
Starting a business (rank) 141 Registering property (rank) 157  Trading across borders (rank) 131 
DTF score for starting a business (0–100) 74.07 DTF score for registering property (0–100) 50.67 DTF score for trading across borders (0–100) 64.21 
Procedures (number) 13 Procedures (number) 10 Documents to export (number) 8 
Time (days) 22 Time (days) 55 Time to export (days) 17 
Cost (% of income per capita) 11.0 Cost (% of property value) 7.1 Cost to export (US$ per container) 1,270 
Minimum capital (% of income per capita) 24.1 Documents to import (number) 9 
Getting credit (rank) 171 Time to import (days) 26 
Dealing with construction permits (rank) 127 DTF score for getting credit (0–100) 10.00 Cost to import (US$ per container) 1,330 
DTF score for dealing with construction permits (0–100) 65.72 Strength of legal rights index (0–12) 2 
Procedures (number) 17 Depth of credit information index (0–8) 0 Enforcing contracts (rank) 120 
Time (days) 204 Credit bureau coverage (% of adults) 0.0 DTF score for enforcing contracts (0–100) 52.89 
Cost (% of warehouse value) 0.7 Credit registry coverage (% of adults) 2.0 Procedures (number) 45 
Time (days) 630 
Getting electricity (rank) 147 Protecting minority investors (rank) 132 Cost (% of claim) 21.9 
DTF score for getting electricity (0–100) 59.98 DTF score for protecting minority investors (0–100) 45.00 
Procedures (number) 5 Extent of conflict of interest regulation index (0–10) 5.0 Resolving insolvency (rank) 97 
Time (days) 180 Extent of shareholder governance index (0–10) 4.0 DTF score for resolving insolvency (0–100) 42.74 
Cost (% of income per capita) 1,318.5 Strength of minority investor protection index (0–10) 4.5 Time (years) 2.5 
Cost (% of estate) 7 
Paying taxes (rank) 176 Recovery rate (cents on the dollar) 41.7 
DTF score for paying taxes (0–100) 41.63 Strength of insolvency framework index (0–16) 6.5 
Payments (number per year) 27 
Time (hours per year) 451 
Total tax rate (% of profit) 72.7 
ANGOLA Sub-Saharan Africa GNI per capita (US$) 5,010 
Ease of doing business rank (1–189) 181 Overall distance to frontier (DTF) score (0–100) 41.85 Population (m) 21.5 
Starting a business (rank) 174 Registering property (rank) 164 Trading across borders (rank) 167 
DTF score for starting a business (0–100) 56.56 DTF score for registering property (0–100) 46.62 DTF score for trading across borders (0–100) 40.96 
Procedures (number) 8 Procedures (number) 7 Documents to export (number) 10 
Time (days) 66 Time (days) 190 Time to export (days) 40 
Cost (% of income per capita) 123.5 Cost (% of property value) 3.0 Cost to export (US$ per container) 2,060 
Minimum capital (% of income per capita) 20.0 Documents to import (number) 9 
Getting credit (rank) 180 Time to import (days) 43 
Dealing with construction permits (rank) 67 DTF score for getting credit (0–100) 5.00 Cost to import (US$ per container) 2,725 
DTF score for dealing with construction permits (0–100) 75.47 Strength of legal rights index (0–12) 1 
Procedures (number) 10 Depth of credit information index (0–8) 0 Enforcing contracts (rank) 187 
Time (days) 203 Credit bureau coverage (% of adults) 0.0 DTF score for enforcing contracts (0–100) 25.22 
Cost (% of warehouse value) 0.5 Credit registry coverage (% of adults) 1.8 Procedures (number) 46 
Time (days) 1,296 
Getting electricity (rank) 157 Protecting minority investors (rank) 94 Cost (% of claim) 44.4 
DTF score for getting electricity (0–100) 56.66 DTF score for protecting minority investors (0–100) 51.67 
Procedures (number) 7 Extent of conflict of interest regulation index (0–10) 5.3 Resolving insolvency (rank) 189 
Time (days) 145 Extent of shareholder governance index (0–10) 5.0 DTF score for resolving insolvency (0–100) 0.00 
Cost (% of income per capita) 660.0 Strength of minority investor protection index (0–10) 5.2 Time (years) NO PRACTICE 
Cost (% of estate) NO PRACTICE 
Paying taxes (rank) 144 Recovery rate (cents on the dollar) 0.0 
DTF score for paying taxes (0–100) 60.40 Strength of insolvency framework index (0–16) 0 
Payments (number per year) 30 
Time (hours per year) 282 
Total tax rate (% of profit) 52.0 
ANTIGUA AND BARBUDA Latin America  Caribbean GNI per capita (US$) 12,910 
Ease of doing business rank (1–189) 89 Overall distance to frontier (DTF) score (0–100) 62.64 Population (m) 0.1 
Starting a business (rank) 102 Registering property (rank) 141 Trading across borders (rank) 89 
DTF score for starting a business (0–100) 83.28 DTF score for registering property (0–100) 55.44 DTF score for trading across borders (0–100) 73.58 
Procedures (number) 8 Procedures (number) 7 Documents to export (number) 5 
Time (days) 21 Time (days) 25 Time to export (days) 16 
Cost (% of income per capita) 10.2 Cost (% of property value) 10.8 Cost to export (US$ per container) 1,090 
Minimum capital (% of income per capita) 0.0 Documents to import (number) 7 
Getting credit (rank) 151 Time to import (days) 23 
Dealing with construction permits (rank) 30 DTF score for getting credit (0–100) 25.00 Cost to import (US$ per container) 1,520 
DTF score for dealing with construction permits (0–100) 82.21 Strength of legal rights index (0–12) 5 
Procedures (number) 12 Depth of credit information index (0–8) 0 Enforcing contracts (rank) 76 
Time (days) 106 Credit bureau coverage (% of adults) 0.0 DTF score for enforcing contracts (0–100) 61.26 
Cost (% of warehouse value) 0.5 Credit registry coverage (% of adults) 0.0 Procedures (number) 44 
Time (days) 351 
Getting electricity (rank) 17 Protecting minority investors (rank) 35 Cost (% of claim) 22.7 
DTF score for getting electricity (0–100) 90.46 DTF score for protecting minority investors (0–100) 62.50 
Procedures (number) 4 Extent of conflict of interest regulation index (0–10) 6.7 Resolving insolvency (rank) 114 
Time (days) 42 Extent of shareholder governance index (0–10) 5.8 DTF score for resolving insolvency (0–100) 38.19 
Cost (% of income per capita) 122.9 Strength of minority investor protection index (0–10) 6.3 Time (years) 3.0 
Cost (% of estate) 7 
Paying taxes (rank) 159 Recovery rate (cents on the dollar) 36.1 
DTF score for paying taxes (0–100) 54.51 Strength of insolvency framework index (0–16) 6 
Payments (number per year) 57 
Time (hours per year) 207 
Total tax rate (% of profit) 41.6 
Note: For resolving insolvency, an economy for which “no practice” is recorded for time and cost receives a score of 0 on the strength of insolvency framework index even if its legal framework includes provisions related to 
insolvency proceedings (liquidation or reorganization). Most indicator sets refer to a case scenario in the largest business city of an economy, except for 11 economies for which the data are a population-weighted average 
for the 2 largest business cities. See the data notes for more details.
COUNTRY TABLES 169 
 Reform making it easier to do business  Change making it more difficult to do business 
ARGENTINA Latin America  Caribbean GNI per capita (US$) 11,376 
Ease of doing business rank (1–189) 124 Overall distance to frontier (DTF) score (0–100) 57.48 Population (m) 41.4 
Starting a business (rank) 146 Registering property (rank) 119 Trading across borders (rank) 128 
DTF score for starting a business (0–100) 72.58 DTF score for registering property (0–100) 60.63 DTF score for trading across borders (0–100) 65.11 
Procedures (number) 14 Procedures (number) 7 Documents to export (number) 6 
Time (days) 25 Time (days) 51.5 Time to export (days) 12 
Cost (% of income per capita) 15.2 Cost (% of property value) 6.6 Cost to export (US$ per container) 1,770 
Minimum capital (% of income per capita) 4.0 Documents to import (number) 8 
Getting credit (rank) 71 Time to import (days) 30 
 Dealing with construction permits (rank) 181 DTF score for getting credit (0–100) 50.00 Cost to import (US$ per container) 2,320 
DTF score for dealing with construction permits (0–100) 42.54 Strength of legal rights index (0–12) 2 
Procedures (number) 21 Depth of credit information index (0–8) 8 Enforcing contracts (rank) 63 
Time (days) 341 Credit bureau coverage (% of adults) 100.0 DTF score for enforcing contracts (0–100) 63.88 
Cost (% of warehouse value) 3.5 Credit registry coverage (% of adults) 41.2 Procedures (number) 36 
Time (days) 590 
Getting electricity (rank) 104 Protecting minority investors (rank) 62 Cost (% of claim) 20.5 
DTF score for getting electricity (0–100) 72.42 DTF score for protecting minority investors (0–100) 57.50 
Procedures (number) 6 Extent of conflict of interest regulation index (0–10) 5.0 Resolving insolvency (rank) 83 
Time (days) 92 Extent of shareholder governance index (0–10) 6.5 DTF score for resolving insolvency (0–100) 45.10 
Cost (% of income per capita) 45.4 Strength of minority investor protection index (0–10) 5.8 Time (years) 2.8 
Cost (% of estate) 12 
Paying taxes (rank) 170 Recovery rate (cents on the dollar) 28.6 
DTF score for paying taxes (0–100) 44.99 Strength of insolvency framework index (0–16) 9.5 
Payments (number per year) 9 
Time (hours per year) 405 
Total tax rate (% of profit) 137.3 
ARMENIA Europe  Central Asia GNI per capita (US$) 3,790 
Ease of doing business rank (1–189) 45 Overall distance to frontier (DTF) score (0–100) 70.60 Population (m) 3.0 
 Starting a business (rank) 4 Registering property (rank) 7 Trading across borders (rank) 110 
DTF score for starting a business (0–100) 97.77 DTF score for registering property (0–100) 93.03 DTF score for trading across borders (0–100) 68.81 
Procedures (number) 2 Procedures (number) 3 Documents to export (number) 5 
Time (days) 3 Time (days) 7 Time to export (days) 16 
Cost (% of income per capita) 1.0 Cost (% of property value) 0.2 Cost to export (US$ per container) 1,885 
Minimum capital (% of income per capita) 0.0 Documents to import (number) 8 
Getting credit (rank) 36 Time to import (days) 18 
Dealing with construction permits (rank) 81 DTF score for getting credit (0–100) 65.00 Cost to import (US$ per container) 2,175 
DTF score for dealing with construction permits (0–100) 73.78 Strength of legal rights index (0–12) 5 
Procedures (number) 19 Depth of credit information index (0–8) 8 Enforcing contracts (rank) 119 
Time (days) 83 Credit bureau coverage (% of adults) 65.8 DTF score for enforcing contracts (0–100) 53.33 
Cost (% of warehouse value) 1.2 Credit registry coverage (% of adults) 23.5 Procedures (number) 49 
Time (days) 570 
Getting electricity (rank) 131 Protecting minority investors (rank) 49 Cost (% of claim) 14.0 
DTF score for getting electricity (0–100) 64.02 DTF score for protecting minority investors (0–100) 60.00 
Procedures (number) 5 Extent of conflict of interest regulation index (0–10) 6.3 Resolving insolvency (rank) 69 
Time (days) 187 Extent of shareholder governance index (0–10) 5.7 DTF score for resolving insolvency (0–100) 48.14 
Cost (% of income per capita) 92.6 Strength of minority investor protection index (0–10) 6.0 Time (years) 1.9 
Cost (% of estate) 11 
Paying taxes (rank) 41 Recovery rate (cents on the dollar) 37.2 
DTF score for paying taxes (0–100) 82.10 Strength of insolvency framework index (0–16) 9 
Payments (number per year) 10 
Time (hours per year) 321 
Total tax rate (% of profit) 20.4 
AUSTRALIA OECD high income GNI per capita (US$) 65,520 
Ease of doing business rank (1–189) 10 Overall distance to frontier (DTF) score (0–100) 80.66 Population (m) 23.1 
Starting a business (rank) 7 Registering property (rank) 53 Trading across borders (rank) 49 
DTF score for starting a business (0–100) 96.47 DTF score for registering property (0–100) 76.87 DTF score for trading across borders (0–100) 80.53 
Procedures (number) 3 Procedures (number) 5 Documents to export (number) 5 
Time (days) 2.5 Time (days) 4.5 Time to export (days) 9 
Cost (% of income per capita) 0.7 Cost (% of property value) 5.2 Cost to export (US$ per container) 1,200 
Minimum capital (% of income per capita) 0.0 Documents to import (number) 7 
Getting credit (rank) 4 Time to import (days) 8 
Dealing with construction permits (rank) 19 DTF score for getting credit (0–100) 90.00 Cost to import (US$ per container) 1,220 
DTF score for dealing with construction permits (0–100) 84.30 Strength of legal rights index (0–12) 11 
Procedures (number) 10 Depth of credit information index (0–8) 7 Enforcing contracts (rank) 12 
Time (days) 112 Credit bureau coverage (% of adults) 100.0 DTF score for enforcing contracts (0–100) 77.06 
Cost (% of warehouse value) 0.5 Credit registry coverage (% of adults) 0.0 Procedures (number) 28 
Time (days) 395 
Getting electricity (rank) 55 Protecting minority investors (rank) 71 Cost (% of claim) 21.8 
DTF score for getting electricity (0–100) 80.59 DTF score for protecting minority investors (0–100) 56.67 
Procedures (number) 5 Extent of conflict of interest regulation index (0–10) 6.0 Resolving insolvency (rank) 14 
Time (days) 75 Extent of shareholder governance index (0–10) 5.3 DTF score for resolving insolvency (0–100) 81.60 
Cost (% of income per capita) 8.6 Strength of minority investor protection index (0–10) 5.7 Time (years) 1.0 
Cost (% of estate) 8 
Paying taxes (rank) 39 Recovery rate (cents on the dollar) 81.9 
DTF score for paying taxes (0–100) 82.48 Strength of insolvency framework index (0–16) 12 
Payments (number per year) 11 
Time (hours per year) 105 
Total tax rate (% of profit) 47.3 
Note: For resolving insolvency, an economy for which “no practice” is recorded for time and cost receives a score of 0 on the strength of insolvency framework index even if its legal framework includes provisions related to 
insolvency proceedings (liquidation or reorganization). Most indicator sets refer to a case scenario in the largest business city of an economy, except for 11 economies for which the data are a population-weighted average 
for the 2 largest business cities. See the data notes for more details.
170 DOING BUSINESS 2015 
 Reform making it easier to do business  Change making it more difficult to do business 
AUSTRIA OECD high income GNI per capita (US$) 48,590 
Ease of doing business rank (1–189) 21 Overall distance to frontier (DTF) score (0–100) 77.42 Population (m) 8.5 
 Starting a business (rank) 101 Registering property (rank) 35 Trading across borders (rank) 19 
DTF score for starting a business (0–100) 83.42 DTF score for registering property (0–100) 81.07 DTF score for trading across borders (0–100) 87.66 
Procedures (number) 8 Procedures (number) 3 Documents to export (number) 3 
Time (days) 22 Time (days) 20.5 Time to export (days) 10 
Cost (% of income per capita) 0.3 Cost (% of property value) 4.6 Cost to export (US$ per container) 1,150 
Minimum capital (% of income per capita) 13.6 Documents to import (number) 4 
Getting credit (rank) 52 Time to import (days) 9 
Dealing with construction permits (rank) 78 DTF score for getting credit (0–100) 60.00 Cost to import (US$ per container) 1,215 
DTF score for dealing with construction permits (0–100) 74.25 Strength of legal rights index (0–12) 5 
Procedures (number) 11 Depth of credit information index (0–8) 7 Enforcing contracts (rank) 5 
Time (days) 192 Credit bureau coverage (% of adults) 53.2 DTF score for enforcing contracts (0–100) 81.55 
Cost (% of warehouse value) 1.1 Credit registry coverage (% of adults) 2.0 Procedures (number) 25 
Time (days) 397 
Getting electricity (rank) 24 Protecting minority investors (rank) 32 Cost (% of claim) 18.0 
DTF score for getting electricity (0–100) 87.75 DTF score for protecting minority investors (0–100) 63.33 
Procedures (number) 5 Extent of conflict of interest regulation index (0–10) 5.3 Resolving insolvency (rank) 16 
Time (days) 23 Extent of shareholder governance index (0–10) 7.3 DTF score for resolving insolvency (0–100) 78.84 
Cost (% of income per capita) 101.6 Strength of minority investor protection index (0–10) 6.3 Time (years) 1.1 
Cost (% of estate) 10 
Paying taxes (rank) 72 Recovery rate (cents on the dollar) 82.6 
DTF score for paying taxes (0–100) 76.36 Strength of insolvency framework index (0–16) 11 
Payments (number per year) 12 
Time (hours per year) 166 
Total tax rate (% of profit) 52.0 
AZERBAIJAN Europe  Central Asia GNI per capita (US$) 7,350 
Ease of doing business rank (1–189) 80 Overall distance to frontier (DTF) score (0–100) 64.08 Population (m) 9.4 
 Starting a business (rank) 12  Registering property (rank) 10 Trading across borders (rank) 166 
DTF score for starting a business (0–100) 95.54 DTF score for registering property (0–100) 92.30 DTF score for trading across borders (0–100) 42.37 
Procedures (number) 3 Procedures (number) 3 Documents to export (number) 9 
Time (days) 5 Time (days) 8.5 Time to export (days) 27 
Cost (% of income per capita) 3.1 Cost (% of property value) 0.4 Cost to export (US$ per container) 3,460 
Minimum capital (% of income per capita) 0.0 Documents to import (number) 11 
Getting credit (rank) 104 Time to import (days) 25 
Dealing with construction permits (rank) 150 DTF score for getting credit (0–100) 40.00 Cost to import (US$ per container) 3,450 
DTF score for dealing with construction permits (0–100) 59.89 Strength of legal rights index (0–12) 2 
Procedures (number) 21 Depth of credit information index (0–8) 6 Enforcing contracts (rank) 31 
Time (days) 151 Credit bureau coverage (% of adults) 0.0 DTF score for enforcing contracts (0–100) 69.02 
Cost (% of warehouse value) 4.1 Credit registry coverage (% of adults) 28.7 Procedures (number) 40 
Time (days) 277 
Getting electricity (rank) 159 Protecting minority investors (rank) 51 Cost (% of claim) 18.5 
DTF score for getting electricity (0–100) 55.69 DTF score for protecting minority investors (0–100) 59.17 
Procedures (number) 7 Extent of conflict of interest regulation index (0–10) 6.7 Resolving insolvency (rank) 94 
Time (days) 164 Extent of shareholder governance index (0–10) 5.2 DTF score for resolving insolvency (0–100) 43.02 
Cost (% of income per capita) 226.2 Strength of minority investor protection index (0–10) 5.9 Time (years) 1.5 
Cost (% of estate) 12 
 Paying taxes (rank) 33 Recovery rate (cents on the dollar) 39.3 
DTF score for paying taxes (0–100) 83.77 Strength of insolvency framework index (0–16) 7 
Payments (number per year) 7 
Time (hours per year) 195 
Total tax rate (% of profit) 39.8 
BAHAMAS, THE Latin America  Caribbean GNI per capita (US$) 23,489 
Ease of doing business rank (1–189) 97 Overall distance to frontier (DTF) score (0–100) 61.37 Population (m) 0.4 
Starting a business (rank) 95 Registering property (rank) 179 Trading across borders (rank) 63 
DTF score for starting a business (0–100) 84.12 DTF score for registering property (0–100) 37.22 DTF score for trading across borders (0–100) 77.36 
Procedures (number) 7 Procedures (number) 7 Documents to export (number) 5 
Time (days) 23.5 Time (days) 122 Time to export (days) 19 
Cost (% of income per capita) 10.2 Cost (% of property value) 12.1 Cost to export (US$ per container) 1,005 
Minimum capital (% of income per capita) 0.0 Documents to import (number) 5 
Getting credit (rank) 131 Time to import (days) 13 
 Dealing with construction permits (rank) 92 DTF score for getting credit (0–100) 30.00 Cost to import (US$ per container) 1,770 
DTF score for dealing with construction permits (0–100) 71.81 Strength of legal rights index (0–12) 6 
Procedures (number) 14 Depth of credit information index (0–8) 0  Enforcing contracts (rank) 125 
Time (days) 178 Credit bureau coverage (% of adults) 0.0 DTF score for enforcing contracts (0–100) 51.65 
Cost (% of warehouse value) 1.0 Credit registry coverage (% of adults) 0.0 Procedures (number) 49 
Time (days) 427 
Getting electricity (rank) 50 Protecting minority investors (rank) 141 Cost (% of claim) 28.9 
DTF score for getting electricity (0–100) 81.24 DTF score for protecting minority investors (0–100) 43.33 
Procedures (number) 5 Extent of conflict of interest regulation index (0–10) 5.0 Resolving insolvency (rank) 60 
Time (days) 67 Extent of shareholder governance index (0–10) 3.7 DTF score for resolving insolvency (0–100) 52.93 
Cost (% of income per capita) 133.2 Strength of minority investor protection index (0–10) 4.3 Time (years) 3.0 
Cost (% of estate) 12 
Paying taxes (rank) 31 Recovery rate (cents on the dollar) 63.5 
DTF score for paying taxes (0–100) 84.07 Strength of insolvency framework index (0–16) 6 
Payments (number per year) 18 
Time (hours per year) 58 
Total tax rate (% of profit) 41.1 
Note: For resolving insolvency, an economy for which “no practice” is recorded for time and cost receives a score of 0 on the strength of insolvency framework index even if its legal framework includes provisions related to 
insolvency proceedings (liquidation or reorganization). Most indicator sets refer to a case scenario in the largest business city of an economy, except for 11 economies for which the data are a population-weighted average 
for the 2 largest business cities. See the data notes for more details.
COUNTRY TABLES 171 
 Reform making it easier to do business  Change making it more difficult to do business 
BAHRAIN Middle East  North Africa GNI per capita (US$) 27,435 
Ease of doing business rank (1–189) 53 Overall distance to frontier (DTF) score (0–100) 69.00 Population (m) 1.3 
Starting a business (rank) 131  Registering property (rank) 17 Trading across borders (rank) 64 
DTF score for starting a business (0–100) 76.92 DTF score for registering property (0–100) 88.65 DTF score for trading across borders (0–100) 77.27 
Procedures (number) 7 Procedures (number) 2 Documents to export (number) 6 
Time (days) 9 Time (days) 31 Time to export (days) 11 
Cost (% of income per capita) 0.8 Cost (% of property value) 1.7 Cost to export (US$ per container) 810 
Minimum capital (% of income per capita) 192.2 Documents to import (number) 8 
 Getting credit (rank) 104 Time to import (days) 15 
Dealing with construction permits (rank) 7 DTF score for getting credit (0–100) 40.00 Cost to import (US$ per container) 870 
DTF score for dealing with construction permits (0–100) 88.48 Strength of legal rights index (0–12) 1 
Procedures (number) 11 Depth of credit information index (0–8) 7 Enforcing contracts (rank) 123 
Time (days) 60 Credit bureau coverage (% of adults) 48.3 DTF score for enforcing contracts (0–100) 52.33 
Cost (% of warehouse value) 0.2 Credit registry coverage (% of adults) 0.0 Procedures (number) 48 
Time (days) 635 
Getting electricity (rank) 73 Protecting minority investors (rank) 104 Cost (% of claim) 14.7 
DTF score for getting electricity (0–100) 78.26 DTF score for protecting minority investors (0–100) 50.00 
Procedures (number) 5 Extent of conflict of interest regulation index (0–10) 4.7 Resolving insolvency (rank) 87 
Time (days) 90 Extent of shareholder governance index (0–10) 5.3 DTF score for resolving insolvency (0–100) 44.24 
Cost (% of income per capita) 47.1 Strength of minority investor protection index (0–10) 5.0 Time (years) 2.5 
Cost (% of estate) 10 
Paying taxes (rank) 8 Recovery rate (cents on the dollar) 41.6 
DTF score for paying taxes (0–100) 93.88 Strength of insolvency framework index (0–16) 7 
Payments (number per year) 13 
Time (hours per year) 60 
Total tax rate (% of profit) 13.5 
BANGLADESH South Asia GNI per capita (US$) 900 
Ease of doing business rank (1–189) 173 Overall distance to frontier (DTF) score (0–100) 46.84 Population (m) 156.6 
Starting a business (rank) 115 Registering property (rank) 184  Trading across borders (rank) 140 
DTF score for starting a business (0–100) 81.36 DTF score for registering property (0–100) 31.34 DTF score for trading across borders (0–100) 61.36 
Procedures (number) 9 Procedures (number) 8 Documents to export (number) 6 
Time (days) 19.5 Time (days) 244 Time to export (days) 28.3 
Cost (% of income per capita) 16.8 Cost (% of property value) 7.1 Cost to export (US$ per container) 1,281 
Minimum capital (% of income per capita) 0.0 Documents to import (number) 9 
Getting credit (rank) 131 Time to import (days) 33.6 
Dealing with construction permits (rank) 144 DTF score for getting credit (0–100) 30.00 Cost to import (US$ per container) 1,515 
DTF score for dealing with construction permits (0–100) 61.90 Strength of legal rights index (0–12) 6 
Procedures (number) 13.4 Depth of credit information index (0–8) 0 Enforcing contracts (rank) 188 
Time (days) 269.2 Credit bureau coverage (% of adults) 0.0 DTF score for enforcing contracts (0–100) 20.82 
Cost (% of warehouse value) 2.1 Credit registry coverage (% of adults) 0.9 Procedures (number) 41 
Time (days) 1,442 
Getting electricity (rank) 188 Protecting minority investors (rank) 43 Cost (% of claim) 66.8 
DTF score for getting electricity (0–100) 17.32 DTF score for protecting minority investors (0–100) 60.83 
Procedures (number) 9 Extent of conflict of interest regulation index (0–10) 6.3 Resolving insolvency (rank) 147 
Time (days) 428.9 Extent of shareholder governance index (0–10) 5.8 DTF score for resolving insolvency (0–100) 29.49 
Cost (% of income per capita) 3,890.1 Strength of minority investor protection index (0–10) 6.1 Time (years) 4.0 
Cost (% of estate) 8 
Paying taxes (rank) 83 Recovery rate (cents on the dollar) 25.8 
DTF score for paying taxes (0–100) 73.98 Strength of insolvency framework index (0–16) 5 
Payments (number per year) 21 
Time (hours per year) 302 
Total tax rate (% of profit) 32.5 
BARBADOS Latin America  Caribbean GNI per capita (US$) 15,373 
Ease of doing business rank (1–189) 106 Overall distance to frontier (DTF) score (0–100) 60.57 Population (m) 0.3 
Starting a business (rank) 94 Registering property (rank) 144 Trading across borders (rank) 38 
DTF score for starting a business (0–100) 84.36 DTF score for registering property (0–100) 54.95 DTF score for trading across borders (0–100) 83.34 
Procedures (number) 8 Procedures (number) 6 Documents to export (number) 5 
Time (days) 18 Time (days) 118 Time to export (days) 9 
Cost (% of income per capita) 7.6 Cost (% of property value) 5.6 Cost to export (US$ per container) 810 
Minimum capital (% of income per capita) 0.0 Documents to import (number) 5 
Getting credit (rank) 116 Time to import (days) 8 
Dealing with construction permits (rank) 147 DTF score for getting credit (0–100) 35.00 Cost to import (US$ per container) 1,615 
DTF score for dealing with construction permits (0–100) 61.06 Strength of legal rights index (0–12) 7 
Procedures (number) 9 Depth of credit information index (0–8) 0 Enforcing contracts (rank) 160 
Time (days) 442 Credit bureau coverage (% of adults) 0.0 DTF score for enforcing contracts (0–100) 41.61 
Cost (% of warehouse value) 0.2 Credit registry coverage (% of adults) 0.0 Procedures (number) 38 
Time (days) 1,340 
Getting electricity (rank) 118 Protecting minority investors (rank) 177 Cost (% of claim) 19.7 
DTF score for getting electricity (0–100) 67.51 DTF score for protecting minority investors (0–100) 30.83 
Procedures (number) 7 Extent of conflict of interest regulation index (0–10) 3.3 Resolving insolvency (rank) 26 
Time (days) 87 Extent of shareholder governance index (0–10) 2.8 DTF score for resolving insolvency (0–100) 74.09 
Cost (% of income per capita) 64.0 Strength of minority investor protection index (0–10) 3.1 Time (years) 1.8 
Cost (% of estate) 15 
Paying taxes (rank) 92 Recovery rate (cents on the dollar) 65.1 
DTF score for paying taxes (0–100) 72.99 Strength of insolvency framework index (0–16) 12.5 
Payments (number per year) 27 
Time (hours per year) 237 
Total tax rate (% of profit) 34.6 
Note: For resolving insolvency, an economy for which “no practice” is recorded for time and cost receives a score of 0 on the strength of insolvency framework index even if its legal framework includes provisions related to 
insolvency proceedings (liquidation or reorganization). Most indicator sets refer to a case scenario in the largest business city of an economy, except for 11 economies for which the data are a population-weighted average 
for the 2 largest business cities. See the data notes for more details.
172 DOING BUSINESS 2015 
 Reform making it easier to do business  Change making it more difficult to do business 
BELARUS Europe  Central Asia GNI per capita (US$) 6,720 
Ease of doing business rank (1–189) 57 Overall distance to frontier (DTF) score (0–100) 68.26 Population (m) 9.5 
Starting a business (rank) 40 Registering property (rank) 3 Trading across borders (rank) 145 
DTF score for starting a business (0–100) 91.88 DTF score for registering property (0–100) 96.67 DTF score for trading across borders (0–100) 59.09 
Procedures (number) 5 Procedures (number) 2 Documents to export (number) 8 
Time (days) 9 Time (days) 4 Time to export (days) 15 
Cost (% of income per capita) 0.8 Cost (% of property value) 0.0 Cost to export (US$ per container) 1,460 
Minimum capital (% of income per capita) 0.0 Documents to import (number) 10 
Getting credit (rank) 104 Time to import (days) 30 
Dealing with construction permits (rank) 51 DTF score for getting credit (0–100) 40.00 Cost to import (US$ per container) 2,265 
DTF score for dealing with construction permits (0–100) 78.20 Strength of legal rights index (0–12) 2 
Procedures (number) 14 Depth of credit information index (0–8) 6 Enforcing contracts (rank) 7 
Time (days) 114 Credit bureau coverage (% of adults) 0.0 DTF score for enforcing contracts (0–100) 78.70 
Cost (% of warehouse value) 0.8 Credit registry coverage (% of adults) 64.5 Procedures (number) 29 
Time (days) 275 
Getting electricity (rank) 148 Protecting minority investors (rank) 94 Cost (% of claim) 23.4 
DTF score for getting electricity (0–100) 59.90 DTF score for protecting minority investors (0–100) 51.67 
Procedures (number) 7 Extent of conflict of interest regulation index (0–10) 5.0 Resolving insolvency (rank) 68 
Time (days) 131 Extent of shareholder governance index (0–10) 5.3 DTF score for resolving insolvency (0–100) 48.18 
Cost (% of income per capita) 364.1 Strength of minority investor protection index (0–10) 5.2 Time (years) 3.0 
Cost (% of estate) 22 
 Paying taxes (rank) 60 Recovery rate (cents on the dollar) 37.3 
DTF score for paying taxes (0–100) 78.29 Strength of insolvency framework index (0–16) 9 
Payments (number per year) 7 
Time (hours per year) 183 
Total tax rate (% of profit) 52.0 
BELGIUM OECD high income GNI per capita (US$) 45,210 
Ease of doing business rank (1–189) 42 Overall distance to frontier (DTF) score (0–100) 71.11 Population (m) 11.2 
Starting a business (rank) 14 Registering property (rank) 171 Trading across borders (rank) 26 
DTF score for starting a business (0–100) 94.42 DTF score for registering property (0–100) 42.27 DTF score for trading across borders (0–100) 85.55 
Procedures (number) 3 Procedures (number) 8 Documents to export (number) 4 
Time (days) 4 Time (days) 64 Time to export (days) 9 
Cost (% of income per capita) 5.0 Cost (% of property value) 12.7 Cost to export (US$ per container) 1,240 
Minimum capital (% of income per capita) 18.2 Documents to import (number) 4 
Getting credit (rank) 89 Time to import (days) 8 
Dealing with construction permits (rank) 82 DTF score for getting credit (0–100) 45.00 Cost to import (US$ per container) 1,400 
DTF score for dealing with construction permits (0–100) 73.68 Strength of legal rights index (0–12) 4 
Procedures (number) 10 Depth of credit information index (0–8) 5 Enforcing contracts (rank) 10 
Time (days) 212 Credit bureau coverage (% of adults) 0.0 DTF score for enforcing contracts (0–100) 77.67 
Cost (% of warehouse value) 1.1 Credit registry coverage (% of adults) 96.4 Procedures (number) 26 
Time (days) 505 
Getting electricity (rank) 99 Protecting minority investors (rank) 40 Cost (% of claim) 17.7 
DTF score for getting electricity (0–100) 72.81 DTF score for protecting minority investors (0–100) 61.67 
Procedures (number) 6 Extent of conflict of interest regulation index (0–10) 7.0  Resolving insolvency (rank) 11 
Time (days) 88 Extent of shareholder governance index (0–10) 5.3 DTF score for resolving insolvency (0–100) 83.87 
Cost (% of income per capita) 92.3 Strength of minority investor protection index (0–10) 6.2 Time (years) 0.9 
Cost (% of estate) 4 
Paying taxes (rank) 81 Recovery rate (cents on the dollar) 89.1 
DTF score for paying taxes (0–100) 74.18 Strength of insolvency framework index (0–16) 11.5 
Payments (number per year) 11 
Time (hours per year) 160 
Total tax rate (% of profit) 57.8 
BELIZE Latin America  Caribbean GNI per capita (US$) 4,660 
Ease of doing business rank (1–189) 118 Overall distance to frontier (DTF) score (0–100) 58.14 Population (m) 0.3 
Starting a business (rank) 148 Registering property (rank) 120 Trading across borders (rank) 91 
DTF score for starting a business (0–100) 72.38 DTF score for registering property (0–100) 60.61 DTF score for trading across borders (0–100) 73.17 
Procedures (number) 9 Procedures (number) 8 Documents to export (number) 5 
Time (days) 43 Time (days) 59 Time to export (days) 17 
Cost (% of income per capita) 41.4 Cost (% of property value) 4.8 Cost to export (US$ per container) 1,355 
Minimum capital (% of income per capita) 0.0 Documents to import (number) 7 
Getting credit (rank) 160 Time to import (days) 19 
Dealing with construction permits (rank) 69 DTF score for getting credit (0–100) 20.00 Cost to import (US$ per container) 1,580 
DTF score for dealing with construction permits (0–100) 75.35 Strength of legal rights index (0–12) 4 
Procedures (number) 15 Depth of credit information index (0–8) 0 Enforcing contracts (rank) 170 
Time (days) 110 Credit bureau coverage (% of adults) 0.0 DTF score for enforcing contracts (0–100) 37.38 
Cost (% of warehouse value) 1.9 Credit registry coverage (% of adults) 0.0 Procedures (number) 51 
Time (days) 892 
Getting electricity (rank) 54 Protecting minority investors (rank) 169 Cost (% of claim) 27.5 
DTF score for getting electricity (0–100) 80.62 DTF score for protecting minority investors (0–100) 35.83 
Procedures (number) 5 Extent of conflict of interest regulation index (0–10) 4.3 Resolving insolvency (rank) 71 
Time (days) 66 Extent of shareholder governance index (0–10) 2.8 DTF score for resolving insolvency (0–100) 47.94 
Cost (% of income per capita) 319.5 Strength of minority investor protection index (0–10) 3.6 Time (years) 2.0 
Cost (% of estate) 23 
Paying taxes (rank) 61 Recovery rate (cents on the dollar) 54.2 
DTF score for paying taxes (0–100) 78.17 Strength of insolvency framework index (0–16) 6 
Payments (number per year) 29 
Time (hours per year) 147 
Total tax rate (% of profit) 31.1 
Note: For resolving insolvency, an economy for which “no practice” is recorded for time and cost receives a score of 0 on the strength of insolvency framework index even if its legal framework includes provisions related to 
insolvency proceedings (liquidation or reorganization). Most indicator sets refer to a case scenario in the largest business city of an economy, except for 11 economies for which the data are a population-weighted average 
for the 2 largest business cities. See the data notes for more details.
COUNTRY TABLES 173 
 Reform making it easier to do business  Change making it more difficult to do business 
BENIN Sub-Saharan Africa GNI per capita (US$) 790 
Ease of doing business rank (1–189) 151 Overall distance to frontier (DTF) score (0–100) 51.10 Population (m) 10.3 
 Starting a business (rank) 117 Registering property (rank) 165  Trading across borders (rank) 121 
DTF score for starting a business (0–100) 80.91 DTF score for registering property (0–100) 46.61 DTF score for trading across borders (0–100) 66.45 
Procedures (number) 7 Procedures (number) 4 Documents to export (number) 7 
Time (days) 12 Time (days) 120 Time to export (days) 25 
Cost (% of income per capita) 55.8 Cost (% of property value) 11.7 Cost to export (US$ per container) 1,052 
Minimum capital (% of income per capita) 6.3 Documents to import (number) 7 
Getting credit (rank) 116 Time to import (days) 25 
Dealing with construction permits (rank) 64 DTF score for getting credit (0–100) 35.00 Cost to import (US$ per container) 1,487 
DTF score for dealing with construction permits (0–100) 75.87 Strength of legal rights index (0–12) 6 
Procedures (number) 13 Depth of credit information index (0–8) 1  Enforcing contracts (rank) 167 
Time (days) 111 Credit bureau coverage (% of adults) 0.0 DTF score for enforcing contracts (0–100) 37.73 
Cost (% of warehouse value) 3.2 Credit registry coverage (% of adults) 10.0 Procedures (number) 41 
Time (days) 750 
Getting electricity (rank) 173  Protecting minority investors (rank) 135 Cost (% of claim) 64.7 
DTF score for getting electricity (0–100) 45.12 DTF score for protecting minority investors (0–100) 44.17 
Procedures (number) 5 Extent of conflict of interest regulation index (0–10) 4.3 Resolving insolvency (rank) 115 
Time (days) 90 Extent of shareholder governance index (0–10) 4.5 DTF score for resolving insolvency (0–100) 38.08 
Cost (% of income per capita) 14,654.9 Strength of minority investor protection index (0–10) 4.4 Time (years) 4.0 
Cost (% of estate) 22 
Paying taxes (rank) 178 Recovery rate (cents on the dollar) 18.5 
DTF score for paying taxes (0–100) 41.02 Strength of insolvency framework index (0–16) 9 
Payments (number per year) 55 
Time (hours per year) 270 
Total tax rate (% of profit) 63.3 
BHUTAN South Asia GNI per capita (US$) 2,460 
Ease of doing business rank (1–189) 125 Overall distance to frontier (DTF) score (0–100) 57.47 Population (m) 0.8 
Starting a business (rank) 92 Registering property (rank) 86 Trading across borders (rank) 165 
DTF score for starting a business (0–100) 85.01 DTF score for registering property (0–100) 68.82 DTF score for trading across borders (0–100) 43.10 
Procedures (number) 8 Procedures (number) 3 Documents to export (number) 9 
Time (days) 17 Time (days) 92 Time to export (days) 38 
Cost (% of income per capita) 4.4 Cost (% of property value) 5.0 Cost to export (US$ per container) 2,230 
Minimum capital (% of income per capita) 0.0 Documents to import (number) 11 
Getting credit (rank) 71 Time to import (days) 37 
Dealing with construction permits (rank) 131 DTF score for getting credit (0–100) 50.00 Cost to import (US$ per container) 2,330 
DTF score for dealing with construction permits (0–100) 64.51 Strength of legal rights index (0–12) 4 
Procedures (number) 21 Depth of credit information index (0–8) 6 Enforcing contracts (rank) 74 
Time (days) 150 Credit bureau coverage (% of adults) 18.0 DTF score for enforcing contracts (0–100) 61.42 
Cost (% of warehouse value) 1.3 Credit registry coverage (% of adults) 0.0 Procedures (number) 47 
Time (days) 225 
Getting electricity (rank) 72 Protecting minority investors (rank) 104 Cost (% of claim) 23.1 
DTF score for getting electricity (0–100) 78.28 DTF score for protecting minority investors (0–100) 50.00 
Procedures (number) 5 Extent of conflict of interest regulation index (0–10) 4.0 Resolving insolvency (rank) 189 
Time (days) 74 Extent of shareholder governance index (0–10) 6.0 DTF score for resolving insolvency (0–100) 0.00 
Cost (% of income per capita) 606.5 Strength of minority investor protection index (0–10) 5.0 Time (years) NO PRACTICE 
Cost (% of estate) NO PRACTICE 
Paying taxes (rank) 86 Recovery rate (cents on the dollar) 0.0 
DTF score for paying taxes (0–100) 73.55 Strength of insolvency framework index (0–16) 0 
Payments (number per year) 19 
Time (hours per year) 274 
Total tax rate (% of profit) 38.7 
BOLIVIA Latin America  Caribbean GNI per capita (US$) 2,550 
Ease of doing business rank (1–189) 157 Overall distance to frontier (DTF) score (0–100) 49.95 Population (m) 10.7 
Starting a business (rank) 171 Registering property (rank) 130  Trading across borders (rank) 125 
DTF score for starting a business (0–100) 59.07 DTF score for registering property (0–100) 58.55 DTF score for trading across borders (0–100) 65.79 
Procedures (number) 15 Procedures (number) 7 Documents to export (number) 7 
Time (days) 49 Time (days) 91 Time to export (days) 22 
Cost (% of income per capita) 64.4 Cost (% of property value) 4.7 Cost to export (US$ per container) 1,440 
Minimum capital (% of income per capita) 1.6 Documents to import (number) 6 
Getting credit (rank) 116 Time to import (days) 28 
Dealing with construction permits (rank) 129 DTF score for getting credit (0–100) 35.00 Cost to import (US$ per container) 1,745 
DTF score for dealing with construction permits (0–100) 64.97 Strength of legal rights index (0–12) 0 
Procedures (number) 12 Depth of credit information index (0–8) 7 Enforcing contracts (rank) 111 
Time (days) 275 Credit bureau coverage (% of adults) 39.0 DTF score for enforcing contracts (0–100) 54.93 
Cost (% of warehouse value) 1.1 Credit registry coverage (% of adults) 15.1 Procedures (number) 40 
Time (days) 591 
Getting electricity (rank) 127 Protecting minority investors (rank) 160 Cost (% of claim) 33.2 
DTF score for getting electricity (0–100) 65.33 DTF score for protecting minority investors (0–100) 40.83 
Procedures (number) 8 Extent of conflict of interest regulation index (0–10) 4.0 Resolving insolvency (rank) 96 
Time (days) 42 Extent of shareholder governance index (0–10) 4.2 DTF score for resolving insolvency (0–100) 42.82 
Cost (% of income per capita) 829.3 Strength of minority investor protection index (0–10) 4.1 Time (years) 1.8 
Cost (% of estate) 15 
Paying taxes (rank) 189 Recovery rate (cents on the dollar) 38.9 
DTF score for paying taxes (0–100) 12.18 Strength of insolvency framework index (0–16) 7 
Payments (number per year) 42 
Time (hours per year) 1,025 
Total tax rate (% of profit) 83.7 
Note: For resolving insolvency, an economy for which “no practice” is recorded for time and cost receives a score of 0 on the strength of insolvency framework index even if its legal framework includes provisions related to 
insolvency proceedings (liquidation or reorganization). Most indicator sets refer to a case scenario in the largest business city of an economy, except for 11 economies for which the data are a population-weighted average 
for the 2 largest business cities. See the data notes for more details.
174 DOING BUSINESS 2015 
 Reform making it easier to do business  Change making it more difficult to do business 
BOSNIA AND HERZEGOVINA Europe  Central Asia GNI per capita (US$) 4,740 
Ease of doing business rank (1–189) 107 Overall distance to frontier (DTF) score (0–100) 60.55 Population (m) 3.8 
Starting a business (rank) 147 Registering property (rank) 88 Trading across borders (rank) 104 
DTF score for starting a business (0–100) 72.51 DTF score for registering property (0–100) 68.12 DTF score for trading across borders (0–100) 69.76 
Procedures (number) 11 Procedures (number) 7 Documents to export (number) 8 
Time (days) 37 Time (days) 24 Time to export (days) 16 
Cost (% of income per capita) 14.6 Cost (% of property value) 5.2 Cost to export (US$ per container) 1,260 
Minimum capital (% of income per capita) 28.6 Documents to import (number) 8 
Getting credit (rank) 36 Time to import (days) 13 
Dealing with construction permits (rank) 182 DTF score for getting credit (0–100) 65.00 Cost to import (US$ per container) 1,200 
DTF score for dealing with construction permits (0–100) 39.10 Strength of legal rights index (0–12) 7 
Procedures (number) 15 Depth of credit information index (0–8) 6 Enforcing contracts (rank) 95 
Time (days) 179 Credit bureau coverage (% of adults) 8.1 DTF score for enforcing contracts (0–100) 57.64 
Cost (% of warehouse value) 19.7 Credit registry coverage (% of adults) 39.7 Procedures (number) 37 
Time (days) 595 
Getting electricity (rank) 163 Protecting minority investors (rank) 83 Cost (% of claim) 34.0 
DTF score for getting electricity (0–100) 54.72 DTF score for protecting minority investors (0–100) 54.17 
Procedures (number) 8 Extent of conflict of interest regulation index (0–10) 4.7 Resolving insolvency (rank) 34 
Time (days) 125 Extent of shareholder governance index (0–10) 6.2 DTF score for resolving insolvency (0–100) 66.21 
Cost (% of income per capita) 484.4 Strength of minority investor protection index (0–10) 5.4 Time (years) 3.3 
Cost (% of estate) 9 
Paying taxes (rank) 151 Recovery rate (cents on the dollar) 35.9 
DTF score for paying taxes (0–100) 58.22 Strength of insolvency framework index (0–16) 15 
Payments (number per year) 45 
Time (hours per year) 407 
Total tax rate (% of profit) 23.3 
BOTSWANA Sub-Saharan Africa GNI per capita (US$) 7,730 
Ease of doing business rank (1–189) 74 Overall distance to frontier (DTF) score (0–100) 64.87 Population (m) 2.0 
Starting a business (rank) 149 Registering property (rank) 51 Trading across borders (rank) 157 
DTF score for starting a business (0–100) 71.68 DTF score for registering property (0–100) 78.13 DTF score for trading across borders (0–100) 52.02 
Procedures (number) 10 Procedures (number) 4 Documents to export (number) 6 
Time (days) 60 Time (days) 15 Time to export (days) 27 
Cost (% of income per capita) 1.0 Cost (% of property value) 5.1 Cost to export (US$ per container) 3,145 
Minimum capital (% of income per capita) 0.0 Documents to import (number) 6 
Getting credit (rank) 61 Time to import (days) 35 
Dealing with construction permits (rank) 93 DTF score for getting credit (0–100) 55.00 Cost to import (US$ per container) 3,710 
DTF score for dealing with construction permits (0–100) 71.43 Strength of legal rights index (0–12) 5 
Procedures (number) 20 Depth of credit information index (0–8) 6 Enforcing contracts (rank) 61 
Time (days) 110 Credit bureau coverage (% of adults) 51.7 DTF score for enforcing contracts (0–100) 64.02 
Cost (% of warehouse value) 0.3 Credit registry coverage (% of adults) 0.0 Procedures (number) 28 
Time (days) 625 
Getting electricity (rank) 103 Protecting minority investors (rank) 106 Cost (% of claim) 39.8 
DTF score for getting electricity (0–100) 72.56 DTF score for protecting minority investors (0–100) 49.17 
Procedures (number) 5 Extent of conflict of interest regulation index (0–10) 6.0 Resolving insolvency (rank) 49 
Time (days) 121 Extent of shareholder governance index (0–10) 3.8 DTF score for resolving insolvency (0–100) 57.17 
Cost (% of income per capita) 340.4 Strength of minority investor protection index (0–10) 4.9 Time (years) 1.7 
Cost (% of estate) 18 
Paying taxes (rank) 67 Recovery rate (cents on the dollar) 62.7 
DTF score for paying taxes (0–100) 77.47 Strength of insolvency framework index (0–16) 7.5 
Payments (number per year) 34 
Time (hours per year) 152 
Total tax rate (% of profit) 25.3 
BRAZIL Latin America  Caribbean GNI per capita (US$) 11,690 
Ease of doing business rank (1–189) 120 Overall distance to frontier (DTF) score (0–100) 58.01 Population (m) 200.4 
Starting a business (rank) 167 Registering property (rank) 138 Trading across borders (rank) 123 
DTF score for starting a business (0–100) 63.37 DTF score for registering property (0–100) 56.18 DTF score for trading across borders (0–100) 66.11 
Procedures (number) 11.6 Procedures (number) 13.6 Documents to export (number) 6 
Time (days) 83.6 Time (days) 31.7 Time to export (days) 13.4 
Cost (% of income per capita) 4.3 Cost (% of property value) 2.5 Cost to export (US$ per container) 2,323 
Minimum capital (% of income per capita) 0.0 Documents to import (number) 8 
Getting credit (rank) 89 Time to import (days) 17 
Dealing with construction permits (rank) 174 DTF score for getting credit (0–100) 45.00 Cost to import (US$ per container) 2,323 
DTF score for dealing with construction permits (0–100) 48.31 Strength of legal rights index (0–12) 2 
Procedures (number) 18.2 Depth of credit information index (0–8) 7 Enforcing contracts (rank) 118 
Time (days) 426.1 Credit bureau coverage (% of adults) 63.6 DTF score for enforcing contracts (0–100) 53.60 
Cost (% of warehouse value) 0.4 Credit registry coverage (% of adults) 52.5 Procedures (number) 43.6 
Time (days) 731 
Getting electricity (rank) 19 Protecting minority investors (rank) 35 Cost (% of claim) 16.5 
DTF score for getting electricity (0–100) 89.20 DTF score for protecting minority investors (0–100) 62.50 
Procedures (number) 4 Extent of conflict of interest regulation index (0–10) 5.7 Resolving insolvency (rank) 55 
Time (days) 53.3 Extent of shareholder governance index (0–10) 6.8 DTF score for resolving insolvency (0–100) 54.52 
Cost (% of income per capita) 31.6 Strength of minority investor protection index (0–10) 6.3 Time (years) 4.0 
Cost (% of estate) 12 
Paying taxes (rank) 177 Recovery rate (cents on the dollar) 25.8 
DTF score for paying taxes (0–100) 41.31 Strength of insolvency framework index (0–16) 13 
Payments (number per year) 9 
Time (hours per year) 2,600 
Total tax rate (% of profit) 69.0 
Note: For resolving insolvency, an economy for which “no practice” is recorded for time and cost receives a score of 0 on the strength of insolvency framework index even if its legal framework includes provisions related to 
insolvency proceedings (liquidation or reorganization). Most indicator sets refer to a case scenario in the largest business city of an economy, except for 11 economies for which the data are a population-weighted average 
for the 2 largest business cities. See the data notes for more details.
COUNTRY TABLES 175 
 Reform making it easier to do business  Change making it more difficult to do business 
BRUNEI DARUSSALAM East Asia  Pacific GNI per capita (US$) 39,943 
Ease of doing business rank (1–189) 101 Overall distance to frontier (DTF) score (0–100) 61.26 Population (m) 0.4 
Starting a business (rank) 179 Registering property (rank) 162 Trading across borders (rank) 46 
DTF score for starting a business (0–100) 53.12 DTF score for registering property (0–100) 48.65 DTF score for trading across borders (0–100) 80.87 
Procedures (number) 15 Procedures (number) 7 Documents to export (number) 5 
Time (days) 101 Time (days) 298 Time to export (days) 19 
Cost (% of income per capita) 10.4 Cost (% of property value) 0.6 Cost to export (US$ per container) 705 
Minimum capital (% of income per capita) 0.0 Documents to import (number) 5 
Getting credit (rank) 89 Time to import (days) 15 
 Dealing with construction permits (rank) 53 DTF score for getting credit (0–100) 45.00 Cost to import (US$ per container) 770 
DTF score for dealing with construction permits (0–100) 77.93 Strength of legal rights index (0–12) 4 
Procedures (number) 17 Depth of credit information index (0–8) 5 Enforcing contracts (rank) 139 
Time (days) 88 Credit bureau coverage (% of adults) 0.0 DTF score for enforcing contracts (0–100) 47.76 
Cost (% of warehouse value) 0.1 Credit registry coverage (% of adults) 56.6 Procedures (number) 47 
Time (days) 540 
Getting electricity (rank) 42 Protecting minority investors (rank) 110 Cost (% of claim) 36.6 
DTF score for getting electricity (0–100) 83.22 DTF score for protecting minority investors (0–100) 47.50 
Procedures (number) 5 Extent of conflict of interest regulation index (0–10) 4.7 Resolving insolvency (rank) 88 
Time (days) 56 Extent of shareholder governance index (0–10) 4.8 DTF score for resolving insolvency (0–100) 44.17 
Cost (% of income per capita) 38.6 Strength of minority investor protection index (0–10) 4.8 Time (years) 2.5 
Cost (% of estate) 4 
 Paying taxes (rank) 30 Recovery rate (cents on the dollar) 47.2 
DTF score for paying taxes (0–100) 84.40 Strength of insolvency framework index (0–16) 6 
Payments (number per year) 27 
Time (hours per year) 93 
Total tax rate (% of profit) 15.8 
BULGARIA Europe  Central Asia GNI per capita (US$) 7,030 
Ease of doing business rank (1–189) 38 Overall distance to frontier (DTF) score (0–100) 71.80 Population (m) 7.3 
 Starting a business (rank) 49 Registering property (rank) 57 Trading across borders (rank) 57 
DTF score for starting a business (0–100) 91.09 DTF score for registering property (0–100) 75.36 DTF score for trading across borders (0–100) 78.34 
Procedures (number) 4 Procedures (number) 7 Documents to export (number) 4 
Time (days) 18 Time (days) 10 Time to export (days) 18 
Cost (% of income per capita) 0.8 Cost (% of property value) 2.9 Cost to export (US$ per container) 1,375 
Minimum capital (% of income per capita) 0.0 Documents to import (number) 5 
Getting credit (rank) 23 Time to import (days) 17 
Dealing with construction permits (rank) 101 DTF score for getting credit (0–100) 70.00 Cost to import (US$ per container) 1,365 
DTF score for dealing with construction permits (0–100) 69.85 Strength of legal rights index (0–12) 9 
Procedures (number) 16 Depth of credit information index (0–8) 5 Enforcing contracts (rank) 75 
Time (days) 110 Credit bureau coverage (% of adults) 0.0 DTF score for enforcing contracts (0–100) 61.27 
Cost (% of warehouse value) 4.5 Credit registry coverage (% of adults) 62.9 Procedures (number) 38 
Time (days) 564 
Getting electricity (rank) 125 Protecting minority investors (rank) 14 Cost (% of claim) 23.8 
DTF score for getting electricity (0–100) 65.78 DTF score for protecting minority investors (0–100) 68.33 
Procedures (number) 6 Extent of conflict of interest regulation index (0–10) 6.3 Resolving insolvency (rank) 38 
Time (days) 130 Extent of shareholder governance index (0–10) 7.3 DTF score for resolving insolvency (0–100) 64.75 
Cost (% of income per capita) 320.4 Strength of minority investor protection index (0–10) 6.8 Time (years) 3.3 
Cost (% of estate) 9 
Paying taxes (rank) 89 Recovery rate (cents on the dollar) 33.2 
DTF score for paying taxes (0–100) 73.18 Strength of insolvency framework index (0–16) 15 
Payments (number per year) 13 
Time (hours per year) 454 
Total tax rate (% of profit) 27.0 
BURKINA FASO Sub-Saharan Africa GNI per capita (US$) 670 
Ease of doing business rank (1–189) 167 Overall distance to frontier (DTF) score (0–100) 48.36 Population (m) 16.9 
Starting a business (rank) 153 Registering property (rank) 147 Trading across borders (rank) 174 
DTF score for starting a business (0–100) 69.06 DTF score for registering property (0–100) 53.79 DTF score for trading across borders (0–100) 29.51 
Procedures (number) 3 Procedures (number) 4 Documents to export (number) 10 
Time (days) 13 Time (days) 67 Time to export (days) 41 
Cost (% of income per capita) 44.7 Cost (% of property value) 12.3 Cost to export (US$ per container) 2,305 
Minimum capital (% of income per capita) 308.5 Documents to import (number) 12 
Getting credit (rank) 131 Time to import (days) 49 
Dealing with construction permits (rank) 75 DTF score for getting credit (0–100) 30.00 Cost to import (US$ per container) 4,330 
DTF score for dealing with construction permits (0–100) 74.55 Strength of legal rights index (0–12) 6 
Procedures (number) 11 Depth of credit information index (0–8) 0 Enforcing contracts (rank) 153 
Time (days) 112 Credit bureau coverage (% of adults) 0.0 DTF score for enforcing contracts (0–100) 43.83 
Cost (% of warehouse value) 5.5 Credit registry coverage (% of adults) 2.0 Procedures (number) 37 
Time (days) 446 
Getting electricity (rank) 177  Protecting minority investors (rank) 122 Cost (% of claim) 81.7 
DTF score for getting electricity (0–100) 40.82 DTF score for protecting minority investors (0–100) 45.83 
Procedures (number) 4 Extent of conflict of interest regulation index (0–10) 4.7 Resolving insolvency (rank) 115 
Time (days) 158 Extent of shareholder governance index (0–10) 4.5 DTF score for resolving insolvency (0–100) 38.08 
Cost (% of income per capita) 11,057.1 Strength of minority investor protection index (0–10) 4.6 Time (years) 4.0 
Cost (% of estate) 21 
Paying taxes (rank) 152 Recovery rate (cents on the dollar) 18.5 
DTF score for paying taxes (0–100) 58.08 Strength of insolvency framework index (0–16) 9 
Payments (number per year) 45 
Time (hours per year) 270 
Total tax rate (% of profit) 41.3 
Note: For resolving insolvency, an economy for which “no practice” is recorded for time and cost receives a score of 0 on the strength of insolvency framework index even if its legal framework includes provisions related to 
insolvency proceedings (liquidation or reorganization). Most indicator sets refer to a case scenario in the largest business city of an economy, except for 11 economies for which the data are a population-weighted average 
for the 2 largest business cities. See the data notes for more details.
176 DOING BUSINESS 2015 
 Reform making it easier to do business  Change making it more difficult to do business 
BURUNDI Sub-Saharan Africa GNI per capita (US$) 280 
Ease of doing business rank (1–189) 152 Overall distance to frontier (DTF) score (0–100) 51.07 Population (m) 10.2 
Starting a business (rank) 18 Registering property (rank) 48 Trading across borders (rank) 169 
DTF score for starting a business (0–100) 94.25 DTF score for registering property (0–100) 78.38 DTF score for trading across borders (0–100) 37.50 
Procedures (number) 3 Procedures (number) 5 Documents to export (number) 9 
Time (days) 5 Time (days) 23 Time to export (days) 32 
Cost (% of income per capita) 13.4 Cost (% of property value) 3.2 Cost to export (US$ per container) 2,905 
Minimum capital (% of income per capita) 0.0 Documents to import (number) 9 
Getting credit (rank) 171 Time to import (days) 43 
Dealing with construction permits (rank) 133 DTF score for getting credit (0–100) 10.00 Cost to import (US$ per container) 4,420 
DTF score for dealing with construction permits (0–100) 64.16 Strength of legal rights index (0–12) 2 
Procedures (number) 14 Depth of credit information index (0–8) 0 Enforcing contracts (rank) 158 
Time (days) 99 Credit bureau coverage (% of adults) 0.0 DTF score for enforcing contracts (0–100) 42.15 
Cost (% of warehouse value) 10.1 Credit registry coverage (% of adults) 3.9 Procedures (number) 44 
Time (days) 832 
Getting electricity (rank) 182 Protecting minority investors (rank) 94 Cost (% of claim) 38.6 
DTF score for getting electricity (0–100) 35.27 DTF score for protecting minority investors (0–100) 51.67 
Procedures (number) 5 Extent of conflict of interest regulation index (0–10) 6.3 Resolving insolvency (rank) 144 
Time (days) 158 Extent of shareholder governance index (0–10) 4.0 DTF score for resolving insolvency (0–100) 30.55 
Cost (% of income per capita) 16,367.3 Strength of minority investor protection index (0–10) 5.2 Time (years) 5.0 
Cost (% of estate) 30 
Paying taxes (rank) 124 Recovery rate (cents on the dollar) 7.4 
DTF score for paying taxes (0–100) 66.78 Strength of insolvency framework index (0–16) 8.5 
Payments (number per year) 25 
Time (hours per year) 274 
Total tax rate (% of profit) 45.7 
CABO VERDE Sub-Saharan Africa GNI per capita (US$) 3,630 
Ease of doing business rank (1–189) 122 Overall distance to frontier (DTF) score (0–100) 57.94 Population (m) 0.5 
Starting a business (rank) 78 Registering property (rank) 62 Trading across borders (rank) 101 
DTF score for starting a business (0–100) 87.00 DTF score for registering property (0–100) 74.50 DTF score for trading across borders (0–100) 70.92 
Procedures (number) 7 Procedures (number) 6 Documents to export (number) 7 
Time (days) 10 Time (days) 22 Time to export (days) 20 
Cost (% of income per capita) 14.3 Cost (% of property value) 3.7 Cost to export (US$ per container) 1,125 
Minimum capital (% of income per capita) 0.0 Documents to import (number) 7 
 Getting credit (rank) 104 Time to import (days) 20 
Dealing with construction permits (rank) 114 DTF score for getting credit (0–100) 40.00 Cost to import (US$ per container) 925 
DTF score for dealing with construction permits (0–100) 67.53 Strength of legal rights index (0–12) 2 
Procedures (number) 16 Depth of credit information index (0–8) 6 Enforcing contracts (rank) 39 
Time (days) 140 Credit bureau coverage (% of adults) 0.0 DTF score for enforcing contracts (0–100) 67.61 
Cost (% of warehouse value) 4.1 Credit registry coverage (% of adults) 16.7 Procedures (number) 37 
Time (days) 425 
Getting electricity (rank) 133 Protecting minority investors (rank) 170 Cost (% of claim) 19.8 
DTF score for getting electricity (0–100) 63.80 DTF score for protecting minority investors (0–100) 35.00 
Procedures (number) 7 Extent of conflict of interest regulation index (0–10) 4.0 Resolving insolvency (rank) 189 
Time (days) 88 Extent of shareholder governance index (0–10) 3.0 DTF score for resolving insolvency (0–100) 0.00 
Cost (% of income per capita) 932.2 Strength of minority investor protection index (0–10) 3.5 Time (years) NO PRACTICE 
Cost (% of estate) NO PRACTICE 
Paying taxes (rank) 91 Recovery rate (cents on the dollar) 0.0 
DTF score for paying taxes (0–100) 73.05 Strength of insolvency framework index (0–16) 0 
Payments (number per year) 30 
Time (hours per year) 186 
Total tax rate (% of profit) 36.5 
CAMBODIA East Asia  Pacific GNI per capita (US$) 950 
Ease of doing business rank (1–189) 135 Overall distance to frontier (DTF) score (0–100) 55.33 Population (m) 15.1 
Starting a business (rank) 184 Registering property (rank) 100 Trading across borders (rank) 124 
DTF score for starting a business (0–100) 41.23 DTF score for registering property (0–100) 64.83 DTF score for trading across borders (0–100) 65.92 
Procedures (number) 11 Procedures (number) 7 Documents to export (number) 8 
Time (days) 101 Time (days) 56 Time to export (days) 22 
Cost (% of income per capita) 139.5 Cost (% of property value) 4.4 Cost to export (US$ per container) 795 
Minimum capital (% of income per capita) 26.1 Documents to import (number) 9 
Getting credit (rank) 12 Time to import (days) 24 
Dealing with construction permits (rank) 183 DTF score for getting credit (0–100) 80.00 Cost to import (US$ per container) 930 
DTF score for dealing with construction permits (0–100) 35.54 Strength of legal rights index (0–12) 11 
Procedures (number) 20 Depth of credit information index (0–8) 5 Enforcing contracts (rank) 178 
Time (days) 652 Credit bureau coverage (% of adults) 29.3 DTF score for enforcing contracts (0–100) 32.79 
Cost (% of warehouse value) 6.7 Credit registry coverage (% of adults) 0.0 Procedures (number) 44 
Time (days) 483 
Getting electricity (rank) 139 Protecting minority investors (rank) 92 Cost (% of claim) 103.4 
DTF score for getting electricity (0–100) 62.44 DTF score for protecting minority investors (0–100) 52.50 
Procedures (number) 4 Extent of conflict of interest regulation index (0–10) 5.7 Resolving insolvency (rank) 84 
Time (days) 168 Extent of shareholder governance index (0–10) 4.8 DTF score for resolving insolvency (0–100) 45.02 
Cost (% of income per capita) 2,495.4 Strength of minority investor protection index (0–10) 5.3 Time (years) 6.0 
Cost (% of estate) 28 
Paying taxes (rank) 90 Recovery rate (cents on the dollar) 8.2 
DTF score for paying taxes (0–100) 73.06 Strength of insolvency framework index (0–16) 13 
Payments (number per year) 40 
Time (hours per year) 173 
Total tax rate (% of profit) 21.0 
Note: For resolving insolvency, an economy for which “no practice” is recorded for time and cost receives a score of 0 on the strength of insolvency framework index even if its legal framework includes provisions related to 
insolvency proceedings (liquidation or reorganization). Most indicator sets refer to a case scenario in the largest business city of an economy, except for 11 economies for which the data are a population-weighted average 
for the 2 largest business cities. See the data notes for more details.
COUNTRY TABLES 177 
 Reform making it easier to do business  Change making it more difficult to do business 
CAMEROON Sub-Saharan Africa GNI per capita (US$) 1,270 
Ease of doing business rank (1–189) 158 Overall distance to frontier (DTF) score (0–100) 49.85 Population (m) 22.3 
Starting a business (rank) 133 Registering property (rank) 172 Trading across borders (rank) 160 
DTF score for starting a business (0–100) 76.41 DTF score for registering property (0–100) 42.00 DTF score for trading across borders (0–100) 49.83 
Procedures (number) 5 Procedures (number) 5 Documents to export (number) 11 
Time (days) 15 Time (days) 86 Time to export (days) 23 
Cost (% of income per capita) 34.3 Cost (% of property value) 19.0 Cost to export (US$ per container) 1,379 
Minimum capital (% of income per capita) 156.4 Documents to import (number) 12 
 Getting credit (rank) 116 Time to import (days) 25 
Dealing with construction permits (rank) 166 DTF score for getting credit (0–100) 35.00 Cost to import (US$ per container) 2,267 
DTF score for dealing with construction permits (0–100) 52.87 Strength of legal rights index (0–12) 6 
Procedures (number) 15 Depth of credit information index (0–8) 1 Enforcing contracts (rank) 159 
Time (days) 136 Credit bureau coverage (% of adults) 0.0 DTF score for enforcing contracts (0–100) 42.11 
Cost (% of warehouse value) 13.9 Credit registry coverage (% of adults) 5.4 Procedures (number) 42 
Time (days) 800 
Getting electricity (rank) 52  Protecting minority investors (rank) 117 Cost (% of claim) 46.6 
DTF score for getting electricity (0–100) 80.84 DTF score for protecting minority investors (0–100) 46.67 
Procedures (number) 4 Extent of conflict of interest regulation index (0–10) 5.0 Resolving insolvency (rank) 123 
Time (days) 64 Extent of shareholder governance index (0–10) 4.3 DTF score for resolving insolvency (0–100) 36.42 
Cost (% of income per capita) 1,686.3 Strength of minority investor protection index (0–10) 4.7 Time (years) 2.8 
Cost (% of estate) 34 
Paying taxes (rank) 181 Recovery rate (cents on the dollar) 15.4 
DTF score for paying taxes (0–100) 36.34 Strength of insolvency framework index (0–16) 9 
Payments (number per year) 44 
Time (hours per year) 630 
Total tax rate (% of profit) 48.8 
CANADA OECD high income GNI per capita (US$) 52,200 
Ease of doing business rank (1–189) 16 Overall distance to frontier (DTF) score (0–100) 79.09 Population (m) 35.2 
Starting a business (rank) 2 Registering property (rank) 55 Trading across borders (rank) 23 
DTF score for starting a business (0–100) 98.82 DTF score for registering property (0–100) 76.20 DTF score for trading across borders (0–100) 86.07 
Procedures (number) 1 Procedures (number) 6 Documents to export (number) 3 
Time (days) 5 Time (days) 16.5 Time to export (days) 8 
Cost (% of income per capita) 0.4 Cost (% of property value) 3.3 Cost to export (US$ per container) 1,680 
Minimum capital (% of income per capita) 0.0 Documents to import (number) 3 
Getting credit (rank) 7 Time to import (days) 10 
Dealing with construction permits (rank) 118 DTF score for getting credit (0–100) 85.00 Cost to import (US$ per container) 1,680 
DTF score for dealing with construction permits (0–100) 67.12 Strength of legal rights index (0–12) 9 
Procedures (number) 12 Depth of credit information index (0–8) 8 Enforcing contracts (rank) 65 
Time (days) 249 Credit bureau coverage (% of adults) 100.0 DTF score for enforcing contracts (0–100) 63.76 
Cost (% of warehouse value) 1.3 Credit registry coverage (% of adults) 0.0 Procedures (number) 36 
Time (days) 570 
Getting electricity (rank) 150 Protecting minority investors (rank) 7 Cost (% of claim) 22.3 
DTF score for getting electricity (0–100) 59.27 DTF score for protecting minority investors (0–100) 72.50 
Procedures (number) 7 Extent of conflict of interest regulation index (0–10) 8.7 Resolving insolvency (rank) 6 
Time (days) 142 Extent of shareholder governance index (0–10) 5.8 DTF score for resolving insolvency (0–100) 89.17 
Cost (% of income per capita) 131.0 Strength of minority investor protection index (0–10) 7.3 Time (years) 0.8 
Cost (% of estate) 7 
Paying taxes (rank) 9 Recovery rate (cents on the dollar) 87.3 
DTF score for paying taxes (0–100) 93.00 Strength of insolvency framework index (0–16) 13.5 
Payments (number per year) 8 
Time (hours per year) 131 
Total tax rate (% of profit) 21.0 
CENTRAL AFRICAN REPUBLIC Sub-Saharan Africa GNI per capita (US$) 320 
Ease of doing business rank (1–189) 187 Overall distance to frontier (DTF) score (0–100) 34.47 Population (m) 4.6 
Starting a business (rank) 187 Registering property (rank) 150  Trading across borders (rank) 186 
DTF score for starting a business (0–100) 34.30 DTF score for registering property (0–100) 52.46 DTF score for trading across borders (0–100) 6.48 
Procedures (number) 8 Procedures (number) 5 Documents to export (number) 9 
Time (days) 22 Time (days) 75 Time to export (days) 46 
Cost (% of income per capita) 226.0 Cost (% of property value) 11.1 Cost to export (US$ per container) 5,490 
Minimum capital (% of income per capita) 607.3 Documents to import (number) 17 
Getting credit (rank) 131 Time to import (days) 68 
Dealing with construction permits (rank) 145 DTF score for getting credit (0–100) 30.00 Cost to import (US$ per container) 6,335 
DTF score for dealing with construction permits (0–100) 61.83 Strength of legal rights index (0–12) 6 
Procedures (number) 15 Depth of credit information index (0–8) 0 Enforcing contracts (rank) 182 
Time (days) 200 Credit bureau coverage (% of adults) 0.0 DTF score for enforcing contracts (0–100) 31.62 
Cost (% of warehouse value) 4.9 Credit registry coverage (% of adults) 2.6 Procedures (number) 43 
Time (days) 660 
Getting electricity (rank) 186  Protecting minority investors (rank) 135 Cost (% of claim) 82.0 
DTF score for getting electricity (0–100) 32.27 DTF score for protecting minority investors (0–100) 44.17 
Procedures (number) 7 Extent of conflict of interest regulation index (0–10) 4.3 Resolving insolvency (rank) 152 
Time (days) 102 Extent of shareholder governance index (0–10) 4.5 DTF score for resolving insolvency (0–100) 28.13 
Cost (% of income per capita) 17,232.4 Strength of minority investor protection index (0–10) 4.4 Time (years) 4.8 
Cost (% of estate) 76 
Paying taxes (rank) 185 Recovery rate (cents on the dollar) 0.0 
DTF score for paying taxes (0–100) 23.47 Strength of insolvency framework index (0–16) 9 
Payments (number per year) 56 
Time (hours per year) 483 
Total tax rate (% of profit) 73.3 
Note: For resolving insolvency, an economy for which “no practice” is recorded for time and cost receives a score of 0 on the strength of insolvency framework index even if its legal framework includes provisions related to 
insolvency proceedings (liquidation or reorganization). Most indicator sets refer to a case scenario in the largest business city of an economy, except for 11 economies for which the data are a population-weighted average 
for the 2 largest business cities. See the data notes for more details.
178 DOING BUSINESS 2015 
 Reform making it easier to do business  Change making it more difficult to do business 
CHAD Sub-Saharan Africa GNI per capita (US$) 1,020 
Ease of doing business rank (1–189) 185 Overall distance to frontier (DTF) score (0–100) 37.25 Population (m) 12.8 
Starting a business (rank) 185 Registering property (rank) 166 Trading across borders (rank) 182 
DTF score for starting a business (0–100) 39.98 DTF score for registering property (0–100) 45.92 DTF score for trading across borders (0–100) 10.68 
Procedures (number) 9 Procedures (number) 6 Documents to export (number) 8 
Time (days) 60 Time (days) 44 Time to export (days) 70 
Cost (% of income per capita) 165.6 Cost (% of property value) 15.2 Cost to export (US$ per container) 6,615 
Minimum capital (% of income per capita) 201.7 Documents to import (number) 11 
Getting credit (rank) 131 Time to import (days) 90 
Dealing with construction permits (rank) 123 DTF score for getting credit (0–100) 30.00 Cost to import (US$ per container) 9,025 
DTF score for dealing with construction permits (0–100) 66.09 Strength of legal rights index (0–12) 6 
Procedures (number) 10 Depth of credit information index (0–8) 0 Enforcing contracts (rank) 149 
Time (days) 207 Credit bureau coverage (% of adults) 0.0 DTF score for enforcing contracts (0–100) 45.05 
Cost (% of warehouse value) 5.9 Credit registry coverage (% of adults) 2.1 Procedures (number) 41 
Time (days) 743 
Getting electricity (rank) 174  Protecting minority investors (rank) 146 Cost (% of claim) 45.7 
DTF score for getting electricity (0–100) 44.64 DTF score for protecting minority investors (0–100) 42.50 
Procedures (number) 6 Extent of conflict of interest regulation index (0–10) 4.0 Resolving insolvency (rank) 152 
Time (days) 67 Extent of shareholder governance index (0–10) 4.5 DTF score for resolving insolvency (0–100) 28.13 
Cost (% of income per capita) 7,677.5 Strength of minority investor protection index (0–10) 4.3 Time (years) 4.0 
Cost (% of estate) 60 
Paying taxes (rank) 186 Recovery rate (cents on the dollar) 0.0 
DTF score for paying taxes (0–100) 19.54 Strength of insolvency framework index (0–16) 9 
Payments (number per year) 54 
Time (hours per year) 732 
Total tax rate (% of profit) 63.5 
CHILE OECD high income GNI per capita (US$) 15,230 
Ease of doing business rank (1–189) 41 Overall distance to frontier (DTF) score (0–100) 71.24 Population (m) 17.6 
Starting a business (rank) 59 Registering property (rank) 45 Trading across borders (rank) 40 
DTF score for starting a business (0–100) 89.83 DTF score for registering property (0–100) 78.96 DTF score for trading across borders (0–100) 82.05 
Procedures (number) 7 Procedures (number) 6 Documents to export (number) 5 
Time (days) 5.5 Time (days) 28.5 Time to export (days) 15 
Cost (% of income per capita) 0.7 Cost (% of property value) 1.2 Cost to export (US$ per container) 910 
Minimum capital (% of income per capita) 0.0 Documents to import (number) 5 
Getting credit (rank) 71 Time to import (days) 12 
Dealing with construction permits (rank) 62 DTF score for getting credit (0–100) 50.00 Cost to import (US$ per container) 860 
DTF score for dealing with construction permits (0–100) 76.13 Strength of legal rights index (0–12) 4 
Procedures (number) 13 Depth of credit information index (0–8) 6 Enforcing contracts (rank) 64 
Time (days) 152 Credit bureau coverage (% of adults) 8.8 DTF score for enforcing contracts (0–100) 63.85 
Cost (% of warehouse value) 0.7 Credit registry coverage (% of adults) 44.7 Procedures (number) 36 
Time (days) 480 
Getting electricity (rank) 49 Protecting minority investors (rank) 56 Cost (% of claim) 28.6 
DTF score for getting electricity (0–100) 81.34 DTF score for protecting minority investors (0–100) 58.33 
Procedures (number) 6 Extent of conflict of interest regulation index (0–10) 6.7 Resolving insolvency (rank) 73 
Time (days) 30 Extent of shareholder governance index (0–10) 5.0 DTF score for resolving insolvency (0–100) 47.38 
Cost (% of income per capita) 62.1 Strength of minority investor protection index (0–10) 5.8 Time (years) 3.2 
Cost (% of estate) 15 
Paying taxes (rank) 29 Recovery rate (cents on the dollar) 30.0 
DTF score for paying taxes (0–100) 84.50 Strength of insolvency framework index (0–16) 10 
Payments (number per year) 7 
Time (hours per year) 291 
Total tax rate (% of profit) 27.9 
CHINA East Asia  Pacific GNI per capita (US$) 6,560 
Ease of doing business rank (1–189) 90 Overall distance to frontier (DTF) score (0–100) 62.58 Population (m) 1,357.4 
 Starting a business (rank) 128 Registering property (rank) 37 Trading across borders (rank) 98 
DTF score for starting a business (0–100) 77.43 DTF score for registering property (0–100) 80.67 DTF score for trading across borders (0–100) 71.68 
Procedures (number) 11 Procedures (number) 4 Documents to export (number) 8 
Time (days) 31.4 Time (days) 19.5 Time to export (days) 21 
Cost (% of income per capita) 0.9 Cost (% of property value) 3.6 Cost to export (US$ per container) 823 
Minimum capital (% of income per capita) 0.0 Documents to import (number) 5 
Getting credit (rank) 71 Time to import (days) 24 
Dealing with construction permits (rank) 179 DTF score for getting credit (0–100) 50.00 Cost to import (US$ per container) 800 
DTF score for dealing with construction permits (0–100) 43.75 Strength of legal rights index (0–12) 4 
Procedures (number) 22 Depth of credit information index (0–8) 6 Enforcing contracts (rank) 35 
Time (days) 244.3 Credit bureau coverage (% of adults) 0.0 DTF score for enforcing contracts (0–100) 68.21 
Cost (% of warehouse value) 7.6 Credit registry coverage (% of adults) 33.2 Procedures (number) 37 
Time (days) 452.8 
Getting electricity (rank) 124 Protecting minority investors (rank) 132 Cost (% of claim) 16.2 
DTF score for getting electricity (0–100) 66.35 DTF score for protecting minority investors (0–100) 45.00 
Procedures (number) 5.5 Extent of conflict of interest regulation index (0–10) 5.0 Resolving insolvency (rank) 53 
Time (days) 143.2 Extent of shareholder governance index (0–10) 4.0 DTF score for resolving insolvency (0–100) 55.31 
Cost (% of income per capita) 459.4 Strength of minority investor protection index (0–10) 4.5 Time (years) 1.7 
Cost (% of estate) 22 
 Paying taxes (rank) 120 Recovery rate (cents on the dollar) 36.0 
DTF score for paying taxes (0–100) 67.44 Strength of insolvency framework index (0–16) 11.5 
Payments (number per year) 7 
Time (hours per year) 261 
Total tax rate (% of profit) 64.6 
Note: For resolving insolvency, an economy for which “no practice” is recorded for time and cost receives a score of 0 on the strength of insolvency framework index even if its legal framework includes provisions related to 
insolvency proceedings (liquidation or reorganization). Most indicator sets refer to a case scenario in the largest business city of an economy, except for 11 economies for which the data are a population-weighted average 
for the 2 largest business cities. See the data notes for more details.
COUNTRY TABLES 179 
 Reform making it easier to do business  Change making it more difficult to do business 
COLOMBIA Latin America  Caribbean GNI per capita (US$) 7,560 
Ease of doing business rank (1–189) 34 Overall distance to frontier (DTF) score (0–100) 72.29 Population (m) 48.3 
Starting a business (rank) 84  Registering property (rank) 42 Trading across borders (rank) 93 
DTF score for starting a business (0–100) 86.13 DTF score for registering property (0–100) 79.33 DTF score for trading across borders (0–100) 72.69 
Procedures (number) 8 Procedures (number) 6 Documents to export (number) 4 
Time (days) 11 Time (days) 16 Time to export (days) 14 
Cost (% of income per capita) 7.5 Cost (% of property value) 2.0 Cost to export (US$ per container) 2,355 
Minimum capital (% of income per capita) 0.0 Documents to import (number) 6 
 Getting credit (rank) 2 Time to import (days) 13 
Dealing with construction permits (rank) 61 DTF score for getting credit (0–100) 95.00 Cost to import (US$ per container) 2,470 
DTF score for dealing with construction permits (0–100) 76.45 Strength of legal rights index (0–12) 12 
Procedures (number) 10 Depth of credit information index (0–8) 7 Enforcing contracts (rank) 168 
Time (days) 73 Credit bureau coverage (% of adults) 87.0 DTF score for enforcing contracts (0–100) 37.66 
Cost (% of warehouse value) 7.4 Credit registry coverage (% of adults) 0.0 Procedures (number) 33 
Time (days) 1,288 
Getting electricity (rank) 92 Protecting minority investors (rank) 10 Cost (% of claim) 47.9 
DTF score for getting electricity (0–100) 74.20 DTF score for protecting minority investors (0–100) 71.67 
Procedures (number) 5 Extent of conflict of interest regulation index (0–10) 8.0 Resolving insolvency (rank) 30 
Time (days) 105 Extent of shareholder governance index (0–10) 6.3 DTF score for resolving insolvency (0–100) 70.00 
Cost (% of income per capita) 504.4 Strength of minority investor protection index (0–10) 7.2 Time (years) 1.7 
Cost (% of estate) 6 
 Paying taxes (rank) 146 Recovery rate (cents on the dollar) 72.0 
DTF score for paying taxes (0–100) 59.71 Strength of insolvency framework index (0–16) 10 
Payments (number per year) 11 
Time (hours per year) 239 
Total tax rate (% of profit) 75.4 
COMOROS Sub-Saharan Africa GNI per capita (US$) 880 
Ease of doing business rank (1–189) 159 Overall distance to frontier (DTF) score (0–100) 49.56 Population (m) 0.7 
Starting a business (rank) 173 Registering property (rank) 105 Trading across borders (rank) 144 
DTF score for starting a business (0–100) 57.65 DTF score for registering property (0–100) 63.83 DTF score for trading across borders (0–100) 59.33 
Procedures (number) 8 Procedures (number) 4 Documents to export (number) 9 
Time (days) 15 Time (days) 30 Time to export (days) 31 
Cost (% of income per capita) 114.0 Cost (% of property value) 10.4 Cost to export (US$ per container) 1,295 
Minimum capital (% of income per capita) 226.7 Documents to import (number) 8 
Getting credit (rank) 131 Time to import (days) 24 
Dealing with construction permits (rank) 31 DTF score for getting credit (0–100) 30.00 Cost to import (US$ per container) 1,295 
DTF score for dealing with construction permits (0–100) 81.92 Strength of legal rights index (0–12) 6 
Procedures (number) 11 Depth of credit information index (0–8) 0 Enforcing contracts (rank) 177 
Time (days) 113 Credit bureau coverage (% of adults) 0.0 DTF score for enforcing contracts (0–100) 33.20 
Cost (% of warehouse value) 1.0 Credit registry coverage (% of adults) 0.0 Procedures (number) 43 
Time (days) 506 
Getting electricity (rank) 81  Protecting minority investors (rank) 122 Cost (% of claim) 89.4 
DTF score for getting electricity (0–100) 76.46 DTF score for protecting minority investors (0–100) 45.83 
Procedures (number) 3 Extent of conflict of interest regulation index (0–10) 4.7 Resolving insolvency (rank) 189 
Time (days) 120 Extent of shareholder governance index (0–10) 4.5 DTF score for resolving insolvency (0–100) 0.00 
Cost (% of income per capita) 2,127.9 Strength of minority investor protection index (0–10) 4.6 Time (years) NO PRACTICE 
Cost (% of estate) NO PRACTICE 
Paying taxes (rank) 167 Recovery rate (cents on the dollar) 0.0 
DTF score for paying taxes (0–100) 47.37 Strength of insolvency framework index (0–16) 0 
Payments (number per year) 33 
Time (hours per year) 100 
Total tax rate (% of profit) 216.5 
CONGO, DEM. REP. Sub-Saharan Africa GNI per capita (US$) 400 
Ease of doing business rank (1–189) 184 Overall distance to frontier (DTF) score (0–100) 40.60 Population (m) 67.5 
 Starting a business (rank) 172 Registering property (rank) 142 Trading across borders (rank) 175 
DTF score for starting a business (0–100) 58.53 DTF score for registering property (0–100) 55.39 DTF score for trading across borders (0–100) 29.09 
Procedures (number) 7 Procedures (number) 7 Documents to export (number) 7 
Time (days) 16 Time (days) 44 Time to export (days) 44 
Cost (% of income per capita) 30.0 Cost (% of property value) 9.5 Cost to export (US$ per container) 3,365 
Minimum capital (% of income per capita) 500.0 Documents to import (number) 10 
 Getting credit (rank) 131 Time to import (days) 63 
 Dealing with construction permits (rank) 111 DTF score for getting credit (0–100) 30.00 Cost to import (US$ per container) 4,290 
DTF score for dealing with construction permits (0–100) 67.72 Strength of legal rights index (0–12) 6 
Procedures (number) 8 Depth of credit information index (0–8) 0 Enforcing contracts (rank) 176 
Time (days) 119 Credit bureau coverage (% of adults) 0.0 DTF score for enforcing contracts (0–100) 33.51 
Cost (% of warehouse value) 11.6 Credit registry coverage (% of adults) 0.2 Procedures (number) 43 
Time (days) 610 
 Getting electricity (rank) 175  Protecting minority investors (rank) 146 Cost (% of claim) 80.6 
DTF score for getting electricity (0–100) 43.19 DTF score for protecting minority investors (0–100) 42.50 
Procedures (number) 6 Extent of conflict of interest regulation index (0–10) 4.0 Resolving insolvency (rank) 189 
Time (days) 65 Extent of shareholder governance index (0–10) 4.5 DTF score for resolving insolvency (0–100) 0.00 
Cost (% of income per capita) 16,191.7 Strength of minority investor protection index (0–10) 4.3 Time (years) NO PRACTICE 
Cost (% of estate) NO PRACTICE 
 Paying taxes (rank) 168 Recovery rate (cents on the dollar) 0.0 
DTF score for paying taxes (0–100) 46.11 Strength of insolvency framework index (0–16) 0 
Payments (number per year) 50 
Time (hours per year) 316 
Total tax rate (% of profit) 54.7 
Note: For resolving insolvency, an economy for which “no practice” is recorded for time and cost receives a score of 0 on the strength of insolvency framework index even if its legal framework includes provisions related to 
insolvency proceedings (liquidation or reorganization). Most indicator sets refer to a case scenario in the largest business city of an economy, except for 11 economies for which the data are a population-weighted average 
for the 2 largest business cities. See the data notes for more details.
180 DOING BUSINESS 2015 
 Reform making it easier to do business  Change making it more difficult to do business 
CONGO, REP. Sub-Saharan Africa GNI per capita (US$) 2,660 
Ease of doing business rank (1–189) 178 Overall distance to frontier (DTF) score (0–100) 43.29 Population (m) 4.4 
Starting a business (rank) 170 Registering property (rank) 168 Trading across borders (rank) 181 
DTF score for starting a business (0–100) 60.56 DTF score for registering property (0–100) 44.17 DTF score for trading across borders (0–100) 15.40 
Procedures (number) 11 Procedures (number) 6 Documents to export (number) 11 
Time (days) 53 Time (days) 55 Time to export (days) 50 
Cost (% of income per capita) 52.7 Cost (% of property value) 20.4 Cost to export (US$ per container) 3,795 
Minimum capital (% of income per capita) 79.3 Documents to import (number) 10 
Getting credit (rank) 104 Time to import (days) 54 
Dealing with construction permits (rank) 102 DTF score for getting credit (0–100) 40.00 Cost to import (US$ per container) 7,590 
DTF score for dealing with construction permits (0–100) 69.76 Strength of legal rights index (0–12) 6 
Procedures (number) 11 Depth of credit information index (0–8) 2 Enforcing contracts (rank) 151 
Time (days) 168 Credit bureau coverage (% of adults) 0.0 DTF score for enforcing contracts (0–100) 44.11 
Cost (% of warehouse value) 5.2 Credit registry coverage (% of adults) 9.4 Procedures (number) 44 
Time (days) 560 
Getting electricity (rank) 170  Protecting minority investors (rank) 146 Cost (% of claim) 53.2 
DTF score for getting electricity (0–100) 47.01 DTF score for protecting minority investors (0–100) 42.50 
Procedures (number) 6 Extent of conflict of interest regulation index (0–10) 4.0 Resolving insolvency (rank) 117 
Time (days) 135 Extent of shareholder governance index (0–10) 4.5 DTF score for resolving insolvency (0–100) 37.75 
Cost (% of income per capita) 4,705.2 Strength of minority investor protection index (0–10) 4.3 Time (years) 3.3 
Cost (% of estate) 25 
 Paying taxes (rank) 182 Recovery rate (cents on the dollar) 17.9 
DTF score for paying taxes (0–100) 31.67 Strength of insolvency framework index (0–16) 9 
Payments (number per year) 49 
Time (hours per year) 602 
Total tax rate (% of profit) 55.2 
COSTA RICA Latin America  Caribbean GNI per capita (US$) 9,550 
Ease of doing business rank (1–189) 83 Overall distance to frontier (DTF) score (0–100) 63.67 Population (m) 4.9 
Starting a business (rank) 118 Registering property (rank) 47 Trading across borders (rank) 47 
DTF score for starting a business (0–100) 80.90 DTF score for registering property (0–100) 78.40 DTF score for trading across borders (0–100) 80.84 
Procedures (number) 9 Procedures (number) 5 Documents to export (number) 5 
Time (days) 24 Time (days) 19 Time to export (days) 14 
Cost (% of income per capita) 11.5 Cost (% of property value) 3.4 Cost to export (US$ per container) 1,020 
Minimum capital (% of income per capita) 0.0 Documents to import (number) 5 
Getting credit (rank) 89 Time to import (days) 14 
Dealing with construction permits (rank) 52 DTF score for getting credit (0–100) 45.00 Cost to import (US$ per container) 1,070 
DTF score for dealing with construction permits (0–100) 78.14 Strength of legal rights index (0–12) 2 
Procedures (number) 13 Depth of credit information index (0–8) 7 Enforcing contracts (rank) 129 
Time (days) 113 Credit bureau coverage (% of adults) 100.0 DTF score for enforcing contracts (0–100) 51.13 
Cost (% of warehouse value) 1.7 Credit registry coverage (% of adults) 27.4 Procedures (number) 40 
Time (days) 852 
 Getting electricity (rank) 46 Protecting minority investors (rank) 181 Cost (% of claim) 24.3 
DTF score for getting electricity (0–100) 82.72 DTF score for protecting minority investors (0–100) 28.33 
Procedures (number) 5 Extent of conflict of interest regulation index (0–10) 3.3 Resolving insolvency (rank) 89 
Time (days) 55 Extent of shareholder governance index (0–10) 2.3 DTF score for resolving insolvency (0–100) 43.95 
Cost (% of income per capita) 196.2 Strength of minority investor protection index (0–10) 2.8 Time (years) 3.0 
Cost (% of estate) 15 
 Paying taxes (rank) 121 Recovery rate (cents on the dollar) 26.5 
DTF score for paying taxes (0–100) 67.27 Strength of insolvency framework index (0–16) 9.5 
Payments (number per year) 23 
Time (hours per year) 163 
Total tax rate (% of profit) 58.0 
CÔTE D’IVOIRE Sub-Saharan Africa GNI per capita (US$) 1,380 
Ease of doing business rank (1–189) 147 Overall distance to frontier (DTF) score (0–100) 52.26 Population (m) 20.3 
 Starting a business (rank) 44  Registering property (rank) 124  Trading across borders (rank) 158 
DTF score for starting a business (0–100) 91.24 DTF score for registering property (0–100) 60.05 DTF score for trading across borders (0–100) 50.54 
Procedures (number) 4 Procedures (number) 6 Documents to export (number) 9 
Time (days) 7 Time (days) 30 Time to export (days) 25 
Cost (% of income per capita) 20.0 Cost (% of property value) 9.6 Cost to export (US$ per container) 1,390 
Minimum capital (% of income per capita) 3.4 Documents to import (number) 13 
 Getting credit (rank) 131 Time to import (days) 32 
Dealing with construction permits (rank) 180 DTF score for getting credit (0–100) 30.00 Cost to import (US$ per container) 1,960 
DTF score for dealing with construction permits (0–100) 43.50 Strength of legal rights index (0–12) 6 
Procedures (number) 23 Depth of credit information index (0–8) 0 Enforcing contracts (rank) 72 
Time (days) 347 Credit bureau coverage (% of adults) 0.0 DTF score for enforcing contracts (0–100) 61.88 
Cost (% of warehouse value) 1.0 Credit registry coverage (% of adults) 3.2 Procedures (number) 32 
Time (days) 525 
Getting electricity (rank) 161  Protecting minority investors (rank) 146 Cost (% of claim) 41.7 
DTF score for getting electricity (0–100) 55.24 DTF score for protecting minority investors (0–100) 42.50 
Procedures (number) 8 Extent of conflict of interest regulation index (0–10) 4.0 Resolving insolvency (rank) 85 
Time (days) 55 Extent of shareholder governance index (0–10) 4.5 DTF score for resolving insolvency (0–100) 44.97 
Cost (% of income per capita) 2,824.4 Strength of minority investor protection index (0–10) 4.3 Time (years) 2.2 
Cost (% of estate) 18 
Paying taxes (rank) 175 Recovery rate (cents on the dollar) 31.3 
DTF score for paying taxes (0–100) 42.73 Strength of insolvency framework index (0–16) 9 
Payments (number per year) 63 
Time (hours per year) 270 
Total tax rate (% of profit) 51.9 
Note: For resolving insolvency, an economy for which “no practice” is recorded for time and cost receives a score of 0 on the strength of insolvency framework index even if its legal framework includes provisions related to 
insolvency proceedings (liquidation or reorganization). Most indicator sets refer to a case scenario in the largest business city of an economy, except for 11 economies for which the data are a population-weighted average 
for the 2 largest business cities. See the data notes for more details.
COUNTRY TABLES 181 
 Reform making it easier to do business  Change making it more difficult to do business 
CROATIA Europe  Central Asia GNI per capita (US$) 13,330 
Ease of doing business rank (1–189) 65 Overall distance to frontier (DTF) score (0–100) 66.53 Population (m) 4.3 
 Starting a business (rank) 88 Registering property (rank) 92  Trading across borders (rank) 86 
DTF score for starting a business (0–100) 85.43 DTF score for registering property (0–100) 66.44 DTF score for trading across borders (0–100) 74.25 
Procedures (number) 7 Procedures (number) 5 Documents to export (number) 6 
Time (days) 15 Time (days) 72 Time to export (days) 16 
Cost (% of income per capita) 3.5 Cost (% of property value) 5.0 Cost to export (US$ per container) 1,335 
Minimum capital (% of income per capita) 26.6 Documents to import (number) 7 
Getting credit (rank) 61 Time to import (days) 14 
 Dealing with construction permits (rank) 178 DTF score for getting credit (0–100) 55.00 Cost to import (US$ per container) 1,185 
DTF score for dealing with construction permits (0–100) 44.97 Strength of legal rights index (0–12) 5 
Procedures (number) 21 Depth of credit information index (0–8) 6 Enforcing contracts (rank) 54 
Time (days) 188 Credit bureau coverage (% of adults) 100.0 DTF score for enforcing contracts (0–100) 64.81 
Cost (% of warehouse value) 10.9 Credit registry coverage (% of adults) 0.0 Procedures (number) 38 
Time (days) 572 
Getting electricity (rank) 59 Protecting minority investors (rank) 62 Cost (% of claim) 13.8 
DTF score for getting electricity (0–100) 80.05 DTF score for protecting minority investors (0–100) 57.50 
Procedures (number) 5 Extent of conflict of interest regulation index (0–10) 5.0 Resolving insolvency (rank) 56 
Time (days) 70 Extent of shareholder governance index (0–10) 6.5 DTF score for resolving insolvency (0–100) 53.92 
Cost (% of income per capita) 316.7 Strength of minority investor protection index (0–10) 5.8 Time (years) 3.1 
Cost (% of estate) 15 
 Paying taxes (rank) 36 Recovery rate (cents on the dollar) 30.5 
DTF score for paying taxes (0–100) 82.92 Strength of insolvency framework index (0–16) 12 
Payments (number per year) 19 
Time (hours per year) 208 
Total tax rate (% of profit) 18.8 
CYPRUS Europe  Central Asia GNI per capita (US$) 25,190 
Ease of doing business rank (1–189) 64 Overall distance to frontier (DTF) score (0–100) 66.55 Population (m) 1.1 
Starting a business (rank) 64 Registering property (rank) 112 Trading across borders (rank) 34 
DTF score for starting a business (0–100) 89.18 DTF score for registering property (0–100) 61.83 DTF score for trading across borders (0–100) 83.87 
Procedures (number) 6 Procedures (number) 6 Documents to export (number) 5 
Time (days) 8 Time (days) 8 Time to export (days) 7 
Cost (% of income per capita) 12.6 Cost (% of property value) 10.4 Cost to export (US$ per container) 865 
Minimum capital (% of income per capita) 0.0 Documents to import (number) 7 
 Getting credit (rank) 61 Time to import (days) 5 
Dealing with construction permits (rank) 148 DTF score for getting credit (0–100) 55.00 Cost to import (US$ per container) 1,010 
DTF score for dealing with construction permits (0–100) 60.68 Strength of legal rights index (0–12) 7 
Procedures (number) 8 Depth of credit information index (0–8) 4 Enforcing contracts (rank) 113 
Time (days) 677 Credit bureau coverage (% of adults) 6.8 DTF score for enforcing contracts (0–100) 54.17 
Cost (% of warehouse value) 1.2 Credit registry coverage (% of adults) 0.0 Procedures (number) 43 
Time (days) 735 
Getting electricity (rank) 160 Protecting minority investors (rank) 14 Cost (% of claim) 16.4 
DTF score for getting electricity (0–100) 55.28 DTF score for protecting minority investors (0–100) 68.33 
Procedures (number) 5 Extent of conflict of interest regulation index (0–10) 6.7 Resolving insolvency (rank) 51 
Time (days) 247 Extent of shareholder governance index (0–10) 7.0 DTF score for resolving insolvency (0–100) 56.68 
Cost (% of income per capita) 102.1 Strength of minority investor protection index (0–10) 6.8 Time (years) 1.5 
Cost (% of estate) 15 
 Paying taxes (rank) 50 Recovery rate (cents on the dollar) 70.5 
DTF score for paying taxes (0–100) 80.53 Strength of insolvency framework index (0–16) 6 
Payments (number per year) 29 
Time (hours per year) 146.5 
Total tax rate (% of profit) 23.2 
CZECH REPUBLIC OECD high income GNI per capita (US$) 18,060 
Ease of doing business rank (1–189) 44 Overall distance to frontier (DTF) score (0–100) 70.95 Population (m) 10.5 
 Starting a business (rank) 110 Registering property (rank) 31 Trading across borders (rank) 58 
DTF score for starting a business (0–100) 82.58 DTF score for registering property (0–100) 81.87 DTF score for trading across borders (0–100) 78.33 
Procedures (number) 9 Procedures (number) 3 Documents to export (number) 4 
Time (days) 19 Time (days) 24 Time to export (days) 17 
Cost (% of income per capita) 8.0 Cost (% of property value) 4.0 Cost to export (US$ per container) 1,240 
Minimum capital (% of income per capita) 0.0 Documents to import (number) 6 
 Getting credit (rank) 23 Time to import (days) 17 
Dealing with construction permits (rank) 139 DTF score for getting credit (0–100) 70.00 Cost to import (US$ per container) 1,215 
DTF score for dealing with construction permits (0–100) 62.91 Strength of legal rights index (0–12) 7 
Procedures (number) 24 Depth of credit information index (0–8) 7  Enforcing contracts (rank) 37 
Time (days) 143 Credit bureau coverage (% of adults) 76.6 DTF score for enforcing contracts (0–100) 68.00 
Cost (% of warehouse value) 0.3 Credit registry coverage (% of adults) 6.4 Procedures (number) 27 
Time (days) 611 
Getting electricity (rank) 123 Protecting minority investors (rank) 83 Cost (% of claim) 33.0 
DTF score for getting electricity (0–100) 66.52 DTF score for protecting minority investors (0–100) 54.17 
Procedures (number) 6 Extent of conflict of interest regulation index (0–10) 5.3 Resolving insolvency (rank) 20 
Time (days) 129 Extent of shareholder governance index (0–10) 5.5 DTF score for resolving insolvency (0–100) 77.50 
Cost (% of income per capita) 175.8 Strength of minority investor protection index (0–10) 5.4 Time (years) 2.1 
Cost (% of estate) 17 
Paying taxes (rank) 119 Recovery rate (cents on the dollar) 65.6 
DTF score for paying taxes (0–100) 67.66 Strength of insolvency framework index (0–16) 13.5 
Payments (number per year) 8 
Time (hours per year) 413 
Total tax rate (% of profit) 48.5 
Note: For resolving insolvency, an economy for which “no practice” is recorded for time and cost receives a score of 0 on the strength of insolvency framework index even if its legal framework includes provisions related to 
insolvency proceedings (liquidation or reorganization). Most indicator sets refer to a case scenario in the largest business city of an economy, except for 11 economies for which the data are a population-weighted average 
for the 2 largest business cities. See the data notes for more details.
182 DOING BUSINESS 2015 
 Reform making it easier to do business  Change making it more difficult to do business 
DENMARK OECD high income GNI per capita (US$) 61,110 
Ease of doing business rank (1–189) 4 Overall distance to frontier (DTF) score (0–100) 84.20 Population (m) 5.6 
 Starting a business (rank) 25 Registering property (rank) 8 Trading across borders (rank) 7 
DTF score for starting a business (0–100) 93.40 DTF score for registering property (0–100) 92.61 DTF score for trading across borders (0–100) 92.23 
Procedures (number) 4 Procedures (number) 3 Documents to export (number) 4 
Time (days) 5.5 Time (days) 4 Time to export (days) 6 
Cost (% of income per capita) 0.2 Cost (% of property value) 0.6 Cost to export (US$ per container) 795 
Minimum capital (% of income per capita) 14.5 Documents to import (number) 3 
Getting credit (rank) 23 Time to import (days) 5 
Dealing with construction permits (rank) 5 DTF score for getting credit (0–100) 70.00 Cost to import (US$ per container) 745 
DTF score for dealing with construction permits (0–100) 89.84 Strength of legal rights index (0–12) 8 
Procedures (number) 7 Depth of credit information index (0–8) 6 Enforcing contracts (rank) 34 
Time (days) 64 Credit bureau coverage (% of adults) 7.8 DTF score for enforcing contracts (0–100) 68.79 
Cost (% of warehouse value) 2.3 Credit registry coverage (% of adults) 0.0 Procedures (number) 35 
Time (days) 410 
Getting electricity (rank) 14 Protecting minority investors (rank) 17 Cost (% of claim) 23.3 
DTF score for getting electricity (0–100) 91.07 DTF score for protecting minority investors (0–100) 67.50 
Procedures (number) 4 Extent of conflict of interest regulation index (0–10) 6.7 Resolving insolvency (rank) 9 
Time (days) 38 Extent of shareholder governance index (0–10) 6.8 DTF score for resolving insolvency (0–100) 84.59 
Cost (% of income per capita) 114.9 Strength of minority investor protection index (0–10) 6.8 Time (years) 1.0 
Cost (% of estate) 4 
Paying taxes (rank) 12 Recovery rate (cents on the dollar) 87.5 
DTF score for paying taxes (0–100) 91.94 Strength of insolvency framework index (0–16) 12 
Payments (number per year) 10 
Time (hours per year) 130 
Total tax rate (% of profit) 26.0 
DJIBOUTI Middle East  North Africa GNI per capita (US$) 1,595 
Ease of doing business rank (1–189) 155 Overall distance to frontier (DTF) score (0–100) 50.48 Population (m) 0.9 
Starting a business (rank) 163 Registering property (rank) 154 Trading across borders (rank) 56 
DTF score for starting a business (0–100) 65.89 DTF score for registering property (0–100) 51.63 DTF score for trading across borders (0–100) 78.65 
Procedures (number) 7 Procedures (number) 6 Documents to export (number) 5 
Time (days) 14 Time (days) 39 Time to export (days) 20 
Cost (% of income per capita) 175.2 Cost (% of property value) 12.8 Cost to export (US$ per container) 885 
Minimum capital (% of income per capita) 0.0 Documents to import (number) 5 
Getting credit (rank) 180 Time to import (days) 18 
 Dealing with construction permits (rank) 146 DTF score for getting credit (0–100) 5.00 Cost to import (US$ per container) 910 
DTF score for dealing with construction permits (0–100) 61.63 Strength of legal rights index (0–12) 1 
Procedures (number) 18 Depth of credit information index (0–8) 0 Enforcing contracts (rank) 171 
Time (days) 117 Credit bureau coverage (% of adults) 0.0 DTF score for enforcing contracts (0–100) 37.31 
Cost (% of warehouse value) 7.4 Credit registry coverage (% of adults) 0.3 Procedures (number) 40 
Time (days) 1,225 
Getting electricity (rank) 176 Protecting minority investors (rank) 162 Cost (% of claim) 34.0 
DTF score for getting electricity (0–100) 42.21 DTF score for protecting minority investors (0–100) 39.17 
Procedures (number) 4 Extent of conflict of interest regulation index (0–10) 2.3 Resolving insolvency (rank) 70 
Time (days) 180 Extent of shareholder governance index (0–10) 5.5 DTF score for resolving insolvency (0–100) 48.04 
Cost (% of income per capita) 6,988.8 Strength of minority investor protection index (0–10) 3.9 Time (years) 2.3 
Cost (% of estate) 11 
Paying taxes (rank) 75 Recovery rate (cents on the dollar) 37.0 
DTF score for paying taxes (0–100) 75.26 Strength of insolvency framework index (0–16) 9 
Payments (number per year) 35 
Time (hours per year) 82 
Total tax rate (% of profit) 37.3 
DOMINICA Latin America  Caribbean GNI per capita (US$) 6,760 
Ease of doing business rank (1–189) 97 Overall distance to frontier (DTF) score (0–100) 61.37 Population (m) 0.1 
Starting a business (rank) 63 Registering property (rank) 149 Trading across borders (rank) 88 
DTF score for starting a business (0–100) 89.27 DTF score for registering property (0–100) 52.86 DTF score for trading across borders (0–100) 74.03 
Procedures (number) 5 Procedures (number) 5 Documents to export (number) 6 
Time (days) 12 Time (days) 42 Time to export (days) 13 
Cost (% of income per capita) 15.7 Cost (% of property value) 13.3 Cost to export (US$ per container) 990 
Minimum capital (% of income per capita) 0.0 Documents to import (number) 8 
Getting credit (rank) 131 Time to import (days) 14 
Dealing with construction permits (rank) 43 DTF score for getting credit (0–100) 30.00 Cost to import (US$ per container) 1,600 
DTF score for dealing with construction permits (0–100) 78.79 Strength of legal rights index (0–12) 6 
Procedures (number) 10 Depth of credit information index (0–8) 0 Enforcing contracts (rank) 148 
Time (days) 175 Credit bureau coverage (% of adults) 0.0 DTF score for enforcing contracts (0–100) 45.17 
Cost (% of warehouse value) 0.1 Credit registry coverage (% of adults) 0.0 Procedures (number) 46 
Time (days) 681 
Getting electricity (rank) 53 Protecting minority investors (rank) 87 Cost (% of claim) 36.0 
DTF score for getting electricity (0–100) 80.67 DTF score for protecting minority investors (0–100) 53.33 
Procedures (number) 5 Extent of conflict of interest regulation index (0–10) 6.7 Resolving insolvency (rank) 121 
Time (days) 61 Extent of shareholder governance index (0–10) 4.0 DTF score for resolving insolvency (0–100) 37.09 
Cost (% of income per capita) 483.0 Strength of minority investor protection index (0–10) 5.3 Time (years) 4.0 
Cost (% of estate) 10 
Paying taxes (rank) 94 Recovery rate (cents on the dollar) 28.3 
DTF score for paying taxes (0–100) 72.49 Strength of insolvency framework index (0–16) 7 
Payments (number per year) 37 
Time (hours per year) 117 
Total tax rate (% of profit) 37.0 
Note: For resolving insolvency, an economy for which “no practice” is recorded for time and cost receives a score of 0 on the strength of insolvency framework index even if its legal framework includes provisions related to 
insolvency proceedings (liquidation or reorganization). Most indicator sets refer to a case scenario in the largest business city of an economy, except for 11 economies for which the data are a population-weighted average 
for the 2 largest business cities. See the data notes for more details.
COUNTRY TABLES 183 
 Reform making it easier to do business  Change making it more difficult to do business 
DOMINICAN REPUBLIC Latin America  Caribbean GNI per capita (US$) 5,620 
Ease of doing business rank (1–189) 84 Overall distance to frontier (DTF) score (0–100) 63.43 Population (m) 10.4 
Starting a business (rank) 113 Registering property (rank) 82  Trading across borders (rank) 24 
DTF score for starting a business (0–100) 81.60 DTF score for registering property (0–100) 69.90 DTF score for trading across borders (0–100) 85.56 
Procedures (number) 7 Procedures (number) 6 Documents to export (number) 4 
Time (days) 19.5 Time (days) 51 Time to export (days) 8 
Cost (% of income per capita) 16.9 Cost (% of property value) 3.7 Cost to export (US$ per container) 1,040 
Minimum capital (% of income per capita) 43.0 Documents to import (number) 5 
 Getting credit (rank) 89 Time to import (days) 10 
 Dealing with construction permits (rank) 96 DTF score for getting credit (0–100) 45.00 Cost to import (US$ per container) 1,145 
DTF score for dealing with construction permits (0–100) 70.88 Strength of legal rights index (0–12) 1 
Procedures (number) 13 Depth of credit information index (0–8) 8 Enforcing contracts (rank) 73 
Time (days) 184 Credit bureau coverage (% of adults) 63.1 DTF score for enforcing contracts (0–100) 61.87 
Cost (% of warehouse value) 2.0 Credit registry coverage (% of adults) 38.1 Procedures (number) 34 
Time (days) 460 
Getting electricity (rank) 119  Protecting minority investors (rank) 83 Cost (% of claim) 40.9 
DTF score for getting electricity (0–100) 67.36 DTF score for protecting minority investors (0–100) 54.17 
Procedures (number) 7 Extent of conflict of interest regulation index (0–10) 5.3 Resolving insolvency (rank) 158 
Time (days) 82 Extent of shareholder governance index (0–10) 5.5 DTF score for resolving insolvency (0–100) 23.75 
Cost (% of income per capita) 276.9 Strength of minority investor protection index (0–10) 5.4 Time (years) 3.5 
Cost (% of estate) 38 
Paying taxes (rank) 80 Recovery rate (cents on the dollar) 9.3 
DTF score for paying taxes (0–100) 74.24 Strength of insolvency framework index (0–16) 6 
Payments (number per year) 9 
Time (hours per year) 324 
Total tax rate (% of profit) 43.4 
ECUADOR Latin America  Caribbean GNI per capita (US$) 5,510 
Ease of doing business rank (1–189) 115 Overall distance to frontier (DTF) score (0–100) 58.88 Population (m) 15.7 
Starting a business (rank) 165 Registering property (rank) 80  Trading across borders (rank) 114 
DTF score for starting a business (0–100) 65.31 DTF score for registering property (0–100) 70.21 DTF score for trading across borders (0–100) 68.23 
Procedures (number) 13 Procedures (number) 8 Documents to export (number) 7 
Time (days) 55.5 Time (days) 39 Time to export (days) 19 
Cost (% of income per capita) 24.0 Cost (% of property value) 1.9 Cost to export (US$ per container) 1,535 
Minimum capital (% of income per capita) 3.5 Documents to import (number) 6 
Getting credit (rank) 89 Time to import (days) 24 
Dealing with construction permits (rank) 59 DTF score for getting credit (0–100) 45.00 Cost to import (US$ per container) 1,520 
DTF score for dealing with construction permits (0–100) 76.86 Strength of legal rights index (0–12) 1 
Procedures (number) 15 Depth of credit information index (0–8) 8 Enforcing contracts (rank) 88 
Time (days) 114 Credit bureau coverage (% of adults) 73.0 DTF score for enforcing contracts (0–100) 58.30 
Cost (% of warehouse value) 0.8 Credit registry coverage (% of adults) 0.0 Procedures (number) 39 
Time (days) 588 
Getting electricity (rank) 120  Protecting minority investors (rank) 117 Cost (% of claim) 27.2 
DTF score for getting electricity (0–100) 67.03 DTF score for protecting minority investors (0–100) 46.67 
Procedures (number) 7 Extent of conflict of interest regulation index (0–10) 4.3 Resolving insolvency (rank) 151 
Time (days) 74 Extent of shareholder governance index (0–10) 5.0 DTF score for resolving insolvency (0–100) 28.36 
Cost (% of income per capita) 638.5 Strength of minority investor protection index (0–10) 4.7 Time (years) 5.3 
Cost (% of estate) 18 
Paying taxes (rank) 138 Recovery rate (cents on the dollar) 17.9 
DTF score for paying taxes (0–100) 62.84 Strength of insolvency framework index (0–16) 6 
Payments (number per year) 8 
Time (hours per year) 654 
Total tax rate (% of profit) 33.0 
EGYPT, ARAB REP. Middle East  North Africa GNI per capita (US$) 3,160 
Ease of doing business rank (1–189) 112 Overall distance to frontier (DTF) score (0–100) 59.54 Population (m) 82.1 
Starting a business (rank) 73 Registering property (rank) 84 Trading across borders (rank) 99 
DTF score for starting a business (0–100) 88.14 DTF score for registering property (0–100) 69.13 DTF score for trading across borders (0–100) 71.56 
Procedures (number) 7 Procedures (number) 8 Documents to export (number) 8 
Time (days) 8 Time (days) 63 Time to export (days) 12 
Cost (% of income per capita) 9.2 Cost (% of property value) 0.7 Cost to export (US$ per container) 625 
Minimum capital (% of income per capita) 0.0 Documents to import (number) 10 
Getting credit (rank) 71 Time to import (days) 15 
Dealing with construction permits (rank) 142 DTF score for getting credit (0–100) 50.00 Cost to import (US$ per container) 790 
DTF score for dealing with construction permits (0–100) 62.06 Strength of legal rights index (0–12) 2 
Procedures (number) 20 Depth of credit information index (0–8) 8 Enforcing contracts (rank) 152 
Time (days) 179 Credit bureau coverage (% of adults) 21.8 DTF score for enforcing contracts (0–100) 44.02 
Cost (% of warehouse value) 1.9 Credit registry coverage (% of adults) 5.8 Procedures (number) 42 
Time (days) 1,010 
Getting electricity (rank) 106  Protecting minority investors (rank) 135 Cost (% of claim) 26.2 
DTF score for getting electricity (0–100) 71.31 DTF score for protecting minority investors (0–100) 44.17 
Procedures (number) 7 Extent of conflict of interest regulation index (0–10) 4.7 Resolving insolvency (rank) 126 
Time (days) 54 Extent of shareholder governance index (0–10) 4.2 DTF score for resolving insolvency (0–100) 36.17 
Cost (% of income per capita) 304.6 Strength of minority investor protection index (0–10) 4.4 Time (years) 2.5 
Cost (% of estate) 22 
Paying taxes (rank) 149 Recovery rate (cents on the dollar) 26.6 
DTF score for paying taxes (0–100) 58.84 Strength of insolvency framework index (0–16) 7 
Payments (number per year) 29 
Time (hours per year) 392 
Total tax rate (% of profit) 45.0 
Note: For resolving insolvency, an economy for which “no practice” is recorded for time and cost receives a score of 0 on the strength of insolvency framework index even if its legal framework includes provisions related to 
insolvency proceedings (liquidation or reorganization). Most indicator sets refer to a case scenario in the largest business city of an economy, except for 11 economies for which the data are a population-weighted average 
for the 2 largest business cities. See the data notes for more details.
184 DOING BUSINESS 2015 
 Reform making it easier to do business  Change making it more difficult to do business 
EL SALVADOR Latin America  Caribbean GNI per capita (US$) 3,720 
Ease of doing business rank (1–189) 109 Overall distance to frontier (DTF) score (0–100) 59.93 Population (m) 6.3 
Starting a business (rank) 121 Registering property (rank) 56 Trading across borders (rank) 73 
DTF score for starting a business (0–100) 79.87 DTF score for registering property (0–100) 75.65 DTF score for trading across borders (0–100) 76.01 
Procedures (number) 8 Procedures (number) 5 Documents to export (number) 7 
Time (days) 16.5 Time (days) 31 Time to export (days) 13 
Cost (% of income per capita) 45.2 Cost (% of property value) 3.8 Cost to export (US$ per container) 1,045 
Minimum capital (% of income per capita) 2.7 Documents to import (number) 7 
Getting credit (rank) 71 Time to import (days) 10 
Dealing with construction permits (rank) 155 DTF score for getting credit (0–100) 50.00 Cost to import (US$ per container) 1,035 
DTF score for dealing with construction permits (0–100) 57.19 Strength of legal rights index (0–12) 3 
Procedures (number) 25 Depth of credit information index (0–8) 7 Enforcing contracts (rank) 82 
Time (days) 115 Credit bureau coverage (% of adults) 32.0 DTF score for enforcing contracts (0–100) 60.06 
Cost (% of warehouse value) 4.6 Credit registry coverage (% of adults) 28.2 Procedures (number) 35 
Time (days) 786 
Getting electricity (rank) 144 Protecting minority investors (rank) 154 Cost (% of claim) 19.2 
DTF score for getting electricity (0–100) 60.56 DTF score for protecting minority investors (0–100) 41.67 
Procedures (number) 8 Extent of conflict of interest regulation index (0–10) 3.3 Resolving insolvency (rank) 79 
Time (days) 83 Extent of shareholder governance index (0–10) 5.0 DTF score for resolving insolvency (0–100) 46.02 
Cost (% of income per capita) 543.8 Strength of minority investor protection index (0–10) 4.2 Time (years) 3.5 
Cost (% of estate) 12 
Paying taxes (rank) 161 Recovery rate (cents on the dollar) 33.2 
DTF score for paying taxes (0–100) 52.31 Strength of insolvency framework index (0–16) 9 
Payments (number per year) 53 
Time (hours per year) 320 
Total tax rate (% of profit) 38.7 
EQUATORIAL GUINEA Sub-Saharan Africa GNI per capita (US$) 14,320 
Ease of doing business rank (1–189) 165 Overall distance to frontier (DTF) score (0–100) 49.01 Population (m) 0.8 
Starting a business (rank) 186 Registering property (rank) 145 Trading across borders (rank) 143 
DTF score for starting a business (0–100) 36.74 DTF score for registering property (0–100) 54.82 DTF score for trading across borders (0–100) 59.67 
Procedures (number) 18 Procedures (number) 6 Documents to export (number) 7 
Time (days) 135 Time (days) 23 Time to export (days) 29 
Cost (% of income per capita) 99.0 Cost (% of property value) 12.5 Cost to export (US$ per container) 1,390 
Minimum capital (% of income per capita) 14.3 Documents to import (number) 6 
Getting credit (rank) 104 Time to import (days) 44 
Dealing with construction permits (rank) 94 DTF score for getting credit (0–100) 40.00 Cost to import (US$ per container) 1,600 
DTF score for dealing with construction permits (0–100) 71.20 Strength of legal rights index (0–12) 6 
Procedures (number) 13 Depth of credit information index (0–8) 2 Enforcing contracts (rank) 67 
Time (days) 144 Credit bureau coverage (% of adults) 0.0 DTF score for enforcing contracts (0–100) 63.23 
Cost (% of warehouse value) 4.1 Credit registry coverage (% of adults) 5.1 Procedures (number) 40 
Time (days) 475 
Getting electricity (rank) 95  Protecting minority investors (rank) 122 Cost (% of claim) 19.5 
DTF score for getting electricity (0–100) 73.84 DTF score for protecting minority investors (0–100) 45.83 
Procedures (number) 5 Extent of conflict of interest regulation index (0–10) 4.7 Resolving insolvency (rank) 189 
Time (days) 106 Extent of shareholder governance index (0–10) 4.5 DTF score for resolving insolvency (0–100) 0.00 
Cost (% of income per capita) 557.6 Strength of minority investor protection index (0–10) 4.6 Time (years) NO PRACTICE 
Cost (% of estate) NO PRACTICE 
Paying taxes (rank) 171 Recovery rate (cents on the dollar) 0.0 
DTF score for paying taxes (0–100) 44.73 Strength of insolvency framework index (0–16) 0 
Payments (number per year) 46 
Time (hours per year) 492 
Total tax rate (% of profit) 44.0 
ERITREA Sub-Saharan Africa GNI per capita (US$) 490 
Ease of doing business rank (1–189) 189 Overall distance to frontier (DTF) score (0–100) 33.16 Population (m) 6.3 
Starting a business (rank) 183 Registering property (rank) 176 Trading across borders (rank) 172 
DTF score for starting a business (0–100) 44.81 DTF score for registering property (0–100) 39.78 DTF score for trading across borders (0–100) 32.24 
Procedures (number) 13 Procedures (number) 11 Documents to export (number) 10 
Time (days) 84 Time (days) 78 Time to export (days) 50 
Cost (% of income per capita) 41.5 Cost (% of property value) 9.1 Cost to export (US$ per container) 1,850 
Minimum capital (% of income per capita) 182.1 Documents to import (number) 12 
Getting credit (rank) 185 Time to import (days) 59 
Dealing with construction permits (rank) 189 DTF score for getting credit (0–100) 0.00 Cost to import (US$ per container) 2,000 
DTF score for dealing with construction permits (0–100) 0.00 Strength of legal rights index (0–12) 0 
Procedures (number) NO PRACTICE Depth of credit information index (0–8) 0 Enforcing contracts (rank) 68 
Time (days) NO PRACTICE Credit bureau coverage (% of adults) 0.0 DTF score for enforcing contracts (0–100) 62.70 
Cost (% of warehouse value) NO PRACTICE Credit registry coverage (% of adults) 0.0 Procedures (number) 39 
Time (days) 490 
Getting electricity (rank) 113 Protecting minority investors (rank) 166 Cost (% of claim) 22.6 
DTF score for getting electricity (0–100) 70.28 DTF score for protecting minority investors (0–100) 38.33 
Procedures (number) 5 Extent of conflict of interest regulation index (0–10) 4.7 Resolving insolvency (rank) 189 
Time (days) 59 Extent of shareholder governance index (0–10) 3.0 DTF score for resolving insolvency (0–100) 0.00 
Cost (% of income per capita) 3,078.5 Strength of minority investor protection index (0–10) 3.8 Time (years) NO PRACTICE 
Cost (% of estate) NO PRACTICE 
Paying taxes (rank) 174 Recovery rate (cents on the dollar) 0.0 
DTF score for paying taxes (0–100) 43.49 Strength of insolvency framework index (0–16) 0 
Payments (number per year) 30 
Time (hours per year) 216 
Total tax rate (% of profit) 83.7 
Note: For resolving insolvency, an economy for which “no practice” is recorded for time and cost receives a score of 0 on the strength of insolvency framework index even if its legal framework includes provisions related to 
insolvency proceedings (liquidation or reorganization). Most indicator sets refer to a case scenario in the largest business city of an economy, except for 11 economies for which the data are a population-weighted average 
for the 2 largest business cities. See the data notes for more details.
COUNTRY TABLES 185 
 Reform making it easier to do business  Change making it more difficult to do business 
ESTONIA OECD high income GNI per capita (US$) 17,370 
Ease of doing business rank (1–189) 17 Overall distance to frontier (DTF) score (0–100) 78.84 Population (m) 1.3 
Starting a business (rank) 26 Registering property (rank) 13 Trading across borders (rank) 6 
DTF score for starting a business (0–100) 93.25 DTF score for registering property (0–100) 90.88 DTF score for trading across borders (0–100) 92.76 
Procedures (number) 4 Procedures (number) 3 Documents to export (number) 3 
Time (days) 4.5 Time (days) 17.5 Time to export (days) 6 
Cost (% of income per capita) 1.4 Cost (% of property value) 0.4 Cost to export (US$ per container) 765 
Minimum capital (% of income per capita) 18.6 Documents to import (number) 4 
Getting credit (rank) 23 Time to import (days) 5 
Dealing with construction permits (rank) 20 DTF score for getting credit (0–100) 70.00 Cost to import (US$ per container) 795 
DTF score for dealing with construction permits (0–100) 84.18 Strength of legal rights index (0–12) 7 
Procedures (number) 11 Depth of credit information index (0–8) 7 Enforcing contracts (rank) 32 
Time (days) 103 Credit bureau coverage (% of adults) 34.2 DTF score for enforcing contracts (0–100) 68.91 
Cost (% of warehouse value) 0.3 Credit registry coverage (% of adults) 0.0 Procedures (number) 35 
Time (days) 425 
Getting electricity (rank) 56 Protecting minority investors (rank) 56 Cost (% of claim) 21.9 
DTF score for getting electricity (0–100) 80.27 DTF score for protecting minority investors (0–100) 58.33 
Procedures (number) 4 Extent of conflict of interest regulation index (0–10) 5.7 Resolving insolvency (rank) 37 
Time (days) 111 Extent of shareholder governance index (0–10) 6.0 DTF score for resolving insolvency (0–100) 64.92 
Cost (% of income per capita) 169.2 Strength of minority investor protection index (0–10) 5.8 Time (years) 3.0 
Cost (% of estate) 9 
Paying taxes (rank) 28 Recovery rate (cents on the dollar) 39.3 
DTF score for paying taxes (0–100) 84.93 Strength of insolvency framework index (0–16) 14 
Payments (number per year) 7 
Time (hours per year) 81 
Total tax rate (% of profit) 49.3 
ETHIOPIA Sub-Saharan Africa GNI per capita (US$) 470 
Ease of doing business rank (1–189) 132 Overall distance to frontier (DTF) score (0–100) 56.31 Population (m) 94.1 
Starting a business (rank) 168 Registering property (rank) 104 Trading across borders (rank) 168 
DTF score for starting a business (0–100) 63.15 DTF score for registering property (0–100) 64.05 DTF score for trading across borders (0–100) 38.58 
Procedures (number) 9 Procedures (number) 10 Documents to export (number) 8 
Time (days) 15 Time (days) 41 Time to export (days) 44 
Cost (% of income per capita) 89.3 Cost (% of property value) 2.1 Cost to export (US$ per container) 2,380 
Minimum capital (% of income per capita) 164.4 Documents to import (number) 11 
Getting credit (rank) 165 Time to import (days) 44 
Dealing with construction permits (rank) 28 DTF score for getting credit (0–100) 15.00 Cost to import (US$ per container) 2,960 
DTF score for dealing with construction permits (0–100) 82.49 Strength of legal rights index (0–12) 3 
Procedures (number) 7 Depth of credit information index (0–8) 0 Enforcing contracts (rank) 50 
Time (days) 125 Credit bureau coverage (% of adults) 0.0 DTF score for enforcing contracts (0–100) 65.43 
Cost (% of warehouse value) 3.2 Credit registry coverage (% of adults) 0.2 Procedures (number) 38 
Time (days) 530 
Getting electricity (rank) 82 Protecting minority investors (rank) 154 Cost (% of claim) 15.2 
DTF score for getting electricity (0–100) 76.39 DTF score for protecting minority investors (0–100) 41.67 
Procedures (number) 4 Extent of conflict of interest regulation index (0–10) 2.3 Resolving insolvency (rank) 74 
Time (days) 95 Extent of shareholder governance index (0–10) 6.0 DTF score for resolving insolvency (0–100) 47.20 
Cost (% of income per capita) 1,676.6 Strength of minority investor protection index (0–10) 4.2 Time (years) 1.8 
Cost (% of estate) 15 
Paying taxes (rank) 112 Recovery rate (cents on the dollar) 38.3 
DTF score for paying taxes (0–100) 69.11 Strength of insolvency framework index (0–16) 8.5 
Payments (number per year) 30 
Time (hours per year) 306 
Total tax rate (% of profit) 31.8 
FIJI East Asia  Pacific GNI per capita (US$) 4,430 
Ease of doing business rank (1–189) 81 Overall distance to frontier (DTF) score (0–100) 63.90 Population (m) 0.9 
Starting a business (rank) 160 Registering property (rank) 64 Trading across borders (rank) 116 
DTF score for starting a business (0–100) 67.79 DTF score for registering property (0–100) 74.15 DTF score for trading across borders (0–100) 68.04 
Procedures (number) 11 Procedures (number) 4 Documents to export (number) 8 
Time (days) 59 Time (days) 69 Time to export (days) 19 
Cost (% of income per capita) 22.5 Cost (% of property value) 3.0 Cost to export (US$ per container) 790 
Minimum capital (% of income per capita) 0.0 Documents to import (number) 9 
Getting credit (rank) 71 Time to import (days) 22 
Dealing with construction permits (rank) 73 DTF score for getting credit (0–100) 50.00 Cost to import (US$ per container) 753 
DTF score for dealing with construction permits (0–100) 74.89 Strength of legal rights index (0–12) 5 
Procedures (number) 15 Depth of credit information index (0–8) 5 Enforcing contracts (rank) 59 
Time (days) 141 Credit bureau coverage (% of adults) 78.9 DTF score for enforcing contracts (0–100) 64.34 
Cost (% of warehouse value) 0.4 Credit registry coverage (% of adults) 0.0 Procedures (number) 34 
Time (days) 397 
Getting electricity (rank) 75 Protecting minority investors (rank) 110 Cost (% of claim) 38.9 
DTF score for getting electricity (0–100) 77.97 DTF score for protecting minority investors (0–100) 47.50 
Procedures (number) 4 Extent of conflict of interest regulation index (0–10) 5.7 Resolving insolvency (rank) 91 
Time (days) 81 Extent of shareholder governance index (0–10) 3.8 DTF score for resolving insolvency (0–100) 43.62 
Cost (% of income per capita) 1,784.9 Strength of minority investor protection index (0–10) 4.8 Time (years) 1.8 
Cost (% of estate) 10 
Paying taxes (rank) 107 Recovery rate (cents on the dollar) 46.2 
DTF score for paying taxes (0–100) 70.73 Strength of insolvency framework index (0–16) 6 
Payments (number per year) 38 
Time (hours per year) 195 
Total tax rate (% of profit) 31.1 
Note: For resolving insolvency, an economy for which “no practice” is recorded for time and cost receives a score of 0 on the strength of insolvency framework index even if its legal framework includes provisions related to 
insolvency proceedings (liquidation or reorganization). Most indicator sets refer to a case scenario in the largest business city of an economy, except for 11 economies for which the data are a population-weighted average 
for the 2 largest business cities. See the data notes for more details.
186 DOING BUSINESS 2015 
 Reform making it easier to do business  Change making it more difficult to do business 
FINLAND OECD high income GNI per capita (US$) 47,110 
Ease of doing business rank (1–189) 9 Overall distance to frontier (DTF) score (0–100) 80.83 Population (m) 5.4 
Starting a business (rank) 27 Registering property (rank) 38 Trading across borders (rank) 14 
DTF score for starting a business (0–100) 93.10 DTF score for registering property (0–100) 80.58 DTF score for trading across borders (0–100) 89.10 
Procedures (number) 3 Procedures (number) 3 Documents to export (number) 4 
Time (days) 14 Time (days) 32 Time to export (days) 9 
Cost (% of income per capita) 1.1 Cost (% of property value) 4.0 Cost to export (US$ per container) 615 
Minimum capital (% of income per capita) 7.0 Documents to import (number) 5 
Getting credit (rank) 36 Time to import (days) 7 
Dealing with construction permits (rank) 33 DTF score for getting credit (0–100) 65.00 Cost to import (US$ per container) 625 
DTF score for dealing with construction permits (0–100) 81.61 Strength of legal rights index (0–12) 7 
Procedures (number) 15 Depth of credit information index (0–8) 6 Enforcing contracts (rank) 17 
Time (days) 64 Credit bureau coverage (% of adults) 19.6 DTF score for enforcing contracts (0–100) 75.58 
Cost (% of warehouse value) 0.8 Credit registry coverage (% of adults) 0.0 Procedures (number) 33 
Time (days) 375 
Getting electricity (rank) 33 Protecting minority investors (rank) 76 Cost (% of claim) 13.3 
DTF score for getting electricity (0–100) 85.29 DTF score for protecting minority investors (0–100) 55.83 
Procedures (number) 5 Extent of conflict of interest regulation index (0–10) 6.0 Resolving insolvency (rank) 1 
Time (days) 42 Extent of shareholder governance index (0–10) 5.2 DTF score for resolving insolvency (0–100) 93.85 
Cost (% of income per capita) 29.7 Strength of minority investor protection index (0–10) 5.6 Time (years) 0.9 
Cost (% of estate) 4 
Paying taxes (rank) 21 Recovery rate (cents on the dollar) 90.2 
DTF score for paying taxes (0–100) 88.36 Strength of insolvency framework index (0–16) 14.5 
Payments (number per year) 8 
Time (hours per year) 93 
Total tax rate (% of profit) 40.0 
FRANCE OECD high income GNI per capita (US$) 42,250 
Ease of doing business rank (1–189) 31 Overall distance to frontier (DTF) score (0–100) 73.88 Population (m) 66.0 
 Starting a business (rank) 28 Registering property (rank) 126 Trading across borders (rank) 10 
DTF score for starting a business (0–100) 93.00 DTF score for registering property (0–100) 59.36 DTF score for trading across borders (0–100) 90.18 
Procedures (number) 5 Procedures (number) 8 Documents to export (number) 2 
Time (days) 4.5 Time (days) 49 Time to export (days) 10 
Cost (% of income per capita) 0.9 Cost (% of property value) 6.1 Cost to export (US$ per container) 1,335 
Minimum capital (% of income per capita) 0.0 Documents to import (number) 2 
Getting credit (rank) 71 Time to import (days) 11 
Dealing with construction permits (rank) 86 DTF score for getting credit (0–100) 50.00 Cost to import (US$ per container) 1,445 
DTF score for dealing with construction permits (0–100) 73.14 Strength of legal rights index (0–12) 4 
Procedures (number) 8 Depth of credit information index (0–8) 6 Enforcing contracts (rank) 10 
Time (days) 183 Credit bureau coverage (% of adults) 0.0 DTF score for enforcing contracts (0–100) 77.67 
Cost (% of warehouse value) 4.7 Credit registry coverage (% of adults) 44.5 Procedures (number) 29 
Time (days) 395 
Getting electricity (rank) 60 Protecting minority investors (rank) 17 Cost (% of claim) 17.4 
DTF score for getting electricity (0–100) 79.87 DTF score for protecting minority investors (0–100) 67.50 
Procedures (number) 5 Extent of conflict of interest regulation index (0–10) 5.7 Resolving insolvency (rank) 22 
Time (days) 79 Extent of shareholder governance index (0–10) 7.8 DTF score for resolving insolvency (0–100) 75.94 
Cost (% of income per capita) 42.9 Strength of minority investor protection index (0–10) 6.8 Time (years) 1.9 
Cost (% of estate) 9 
Paying taxes (rank) 95 Recovery rate (cents on the dollar) 77.2 
DTF score for paying taxes (0–100) 72.12 Strength of insolvency framework index (0–16) 11 
Payments (number per year) 8 
Time (hours per year) 137 
Total tax rate (% of profit) 66.6 
GABON Sub-Saharan Africa GNI per capita (US$) 10,650 
Ease of doing business rank (1–189) 144 Overall distance to frontier (DTF) score (0–100) 53.43 Population (m) 1.7 
Starting a business (rank) 135  Registering property (rank) 181 Trading across borders (rank) 135 
DTF score for starting a business (0–100) 75.90 DTF score for registering property (0–100) 36.51 DTF score for trading across borders (0–100) 63.26 
Procedures (number) 7 Procedures (number) 6 Documents to export (number) 6 
Time (days) 50 Time (days) 103 Time to export (days) 20 
Cost (% of income per capita) 12.9 Cost (% of property value) 17.5 Cost to export (US$ per container) 2,145 
Minimum capital (% of income per capita) 19.6 Documents to import (number) 8 
Getting credit (rank) 104 Time to import (days) 22 
Dealing with construction permits (rank) 76 DTF score for getting credit (0–100) 40.00 Cost to import (US$ per container) 2,275 
DTF score for dealing with construction permits (0–100) 74.36 Strength of legal rights index (0–12) 6 
Procedures (number) 11 Depth of credit information index (0–8) 2 Enforcing contracts (rank) 156 
Time (days) 194 Credit bureau coverage (% of adults) 0.0 DTF score for enforcing contracts (0–100) 43.51 
Cost (% of warehouse value) 0.9 Credit registry coverage (% of adults) 50.8 Procedures (number) 38 
Time (days) 1,070 
Getting electricity (rank) 129  Protecting minority investors (rank) 146 Cost (% of claim) 34.3 
DTF score for getting electricity (0–100) 64.23 DTF score for protecting minority investors (0–100) 42.50 
Procedures (number) 6 Extent of conflict of interest regulation index (0–10) 4.0 Resolving insolvency (rank) 125 
Time (days) 141 Extent of shareholder governance index (0–10) 4.5 DTF score for resolving insolvency (0–100) 36.29 
Cost (% of income per capita) 311.1 Strength of minority investor protection index (0–10) 4.3 Time (years) 5.0 
Cost (% of estate) 15 
 Paying taxes (rank) 154 Recovery rate (cents on the dollar) 15.2 
DTF score for paying taxes (0–100) 57.75 Strength of insolvency framework index (0–16) 9 
Payments (number per year) 26 
Time (hours per year) 488 
Total tax rate (% of profit) 40.6 
Note: For resolving insolvency, an economy for which “no practice” is recorded for time and cost receives a score of 0 on the strength of insolvency framework index even if its legal framework includes provisions related to 
insolvency proceedings (liquidation or reorganization). Most indicator sets refer to a case scenario in the largest business city of an economy, except for 11 economies for which the data are a population-weighted average 
for the 2 largest business cities. See the data notes for more details.
COUNTRY TABLES 187 
 Reform making it easier to do business  Change making it more difficult to do business 
GAMBIA, THE Sub-Saharan Africa GNI per capita (US$) 510 
Ease of doing business rank (1–189) 138 Overall distance to frontier (DTF) score (0–100) 54.81 Population (m) 1.8 
 Starting a business (rank) 159 Registering property (rank) 113 Trading across borders (rank) 77 
DTF score for starting a business (0–100) 68.37 DTF score for registering property (0–100) 61.54 DTF score for trading across borders (0–100) 75.52 
Procedures (number) 7 Procedures (number) 5 Documents to export (number) 6 
Time (days) 26 Time (days) 66 Time to export (days) 19 
Cost (% of income per capita) 131.2 Cost (% of property value) 7.6 Cost to export (US$ per container) 1,040 
Minimum capital (% of income per capita) 0.0 Documents to import (number) 6 
Getting credit (rank) 160 Time to import (days) 19 
Dealing with construction permits (rank) 71 DTF score for getting credit (0–100) 20.00 Cost to import (US$ per container) 745 
DTF score for dealing with construction permits (0–100) 75.14 Strength of legal rights index (0–12) 4 
Procedures (number) 12 Depth of credit information index (0–8) 0 Enforcing contracts (rank) 49 
Time (days) 144 Credit bureau coverage (% of adults) 0.0 DTF score for enforcing contracts (0–100) 65.49 
Cost (% of warehouse value) 2.5 Credit registry coverage (% of adults) 0.0 Procedures (number) 33 
Time (days) 407 
Getting electricity (rank) 138  Protecting minority investors (rank) 162 Cost (% of claim) 37.9 
DTF score for getting electricity (0–100) 63.05 DTF score for protecting minority investors (0–100) 39.17 
Procedures (number) 5 Extent of conflict of interest regulation index (0–10) 4.0 Resolving insolvency (rank) 102 
Time (days) 78 Extent of shareholder governance index (0–10) 3.8 DTF score for resolving insolvency (0–100) 41.51 
Cost (% of income per capita) 4,166.1 Strength of minority investor protection index (0–10) 3.9 Time (years) 2.0 
Cost (% of estate) 15 
Paying taxes (rank) 180 Recovery rate (cents on the dollar) 27.8 
DTF score for paying taxes (0–100) 38.36 Strength of insolvency framework index (0–16) 8.5 
Payments (number per year) 50 
Time (hours per year) 376 
Total tax rate (% of profit) 63.3 
GEORGIA Europe  Central Asia GNI per capita (US$) 3,570 
Ease of doing business rank (1–189) 15 Overall distance to frontier (DTF) score (0–100) 79.46 Population (m) 4.5 
Starting a business (rank) 5 Registering property (rank) 1 Trading across borders (rank) 33 
DTF score for starting a business (0–100) 97.73 DTF score for registering property (0–100) 99.88 DTF score for trading across borders (0–100) 84.02 
Procedures (number) 2 Procedures (number) 1 Documents to export (number) 4 
Time (days) 2 Time (days) 1 Time to export (days) 9 
Cost (% of income per capita) 3.4 Cost (% of property value) 0.1 Cost to export (US$ per container) 1,355 
Minimum capital (% of income per capita) 0.0 Documents to import (number) 4 
Getting credit (rank) 7 Time to import (days) 10 
Dealing with construction permits (rank) 3 DTF score for getting credit (0–100) 85.00 Cost to import (US$ per container) 1,595 
DTF score for dealing with construction permits (0–100) 91.44 Strength of legal rights index (0–12) 9 
Procedures (number) 8 Depth of credit information index (0–8) 8 Enforcing contracts (rank) 23 
Time (days) 68.5 Credit bureau coverage (% of adults) 56.8 DTF score for enforcing contracts (0–100) 71.82 
Cost (% of warehouse value) 0.3 Credit registry coverage (% of adults) 0.0 Procedures (number) 33 
Time (days) 285 
Getting electricity (rank) 37 Protecting minority investors (rank) 43 Cost (% of claim) 29.9 
DTF score for getting electricity (0–100) 84.69 DTF score for protecting minority investors (0–100) 60.83 
Procedures (number) 4 Extent of conflict of interest regulation index (0–10) 7.3 Resolving insolvency (rank) 122 
Time (days) 71 Extent of shareholder governance index (0–10) 4.8 DTF score for resolving insolvency (0–100) 36.48 
Cost (% of income per capita) 503.8 Strength of minority investor protection index (0–10) 6.1 Time (years) 2.0 
Cost (% of estate) 10 
Paying taxes (rank) 38 Recovery rate (cents on the dollar) 38.7 
DTF score for paying taxes (0–100) 82.76 Strength of insolvency framework index (0–16) 5 
Payments (number per year) 5 
Time (hours per year) 362 
Total tax rate (% of profit) 16.4 
GERMANY OECD high income GNI per capita (US$) 46,100 
Ease of doing business rank (1–189) 14 Overall distance to frontier (DTF) score (0–100) 79.73 Population (m) 80.6 
 Starting a business (rank) 114  Registering property (rank) 89 Trading across borders (rank) 18 
DTF score for starting a business (0–100) 81.38 DTF score for registering property (0–100) 67.78 DTF score for trading across borders (0–100) 87.67 
Procedures (number) 9 Procedures (number) 5 Documents to export (number) 4 
Time (days) 14.5 Time (days) 40 Time to export (days) 9 
Cost (% of income per capita) 8.8 Cost (% of property value) 6.7 Cost to export (US$ per container) 1,015 
Minimum capital (% of income per capita) 35.8 Documents to import (number) 4 
Getting credit (rank) 23 Time to import (days) 7 
Dealing with construction permits (rank) 8 DTF score for getting credit (0–100) 70.00 Cost to import (US$ per container) 1,050 
DTF score for dealing with construction permits (0–100) 87.42 Strength of legal rights index (0–12) 6 
Procedures (number) 8 Depth of credit information index (0–8) 8 Enforcing contracts (rank) 13 
Time (days) 96 Credit bureau coverage (% of adults) 100.0 DTF score for enforcing contracts (0–100) 76.74 
Cost (% of warehouse value) 1.1 Credit registry coverage (% of adults) 1.3 Procedures (number) 31 
Time (days) 394 
Getting electricity (rank) 3 Protecting minority investors (rank) 51 Cost (% of claim) 14.4 
DTF score for getting electricity (0–100) 98.37 DTF score for protecting minority investors (0–100) 59.17 
Procedures (number) 3 Extent of conflict of interest regulation index (0–10) 5.0 Resolving insolvency (rank) 3 
Time (days) 28 Extent of shareholder governance index (0–10) 6.8 DTF score for resolving insolvency (0–100) 91.78 
Cost (% of income per capita) 44.4 Strength of minority investor protection index (0–10) 5.9 Time (years) 1.2 
Cost (% of estate) 8 
Paying taxes (rank) 68 Recovery rate (cents on the dollar) 83.4 
DTF score for paying taxes (0–100) 77.02 Strength of insolvency framework index (0–16) 15 
Payments (number per year) 9 
Time (hours per year) 218 
Total tax rate (% of profit) 48.8 
Note: For resolving insolvency, an economy for which “no practice” is recorded for time and cost receives a score of 0 on the strength of insolvency framework index even if its legal framework includes provisions related to 
insolvency proceedings (liquidation or reorganization). Most indicator sets refer to a case scenario in the largest business city of an economy, except for 11 economies for which the data are a population-weighted average 
for the 2 largest business cities. See the data notes for more details.
188 DOING BUSINESS 2015 
 Reform making it easier to do business  Change making it more difficult to do business 
GHANA Sub-Saharan Africa GNI per capita (US$) 1,760 
Ease of doing business rank (1–189) 70 Overall distance to frontier (DTF) score (0–100) 65.24 Population (m) 25.9 
Starting a business (rank) 96 Registering property (rank) 43  Trading across borders (rank) 120 
DTF score for starting a business (0–100) 83.73 DTF score for registering property (0–100) 79.23 DTF score for trading across borders (0–100) 67.10 
Procedures (number) 8 Procedures (number) 5 Documents to export (number) 6 
Time (days) 14 Time (days) 46 Time to export (days) 19 
Cost (% of income per capita) 19.2 Cost (% of property value) 1.1 Cost to export (US$ per container) 875 
Minimum capital (% of income per capita) 2.8 Documents to import (number) 7 
Getting credit (rank) 36 Time to import (days) 41 
 Dealing with construction permits (rank) 106 DTF score for getting credit (0–100) 65.00 Cost to import (US$ per container) 1,360 
DTF score for dealing with construction permits (0–100) 69.14 Strength of legal rights index (0–12) 7 
Procedures (number) 13 Depth of credit information index (0–8) 6 Enforcing contracts (rank) 96 
Time (days) 201 Credit bureau coverage (% of adults) 14.1 DTF score for enforcing contracts (0–100) 57.59 
Cost (% of warehouse value) 2.0 Credit registry coverage (% of adults) 0.0 Procedures (number) 38 
Time (days) 710 
Getting electricity (rank) 71 Protecting minority investors (rank) 56 Cost (% of claim) 23.0 
DTF score for getting electricity (0–100) 78.29 DTF score for protecting minority investors (0–100) 58.33 
Procedures (number) 4 Extent of conflict of interest regulation index (0–10) 6.7 Resolving insolvency (rank) 161 
Time (days) 79 Extent of shareholder governance index (0–10) 5.0 DTF score for resolving insolvency (0–100) 22.45 
Cost (% of income per capita) 1,778.0 Strength of minority investor protection index (0–10) 5.8 Time (years) 1.9 
Cost (% of estate) 22 
Paying taxes (rank) 101 Recovery rate (cents on the dollar) 24.3 
DTF score for paying taxes (0–100) 71.53 Strength of insolvency framework index (0–16) 3 
Payments (number per year) 32 
Time (hours per year) 224 
Total tax rate (% of profit) 33.3 
GREECE OECD high income GNI per capita (US$) 22,530 
Ease of doing business rank (1–189) 61 Overall distance to frontier (DTF) score (0–100) 66.70 Population (m) 11.0 
 Starting a business (rank) 52  Registering property (rank) 116 Trading across borders (rank) 48 
DTF score for starting a business (0–100) 90.71 DTF score for registering property (0–100) 61.16 DTF score for trading across borders (0–100) 80.80 
Procedures (number) 5 Procedures (number) 10 Documents to export (number) 4 
Time (days) 13 Time (days) 20 Time to export (days) 15 
Cost (% of income per capita) 2.2 Cost (% of property value) 4.9 Cost to export (US$ per container) 1,040 
Minimum capital (% of income per capita) 0.0 Documents to import (number) 6 
Getting credit (rank) 71 Time to import (days) 14 
Dealing with construction permits (rank) 88 DTF score for getting credit (0–100) 50.00 Cost to import (US$ per container) 1,135 
DTF score for dealing with construction permits (0–100) 72.31 Strength of legal rights index (0–12) 3 
Procedures (number) 18 Depth of credit information index (0–8) 7  Enforcing contracts (rank) 155 
Time (days) 124 Credit bureau coverage (% of adults) 82.5 DTF score for enforcing contracts (0–100) 43.60 
Cost (% of warehouse value) 0.6 Credit registry coverage (% of adults) 0.0 Procedures (number) 38 
Time (days) 1,580 
Getting electricity (rank) 80 Protecting minority investors (rank) 62 Cost (% of claim) 14.4 
DTF score for getting electricity (0–100) 76.67 DTF score for protecting minority investors (0–100) 57.50 
Procedures (number) 6 Extent of conflict of interest regulation index (0–10) 5.3 Resolving insolvency (rank) 52 
Time (days) 62 Extent of shareholder governance index (0–10) 6.2 DTF score for resolving insolvency (0–100) 55.98 
Cost (% of income per capita) 69.7 Strength of minority investor protection index (0–10) 5.8 Time (years) 3.5 
Cost (% of estate) 9 
Paying taxes (rank) 59 Recovery rate (cents on the dollar) 34.3 
DTF score for paying taxes (0–100) 78.30 Strength of insolvency framework index (0–16) 12 
Payments (number per year) 8 
Time (hours per year) 193 
Total tax rate (% of profit) 49.9 
GRENADA Latin America  Caribbean GNI per capita (US$) 7,460 
Ease of doing business rank (1–189) 126 Overall distance to frontier (DTF) score (0–100) 57.35 Population (m) 0.1 
Starting a business (rank) 80 Registering property (rank) 128 Trading across borders (rank) 51 
DTF score for starting a business (0–100) 86.70 DTF score for registering property (0–100) 59.12 DTF score for trading across borders (0–100) 80.22 
Procedures (number) 6 Procedures (number) 8 Documents to export (number) 4 
Time (days) 15 Time (days) 32 Time to export (days) 9 
Cost (% of income per capita) 18.4 Cost (% of property value) 7.4 Cost to export (US$ per container) 1,300 
Minimum capital (% of income per capita) 0.0 Documents to import (number) 6 
Getting credit (rank) 131 Time to import (days) 9 
Dealing with construction permits (rank) 40 DTF score for getting credit (0–100) 30.00 Cost to import (US$ per container) 2,170 
DTF score for dealing with construction permits (0–100) 79.00 Strength of legal rights index (0–12) 6 
Procedures (number) 13 Depth of credit information index (0–8) 0 Enforcing contracts (rank) 144 
Time (days) 128 Credit bureau coverage (% of adults) 0.0 DTF score for enforcing contracts (0–100) 46.25 
Cost (% of warehouse value) 0.3 Credit registry coverage (% of adults) 0.0 Procedures (number) 46 
Time (days) 688 
Getting electricity (rank) 77 Protecting minority investors (rank) 141 Cost (% of claim) 32.6 
DTF score for getting electricity (0–100) 77.78 DTF score for protecting minority investors (0–100) 43.33 
Procedures (number) 6 Extent of conflict of interest regulation index (0–10) 6.7 Resolving insolvency (rank) 189 
Time (days) 49 Extent of shareholder governance index (0–10) 2.0 DTF score for resolving insolvency (0–100) 0.00 
Cost (% of income per capita) 257.9 Strength of minority investor protection index (0–10) 4.3 Time (years) NO PRACTICE 
Cost (% of estate) NO PRACTICE 
Paying taxes (rank) 106 Recovery rate (cents on the dollar) 0.0 
DTF score for paying taxes (0–100) 71.12 Strength of insolvency framework index (0–16) 0 
Payments (number per year) 30 
Time (hours per year) 140 
Total tax rate (% of profit) 45.3 
Note: For resolving insolvency, an economy for which “no practice” is recorded for time and cost receives a score of 0 on the strength of insolvency framework index even if its legal framework includes provisions related to 
insolvency proceedings (liquidation or reorganization). Most indicator sets refer to a case scenario in the largest business city of an economy, except for 11 economies for which the data are a population-weighted average 
for the 2 largest business cities. See the data notes for more details.
COUNTRY TABLES 189 
 Reform making it easier to do business  Change making it more difficult to do business 
GUATEMALA Latin America  Caribbean GNI per capita (US$) 3,340 
Ease of doing business rank (1–189) 73 Overall distance to frontier (DTF) score (0–100) 64.88 Population (m) 15.5 
 Starting a business (rank) 98 Registering property (rank) 65 Trading across borders (rank) 102 
DTF score for starting a business (0–100) 83.72 DTF score for registering property (0–100) 74.07 DTF score for trading across borders (0–100) 70.10 
Procedures (number) 6 Procedures (number) 6 Documents to export (number) 8 
Time (days) 18.5 Time (days) 24 Time to export (days) 17 
Cost (% of income per capita) 25.8 Cost (% of property value) 3.8 Cost to export (US$ per container) 1,355 
Minimum capital (% of income per capita) 18.7 Documents to import (number) 6 
Getting credit (rank) 12 Time to import (days) 16 
Dealing with construction permits (rank) 122 DTF score for getting credit (0–100) 80.00 Cost to import (US$ per container) 1,445 
DTF score for dealing with construction permits (0–100) 66.18 Strength of legal rights index (0–12) 9 
Procedures (number) 11 Depth of credit information index (0–8) 7 Enforcing contracts (rank) 143 
Time (days) 158 Credit bureau coverage (% of adults) 8.7 DTF score for enforcing contracts (0–100) 46.35 
Cost (% of warehouse value) 7.9 Credit registry coverage (% of adults) 19.2 Procedures (number) 31 
Time (days) 1,402 
Getting electricity (rank) 18 Protecting minority investors (rank) 174 Cost (% of claim) 26.5 
DTF score for getting electricity (0–100) 89.28 DTF score for protecting minority investors (0–100) 31.67 
Procedures (number) 4 Extent of conflict of interest regulation index (0–10) 3.3 Resolving insolvency (rank) 155 
Time (days) 39 Extent of shareholder governance index (0–10) 3.0 DTF score for resolving insolvency (0–100) 27.37 
Cost (% of income per capita) 514.6 Strength of minority investor protection index (0–10) 3.2 Time (years) 3.0 
Cost (% of estate) 15 
 Paying taxes (rank) 54 Recovery rate (cents on the dollar) 27.6 
DTF score for paying taxes (0–100) 80.04 Strength of insolvency framework index (0–16) 4 
Payments (number per year) 8 
Time (hours per year) 256 
Total tax rate (% of profit) 39.9 
GUINEA Sub-Saharan Africa GNI per capita (US$) 460 
Ease of doing business rank (1–189) 169 Overall distance to frontier (DTF) score (0–100) 47.42 Population (m) 11.7 
Starting a business (rank) 175  Registering property (rank) 122 Trading across borders (rank) 141 
DTF score for starting a business (0–100) 55.44 DTF score for registering property (0–100) 60.14 DTF score for trading across borders (0–100) 60.25 
Procedures (number) 6 Procedures (number) 6 Documents to export (number) 7 
Time (days) 8 Time (days) 44 Time to export (days) 36 
Cost (% of income per capita) 82.6 Cost (% of property value) 8.6 Cost to export (US$ per container) 915 
Minimum capital (% of income per capita) 416.0 Documents to import (number) 8 
Getting credit (rank) 131 Time to import (days) 31 
Dealing with construction permits (rank) 159 DTF score for getting credit (0–100) 30.00 Cost to import (US$ per container) 1,480 
DTF score for dealing with construction permits (0–100) 55.92 Strength of legal rights index (0–12) 6 
Procedures (number) 26 Depth of credit information index (0–8) 0 Enforcing contracts (rank) 133 
Time (days) 166 Credit bureau coverage (% of adults) 0.0 DTF score for enforcing contracts (0–100) 49.74 
Cost (% of warehouse value) 1.6 Credit registry coverage (% of adults) 0.0 Procedures (number) 49 
Time (days) 276 
Getting electricity (rank) 154  Protecting minority investors (rank) 162 Cost (% of claim) 45.0 
DTF score for getting electricity (0–100) 57.61 DTF score for protecting minority investors (0–100) 39.17 
Procedures (number) 4 Extent of conflict of interest regulation index (0–10) 3.3 Resolving insolvency (rank) 119 
Time (days) 69 Extent of shareholder governance index (0–10) 4.5 DTF score for resolving insolvency (0–100) 37.62 
Cost (% of income per capita) 7,155.6 Strength of minority investor protection index (0–10) 3.9 Time (years) 3.8 
Cost (% of estate) 8 
Paying taxes (rank) 184 Recovery rate (cents on the dollar) 17.6 
DTF score for paying taxes (0–100) 28.27 Strength of insolvency framework index (0–16) 9 
Payments (number per year) 57 
Time (hours per year) 440 
Total tax rate (% of profit) 68.3 
GUINEA-BISSAU Sub-Saharan Africa GNI per capita (US$) 520 
Ease of doing business rank (1–189) 179 Overall distance to frontier (DTF) score (0–100) 43.21 Population (m) 1.7 
Starting a business (rank) 176 Registering property (rank) 160 Trading across borders (rank) 119 
DTF score for starting a business (0–100) 54.83 DTF score for registering property (0–100) 48.92 DTF score for trading across borders (0–100) 67.41 
Procedures (number) 9 Procedures (number) 8 Documents to export (number) 6 
Time (days) 9 Time (days) 51 Time to export (days) 25 
Cost (% of income per capita) 50.1 Cost (% of property value) 10.6 Cost to export (US$ per container) 1,448 
Minimum capital (% of income per capita) 401.3 Documents to import (number) 6 
Getting credit (rank) 131 Time to import (days) 22 
Dealing with construction permits (rank) 165 DTF score for getting credit (0–100) 30.00 Cost to import (US$ per container) 2,006 
DTF score for dealing with construction permits (0–100) 52.95 Strength of legal rights index (0–12) 6 
Procedures (number) 11 Depth of credit information index (0–8) 0 Enforcing contracts (rank) 169 
Time (days) 116 Credit bureau coverage (% of adults) 0.0 DTF score for enforcing contracts (0–100) 37.54 
Cost (% of warehouse value) 18.2 Credit registry coverage (% of adults) 1.0 Procedures (number) 40 
Time (days) 1,715 
Getting electricity (rank) 180  Protecting minority investors (rank) 122 Cost (% of claim) 25.0 
DTF score for getting electricity (0–100) 35.96 DTF score for protecting minority investors (0–100) 45.83 
Procedures (number) 7 Extent of conflict of interest regulation index (0–10) 4.7 Resolving insolvency (rank) 189 
Time (days) 455 Extent of shareholder governance index (0–10) 4.5 DTF score for resolving insolvency (0–100) 0.00 
Cost (% of income per capita) 2,062.2 Strength of minority investor protection index (0–10) 4.6 Time (years) NO PRACTICE 
Cost (% of estate) NO PRACTICE 
Paying taxes (rank) 150 Recovery rate (cents on the dollar) 0.0 
DTF score for paying taxes (0–100) 58.65 Strength of insolvency framework index (0–16) 0 
Payments (number per year) 46 
Time (hours per year) 208 
Total tax rate (% of profit) 45.5 
Note: For resolving insolvency, an economy for which “no practice” is recorded for time and cost receives a score of 0 on the strength of insolvency framework index even if its legal framework includes provisions related to 
insolvency proceedings (liquidation or reorganization). Most indicator sets refer to a case scenario in the largest business city of an economy, except for 11 economies for which the data are a population-weighted average 
for the 2 largest business cities. See the data notes for more details.
190 DOING BUSINESS 2015 
 Reform making it easier to do business  Change making it more difficult to do business 
GUYANA Latin America  Caribbean GNI per capita (US$) 3,750 
Ease of doing business rank (1–189) 123 Overall distance to frontier (DTF) score (0–100) 57.83 Population (m) 0.8 
Starting a business (rank) 99 Registering property (rank) 103 Trading across borders (rank) 82 
DTF score for starting a business (0–100) 83.62 DTF score for registering property (0–100) 64.08 DTF score for trading across borders (0–100) 74.63 
Procedures (number) 8 Procedures (number) 6 Documents to export (number) 6 
Time (days) 19 Time (days) 75 Time to export (days) 19 
Cost (% of income per capita) 11.5 Cost (% of property value) 4.6 Cost to export (US$ per container) 730 
Minimum capital (% of income per capita) 0.0 Documents to import (number) 7 
Getting credit (rank) 165 Time to import (days) 22 
Dealing with construction permits (rank) 38 DTF score for getting credit (0–100) 15.00 Cost to import (US$ per container) 720 
DTF score for dealing with construction permits (0–100) 80.06 Strength of legal rights index (0–12) 3 
Procedures (number) 7 Depth of credit information index (0–8) 0 Enforcing contracts (rank) 71 
Time (days) 195 Credit bureau coverage (% of adults) 0.0 DTF score for enforcing contracts (0–100) 62.37 
Cost (% of warehouse value) 0.6 Credit registry coverage (% of adults) 0.0 Procedures (number) 36 
Time (days) 581 
Getting electricity (rank) 155 Protecting minority investors (rank) 135 Cost (% of claim) 25.2 
DTF score for getting electricity (0–100) 57.21 DTF score for protecting minority investors (0–100) 44.17 
Procedures (number) 8 Extent of conflict of interest regulation index (0–10) 5.3 Resolving insolvency (rank) 150 
Time (days) 109 Extent of shareholder governance index (0–10) 3.5 DTF score for resolving insolvency (0–100) 28.50 
Cost (% of income per capita) 442.9 Strength of minority investor protection index (0–10) 4.4 Time (years) 3.0 
Cost (% of estate) 29 
Paying taxes (rank) 115 Recovery rate (cents on the dollar) 18.1 
DTF score for paying taxes (0–100) 68.69 Strength of insolvency framework index (0–16) 6 
Payments (number per year) 35 
Time (hours per year) 256 
Total tax rate (% of profit) 32.3 
HAITI Latin America  Caribbean GNI per capita (US$) 810 
Ease of doing business rank (1–189) 180 Overall distance to frontier (DTF) score (0–100) 42.18 Population (m) 10.3 
Starting a business (rank) 188 Registering property (rank) 175 Trading across borders (rank) 142 
DTF score for starting a business (0–100) 33.48 DTF score for registering property (0–100) 39.79 DTF score for trading across borders (0–100) 59.98 
Procedures (number) 12 Procedures (number) 5 Documents to export (number) 8 
Time (days) 97 Time (days) 312 Time to export (days) 28 
Cost (% of income per capita) 246.7 Cost (% of property value) 7.1 Cost to export (US$ per container) 1,200 
Minimum capital (% of income per capita) 17.6 Documents to import (number) 9 
Getting credit (rank) 171 Time to import (days) 26 
Dealing with construction permits (rank) 132 DTF score for getting credit (0–100) 10.00 Cost to import (US$ per container) 1,555 
DTF score for dealing with construction permits (0–100) 64.42 Strength of legal rights index (0–12) 2 
Procedures (number) 8 Depth of credit information index (0–8) 0 Enforcing contracts (rank) 89 
Time (days) 71 Credit bureau coverage (% of adults) 0.0 DTF score for enforcing contracts (0–100) 58.28 
Cost (% of warehouse value) 16.4 Credit registry coverage (% of adults) 1.1 Procedures (number) 35 
Time (days) 530 
Getting electricity (rank) 94 Protecting minority investors (rank) 187 Cost (% of claim) 42.6 
DTF score for getting electricity (0–100) 73.97 DTF score for protecting minority investors (0–100) 20.00 
Procedures (number) 4 Extent of conflict of interest regulation index (0–10) 3.0 Resolving insolvency (rank) 189 
Time (days) 60 Extent of shareholder governance index (0–10) 1.0 DTF score for resolving insolvency (0–100) 0.00 
Cost (% of income per capita) 3,495.8 Strength of minority investor protection index (0–10) 2.0 Time (years) NO PRACTICE 
Cost (% of estate) NO PRACTICE 
Paying taxes (rank) 142 Recovery rate (cents on the dollar) 0.0 
DTF score for paying taxes (0–100) 61.87 Strength of insolvency framework index (0–16) 0 
Payments (number per year) 47 
Time (hours per year) 184 
Total tax rate (% of profit) 40.3 
HONDURAS Latin America  Caribbean GNI per capita (US$) 2,180 
Ease of doing business rank (1–189) 104 Overall distance to frontier (DTF) score (0–100) 60.61 Population (m) 8.1 
Starting a business (rank) 138 Registering property (rank) 81 Trading across borders (rank) 70 
DTF score for starting a business (0–100) 74.84 DTF score for registering property (0–100) 70.09 DTF score for trading across borders (0–100) 76.50 
Procedures (number) 12 Procedures (number) 6 Documents to export (number) 5 
Time (days) 14 Time (days) 22 Time to export (days) 12 
Cost (% of income per capita) 39.0 Cost (% of property value) 5.7 Cost to export (US$ per container) 1,450 
Minimum capital (% of income per capita) 11.5 Documents to import (number) 6 
Getting credit (rank) 7 Time to import (days) 16 
 Dealing with construction permits (rank) 103 DTF score for getting credit (0–100) 85.00 Cost to import (US$ per container) 1,630 
DTF score for dealing with construction permits (0–100) 69.37 Strength of legal rights index (0–12) 9 
Procedures (number) 15 Depth of credit information index (0–8) 8 Enforcing contracts (rank) 166 
Time (days) 82 Credit bureau coverage (% of adults) 36.1 DTF score for enforcing contracts (0–100) 37.90 
Cost (% of warehouse value) 7.2 Credit registry coverage (% of adults) 21.8 Procedures (number) 47 
Time (days) 920 
Getting electricity (rank) 110 Protecting minority investors (rank) 174 Cost (% of claim) 35.2 
DTF score for getting electricity (0–100) 70.96 DTF score for protecting minority investors (0–100) 31.67 
Procedures (number) 7 Extent of conflict of interest regulation index (0–10) 3.3 Resolving insolvency (rank) 140 
Time (days) 39 Extent of shareholder governance index (0–10) 3.0 DTF score for resolving insolvency (0–100) 31.83 
Cost (% of income per capita) 918.0 Strength of minority investor protection index (0–10) 3.2 Time (years) 3.8 
Cost (% of estate) 15 
Paying taxes (rank) 153 Recovery rate (cents on the dollar) 18.5 
DTF score for paying taxes (0–100) 57.92 Strength of insolvency framework index (0–16) 7 
Payments (number per year) 48 
Time (hours per year) 224 
Total tax rate (% of profit) 43.0 
Note: For resolving insolvency, an economy for which “no practice” is recorded for time and cost receives a score of 0 on the strength of insolvency framework index even if its legal framework includes provisions related to 
insolvency proceedings (liquidation or reorganization). Most indicator sets refer to a case scenario in the largest business city of an economy, except for 11 economies for which the data are a population-weighted average 
for the 2 largest business cities. See the data notes for more details.
COUNTRY TABLES 191 
 Reform making it easier to do business  Change making it more difficult to do business 
HONG KONG SAR, CHINA East Asia  Pacific GNI per capita (US$) 38,420 
Ease of doing business rank (1–189) 3 Overall distance to frontier (DTF) score (0–100) 84.97 Population (m) 7.2 
 Starting a business (rank) 8 Registering property (rank) 96 Trading across borders (rank) 2 
DTF score for starting a business (0–100) 96.38 DTF score for registering property (0–100) 66.19 DTF score for trading across borders (0–100) 95.36 
Procedures (number) 3 Procedures (number) 5 Documents to export (number) 3 
Time (days) 2.5 Time (days) 35.5 Time to export (days) 6 
Cost (% of income per capita) 1.4 Cost (% of property value) 7.7 Cost to export (US$ per container) 590 
Minimum capital (% of income per capita) 0.0 Documents to import (number) 3 
Getting credit (rank) 23 Time to import (days) 5 
Dealing with construction permits (rank) 1 DTF score for getting credit (0–100) 70.00 Cost to import (US$ per container) 565 
DTF score for dealing with construction permits (0–100) 95.53 Strength of legal rights index (0–12) 7 
Procedures (number) 5 Depth of credit information index (0–8) 7 Enforcing contracts (rank) 6 
Time (days) 66 Credit bureau coverage (% of adults) 96.1 DTF score for enforcing contracts (0–100) 80.32 
Cost (% of warehouse value) 0.4 Credit registry coverage (% of adults) 0.0 Procedures (number) 26 
Time (days) 360 
Getting electricity (rank) 13  Protecting minority investors (rank) 2 Cost (% of claim) 21.2 
DTF score for getting electricity (0–100) 91.54 DTF score for protecting minority investors (0–100) 80.83 
Procedures (number) 4 Extent of conflict of interest regulation index (0–10) 9.0 Resolving insolvency (rank) 25 
Time (days) 38 Extent of shareholder governance index (0–10) 7.2 DTF score for resolving insolvency (0–100) 75.06 
Cost (% of income per capita) 1.4 Strength of minority investor protection index (0–10) 8.1 Time (years) 0.8 
Cost (% of estate) 5 
Paying taxes (rank) 4 Recovery rate (cents on the dollar) 87.2 
DTF score for paying taxes (0–100) 98.51 Strength of insolvency framework index (0–16) 9 
Payments (number per year) 3 
Time (hours per year) 78 
Total tax rate (% of profit) 22.8 
HUNGARY Europe  Central Asia GNI per capita (US$) 12,410 
Ease of doing business rank (1–189) 54 Overall distance to frontier (DTF) score (0–100) 68.80 Population (m) 9.9 
 Starting a business (rank) 57 Registering property (rank) 52 Trading across borders (rank) 72 
DTF score for starting a business (0–100) 90.04 DTF score for registering property (0–100) 78.04 DTF score for trading across borders (0–100) 76.48 
Procedures (number) 4 Procedures (number) 4 Documents to export (number) 6 
Time (days) 5 Time (days) 16.5 Time to export (days) 17 
Cost (% of income per capita) 8.3 Cost (% of property value) 5.0 Cost to export (US$ per container) 885 
Minimum capital (% of income per capita) 54.0 Documents to import (number) 6 
 Getting credit (rank) 17 Time to import (days) 19 
Dealing with construction permits (rank) 103 DTF score for getting credit (0–100) 75.00 Cost to import (US$ per container) 845 
DTF score for dealing with construction permits (0–100) 69.37 Strength of legal rights index (0–12) 10 
Procedures (number) 23 Depth of credit information index (0–8) 5 Enforcing contracts (rank) 20 
Time (days) 91 Credit bureau coverage (% of adults) 74.6 DTF score for enforcing contracts (0–100) 73.36 
Cost (% of warehouse value) 0.2 Credit registry coverage (% of adults) 0.0 Procedures (number) 34 
Time (days) 395 
Getting electricity (rank) 162 Protecting minority investors (rank) 110 Cost (% of claim) 15.0 
DTF score for getting electricity (0–100) 55.10 DTF score for protecting minority investors (0–100) 47.50 
Procedures (number) 5 Extent of conflict of interest regulation index (0–10) 4.0 Resolving insolvency (rank) 64 
Time (days) 252 Extent of shareholder governance index (0–10) 5.5 DTF score for resolving insolvency (0–100) 49.78 
Cost (% of income per capita) 111.5 Strength of minority investor protection index (0–10) 4.8 Time (years) 2.0 
Cost (% of estate) 15 
 Paying taxes (rank) 88 Recovery rate (cents on the dollar) 40.2 
DTF score for paying taxes (0–100) 73.27 Strength of insolvency framework index (0–16) 9 
Payments (number per year) 11 
Time (hours per year) 277 
Total tax rate (% of profit) 48.0 
ICELAND OECD high income GNI per capita (US$) 43,930 
Ease of doing business rank (1–189) 12 Overall distance to frontier (DTF) score (0–100) 80.27 Population (m) 0.3 
 Starting a business (rank) 31  Registering property (rank) 23 Trading across borders (rank) 39 
DTF score for starting a business (0–100) 92.35 DTF score for registering property (0–100) 86.03 DTF score for trading across borders (0–100) 83.23 
Procedures (number) 5 Procedures (number) 3 Documents to export (number) 4 
Time (days) 4 Time (days) 3.5 Time to export (days) 10 
Cost (% of income per capita) 2.4 Cost (% of property value) 3.6 Cost to export (US$ per container) 1,530 
Minimum capital (% of income per capita) 9.3 Documents to import (number) 4 
Getting credit (rank) 52 Time to import (days) 9 
Dealing with construction permits (rank) 56 DTF score for getting credit (0–100) 60.00 Cost to import (US$ per container) 1,620 
DTF score for dealing with construction permits (0–100) 77.60 Strength of legal rights index (0–12) 5 
Procedures (number) 17 Depth of credit information index (0–8) 7 Enforcing contracts (rank) 3 
Time (days) 84 Credit bureau coverage (% of adults) 100.0 DTF score for enforcing contracts (0–100) 82.30 
Cost (% of warehouse value) 0.5 Credit registry coverage (% of adults) 0.0 Procedures (number) 27 
Time (days) 417 
Getting electricity (rank) 9 Protecting minority investors (rank) 28 Cost (% of claim) 9.0 
DTF score for getting electricity (0–100) 93.81 DTF score for protecting minority investors (0–100) 65.00 
Procedures (number) 4 Extent of conflict of interest regulation index (0–10) 6.7 Resolving insolvency (rank) 15 
Time (days) 22 Extent of shareholder governance index (0–10) 6.3 DTF score for resolving insolvency (0–100) 81.47 
Cost (% of income per capita) 12.7 Strength of minority investor protection index (0–10) 6.5 Time (years) 1.0 
Cost (% of estate) 4 
Paying taxes (rank) 46 Recovery rate (cents on the dollar) 84.6 
DTF score for paying taxes (0–100) 80.86 Strength of insolvency framework index (0–16) 11.5 
Payments (number per year) 26 
Time (hours per year) 140 
Total tax rate (% of profit) 29.7 
Note: For resolving insolvency, an economy for which “no practice” is recorded for time and cost receives a score of 0 on the strength of insolvency framework index even if its legal framework includes provisions related to 
insolvency proceedings (liquidation or reorganization). Most indicator sets refer to a case scenario in the largest business city of an economy, except for 11 economies for which the data are a population-weighted average 
for the 2 largest business cities. See the data notes for more details.
192 DOING BUSINESS 2015 
 Reform making it easier to do business  Change making it more difficult to do business 
INDIA South Asia GNI per capita (US$) 1,570 
Ease of doing business rank (1–189) 142 Overall distance to frontier (DTF) score (0–100) 53.97 Population (m) 1,252.1 
 Starting a business (rank) 158 Registering property (rank) 121 Trading across borders (rank) 126 
DTF score for starting a business (0–100) 68.42 DTF score for registering property (0–100) 60.40 DTF score for trading across borders (0–100) 65.47 
Procedures (number) 11.9 Procedures (number) 7 Documents to export (number) 7 
Time (days) 28.4 Time (days) 47 Time to export (days) 17.1 
Cost (% of income per capita) 12.2 Cost (% of property value) 7.0 Cost to export (US$ per container) 1,332 
Minimum capital (% of income per capita) 111.2 Documents to import (number) 10 
Getting credit (rank) 36 Time to import (days) 21.1 
Dealing with construction permits (rank) 184 DTF score for getting credit (0–100) 65.00 Cost to import (US$ per container) 1,462 
DTF score for dealing with construction permits (0–100) 30.89 Strength of legal rights index (0–12) 6 
Procedures (number) 25.4 Depth of credit information index (0–8) 7 Enforcing contracts (rank) 186 
Time (days) 185.9 Credit bureau coverage (% of adults) 22.4 DTF score for enforcing contracts (0–100) 25.81 
Cost (% of warehouse value) 28.2 Credit registry coverage (% of adults) 0.0 Procedures (number) 46 
Time (days) 1,420 
 Getting electricity (rank) 137  Protecting minority investors (rank) 7 Cost (% of claim) 39.6 
DTF score for getting electricity (0–100) 63.06 DTF score for protecting minority investors (0–100) 72.50 
Procedures (number) 7 Extent of conflict of interest regulation index (0–10) 6.7 Resolving insolvency (rank) 137 
Time (days) 105.7 Extent of shareholder governance index (0–10) 7.8 DTF score for resolving insolvency (0–100) 32.60 
Cost (% of income per capita) 487.7 Strength of minority investor protection index (0–10) 7.3 Time (years) 4.3 
Cost (% of estate) 9 
Paying taxes (rank) 156 Recovery rate (cents on the dollar) 25.7 
DTF score for paying taxes (0–100) 55.53 Strength of insolvency framework index (0–16) 6 
Payments (number per year) 33 
Time (hours per year) 243 
Total tax rate (% of profit) 61.7 
INDONESIA East Asia  Pacific GNI per capita (US$) 3,580 
Ease of doing business rank (1–189) 114 Overall distance to frontier (DTF) score (0–100) 59.15 Population (m) 249.9 
 Starting a business (rank) 155 Registering property (rank) 117  Trading across borders (rank) 62 
DTF score for starting a business (0–100) 68.84 DTF score for registering property (0–100) 60.74 DTF score for trading across borders (0–100) 77.46 
Procedures (number) 10 Procedures (number) 5 Documents to export (number) 4 
Time (days) 52.5 Time (days) 27.4 Time to export (days) 17 
Cost (% of income per capita) 21.1 Cost (% of property value) 10.8 Cost to export (US$ per container) 572 
Minimum capital (% of income per capita) 35.5 Documents to import (number) 8 
Getting credit (rank) 71 Time to import (days) 26 
Dealing with construction permits (rank) 153 DTF score for getting credit (0–100) 50.00 Cost to import (US$ per container) 647 
DTF score for dealing with construction permits (0–100) 59.03 Strength of legal rights index (0–12) 4 
Procedures (number) 17 Depth of credit information index (0–8) 6 Enforcing contracts (rank) 172 
Time (days) 211 Credit bureau coverage (% of adults) 0.0 DTF score for enforcing contracts (0–100) 37.28 
Cost (% of warehouse value) 4.3 Credit registry coverage (% of adults) 46.4 Procedures (number) 40 
Time (days) 471 
 Getting electricity (rank) 78 Protecting minority investors (rank) 43 Cost (% of claim) 115.7 
DTF score for getting electricity (0–100) 76.90 DTF score for protecting minority investors (0–100) 60.83 
Procedures (number) 5 Extent of conflict of interest regulation index (0–10) 6.0 Resolving insolvency (rank) 75 
Time (days) 90.7 Extent of shareholder governance index (0–10) 6.2 DTF score for resolving insolvency (0–100) 46.75 
Cost (% of income per capita) 353.6 Strength of minority investor protection index (0–10) 6.1 Time (years) 1.9 
Cost (% of estate) 22 
 Paying taxes (rank) 160 Recovery rate (cents on the dollar) 31.7 
DTF score for paying taxes (0–100) 53.66 Strength of insolvency framework index (0–16) 9.5 
Payments (number per year) 65 
Time (hours per year) 253.5 
Total tax rate (% of profit) 31.4 
IRAN, ISLAMIC REP. Middle East  North Africa GNI per capita (US$) 5,780 
Ease of doing business rank (1–189) 130 Overall distance to frontier (DTF) score (0–100) 56.51 Population (m) 77.4 
 Starting a business (rank) 62 Registering property (rank) 161 Trading across borders (rank) 148 
DTF score for starting a business (0–100) 89.37 DTF score for registering property (0–100) 48.78 DTF score for trading across borders (0–100) 56.81 
Procedures (number) 6 Procedures (number) 9 Documents to export (number) 7 
Time (days) 12 Time (days) 35 Time to export (days) 25 
Cost (% of income per capita) 3.1 Cost (% of property value) 10.6 Cost to export (US$ per container) 1,350 
Minimum capital (% of income per capita) 0.0 Documents to import (number) 11 
Getting credit (rank) 89 Time to import (days) 37 
Dealing with construction permits (rank) 172 DTF score for getting credit (0–100) 45.00 Cost to import (US$ per container) 1,555 
DTF score for dealing with construction permits (0–100) 49.72 Strength of legal rights index (0–12) 2 
Procedures (number) 15 Depth of credit information index (0–8) 7 Enforcing contracts (rank) 66 
Time (days) 318.5 Credit bureau coverage (% of adults) 33.8 DTF score for enforcing contracts (0–100) 63.35 
Cost (% of warehouse value) 5.3 Credit registry coverage (% of adults) 45.0 Procedures (number) 40 
Time (days) 505 
 Getting electricity (rank) 107 Protecting minority investors (rank) 154 Cost (% of claim) 17.0 
DTF score for getting electricity (0–100) 71.22 DTF score for protecting minority investors (0–100) 41.67 
Procedures (number) 6 Extent of conflict of interest regulation index (0–10) 4.0 Resolving insolvency (rank) 138 
Time (days) 77 Extent of shareholder governance index (0–10) 4.3 DTF score for resolving insolvency (0–100) 32.38 
Cost (% of income per capita) 865.6 Strength of minority investor protection index (0–10) 4.2 Time (years) 4.5 
Cost (% of estate) 15 
Paying taxes (rank) 124 Recovery rate (cents on the dollar) 19.5 
DTF score for paying taxes (0–100) 66.78 Strength of insolvency framework index (0–16) 7 
Payments (number per year) 20 
Time (hours per year) 344 
Total tax rate (% of profit) 44.1 
Note: For resolving insolvency, an economy for which “no practice” is recorded for time and cost receives a score of 0 on the strength of insolvency framework index even if its legal framework includes provisions related to 
insolvency proceedings (liquidation or reorganization). Most indicator sets refer to a case scenario in the largest business city of an economy, except for 11 economies for which the data are a population-weighted average 
for the 2 largest business cities. See the data notes for more details.
COUNTRY TABLES 193 
 Reform making it easier to do business  Change making it more difficult to do business 
IRAQ Middle East  North Africa GNI per capita (US$) 6,710 
Ease of doing business rank (1–189) 156 Overall distance to frontier (DTF) score (0–100) 50.36 Population (m) 33.4 
Starting a business (rank) 142 Registering property (rank) 109 Trading across borders (rank) 178 
DTF score for starting a business (0–100) 74.03 DTF score for registering property (0–100) 62.62 DTF score for trading across borders (0–100) 20.48 
Procedures (number) 10 Procedures (number) 5 Documents to export (number) 10 
Time (days) 29 Time (days) 51 Time to export (days) 80 
Cost (% of income per capita) 38.2 Cost (% of property value) 8.2 Cost to export (US$ per container) 3,550 
Minimum capital (% of income per capita) 12.8 Documents to import (number) 10 
Getting credit (rank) 180 Time to import (days) 82 
Dealing with construction permits (rank) 9 DTF score for getting credit (0–100) 5.00 Cost to import (US$ per container) 3,650 
DTF score for dealing with construction permits (0–100) 86.65 Strength of legal rights index (0–12) 1 
Procedures (number) 8 Depth of credit information index (0–8) 0 Enforcing contracts (rank) 141 
Time (days) 119 Credit bureau coverage (% of adults) 0.0 DTF score for enforcing contracts (0–100) 47.32 
Cost (% of warehouse value) 0.3 Credit registry coverage (% of adults) 0.0 Procedures (number) 51 
Time (days) 520 
Getting electricity (rank) 36 Protecting minority investors (rank) 146 Cost (% of claim) 28.1 
DTF score for getting electricity (0–100) 84.95 DTF score for protecting minority investors (0–100) 42.50 
Procedures (number) 4 Extent of conflict of interest regulation index (0–10) 4.7 Resolving insolvency (rank) 189 
Time (days) 77 Extent of shareholder governance index (0–10) 3.8 DTF score for resolving insolvency (0–100) 0.00 
Cost (% of income per capita) 228.9 Strength of minority investor protection index (0–10) 4.3 Time (years) NO PRACTICE 
Cost (% of estate) NO PRACTICE 
Paying taxes (rank) 52 Recovery rate (cents on the dollar) 0.0 
DTF score for paying taxes (0–100) 80.09 Strength of insolvency framework index (0–16) 0 
Payments (number per year) 13 
Time (hours per year) 312 
Total tax rate (% of profit) 27.8 
IRELAND OECD high income GNI per capita (US$) 39,110 
Ease of doing business rank (1–189) 13 Overall distance to frontier (DTF) score (0–100) 80.07 Population (m) 4.6 
Starting a business (rank) 19  Registering property (rank) 50 Trading across borders (rank) 5 
DTF score for starting a business (0–100) 94.17 DTF score for registering property (0–100) 78.34 DTF score for trading across borders (0–100) 93.01 
Procedures (number) 4 Procedures (number) 5 Documents to export (number) 2 
Time (days) 6 Time (days) 31.5 Time to export (days) 8 
Cost (% of income per capita) 0.3 Cost (% of property value) 2.6 Cost to export (US$ per container) 1,160 
Minimum capital (% of income per capita) 0.0 Documents to import (number) 2 
 Getting credit (rank) 23 Time to import (days) 9 
Dealing with construction permits (rank) 128 DTF score for getting credit (0–100) 70.00 Cost to import (US$ per container) 1,121 
DTF score for dealing with construction permits (0–100) 65.61 Strength of legal rights index (0–12) 7 
Procedures (number) 10 Depth of credit information index (0–8) 7  Enforcing contracts (rank) 18 
Time (days) 150 Credit bureau coverage (% of adults) 100.0 DTF score for enforcing contracts (0–100) 75.47 
Cost (% of warehouse value) 9.5 Credit registry coverage (% of adults) 0.0 Procedures (number) 21 
Time (days) 650 
Getting electricity (rank) 67 Protecting minority investors (rank) 6 Cost (% of claim) 26.9 
DTF score for getting electricity (0–100) 78.84 DTF score for protecting minority investors (0–100) 73.33 
Procedures (number) 5 Extent of conflict of interest regulation index (0–10) 8.3 Resolving insolvency (rank) 21 
Time (days) 85 Extent of shareholder governance index (0–10) 6.3 DTF score for resolving insolvency (0–100) 76.90 
Cost (% of income per capita) 83.3 Strength of minority investor protection index (0–10) 7.3 Time (years) 0.4 
Cost (% of estate) 9 
Paying taxes (rank) 6 Recovery rate (cents on the dollar) 87.7 
DTF score for paying taxes (0–100) 95.07 Strength of insolvency framework index (0–16) 9.5 
Payments (number per year) 9 
Time (hours per year) 80 
Total tax rate (% of profit) 25.9 
ISRAEL OECD high income GNI per capita (US$) 34,120 
Ease of doing business rank (1–189) 40 Overall distance to frontier (DTF) score (0–100) 71.25 Population (m) 8.1 
Starting a business (rank) 53 Registering property (rank) 135 Trading across borders (rank) 12 
DTF score for starting a business (0–100) 90.54 DTF score for registering property (0–100) 57.12 DTF score for trading across borders (0–100) 89.39 
Procedures (number) 5 Procedures (number) 6 Documents to export (number) 4 
Time (days) 13 Time (days) 81 Time to export (days) 10 
Cost (% of income per capita) 3.5 Cost (% of property value) 7.3 Cost to export (US$ per container) 620 
Minimum capital (% of income per capita) 0.0 Documents to import (number) 4 
Getting credit (rank) 36 Time to import (days) 10 
Dealing with construction permits (rank) 121 DTF score for getting credit (0–100) 65.00 Cost to import (US$ per container) 565 
DTF score for dealing with construction permits (0–100) 66.45 Strength of legal rights index (0–12) 6 
Procedures (number) 15 Depth of credit information index (0–8) 7 Enforcing contracts (rank) 111 
Time (days) 209 Credit bureau coverage (% of adults) 100.0 DTF score for enforcing contracts (0–100) 54.93 
Cost (% of warehouse value) 1.6 Credit registry coverage (% of adults) 0.0 Procedures (number) 35 
Time (days) 890 
Getting electricity (rank) 109 Protecting minority investors (rank) 11 Cost (% of claim) 25.3 
DTF score for getting electricity (0–100) 71.11 DTF score for protecting minority investors (0–100) 70.83 
Procedures (number) 6 Extent of conflict of interest regulation index (0–10) 8.3 Resolving insolvency (rank) 24 
Time (days) 102 Extent of shareholder governance index (0–10) 5.8 DTF score for resolving insolvency (0–100) 75.21 
Cost (% of income per capita) 11.8 Strength of minority investor protection index (0–10) 7.1 Time (years) 2.0 
Cost (% of estate) 23 
 Paying taxes (rank) 97 Recovery rate (cents on the dollar) 61.4 
DTF score for paying taxes (0–100) 71.88 Strength of insolvency framework index (0–16) 13.5 
Payments (number per year) 33 
Time (hours per year) 235 
Total tax rate (% of profit) 30.1 
Note: For resolving insolvency, an economy for which “no practice” is recorded for time and cost receives a score of 0 on the strength of insolvency framework index even if its legal framework includes provisions related to 
insolvency proceedings (liquidation or reorganization). Most indicator sets refer to a case scenario in the largest business city of an economy, except for 11 economies for which the data are a population-weighted average 
for the 2 largest business cities. See the data notes for more details.
194 DOING BUSINESS 2015 
 Reform making it easier to do business  Change making it more difficult to do business 
ITALY OECD high income GNI per capita (US$) 34,400 
Ease of doing business rank (1–189) 56 Overall distance to frontier (DTF) score (0–100) 68.48 Population (m) 59.8 
 Starting a business (rank) 46 Registering property (rank) 41 Trading across borders (rank) 37 
DTF score for starting a business (0–100) 91.22 DTF score for registering property (0–100) 79.44 DTF score for trading across borders (0–100) 83.44 
Procedures (number) 5 Procedures (number) 4 Documents to export (number) 3 
Time (days) 5 Time (days) 16 Time to export (days) 19 
Cost (% of income per capita) 14.1 Cost (% of property value) 4.4 Cost to export (US$ per container) 1,195 
Minimum capital (% of income per capita) 0.0 Documents to import (number) 3 
Getting credit (rank) 89 Time to import (days) 18 
Dealing with construction permits (rank) 116 DTF score for getting credit (0–100) 45.00 Cost to import (US$ per container) 1,145 
DTF score for dealing with construction permits (0–100) 67.35 Strength of legal rights index (0–12) 2 
Procedures (number) 10 Depth of credit information index (0–8) 7 Enforcing contracts (rank) 147 
Time (days) 233 Credit bureau coverage (% of adults) 100.0 DTF score for enforcing contracts (0–100) 45.61 
Cost (% of warehouse value) 3.7 Credit registry coverage (% of adults) 24.6 Procedures (number) 37 
Time (days) 1,185 
Getting electricity (rank) 102 Protecting minority investors (rank) 21 Cost (% of claim) 23.1 
DTF score for getting electricity (0–100) 72.65 DTF score for protecting minority investors (0–100) 66.67 
Procedures (number) 5 Extent of conflict of interest regulation index (0–10) 6.0 Resolving insolvency (rank) 29 
Time (days) 124 Extent of shareholder governance index (0–10) 7.3 DTF score for resolving insolvency (0–100) 71.29 
Cost (% of income per capita) 212.6 Strength of minority investor protection index (0–10) 6.7 Time (years) 1.8 
Cost (% of estate) 22 
Paying taxes (rank) 141 Recovery rate (cents on the dollar) 62.8 
DTF score for paying taxes (0–100) 62.13 Strength of insolvency framework index (0–16) 12 
Payments (number per year) 15 
Time (hours per year) 269 
Total tax rate (% of profit) 65.4 
JAMAICA Latin America  Caribbean GNI per capita (US$) 5,220 
Ease of doing business rank (1–189) 58 Overall distance to frontier (DTF) score (0–100) 67.79 Population (m) 2.7 
 Starting a business (rank) 20 Registering property (rank) 126 Trading across borders (rank) 115 
DTF score for starting a business (0–100) 94.13 DTF score for registering property (0–100) 59.36 DTF score for trading across borders (0–100) 68.22 
Procedures (number) 2 Procedures (number) 6 Documents to export (number) 6 
Time (days) 15 Time (days) 36 Time to export (days) 20 
Cost (% of income per capita) 6.0 Cost (% of property value) 9.5 Cost to export (US$ per container) 1,580 
Minimum capital (% of income per capita) 0.0 Documents to import (number) 7 
 Getting credit (rank) 12 Time to import (days) 17 
Dealing with construction permits (rank) 26 DTF score for getting credit (0–100) 80.00 Cost to import (US$ per container) 2,180 
DTF score for dealing with construction permits (0–100) 83.17 Strength of legal rights index (0–12) 10 
Procedures (number) 7 Depth of credit information index (0–8) 6 Enforcing contracts (rank) 117 
Time (days) 135 Credit bureau coverage (% of adults) 10.1 DTF score for enforcing contracts (0–100) 53.74 
Cost (% of warehouse value) 2.2 Credit registry coverage (% of adults) 0.0 Procedures (number) 35 
Time (days) 655 
 Getting electricity (rank) 111 Protecting minority investors (rank) 71 Cost (% of claim) 45.6 
DTF score for getting electricity (0–100) 70.36 DTF score for protecting minority investors (0–100) 56.67 
Procedures (number) 6 Extent of conflict of interest regulation index (0–10) 5.7 Resolving insolvency (rank) 59 
Time (days) 96 Extent of shareholder governance index (0–10) 5.7 DTF score for resolving insolvency (0–100) 53.29 
Cost (% of income per capita) 406.3 Strength of minority investor protection index (0–10) 5.7 Time (years) 1.1 
Cost (% of estate) 18 
 Paying taxes (rank) 147 Recovery rate (cents on the dollar) 64.2 
DTF score for paying taxes (0–100) 59.01 Strength of insolvency framework index (0–16) 6 
Payments (number per year) 36 
Time (hours per year) 368 
Total tax rate (% of profit) 39.3 
JAPAN OECD high income GNI per capita (US$) 46,140 
Ease of doing business rank (1–189) 29 Overall distance to frontier (DTF) score (0–100) 74.80 Population (m) 127.3 
Starting a business (rank) 83 Registering property (rank) 73 Trading across borders (rank) 20 
DTF score for starting a business (0–100) 86.21 DTF score for registering property (0–100) 71.33 DTF score for trading across borders (0–100) 87.23 
Procedures (number) 8 Procedures (number) 6 Documents to export (number) 3 
Time (days) 10.7 Time (days) 13 Time to export (days) 11 
Cost (% of income per capita) 7.5 Cost (% of property value) 5.8 Cost to export (US$ per container) 829 
Minimum capital (% of income per capita) 0.0 Documents to import (number) 5 
Getting credit (rank) 71 Time to import (days) 11 
Dealing with construction permits (rank) 83 DTF score for getting credit (0–100) 50.00 Cost to import (US$ per container) 1,021 
DTF score for dealing with construction permits (0–100) 73.30 Strength of legal rights index (0–12) 4 
Procedures (number) 12 Depth of credit information index (0–8) 6 Enforcing contracts (rank) 26 
Time (days) 197 Credit bureau coverage (% of adults) 100.0 DTF score for enforcing contracts (0–100) 69.95 
Cost (% of warehouse value) 0.6 Credit registry coverage (% of adults) 0.0 Procedures (number) 32 
Time (days) 360 
Getting electricity (rank) 28 Protecting minority investors (rank) 35 Cost (% of claim) 32.2 
DTF score for getting electricity (0–100) 86.51 DTF score for protecting minority investors (0–100) 62.50 
Procedures (number) 3.4 Extent of conflict of interest regulation index (0–10) 7.0 Resolving insolvency (rank) 2 
Time (days) 97.7 Extent of shareholder governance index (0–10) 5.5 DTF score for resolving insolvency (0–100) 93.74 
Cost (% of income per capita) 0.0 Strength of minority investor protection index (0–10) 6.3 Time (years) 0.6 
Cost (% of estate) 4 
Paying taxes (rank) 122 Recovery rate (cents on the dollar) 92.9 
DTF score for paying taxes (0–100) 67.19 Strength of insolvency framework index (0–16) 14 
Payments (number per year) 14 
Time (hours per year) 330 
Total tax rate (% of profit) 51.3 
Note: For resolving insolvency, an economy for which “no practice” is recorded for time and cost receives a score of 0 on the strength of insolvency framework index even if its legal framework includes provisions related to 
insolvency proceedings (liquidation or reorganization). Most indicator sets refer to a case scenario in the largest business city of an economy, except for 11 economies for which the data are a population-weighted average 
for the 2 largest business cities. See the data notes for more details.
COUNTRY TABLES 195 
 Reform making it easier to do business  Change making it more difficult to do business 
JORDAN Middle East  North Africa GNI per capita (US$) 4,950 
Ease of doing business rank (1–189) 117 Overall distance to frontier (DTF) score (0–100) 58.40 Population (m) 6.5 
Starting a business (rank) 86 Registering property (rank) 107  Trading across borders (rank) 54 
DTF score for starting a business (0–100) 85.61 DTF score for registering property (0–100) 63.45 DTF score for trading across borders (0–100) 78.92 
Procedures (number) 7 Procedures (number) 7 Documents to export (number) 5 
Time (days) 12 Time (days) 21 Time to export (days) 12 
Cost (% of income per capita) 21.4 Cost (% of property value) 7.5 Cost to export (US$ per container) 825 
Minimum capital (% of income per capita) 0.0 Documents to import (number) 7 
Getting credit (rank) 185 Time to import (days) 15 
Dealing with construction permits (rank) 126 DTF score for getting credit (0–100) 0.00 Cost to import (US$ per container) 1,235 
DTF score for dealing with construction permits (0–100) 66.02 Strength of legal rights index (0–12) 0 
Procedures (number) 16 Depth of credit information index (0–8) 0 Enforcing contracts (rank) 114 
Time (days) 63 Credit bureau coverage (% of adults) 0.0 DTF score for enforcing contracts (0–100) 54.04 
Cost (% of warehouse value) 9.5 Credit registry coverage (% of adults) 2.2 Procedures (number) 39 
Time (days) 689 
Getting electricity (rank) 44 Protecting minority investors (rank) 154 Cost (% of claim) 31.2 
DTF score for getting electricity (0–100) 82.95 DTF score for protecting minority investors (0–100) 41.67 
Procedures (number) 5 Extent of conflict of interest regulation index (0–10) 3.3 Resolving insolvency (rank) 145 
Time (days) 50 Extent of shareholder governance index (0–10) 5.0 DTF score for resolving insolvency (0–100) 30.17 
Cost (% of income per capita) 315.9 Strength of minority investor protection index (0–10) 4.2 Time (years) 3.0 
Cost (% of estate) 20 
Paying taxes (rank) 45 Recovery rate (cents on the dollar) 27.0 
DTF score for paying taxes (0–100) 81.19 Strength of insolvency framework index (0–16) 5 
Payments (number per year) 25 
Time (hours per year) 151 
Total tax rate (% of profit) 29.0 
KAZAKHSTAN Europe  Central Asia GNI per capita (US$) 11,380 
Ease of doing business rank (1–189) 77 Overall distance to frontier (DTF) score (0–100) 64.59 Population (m) 17.0 
Starting a business (rank) 55  Registering property (rank) 14  Trading across borders (rank) 185 
DTF score for starting a business (0–100) 90.19 DTF score for registering property (0–100) 89.83 DTF score for trading across borders (0–100) 7.87 
Procedures (number) 6 Procedures (number) 4 Documents to export (number) 10 
Time (days) 10 Time (days) 11 Time to export (days) 79 
Cost (% of income per capita) 0.5 Cost (% of property value) 0.1 Cost to export (US$ per container) 5,285 
Minimum capital (% of income per capita) 0.0 Documents to import (number) 12 
Getting credit (rank) 71 Time to import (days) 67 
Dealing with construction permits (rank) 154 DTF score for getting credit (0–100) 50.00 Cost to import (US$ per container) 5,265 
DTF score for dealing with construction permits (0–100) 58.39 Strength of legal rights index (0–12) 3 
Procedures (number) 25 Depth of credit information index (0–8) 7  Enforcing contracts (rank) 30 
Time (days) 156 Credit bureau coverage (% of adults) 51.7 DTF score for enforcing contracts (0–100) 69.33 
Cost (% of warehouse value) 1.5 Credit registry coverage (% of adults) 0.0 Procedures (number) 36 
Time (days) 370 
Getting electricity (rank) 97 Protecting minority investors (rank) 25 Cost (% of claim) 22.0 
DTF score for getting electricity (0–100) 72.96 DTF score for protecting minority investors (0–100) 65.83 
Procedures (number) 6 Extent of conflict of interest regulation index (0–10) 6.7  Resolving insolvency (rank) 63 
Time (days) 88 Extent of shareholder governance index (0–10) 6.5 DTF score for resolving insolvency (0–100) 51.45 
Cost (% of income per capita) 56.6 Strength of minority investor protection index (0–10) 6.6 Time (years) 1.5 
Cost (% of estate) 15 
 Paying taxes (rank) 17 Recovery rate (cents on the dollar) 43.3 
DTF score for paying taxes (0–100) 90.04 Strength of insolvency framework index (0–16) 9 
Payments (number per year) 6 
Time (hours per year) 188 
Total tax rate (% of profit) 28.6 
KENYA Sub-Saharan Africa GNI per capita (US$) 930 
Ease of doing business rank (1–189) 136 Overall distance to frontier (DTF) score (0–100) 54.98 Population (m) 44.4 
Starting a business (rank) 143 Registering property (rank) 136 Trading across borders (rank) 153 
DTF score for starting a business (0–100) 74.02 DTF score for registering property (0–100) 56.88 DTF score for trading across borders (0–100) 54.49 
Procedures (number) 10 Procedures (number) 9 Documents to export (number) 8 
Time (days) 30 Time (days) 72 Time to export (days) 26 
Cost (% of income per capita) 42.7 Cost (% of property value) 4.3 Cost to export (US$ per container) 2,255 
Minimum capital (% of income per capita) 0.0 Documents to import (number) 9 
 Getting credit (rank) 116 Time to import (days) 26 
 Dealing with construction permits (rank) 95 DTF score for getting credit (0–100) 35.00 Cost to import (US$ per container) 2,350 
DTF score for dealing with construction permits (0–100) 71.02 Strength of legal rights index (0–12) 7 
Procedures (number) 8 Depth of credit information index (0–8) 0 Enforcing contracts (rank) 137 
Time (days) 125 Credit bureau coverage (% of adults) 4.9 DTF score for enforcing contracts (0–100) 48.96 
Cost (% of warehouse value) 9.3 Credit registry coverage (% of adults) 0.0 Procedures (number) 44 
Time (days) 465 
Getting electricity (rank) 151 Protecting minority investors (rank) 122 Cost (% of claim) 47.2 
DTF score for getting electricity (0–100) 58.85 DTF score for protecting minority investors (0–100) 45.83 
Procedures (number) 6 Extent of conflict of interest regulation index (0–10) 4.7 Resolving insolvency (rank) 134 
Time (days) 158 Extent of shareholder governance index (0–10) 4.5 DTF score for resolving insolvency (0–100) 33.31 
Cost (% of income per capita) 1,020.2 Strength of minority investor protection index (0–10) 4.6 Time (years) 4.5 
Cost (% of estate) 22 
 Paying taxes (rank) 102 Recovery rate (cents on the dollar) 27.1 
DTF score for paying taxes (0–100) 71.49 Strength of insolvency framework index (0–16) 6 
Payments (number per year) 30 
Time (hours per year) 201.5 
Total tax rate (% of profit) 38.1 
Note: For resolving insolvency, an economy for which “no practice” is recorded for time and cost receives a score of 0 on the strength of insolvency framework index even if its legal framework includes provisions related to 
insolvency proceedings (liquidation or reorganization). Most indicator sets refer to a case scenario in the largest business city of an economy, except for 11 economies for which the data are a population-weighted average 
for the 2 largest business cities. See the data notes for more details.
196 DOING BUSINESS 2015 
 Reform making it easier to do business  Change making it more difficult to do business 
KIRIBATI East Asia  Pacific GNI per capita (US$) 2,620 
Ease of doing business rank (1–189) 134 Overall distance to frontier (DTF) score (0–100) 55.48 Population (m) 0.1 
Starting a business (rank) 122 Registering property (rank) 139 Trading across borders (rank) 81 
DTF score for starting a business (0–100) 79.74 DTF score for registering property (0–100) 55.48 DTF score for trading across borders (0–100) 74.76 
Procedures (number) 7 Procedures (number) 5 Documents to export (number) 6 
Time (days) 31 Time (days) 513 Time to export (days) 20 
Cost (% of income per capita) 20.5 Cost (% of property value) 0.0 Cost to export (US$ per container) 870 
Minimum capital (% of income per capita) 19.5 Documents to import (number) 6 
Getting credit (rank) 160 Time to import (days) 21 
Dealing with construction permits (rank) 65 DTF score for getting credit (0–100) 20.00 Cost to import (US$ per container) 910 
DTF score for dealing with construction permits (0–100) 75.71 Strength of legal rights index (0–12) 4 
Procedures (number) 14 Depth of credit information index (0–8) 0 Enforcing contracts (rank) 60 
Time (days) 149 Credit bureau coverage (% of adults) 0.0 DTF score for enforcing contracts (0–100) 64.15 
Cost (% of warehouse value) 0.3 Credit registry coverage (% of adults) 0.0 Procedures (number) 32 
Time (days) 660 
Getting electricity (rank) 167 Protecting minority investors (rank) 154 Cost (% of claim) 25.8 
DTF score for getting electricity (0–100) 52.26 DTF score for protecting minority investors (0–100) 41.67 
Procedures (number) 6 Extent of conflict of interest regulation index (0–10) 6.3 Resolving insolvency (rank) 189 
Time (days) 97 Extent of shareholder governance index (0–10) 2.0 DTF score for resolving insolvency (0–100) 0.00 
Cost (% of income per capita) 4,768.9 Strength of minority investor protection index (0–10) 4.2 Time (years) NO PRACTICE 
Cost (% of estate) NO PRACTICE 
 Paying taxes (rank) 14 Recovery rate (cents on the dollar) 0.0 
DTF score for paying taxes (0–100) 91.03 Strength of insolvency framework index (0–16) 0 
Payments (number per year) 7 
Time (hours per year) 120 
Total tax rate (% of profit) 32.7 
KOREA, REP. OECD high income GNI per capita (US$) 25,920 
Ease of doing business rank (1–189) 5 Overall distance to frontier (DTF) score (0–100) 83.40 Population (m) 50.2 
Starting a business (rank) 17  Registering property (rank) 79 Trading across borders (rank) 3 
DTF score for starting a business (0–100) 94.36 DTF score for registering property (0–100) 70.99 DTF score for trading across borders (0–100) 93.45 
Procedures (number) 3 Procedures (number) 7 Documents to export (number) 3 
Time (days) 4 Time (days) 7 Time to export (days) 8 
Cost (% of income per capita) 14.5 Cost (% of property value) 5.1 Cost to export (US$ per container) 670 
Minimum capital (% of income per capita) 0.0 Documents to import (number) 3 
Getting credit (rank) 36 Time to import (days) 7 
Dealing with construction permits (rank) 12 DTF score for getting credit (0–100) 65.00 Cost to import (US$ per container) 695 
DTF score for dealing with construction permits (0–100) 85.89 Strength of legal rights index (0–12) 5 
Procedures (number) 10 Depth of credit information index (0–8) 8 Enforcing contracts (rank) 4 
Time (days) 29 Credit bureau coverage (% of adults) 100.0 DTF score for enforcing contracts (0–100) 81.71 
Cost (% of warehouse value) 4.3 Credit registry coverage (% of adults) 0.0 Procedures (number) 32 
Time (days) 230 
Getting electricity (rank) 1  Protecting minority investors (rank) 21 Cost (% of claim) 10.3 
DTF score for getting electricity (0–100) 99.83 DTF score for protecting minority investors (0–100) 66.67 
Procedures (number) 3 Extent of conflict of interest regulation index (0–10) 7.0 Resolving insolvency (rank) 5 
Time (days) 18 Extent of shareholder governance index (0–10) 6.3 DTF score for resolving insolvency (0–100) 90.06 
Cost (% of income per capita) 41.1 Strength of minority investor protection index (0–10) 6.7 Time (years) 1.5 
Cost (% of estate) 4 
Paying taxes (rank) 25 Recovery rate (cents on the dollar) 83.1 
DTF score for paying taxes (0–100) 86.09 Strength of insolvency framework index (0–16) 14.5 
Payments (number per year) 10 
Time (hours per year) 187 
Total tax rate (% of profit) 32.4 
KOSOVO Europe  Central Asia GNI per capita (US$) 3,890 
Ease of doing business rank (1–189) 75 Overall distance to frontier (DTF) score (0–100) 64.76 Population (m) 1.8 
Starting a business (rank) 42  Registering property (rank) 34 Trading across borders (rank) 118 
DTF score for starting a business (0–100) 91.33 DTF score for registering property (0–100) 81.32 DTF score for trading across borders (0–100) 67.70 
Procedures (number) 5 Procedures (number) 6 Documents to export (number) 8 
Time (days) 11 Time (days) 27 Time to export (days) 15 
Cost (% of income per capita) 1.2 Cost (% of property value) 0.3 Cost to export (US$ per container) 1,695 
Minimum capital (% of income per capita) 0.0 Documents to import (number) 7 
Getting credit (rank) 23 Time to import (days) 15 
 Dealing with construction permits (rank) 135 DTF score for getting credit (0–100) 70.00 Cost to import (US$ per container) 1,730 
DTF score for dealing with construction permits (0–100) 63.36 Strength of legal rights index (0–12) 8 
Procedures (number) 15 Depth of credit information index (0–8) 6  Enforcing contracts (rank) 138 
Time (days) 152 Credit bureau coverage (% of adults) 0.0 DTF score for enforcing contracts (0–100) 48.59 
Cost (% of warehouse value) 6.7 Credit registry coverage (% of adults) 22.8 Procedures (number) 53 
Time (days) 330 
Getting electricity (rank) 112 Protecting minority investors (rank) 62 Cost (% of claim) 33.0 
DTF score for getting electricity (0–100) 70.34 DTF score for protecting minority investors (0–100) 57.50 
Procedures (number) 7 Extent of conflict of interest regulation index (0–10) 5.3 Resolving insolvency (rank) 164 
Time (days) 46 Extent of shareholder governance index (0–10) 6.2 DTF score for resolving insolvency (0–100) 19.63 
Cost (% of income per capita) 822.5 Strength of minority investor protection index (0–10) 5.8 Time (years) 2.0 
Cost (% of estate) 15 
Paying taxes (rank) 63 Recovery rate (cents on the dollar) 36.5 
DTF score for paying taxes (0–100) 77.87 Strength of insolvency framework index (0–16) 0 
Payments (number per year) 33 
Time (hours per year) 155 
Total tax rate (% of profit) 15.3 
Note: For resolving insolvency, an economy for which “no practice” is recorded for time and cost receives a score of 0 on the strength of insolvency framework index even if its legal framework includes provisions related to 
insolvency proceedings (liquidation or reorganization). Most indicator sets refer to a case scenario in the largest business city of an economy, except for 11 economies for which the data are a population-weighted average 
for the 2 largest business cities. See the data notes for more details.
COUNTRY TABLES 197 
 Reform making it easier to do business  Change making it more difficult to do business 
KUWAIT Middle East  North Africa GNI per capita (US$) 47,639 
Ease of doing business rank (1–189) 86 Overall distance to frontier (DTF) score (0–100) 63.11 Population (m) 3.4 
 Starting a business (rank) 150 Registering property (rank) 69 Trading across borders (rank) 117 
DTF score for starting a business (0–100) 71.30 DTF score for registering property (0–100) 72.10 DTF score for trading across borders (0–100) 68.00 
Procedures (number) 12 Procedures (number) 8 Documents to export (number) 7 
Time (days) 31 Time (days) 47 Time to export (days) 15 
Cost (% of income per capita) 1.9 Cost (% of property value) 0.5 Cost to export (US$ per container) 1,085 
Minimum capital (% of income per capita) 74.0 Documents to import (number) 10 
Getting credit (rank) 116 Time to import (days) 20 
Dealing with construction permits (rank) 98 DTF score for getting credit (0–100) 35.00 Cost to import (US$ per container) 1,250 
DTF score for dealing with construction permits (0–100) 70.60 Strength of legal rights index (0–12) 2 
Procedures (number) 20 Depth of credit information index (0–8) 5 Enforcing contracts (rank) 131 
Time (days) 96 Credit bureau coverage (% of adults) 32.0 DTF score for enforcing contracts (0–100) 50.59 
Cost (% of warehouse value) 1.6 Credit registry coverage (% of adults) 0.0 Procedures (number) 50 
Time (days) 566 
Getting electricity (rank) 93 Protecting minority investors (rank) 43 Cost (% of claim) 18.8 
DTF score for getting electricity (0–100) 74.13 DTF score for protecting minority investors (0–100) 60.83 
Procedures (number) 7 Extent of conflict of interest regulation index (0–10) 5.7 Resolving insolvency (rank) 127 
Time (days) 42 Extent of shareholder governance index (0–10) 6.5 DTF score for resolving insolvency (0–100) 36.02 
Cost (% of income per capita) 42.3 Strength of minority investor protection index (0–10) 6.1 Time (years) 4.2 
Cost (% of estate) 10 
Paying taxes (rank) 11 Recovery rate (cents on the dollar) 32.1 
DTF score for paying taxes (0–100) 92.48 Strength of insolvency framework index (0–16) 6 
Payments (number per year) 12 
Time (hours per year) 98 
Total tax rate (% of profit) 12.8 
KYRGYZ REPUBLIC Europe  Central Asia GNI per capita (US$) 1,200 
Ease of doing business rank (1–189) 102 Overall distance to frontier (DTF) score (0–100) 60.74 Population (m) 5.7 
Starting a business (rank) 9 Registering property (rank) 6 Trading across borders (rank) 183 
DTF score for starting a business (0–100) 96.35 DTF score for registering property (0–100) 93.25 DTF score for trading across borders (0–100) 9.70 
Procedures (number) 2 Procedures (number) 3 Documents to export (number) 9 
Time (days) 8 Time (days) 5 Time to export (days) 63 
Cost (% of income per capita) 2.4 Cost (% of property value) 0.3 Cost to export (US$ per container) 4,760 
Minimum capital (% of income per capita) 0.0 Documents to import (number) 11 
Getting credit (rank) 36 Time to import (days) 73 
Dealing with construction permits (rank) 42 DTF score for getting credit (0–100) 65.00 Cost to import (US$ per container) 6,000 
DTF score for dealing with construction permits (0–100) 78.80 Strength of legal rights index (0–12) 8 
Procedures (number) 10 Depth of credit information index (0–8) 5 Enforcing contracts (rank) 56 
Time (days) 141 Credit bureau coverage (% of adults) 38.2 DTF score for enforcing contracts (0–100) 64.63 
Cost (% of warehouse value) 2.1 Credit registry coverage (% of adults) 0.0 Procedures (number) 38 
Time (days) 260 
Getting electricity (rank) 168 Protecting minority investors (rank) 35 Cost (% of claim) 37.0 
DTF score for getting electricity (0–100) 49.64 DTF score for protecting minority investors (0–100) 62.50 
Procedures (number) 7 Extent of conflict of interest regulation index (0–10) 6.7 Resolving insolvency (rank) 157 
Time (days) 159 Extent of shareholder governance index (0–10) 5.8 DTF score for resolving insolvency (0–100) 24.38 
Cost (% of income per capita) 1,872.2 Strength of minority investor protection index (0–10) 6.3 Time (years) 4.0 
Cost (% of estate) 15 
Paying taxes (rank) 136 Recovery rate (cents on the dollar) 19.2 
DTF score for paying taxes (0–100) 63.15 Strength of insolvency framework index (0–16) 4.5 
Payments (number per year) 52 
Time (hours per year) 210 
Total tax rate (% of profit) 29.0 
LAO PDR East Asia  Pacific GNI per capita (US$) 1,460 
Ease of doing business rank (1–189) 148 Overall distance to frontier (DTF) score (0–100) 51.45 Population (m) 6.8 
Starting a business (rank) 154 Registering property (rank) 77 Trading across borders (rank) 156 
DTF score for starting a business (0–100) 68.95 DTF score for registering property (0–100) 71.06 DTF score for trading across borders (0–100) 52.96 
Procedures (number) 6 Procedures (number) 5 Documents to export (number) 10 
Time (days) 92 Time (days) 98 Time to export (days) 23 
Cost (% of income per capita) 5.7 Cost (% of property value) 1.1 Cost to export (US$ per container) 1,950 
Minimum capital (% of income per capita) 0.0 Documents to import (number) 10 
 Getting credit (rank) 116 Time to import (days) 26 
Dealing with construction permits (rank) 107 DTF score for getting credit (0–100) 35.00 Cost to import (US$ per container) 1,910 
DTF score for dealing with construction permits (0–100) 68.50 Strength of legal rights index (0–12) 7 
Procedures (number) 22 Depth of credit information index (0–8) 0 Enforcing contracts (rank) 99 
Time (days) 107 Credit bureau coverage (% of adults) 0.0 DTF score for enforcing contracts (0–100) 57.49 
Cost (% of warehouse value) 0.6 Credit registry coverage (% of adults) 3.5 Procedures (number) 42 
Time (days) 443 
Getting electricity (rank) 128  Protecting minority investors (rank) 178 Cost (% of claim) 31.6 
DTF score for getting electricity (0–100) 65.29 DTF score for protecting minority investors (0–100) 29.17 
Procedures (number) 5 Extent of conflict of interest regulation index (0–10) 3.3 Resolving insolvency (rank) 189 
Time (days) 134 Extent of shareholder governance index (0–10) 2.5 DTF score for resolving insolvency (0–100) 0.00 
Cost (% of income per capita) 1,650.4 Strength of minority investor protection index (0–10) 2.9 Time (years) NO PRACTICE 
Cost (% of estate) NO PRACTICE 
Paying taxes (rank) 129 Recovery rate (cents on the dollar) 0.0 
DTF score for paying taxes (0–100) 66.10 Strength of insolvency framework index (0–16) 0 
Payments (number per year) 35 
Time (hours per year) 362 
Total tax rate (% of profit) 25.8 
Note: For resolving insolvency, an economy for which “no practice” is recorded for time and cost receives a score of 0 on the strength of insolvency framework index even if its legal framework includes provisions related to 
insolvency proceedings (liquidation or reorganization). Most indicator sets refer to a case scenario in the largest business city of an economy, except for 11 economies for which the data are a population-weighted average 
for the 2 largest business cities. See the data notes for more details.
198 DOING BUSINESS 2015 
 Reform making it easier to do business  Change making it more difficult to do business 
LATVIA Europe  Central Asia GNI per capita (US$) 15,280 
Ease of doing business rank (1–189) 23 Overall distance to frontier (DTF) score (0–100) 76.73 Population (m) 2.0 
 Starting a business (rank) 36 Registering property (rank) 32 Trading across borders (rank) 28 
DTF score for starting a business (0–100) 92.12 DTF score for registering property (0–100) 81.69 DTF score for trading across borders (0–100) 85.36 
Procedures (number) 4 Procedures (number) 5 Documents to export (number) 5 
Time (days) 12.5 Time (days) 18 Time to export (days) 10 
Cost (% of income per capita) 3.6 Cost (% of property value) 2.0 Cost to export (US$ per container) 600 
Minimum capital (% of income per capita) 0.0 Documents to import (number) 5 
Getting credit (rank) 23 Time to import (days) 11 
Dealing with construction permits (rank) 47 DTF score for getting credit (0–100) 70.00 Cost to import (US$ per container) 801 
DTF score for dealing with construction permits (0–100) 78.38 Strength of legal rights index (0–12) 9 
Procedures (number) 12 Depth of credit information index (0–8) 5 Enforcing contracts (rank) 16 
Time (days) 149 Credit bureau coverage (% of adults) 0.0 DTF score for enforcing contracts (0–100) 75.59 
Cost (% of warehouse value) 0.3 Credit registry coverage (% of adults) 76.8 Procedures (number) 27 
Time (days) 469 
Getting electricity (rank) 89 Protecting minority investors (rank) 49 Cost (% of claim) 23.1 
DTF score for getting electricity (0–100) 74.58 DTF score for protecting minority investors (0–100) 60.00 
Procedures (number) 5 Extent of conflict of interest regulation index (0–10) 5.7 Resolving insolvency (rank) 40 
Time (days) 108 Extent of shareholder governance index (0–10) 6.3 DTF score for resolving insolvency (0–100) 63.42 
Cost (% of income per capita) 308.2 Strength of minority investor protection index (0–10) 6.0 Time (years) 1.5 
Cost (% of estate) 10 
 Paying taxes (rank) 24 Recovery rate (cents on the dollar) 48.2 
DTF score for paying taxes (0–100) 86.19 Strength of insolvency framework index (0–16) 12 
Payments (number per year) 7 
Time (hours per year) 193 
Total tax rate (% of profit) 35.0 
LEBANON Middle East  North Africa GNI per capita (US$) 9,870 
Ease of doing business rank (1–189) 104 Overall distance to frontier (DTF) score (0–100) 60.61 Population (m) 4.5 
Starting a business (rank) 119 Registering property (rank) 106 Trading across borders (rank) 97 
DTF score for starting a business (0–100) 80.80 DTF score for registering property (0–100) 63.69 DTF score for trading across borders (0–100) 71.96 
Procedures (number) 5 Procedures (number) 8 Documents to export (number) 4 
Time (days) 9 Time (days) 25 Time to export (days) 22 
Cost (% of income per capita) 73.0 Cost (% of property value) 5.9 Cost to export (US$ per container) 1,080 
Minimum capital (% of income per capita) 33.0 Documents to import (number) 7 
Getting credit (rank) 116 Time to import (days) 30 
Dealing with construction permits (rank) 164 DTF score for getting credit (0–100) 35.00 Cost to import (US$ per container) 1,365 
DTF score for dealing with construction permits (0–100) 54.38 Strength of legal rights index (0–12) 2 
Procedures (number) 18 Depth of credit information index (0–8) 5 Enforcing contracts (rank) 110 
Time (days) 244 Credit bureau coverage (% of adults) 0.0 DTF score for enforcing contracts (0–100) 55.40 
Cost (% of warehouse value) 4.4 Credit registry coverage (% of adults) 20.3 Procedures (number) 37 
Time (days) 721 
Getting electricity (rank) 57 Protecting minority investors (rank) 106 Cost (% of claim) 30.8 
DTF score for getting electricity (0–100) 80.24 DTF score for protecting minority investors (0–100) 49.17 
Procedures (number) 5 Extent of conflict of interest regulation index (0–10) 5.0 Resolving insolvency (rank) 136 
Time (days) 75 Extent of shareholder governance index (0–10) 4.8 DTF score for resolving insolvency (0–100) 33.03 
Cost (% of income per capita) 93.2 Strength of minority investor protection index (0–10) 4.9 Time (years) 3.0 
Cost (% of estate) 15 
Paying taxes (rank) 40 Recovery rate (cents on the dollar) 32.3 
DTF score for paying taxes (0–100) 82.44 Strength of insolvency framework index (0–16) 5 
Payments (number per year) 19 
Time (hours per year) 183 
Total tax rate (% of profit) 29.9 
LESOTHO Sub-Saharan Africa GNI per capita (US$) 1,550 
Ease of doing business rank (1–189) 128 Overall distance to frontier (DTF) score (0–100) 56.64 Population (m) 2.1 
Starting a business (rank) 108 Registering property (rank) 93 Trading across borders (rank) 147 
DTF score for starting a business (0–100) 82.84 DTF score for registering property (0–100) 66.36 DTF score for trading across borders (0–100) 57.86 
Procedures (number) 7 Procedures (number) 4 Documents to export (number) 7 
Time (days) 29 Time (days) 43 Time to export (days) 31 
Cost (% of income per capita) 9.4 Cost (% of property value) 8.4 Cost to export (US$ per container) 1,795 
Minimum capital (% of income per capita) 0.0 Documents to import (number) 7 
Getting credit (rank) 151 Time to import (days) 33 
Dealing with construction permits (rank) 161 DTF score for getting credit (0–100) 25.00 Cost to import (US$ per container) 2,045 
DTF score for dealing with construction permits (0–100) 55.79 Strength of legal rights index (0–12) 5 
Procedures (number) 10 Depth of credit information index (0–8) 0 Enforcing contracts (rank) 115 
Time (days) 179 Credit bureau coverage (% of adults) 0.0 DTF score for enforcing contracts (0–100) 53.94 
Cost (% of warehouse value) 13.7 Credit registry coverage (% of adults) 0.0 Procedures (number) 41 
Time (days) 615 
Getting electricity (rank) 117 Protecting minority investors (rank) 106 Cost (% of claim) 31.3 
DTF score for getting electricity (0–100) 68.20 DTF score for protecting minority investors (0–100) 49.17 
Procedures (number) 5 Extent of conflict of interest regulation index (0–10) 5.3 Resolving insolvency (rank) 120 
Time (days) 114 Extent of shareholder governance index (0–10) 4.5 DTF score for resolving insolvency (0–100) 37.51 
Cost (% of income per capita) 1,647.5 Strength of minority investor protection index (0–10) 4.9 Time (years) 2.6 
Cost (% of estate) 20 
Paying taxes (rank) 109 Recovery rate (cents on the dollar) 29.0 
DTF score for paying taxes (0–100) 69.72 Strength of insolvency framework index (0–16) 7 
Payments (number per year) 32 
Time (hours per year) 324 
Total tax rate (% of profit) 13.6 
Note: For resolving insolvency, an economy for which “no practice” is recorded for time and cost receives a score of 0 on the strength of insolvency framework index even if its legal framework includes provisions related to 
insolvency proceedings (liquidation or reorganization). Most indicator sets refer to a case scenario in the largest business city of an economy, except for 11 economies for which the data are a population-weighted average 
for the 2 largest business cities. See the data notes for more details.
COUNTRY TABLES 199 
 Reform making it easier to do business  Change making it more difficult to do business 
LIBERIA Sub-Saharan Africa GNI per capita (US$) 410 
Ease of doing business rank (1–189) 174 Overall distance to frontier (DTF) score (0–100) 46.61 Population (m) 4.3 
Starting a business (rank) 30 Registering property (rank) 177 Trading across borders (rank) 149 
DTF score for starting a business (0–100) 92.41 DTF score for registering property (0–100) 39.57 DTF score for trading across borders (0–100) 56.40 
Procedures (number) 4 Procedures (number) 10 Documents to export (number) 10 
Time (days) 4.5 Time (days) 44 Time to export (days) 15 
Cost (% of income per capita) 17.4 Cost (% of property value) 12.9 Cost to export (US$ per container) 1,320 
Minimum capital (% of income per capita) 0.0 Documents to import (number) 12 
Getting credit (rank) 160 Time to import (days) 29 
Dealing with construction permits (rank) 143 DTF score for getting credit (0–100) 20.00 Cost to import (US$ per container) 1,320 
DTF score for dealing with construction permits (0–100) 62.00 Strength of legal rights index (0–12) 4 
Procedures (number) 22 Depth of credit information index (0–8) 0 Enforcing contracts (rank) 174 
Time (days) 74 Credit bureau coverage (% of adults) 0.0 DTF score for enforcing contracts (0–100) 35.43 
Cost (% of warehouse value) 6.4 Credit registry coverage (% of adults) 1.7 Procedures (number) 40 
Time (days) 1,280 
Getting electricity (rank) 166 Protecting minority investors (rank) 181 Cost (% of claim) 35.0 
DTF score for getting electricity (0–100) 52.61 DTF score for protecting minority investors (0–100) 28.33 
Procedures (number) 4 Extent of conflict of interest regulation index (0–10) 3.7 Resolving insolvency (rank) 169 
Time (days) 465 Extent of shareholder governance index (0–10) 2.0 DTF score for resolving insolvency (0–100) 4.60 
Cost (% of income per capita) 2,065.4 Strength of minority investor protection index (0–10) 2.8 Time (years) 3.0 
Cost (% of estate) 43 
Paying taxes (rank) 77 Recovery rate (cents on the dollar) 8.6 
DTF score for paying taxes (0–100) 74.75 Strength of insolvency framework index (0–16) 0 
Payments (number per year) 33 
Time (hours per year) 150.5 
Total tax rate (% of profit) 33.3 
LIBYA Middle East  North Africa GNI per capita (US$) 11,046 
Ease of doing business rank (1–189) 188 Overall distance to frontier (DTF) score (0–100) 33.35 Population (m) 6.2 
Starting a business (rank) 144 Registering property (rank) 189 Trading across borders (rank) 139 
DTF score for starting a business (0–100) 73.50 DTF score for registering property (0–100) 0.00 DTF score for trading across borders (0–100) 61.72 
Procedures (number) 10 Procedures (number) NO PRACTICE Documents to export (number) 7 
Time (days) 35 Time (days) NO PRACTICE Time to export (days) 23 
Cost (% of income per capita) 19.9 Cost (% of property value) NO PRACTICE Cost to export (US$ per container) 1,140 
Minimum capital (% of income per capita) 33.8 Documents to import (number) 9 
Getting credit (rank) 185 Time to import (days) 37 
Dealing with construction permits (rank) 189 DTF score for getting credit (0–100) 0.00 Cost to import (US$ per container) 1,255 
DTF score for dealing with construction permits (0–100) 0.00 Strength of legal rights index (0–12) 0 
Procedures (number) NO PRACTICE Depth of credit information index (0–8) 0 Enforcing contracts (rank) 126 
Time (days) NO PRACTICE Credit bureau coverage (% of adults) 0.0 DTF score for enforcing contracts (0–100) 51.42 
Cost (% of warehouse value) NO PRACTICE Credit registry coverage (% of adults) 0.5 Procedures (number) 43 
Time (days) 690 
Getting electricity (rank) 65 Protecting minority investors (rank) 188 Cost (% of claim) 27.0 
DTF score for getting electricity (0–100) 79.10 DTF score for protecting minority investors (0–100) 12.50 
Procedures (number) 4 Extent of conflict of interest regulation index (0–10) 2.0 Resolving insolvency (rank) 189 
Time (days) 118 Extent of shareholder governance index (0–10) 0.5 DTF score for resolving insolvency (0–100) 0.00 
Cost (% of income per capita) 206.2 Strength of minority investor protection index (0–10) 1.3 Time (years) NO PRACTICE 
Cost (% of estate) NO PRACTICE 
Paying taxes (rank) 157 Recovery rate (cents on the dollar) 0.0 
DTF score for paying taxes (0–100) 55.25 Strength of insolvency framework index (0–16) 0 
Payments (number per year) 19 
Time (hours per year) 889 
Total tax rate (% of profit) 31.5 
LITHUANIA Europe  Central Asia GNI per capita (US$) 14,900 
Ease of doing business rank (1–189) 24 Overall distance to frontier (DTF) score (0–100) 76.31 Population (m) 3.0 
 Starting a business (rank) 11 Registering property (rank) 9 Trading across borders (rank) 21 
DTF score for starting a business (0–100) 96.22 DTF score for registering property (0–100) 92.39 DTF score for trading across borders (0–100) 87.21 
Procedures (number) 3 Procedures (number) 3 Documents to export (number) 4 
Time (days) 3.5 Time (days) 2.5 Time to export (days) 10 
Cost (% of income per capita) 0.7 Cost (% of property value) 0.8 Cost to export (US$ per container) 750 
Minimum capital (% of income per capita) 0.0 Documents to import (number) 5 
Getting credit (rank) 23 Time to import (days) 9 
 Dealing with construction permits (rank) 15 DTF score for getting credit (0–100) 70.00 Cost to import (US$ per container) 800 
DTF score for dealing with construction permits (0–100) 85.27 Strength of legal rights index (0–12) 6 
Procedures (number) 11 Depth of credit information index (0–8) 8  Enforcing contracts (rank) 14 
Time (days) 91 Credit bureau coverage (% of adults) 97.7 DTF score for enforcing contracts (0–100) 75.85 
Cost (% of warehouse value) 0.3 Credit registry coverage (% of adults) 28.8 Procedures (number) 31 
Time (days) 300 
Getting electricity (rank) 105 Protecting minority investors (rank) 78 Cost (% of claim) 23.6 
DTF score for getting electricity (0–100) 71.46 DTF score for protecting minority investors (0–100) 55.00 
Procedures (number) 5 Extent of conflict of interest regulation index (0–10) 6.0 Resolving insolvency (rank) 67 
Time (days) 137 Extent of shareholder governance index (0–10) 5.0 DTF score for resolving insolvency (0–100) 48.47 
Cost (% of income per capita) 45.5 Strength of minority investor protection index (0–10) 5.5 Time (years) 2.3 
Cost (% of estate) 10 
Paying taxes (rank) 44 Recovery rate (cents on the dollar) 43.6 
DTF score for paying taxes (0–100) 81.24 Strength of insolvency framework index (0–16) 8 
Payments (number per year) 11 
Time (hours per year) 175 
Total tax rate (% of profit) 42.6 
Note: For resolving insolvency, an economy for which “no practice” is recorded for time and cost receives a score of 0 on the strength of insolvency framework index even if its legal framework includes provisions related to 
insolvency proceedings (liquidation or reorganization). Most indicator sets refer to a case scenario in the largest business city of an economy, except for 11 economies for which the data are a population-weighted average 
for the 2 largest business cities. See the data notes for more details.
200 DOING BUSINESS 2015 
 Reform making it easier to do business  Change making it more difficult to do business 
LUXEMBOURG OECD high income GNI per capita (US$) 71,810 
Ease of doing business rank (1–189) 59 Overall distance to frontier (DTF) score (0–100) 67.60 Population (m) 0.5 
Starting a business (rank) 82 Registering property (rank) 137 Trading across borders (rank) 35 
DTF score for starting a business (0–100) 86.47 DTF score for registering property (0–100) 56.75 DTF score for trading across borders (0–100) 83.58 
Procedures (number) 6 Procedures (number) 7 Documents to export (number) 5 
Time (days) 18.5 Time (days) 26.5 Time to export (days) 8 
Cost (% of income per capita) 2.0 Cost (% of property value) 10.1 Cost to export (US$ per container) 1,425 
Minimum capital (% of income per capita) 22.5 Documents to import (number) 4 
Getting credit (rank) 165 Time to import (days) 7 
Dealing with construction permits (rank) 50 DTF score for getting credit (0–100) 15.00 Cost to import (US$ per container) 1,420 
DTF score for dealing with construction permits (0–100) 78.22 Strength of legal rights index (0–12) 3 
Procedures (number) 11 Depth of credit information index (0–8) 0 Enforcing contracts (rank) 2 
Time (days) 157 Credit bureau coverage (% of adults) 0.0 DTF score for enforcing contracts (0–100) 85.70 
Cost (% of warehouse value) 0.7 Credit registry coverage (% of adults) 0.0 Procedures (number) 26 
Time (days) 321 
Getting electricity (rank) 42 Protecting minority investors (rank) 117 Cost (% of claim) 9.7 
DTF score for getting electricity (0–100) 83.22 DTF score for protecting minority investors (0–100) 46.67 
Procedures (number) 5 Extent of conflict of interest regulation index (0–10) 4.3 Resolving insolvency (rank) 62 
Time (days) 56 Extent of shareholder governance index (0–10) 5.0 DTF score for resolving insolvency (0–100) 51.83 
Cost (% of income per capita) 40.1 Strength of minority investor protection index (0–10) 4.7 Time (years) 2.0 
Cost (% of estate) 15 
Paying taxes (rank) 20 Recovery rate (cents on the dollar) 44.0 
DTF score for paying taxes (0–100) 88.58 Strength of insolvency framework index (0–16) 9 
Payments (number per year) 23 
Time (hours per year) 55 
Total tax rate (% of profit) 20.2 
MACEDONIA, FYR Europe  Central Asia GNI per capita (US$) 4,800 
Ease of doing business rank (1–189) 30 Overall distance to frontier (DTF) score (0–100) 74.11 Population (m) 2.1 
 Starting a business (rank) 3 Registering property (rank) 74 Trading across borders (rank) 85 
DTF score for starting a business (0–100) 98.08 DTF score for registering property (0–100) 71.27 DTF score for trading across borders (0–100) 74.43 
Procedures (number) 2 Procedures (number) 7 Documents to export (number) 6 
Time (days) 2 Time (days) 31 Time to export (days) 12 
Cost (% of income per capita) 0.6 Cost (% of property value) 3.3 Cost to export (US$ per container) 1,376 
Minimum capital (% of income per capita) 0.0 Documents to import (number) 8 
Getting credit (rank) 36 Time to import (days) 11 
Dealing with construction permits (rank) 89 DTF score for getting credit (0–100) 65.00 Cost to import (US$ per container) 1,380 
DTF score for dealing with construction permits (0–100) 72.30 Strength of legal rights index (0–12) 6 
Procedures (number) 11 Depth of credit information index (0–8) 7 Enforcing contracts (rank) 87 
Time (days) 89 Credit bureau coverage (% of adults) 83.7 DTF score for enforcing contracts (0–100) 58.31 
Cost (% of warehouse value) 8.2 Credit registry coverage (% of adults) 36.4 Procedures (number) 38 
Time (days) 604 
Getting electricity (rank) 88  Protecting minority investors (rank) 21 Cost (% of claim) 28.8 
DTF score for getting electricity (0–100) 74.94 DTF score for protecting minority investors (0–100) 66.67 
Procedures (number) 5 Extent of conflict of interest regulation index (0–10) 6.7  Resolving insolvency (rank) 35 
Time (days) 107 Extent of shareholder governance index (0–10) 6.7 DTF score for resolving insolvency (0–100) 65.93 
Cost (% of income per capita) 255.3 Strength of minority investor protection index (0–10) 6.7 Time (years) 1.8 
Cost (% of estate) 10 
Paying taxes (rank) 7 Recovery rate (cents on the dollar) 44.1 
DTF score for paying taxes (0–100) 94.17 Strength of insolvency framework index (0–16) 13.5 
Payments (number per year) 7 
Time (hours per year) 119 
Total tax rate (% of profit) 7.4 
MADAGASCAR Sub-Saharan Africa GNI per capita (US$) 440 
Ease of doing business rank (1–189) 163 Overall distance to frontier (DTF) score (0–100) 49.25 Population (m) 22.9 
Starting a business (rank) 37 Registering property (rank) 153 Trading across borders (rank) 109 
DTF score for starting a business (0–100) 92.02 DTF score for registering property (0–100) 51.72 DTF score for trading across borders (0–100) 68.98 
Procedures (number) 4 Procedures (number) 6 Documents to export (number) 5 
Time (days) 8 Time (days) 74 Time to export (days) 22 
Cost (% of income per capita) 13.5 Cost (% of property value) 10.2 Cost to export (US$ per container) 1,195 
Minimum capital (% of income per capita) 0.0 Documents to import (number) 9 
Getting credit (rank) 180 Time to import (days) 21 
 Dealing with construction permits (rank) 177 DTF score for getting credit (0–100) 5.00 Cost to import (US$ per container) 1,555 
DTF score for dealing with construction permits (0–100) 46.68 Strength of legal rights index (0–12) 1 
Procedures (number) 13 Depth of credit information index (0–8) 0 Enforcing contracts (rank) 146 
Time (days) 123 Credit bureau coverage (% of adults) 0.0 DTF score for enforcing contracts (0–100) 45.91 
Cost (% of warehouse value) 20.8 Credit registry coverage (% of adults) 0.2 Procedures (number) 38 
Time (days) 871 
Getting electricity (rank) 189 Protecting minority investors (rank) 87 Cost (% of claim) 42.4 
DTF score for getting electricity (0–100) 16.67 DTF score for protecting minority investors (0–100) 53.33 
Procedures (number) 6 Extent of conflict of interest regulation index (0–10) 5.7 Resolving insolvency (rank) 129 
Time (days) 450 Extent of shareholder governance index (0–10) 5.0 DTF score for resolving insolvency (0–100) 34.43 
Cost (% of income per capita) 8,583.3 Strength of minority investor protection index (0–10) 5.3 Time (years) 2.0 
Cost (% of estate) 30 
Paying taxes (rank) 65 Recovery rate (cents on the dollar) 11.7 
DTF score for paying taxes (0–100) 77.78 Strength of insolvency framework index (0–16) 9 
Payments (number per year) 23 
Time (hours per year) 183 
Total tax rate (% of profit) 35.1 
Note: For resolving insolvency, an economy for which “no practice” is recorded for time and cost receives a score of 0 on the strength of insolvency framework index even if its legal framework includes provisions related to 
insolvency proceedings (liquidation or reorganization). Most indicator sets refer to a case scenario in the largest business city of an economy, except for 11 economies for which the data are a population-weighted average 
for the 2 largest business cities. See the data notes for more details.
COUNTRY TABLES 201 
 Reform making it easier to do business  Change making it more difficult to do business 
MALAWI Sub-Saharan Africa GNI per capita (US$) 270 
Ease of doing business rank (1–189) 164 Overall distance to frontier (DTF) score (0–100) 49.20 Population (m) 16.4 
 Starting a business (rank) 157 Registering property (rank) 76 Trading across borders (rank) 170 
DTF score for starting a business (0–100) 68.53 DTF score for registering property (0–100) 71.07 DTF score for trading across borders (0–100) 37.40 
Procedures (number) 8 Procedures (number) 6 Documents to export (number) 11 
Time (days) 38 Time (days) 69 Time to export (days) 34 
Cost (% of income per capita) 94.1 Cost (% of property value) 1.9 Cost to export (US$ per container) 2,200 
Minimum capital (% of income per capita) 0.0 Documents to import (number) 12 
Getting credit (rank) 151 Time to import (days) 39 
Dealing with construction permits (rank) 72 DTF score for getting credit (0–100) 25.00 Cost to import (US$ per container) 2,895 
DTF score for dealing with construction permits (0–100) 75.09 Strength of legal rights index (0–12) 5 
Procedures (number) 13 Depth of credit information index (0–8) 0 Enforcing contracts (rank) 154 
Time (days) 153 Credit bureau coverage (% of adults) 0.0 DTF score for enforcing contracts (0–100) 43.73 
Cost (% of warehouse value) 1.2 Credit registry coverage (% of adults) 0.0 Procedures (number) 42 
Time (days) 432 
 Getting electricity (rank) 181 Protecting minority investors (rank) 132 Cost (% of claim) 69.1 
DTF score for getting electricity (0–100) 35.78 DTF score for protecting minority investors (0–100) 45.00 
Procedures (number) 6 Extent of conflict of interest regulation index (0–10) 5.7 Resolving insolvency (rank) 166 
Time (days) 172 Extent of shareholder governance index (0–10) 3.3 DTF score for resolving insolvency (0–100) 18.99 
Cost (% of income per capita) 6,131.5 Strength of minority investor protection index (0–10) 4.5 Time (years) 2.6 
Cost (% of estate) 25 
Paying taxes (rank) 103 Recovery rate (cents on the dollar) 12.1 
DTF score for paying taxes (0–100) 71.37 Strength of insolvency framework index (0–16) 4 
Payments (number per year) 35 
Time (hours per year) 174.5 
Total tax rate (% of profit) 35.5 
MALAYSIA East Asia  Pacific GNI per capita (US$) 10,400 
Ease of doing business rank (1–189) 18 Overall distance to frontier (DTF) score (0–100) 78.83 Population (m) 29.7 
Starting a business (rank) 13 Registering property (rank) 75 Trading across borders (rank) 11 
DTF score for starting a business (0–100) 94.90 DTF score for registering property (0–100) 71.16 DTF score for trading across borders (0–100) 89.94 
Procedures (number) 3 Procedures (number) 8 Documents to export (number) 4 
Time (days) 5.5 Time (days) 13.5 Time to export (days) 11 
Cost (% of income per capita) 7.2 Cost (% of property value) 3.3 Cost to export (US$ per container) 525 
Minimum capital (% of income per capita) 0.0 Documents to import (number) 4 
Getting credit (rank) 23 Time to import (days) 8 
Dealing with construction permits (rank) 28 DTF score for getting credit (0–100) 70.00 Cost to import (US$ per container) 560 
DTF score for dealing with construction permits (0–100) 82.49 Strength of legal rights index (0–12) 7 
Procedures (number) 13 Depth of credit information index (0–8) 7 Enforcing contracts (rank) 29 
Time (days) 74 Credit bureau coverage (% of adults) 78.6 DTF score for enforcing contracts (0–100) 69.39 
Cost (% of warehouse value) 1.3 Credit registry coverage (% of adults) 56.2 Procedures (number) 29 
Time (days) 425 
Getting electricity (rank) 27 Protecting minority investors (rank) 5 Cost (% of claim) 37.3 
DTF score for getting electricity (0–100) 86.67 DTF score for protecting minority investors (0–100) 74.17 
Procedures (number) 5 Extent of conflict of interest regulation index (0–10) 8.7 Resolving insolvency (rank) 36 
Time (days) 32 Extent of shareholder governance index (0–10) 6.2 DTF score for resolving insolvency (0–100) 65.61 
Cost (% of income per capita) 46.3 Strength of minority investor protection index (0–10) 7.4 Time (years) 1.0 
Cost (% of estate) 10 
Paying taxes (rank) 32 Recovery rate (cents on the dollar) 81.3 
DTF score for paying taxes (0–100) 83.95 Strength of insolvency framework index (0–16) 7 
Payments (number per year) 13 
Time (hours per year) 133 
Total tax rate (% of profit) 39.2 
MALDIVES South Asia GNI per capita (US$) 5,600 
Ease of doing business rank (1–189) 116 Overall distance to frontier (DTF) score (0–100) 58.73 Population (m) 0.3 
Starting a business (rank) 50 Registering property (rank) 169 Trading across borders (rank) 132 
DTF score for starting a business (0–100) 91.07 DTF score for registering property (0–100) 43.85 DTF score for trading across borders (0–100) 63.63 
Procedures (number) 5 Procedures (number) 6 Documents to export (number) 7 
Time (days) 9 Time (days) 57 Time to export (days) 21 
Cost (% of income per capita) 6.2 Cost (% of property value) 16.2 Cost to export (US$ per container) 1,625 
Minimum capital (% of income per capita) 2.3 Documents to import (number) 9 
Getting credit (rank) 116 Time to import (days) 22 
Dealing with construction permits (rank) 24 DTF score for getting credit (0–100) 35.00 Cost to import (US$ per container) 1,610 
DTF score for dealing with construction permits (0–100) 83.45 Strength of legal rights index (0–12) 2 
Procedures (number) 9 Depth of credit information index (0–8) 5 Enforcing contracts (rank) 91 
Time (days) 140 Credit bureau coverage (% of adults) 0.0 DTF score for enforcing contracts (0–100) 58.13 
Cost (% of warehouse value) 0.2 Credit registry coverage (% of adults) 17.3 Procedures (number) 41 
Time (days) 665 
Getting electricity (rank) 108 Protecting minority investors (rank) 135 Cost (% of claim) 16.5 
DTF score for getting electricity (0–100) 71.14 DTF score for protecting minority investors (0–100) 44.17 
Procedures (number) 6 Extent of conflict of interest regulation index (0–10) 5.3 Resolving insolvency (rank) 135 
Time (days) 91 Extent of shareholder governance index (0–10) 3.5 DTF score for resolving insolvency (0–100) 33.12 
Cost (% of income per capita) 391.5 Strength of minority investor protection index (0–10) 4.4 Time (years) 1.5 
Cost (% of estate) 4 
Paying taxes (rank) 134 Recovery rate (cents on the dollar) 49.9 
DTF score for paying taxes (0–100) 63.76 Strength of insolvency framework index (0–16) 2 
Payments (number per year) 30 
Time (hours per year) 413 
Total tax rate (% of profit) 31.5 
Note: For resolving insolvency, an economy for which “no practice” is recorded for time and cost receives a score of 0 on the strength of insolvency framework index even if its legal framework includes provisions related to 
insolvency proceedings (liquidation or reorganization). Most indicator sets refer to a case scenario in the largest business city of an economy, except for 11 economies for which the data are a population-weighted average 
for the 2 largest business cities. See the data notes for more details.
202 DOING BUSINESS 2015 
 Reform making it easier to do business  Change making it more difficult to do business 
MALI Sub-Saharan Africa GNI per capita (US$) 670 
Ease of doing business rank (1–189) 146 Overall distance to frontier (DTF) score (0–100) 52.59 Population (m) 15.3 
Starting a business (rank) 169 Registering property (rank) 133 Trading across borders (rank) 163 
DTF score for starting a business (0–100) 62.92 DTF score for registering property (0–100) 57.63 DTF score for trading across borders (0–100) 46.33 
Procedures (number) 5 Procedures (number) 5 Documents to export (number) 6 
Time (days) 11 Time (days) 29 Time to export (days) 26 
Cost (% of income per capita) 78.1 Cost (% of property value) 12.1 Cost to export (US$ per container) 2,440 
Minimum capital (% of income per capita) 300.7 Documents to import (number) 11 
Getting credit (rank) 131 Time to import (days) 34 
 Dealing with construction permits (rank) 97 DTF score for getting credit (0–100) 30.00 Cost to import (US$ per container) 4,540 
DTF score for dealing with construction permits (0–100) 70.84 Strength of legal rights index (0–12) 6 
Procedures (number) 10 Depth of credit information index (0–8) 0 Enforcing contracts (rank) 128 
Time (days) 119 Credit bureau coverage (% of adults) 0.0 DTF score for enforcing contracts (0–100) 51.25 
Cost (% of warehouse value) 8.1 Credit registry coverage (% of adults) 3.6 Procedures (number) 36 
Time (days) 620 
Getting electricity (rank) 132  Protecting minority investors (rank) 146 Cost (% of claim) 52.0 
DTF score for getting electricity (0–100) 63.88 DTF score for protecting minority investors (0–100) 42.50 
Procedures (number) 4 Extent of conflict of interest regulation index (0–10) 4.0 Resolving insolvency (rank) 108 
Time (days) 120 Extent of shareholder governance index (0–10) 4.5 DTF score for resolving insolvency (0–100) 40.35 
Cost (% of income per capita) 3,833.8 Strength of minority investor protection index (0–10) 4.3 Time (years) 3.6 
Cost (% of estate) 18 
Paying taxes (rank) 145 Recovery rate (cents on the dollar) 22.7 
DTF score for paying taxes (0–100) 60.16 Strength of insolvency framework index (0–16) 9 
Payments (number per year) 35 
Time (hours per year) 270 
Total tax rate (% of profit) 48.3 
MALTA Middle East  North Africa GNI per capita (US$) 20,980 
Ease of doing business rank (1–189) 94 Overall distance to frontier (DTF) score (0–100) 62.11 Population (m) 0.4 
 Starting a business (rank) 136 Registering property (rank) 83 Trading across borders (rank) 43 
DTF score for starting a business (0–100) 75.29 DTF score for registering property (0–100) 69.86 DTF score for trading across borders (0–100) 81.56 
Procedures (number) 11 Procedures (number) 7 Documents to export (number) 5 
Time (days) 34.5 Time (days) 15 Time to export (days) 11 
Cost (% of income per capita) 11.0 Cost (% of property value) 5.1 Cost to export (US$ per container) 855 
Minimum capital (% of income per capita) 1.5 Documents to import (number) 7 
Getting credit (rank) 171 Time to import (days) 9 
Dealing with construction permits (rank) 109 DTF score for getting credit (0–100) 10.00 Cost to import (US$ per container) 970 
DTF score for dealing with construction permits (0–100) 68.39 Strength of legal rights index (0–12) 2 
Procedures (number) 15 Depth of credit information index (0–8) 0 Enforcing contracts (rank) 107 
Time (days) 167 Credit bureau coverage (% of adults) 0.0 DTF score for enforcing contracts (0–100) 56.27 
Cost (% of warehouse value) 2.8 Credit registry coverage (% of adults) 0.0 Procedures (number) 40 
Time (days) 505 
Getting electricity (rank) 114 Protecting minority investors (rank) 51 Cost (% of claim) 35.9 
DTF score for getting electricity (0–100) 69.98 DTF score for protecting minority investors (0–100) 59.17 
Procedures (number) 5 Extent of conflict of interest regulation index (0–10) 5.7 Resolving insolvency (rank) 86 
Time (days) 136 Extent of shareholder governance index (0–10) 6.2 DTF score for resolving insolvency (0–100) 44.78 
Cost (% of income per capita) 440.2 Strength of minority investor protection index (0–10) 5.9 Time (years) 3.0 
Cost (% of estate) 10 
Paying taxes (rank) 26 Recovery rate (cents on the dollar) 39.6 
DTF score for paying taxes (0–100) 85.81 Strength of insolvency framework index (0–16) 7.5 
Payments (number per year) 7 
Time (hours per year) 139 
Total tax rate (% of profit) 41.6 
MARSHALL ISLANDS East Asia  Pacific GNI per capita (US$) 4,200 
Ease of doing business rank (1–189) 139 Overall distance to frontier (DTF) score (0–100) 54.72 Population (m) 0.1 
Starting a business (rank) 70 Registering property (rank) 189 Trading across borders (rank) 68 
DTF score for starting a business (0–100) 88.37 DTF score for registering property (0–100) 0.00 DTF score for trading across borders (0–100) 76.97 
Procedures (number) 5 Procedures (number) NO PRACTICE Documents to export (number) 5 
Time (days) 17 Time (days) NO PRACTICE Time to export (days) 23 
Cost (% of income per capita) 12.8 Cost (% of property value) NO PRACTICE Cost to export (US$ per container) 695 
Minimum capital (% of income per capita) 0.0 Documents to import (number) 5 
Getting credit (rank) 71 Time to import (days) 25 
Dealing with construction permits (rank) 10 DTF score for getting credit (0–100) 50.00 Cost to import (US$ per container) 720 
DTF score for dealing with construction permits (0–100) 86.33 Strength of legal rights index (0–12) 10 
Procedures (number) 11 Depth of credit information index (0–8) 0 Enforcing contracts (rank) 58 
Time (days) 42 Credit bureau coverage (% of adults) 0.0 DTF score for enforcing contracts (0–100) 64.41 
Cost (% of warehouse value) 2.5 Credit registry coverage (% of adults) 0.0 Procedures (number) 36 
Time (days) 476 
Getting electricity (rank) 68 Protecting minority investors (rank) 183 Cost (% of claim) 27.4 
DTF score for getting electricity (0–100) 78.83 DTF score for protecting minority investors (0–100) 26.67 
Procedures (number) 5 Extent of conflict of interest regulation index (0–10) 3.3 Resolving insolvency (rank) 168 
Time (days) 67 Extent of shareholder governance index (0–10) 2.0 DTF score for resolving insolvency (0–100) 9.19 
Cost (% of income per capita) 719.0 Strength of minority investor protection index (0–10) 2.7 Time (years) 2.0 
Cost (% of estate) 38 
Paying taxes (rank) 128 Recovery rate (cents on the dollar) 17.1 
DTF score for paying taxes (0–100) 66.38 Strength of insolvency framework index (0–16) 0 
Payments (number per year) 21 
Time (hours per year) 128 
Total tax rate (% of profit) 64.8 
Note: For resolving insolvency, an economy for which “no practice” is recorded for time and cost receives a score of 0 on the strength of insolvency framework index even if its legal framework includes provisions related to 
insolvency proceedings (liquidation or reorganization). Most indicator sets refer to a case scenario in the largest business city of an economy, except for 11 economies for which the data are a population-weighted average 
for the 2 largest business cities. See the data notes for more details.
COUNTRY TABLES 203 
 Reform making it easier to do business  Change making it more difficult to do business 
MAURITANIA Sub-Saharan Africa GNI per capita (US$) 1,060 
Ease of doing business rank (1–189) 176 Overall distance to frontier (DTF) score (0–100) 44.21 Population (m) 3.9 
 Starting a business (rank) 164 Registering property (rank) 66 Trading across borders (rank) 151 
DTF score for starting a business (0–100) 65.83 DTF score for registering property (0–100) 73.57 DTF score for trading across borders (0–100) 55.49 
Procedures (number) 7 Procedures (number) 4 Documents to export (number) 8 
Time (days) 9 Time (days) 49 Time to export (days) 31 
Cost (% of income per capita) 19.8 Cost (% of property value) 4.7 Cost to export (US$ per container) 1,640 
Minimum capital (% of income per capita) 331.8 Documents to import (number) 8 
 Getting credit (rank) 171 Time to import (days) 38 
Dealing with construction permits (rank) 77 DTF score for getting credit (0–100) 10.00 Cost to import (US$ per container) 1,523 
DTF score for dealing with construction permits (0–100) 74.30 Strength of legal rights index (0–12) 2 
Procedures (number) 13 Depth of credit information index (0–8) 0 Enforcing contracts (rank) 86 
Time (days) 104 Credit bureau coverage (% of adults) 0.0 DTF score for enforcing contracts (0–100) 58.47 
Cost (% of warehouse value) 4.5 Credit registry coverage (% of adults) 4.6 Procedures (number) 46 
Time (days) 370 
Getting electricity (rank) 169 Protecting minority investors (rank) 166 Cost (% of claim) 23.2 
DTF score for getting electricity (0–100) 48.39 DTF score for protecting minority investors (0–100) 38.33 
Procedures (number) 5 Extent of conflict of interest regulation index (0–10) 3.7 Resolving insolvency (rank) 189 
Time (days) 75 Extent of shareholder governance index (0–10) 4.0 DTF score for resolving insolvency (0–100) 0.00 
Cost (% of income per capita) 7,833.4 Strength of minority investor protection index (0–10) 3.8 Time (years) NO PRACTICE 
Cost (% of estate) NO PRACTICE 
Paying taxes (rank) 187 Recovery rate (cents on the dollar) 0.0 
DTF score for paying taxes (0–100) 17.71 Strength of insolvency framework index (0–16) 0 
Payments (number per year) 49 
Time (hours per year) 734 
Total tax rate (% of profit) 71.3 
MAURITIUS Sub-Saharan Africa GNI per capita (US$) 9,300 
Ease of doing business rank (1–189) 28 Overall distance to frontier (DTF) score (0–100) 74.81 Population (m) 1.3 
 Starting a business (rank) 29 Registering property (rank) 98 Trading across borders (rank) 17 
DTF score for starting a business (0–100) 92.47 DTF score for registering property (0–100) 66.00 DTF score for trading across borders (0–100) 87.74 
Procedures (number) 5 Procedures (number) 4 Documents to export (number) 4 
Time (days) 6 Time (days) 14 Time to export (days) 10 
Cost (% of income per capita) 2.1 Cost (% of property value) 10.6 Cost to export (US$ per container) 675 
Minimum capital (% of income per capita) 0.0 Documents to import (number) 5 
Getting credit (rank) 36 Time to import (days) 9 
Dealing with construction permits (rank) 117 DTF score for getting credit (0–100) 65.00 Cost to import (US$ per container) 710 
DTF score for dealing with construction permits (0–100) 67.17 Strength of legal rights index (0–12) 6 
Procedures (number) 13 Depth of credit information index (0–8) 7  Enforcing contracts (rank) 44 
Time (days) 245 Credit bureau coverage (% of adults) 0.0 DTF score for enforcing contracts (0–100) 66.22 
Cost (% of warehouse value) 0.7 Credit registry coverage (% of adults) 71.9 Procedures (number) 34 
Time (days) 519 
Getting electricity (rank) 41 Protecting minority investors (rank) 28 Cost (% of claim) 25.0 
DTF score for getting electricity (0–100) 83.74 DTF score for protecting minority investors (0–100) 65.00 
Procedures (number) 4 Extent of conflict of interest regulation index (0–10) 7.3 Resolving insolvency (rank) 43 
Time (days) 84 Extent of shareholder governance index (0–10) 5.7 DTF score for resolving insolvency (0–100) 62.81 
Cost (% of income per capita) 277.0 Strength of minority investor protection index (0–10) 6.5 Time (years) 1.7 
Cost (% of estate) 15 
Paying taxes (rank) 13 Recovery rate (cents on the dollar) 67.4 
DTF score for paying taxes (0–100) 91.92 Strength of insolvency framework index (0–16) 8.5 
Payments (number per year) 8 
Time (hours per year) 152 
Total tax rate (% of profit) 24.5 
MEXICO Latin America  Caribbean GNI per capita (US$) 9,940 
Ease of doing business rank (1–189) 39 Overall distance to frontier (DTF) score (0–100) 71.53 Population (m) 122.3 
Starting a business (rank) 67 Registering property (rank) 110 Trading across borders (rank) 44 
DTF score for starting a business (0–100) 88.85 DTF score for registering property (0–100) 62.45 DTF score for trading across borders (0–100) 81.26 
Procedures (number) 6 Procedures (number) 6.8 Documents to export (number) 4 
Time (days) 6.3 Time (days) 63.7 Time to export (days) 12 
Cost (% of income per capita) 18.6 Cost (% of property value) 5.1 Cost to export (US$ per container) 1,499 
Minimum capital (% of income per capita) 0.0 Documents to import (number) 4 
 Getting credit (rank) 12 Time to import (days) 11.2 
Dealing with construction permits (rank) 108 DTF score for getting credit (0–100) 80.00 Cost to import (US$ per container) 1,888 
DTF score for dealing with construction permits (0–100) 68.43 Strength of legal rights index (0–12) 8 
Procedures (number) 11.3 Depth of credit information index (0–8) 8 Enforcing contracts (rank) 57 
Time (days) 87.6 Credit bureau coverage (% of adults) 100.0 DTF score for enforcing contracts (0–100) 64.61 
Cost (% of warehouse value) 10.3 Credit registry coverage (% of adults) 0.0 Procedures (number) 36.8 
Time (days) 389 
Getting electricity (rank) 116 Protecting minority investors (rank) 62 Cost (% of claim) 30.9 
DTF score for getting electricity (0–100) 68.47 DTF score for protecting minority investors (0–100) 57.50 
Procedures (number) 6.8 Extent of conflict of interest regulation index (0–10) 6.0  Resolving insolvency (rank) 27 
Time (days) 78.9 Extent of shareholder governance index (0–10) 5.5 DTF score for resolving insolvency (0–100) 72.59 
Cost (% of income per capita) 346.1 Strength of minority investor protection index (0–10) 5.8 Time (years) 1.8 
Cost (% of estate) 18 
Paying taxes (rank) 105 Recovery rate (cents on the dollar) 68.1 
DTF score for paying taxes (0–100) 71.17 Strength of insolvency framework index (0–16) 11.5 
Payments (number per year) 6 
Time (hours per year) 334 
Total tax rate (% of profit) 51.8 
Note: For resolving insolvency, an economy for which “no practice” is recorded for time and cost receives a score of 0 on the strength of insolvency framework index even if its legal framework includes provisions related to 
insolvency proceedings (liquidation or reorganization). Most indicator sets refer to a case scenario in the largest business city of an economy, except for 11 economies for which the data are a population-weighted average 
for the 2 largest business cities. See the data notes for more details.
204 DOING BUSINESS 2015 
 Reform making it easier to do business  Change making it more difficult to do business 
MICRONESIA, FED. STS. East Asia  Pacific GNI per capita (US$) 3,430 
Ease of doing business rank (1–189) 145 Overall distance to frontier (DTF) score (0–100) 53.07 Population (m) 0.1 
Starting a business (rank) 151 Registering property (rank) 189 Trading across borders (rank) 106 
DTF score for starting a business (0–100) 69.63 DTF score for registering property (0–100) 0.00 DTF score for trading across borders (0–100) 69.42 
Procedures (number) 7 Procedures (number) NO PRACTICE Documents to export (number) 5 
Time (days) 16 Time (days) NO PRACTICE Time to export (days) 30 
Cost (% of income per capita) 141.2 Cost (% of property value) NO PRACTICE Cost to export (US$ per container) 1,045 
Minimum capital (% of income per capita) 0.0 Documents to import (number) 6 
Getting credit (rank) 61 Time to import (days) 31 
Dealing with construction permits (rank) 37 DTF score for getting credit (0–100) 55.00 Cost to import (US$ per container) 1,045 
DTF score for dealing with construction permits (0–100) 80.10 Strength of legal rights index (0–12) 11 
Procedures (number) 14 Depth of credit information index (0–8) 0 Enforcing contracts (rank) 162 
Time (days) 99 Credit bureau coverage (% of adults) 0.0 DTF score for enforcing contracts (0–100) 40.85 
Cost (% of warehouse value) 0.5 Credit registry coverage (% of adults) 0.0 Procedures (number) 34 
Time (days) 885 
Getting electricity (rank) 30 Protecting minority investors (rank) 186 Cost (% of claim) 66.0 
DTF score for getting electricity (0–100) 85.89 DTF score for protecting minority investors (0–100) 23.33 
Procedures (number) 3 Extent of conflict of interest regulation index (0–10) 2.7 Resolving insolvency (rank) 118 
Time (days) 105 Extent of shareholder governance index (0–10) 2.0 DTF score for resolving insolvency (0–100) 37.74 
Cost (% of income per capita) 363.8 Strength of minority investor protection index (0–10) 2.3 Time (years) 5.3 
Cost (% of estate) 38 
Paying taxes (rank) 114 Recovery rate (cents on the dollar) 3.3 
DTF score for paying taxes (0–100) 68.78 Strength of insolvency framework index (0–16) 11.5 
Payments (number per year) 21 
Time (hours per year) 128 
Total tax rate (% of profit) 60.5 
MOLDOVA Europe  Central Asia GNI per capita (US$) 2,460 
Ease of doing business rank (1–189) 63 Overall distance to frontier (DTF) score (0–100) 66.60 Population (m) 3.6 
 Starting a business (rank) 35 Registering property (rank) 22 Trading across borders (rank) 152 
DTF score for starting a business (0–100) 92.16 DTF score for registering property (0–100) 86.10 DTF score for trading across borders (0–100) 54.97 
Procedures (number) 5 Procedures (number) 5 Documents to export (number) 9 
Time (days) 6 Time (days) 5.5 Time to export (days) 23 
Cost (% of income per capita) 4.6 Cost (% of property value) 0.9 Cost to export (US$ per container) 1,510 
Minimum capital (% of income per capita) 0.0 Documents to import (number) 11 
Getting credit (rank) 23 Time to import (days) 27 
Dealing with construction permits (rank) 175 DTF score for getting credit (0–100) 70.00 Cost to import (US$ per container) 1,870 
DTF score for dealing with construction permits (0–100) 48.11 Strength of legal rights index (0–12) 8 
Procedures (number) 27 Depth of credit information index (0–8) 6 Enforcing contracts (rank) 42 
Time (days) 247 Credit bureau coverage (% of adults) 8.8 DTF score for enforcing contracts (0–100) 66.68 
Cost (% of warehouse value) 0.8 Credit registry coverage (% of adults) 0.0 Procedures (number) 31 
Time (days) 567 
Getting electricity (rank) 149 Protecting minority investors (rank) 56 Cost (% of claim) 28.6 
DTF score for getting electricity (0–100) 59.73 DTF score for protecting minority investors (0–100) 58.33 
Procedures (number) 7 Extent of conflict of interest regulation index (0–10) 6.3 Resolving insolvency (rank) 58 
Time (days) 118 Extent of shareholder governance index (0–10) 5.3 DTF score for resolving insolvency (0–100) 53.32 
Cost (% of income per capita) 865.1 Strength of minority investor protection index (0–10) 5.8 Time (years) 2.8 
Cost (% of estate) 15 
 Paying taxes (rank) 70 Recovery rate (cents on the dollar) 29.4 
DTF score for paying taxes (0–100) 76.57 Strength of insolvency framework index (0–16) 12 
Payments (number per year) 21 
Time (hours per year) 185 
Total tax rate (% of profit) 39.7 
MONGOLIA East Asia  Pacific GNI per capita (US$) 3,770 
Ease of doing business rank (1–189) 72 Overall distance to frontier (DTF) score (0–100) 65.02 Population (m) 2.8 
Starting a business (rank) 42 Registering property (rank) 30 Trading across borders (rank) 173 
DTF score for starting a business (0–100) 91.33 DTF score for registering property (0–100) 82.76 DTF score for trading across borders (0–100) 30.18 
Procedures (number) 5 Procedures (number) 5 Documents to export (number) 11 
Time (days) 11 Time (days) 10.5 Time to export (days) 44 
Cost (% of income per capita) 1.2 Cost (% of property value) 2.1 Cost to export (US$ per container) 2,745 
Minimum capital (% of income per capita) 0.0 Documents to import (number) 12 
Getting credit (rank) 61 Time to import (days) 45 
Dealing with construction permits (rank) 74 DTF score for getting credit (0–100) 55.00 Cost to import (US$ per container) 2,950 
DTF score for dealing with construction permits (0–100) 74.62 Strength of legal rights index (0–12) 5 
Procedures (number) 16 Depth of credit information index (0–8) 6 Enforcing contracts (rank) 24 
Time (days) 137 Credit bureau coverage (% of adults) 0.0 DTF score for enforcing contracts (0–100) 70.17 
Cost (% of warehouse value) 0.0 Credit registry coverage (% of adults) 32.7 Procedures (number) 32 
Time (days) 374 
Getting electricity (rank) 142  Protecting minority investors (rank) 17 Cost (% of claim) 30.6 
DTF score for getting electricity (0–100) 60.91 DTF score for protecting minority investors (0–100) 67.50 
Procedures (number) 8 Extent of conflict of interest regulation index (0–10) 7.0 Resolving insolvency (rank) 90 
Time (days) 79 Extent of shareholder governance index (0–10) 6.5 DTF score for resolving insolvency (0–100) 43.93 
Cost (% of income per capita) 600.6 Strength of minority investor protection index (0–10) 6.8 Time (years) 4.0 
Cost (% of estate) 15 
 Paying taxes (rank) 84 Recovery rate (cents on the dollar) 17.8 
DTF score for paying taxes (0–100) 73.79 Strength of insolvency framework index (0–16) 11 
Payments (number per year) 41 
Time (hours per year) 148 
Total tax rate (% of profit) 24.4 
Note: For resolving insolvency, an economy for which “no practice” is recorded for time and cost receives a score of 0 on the strength of insolvency framework index even if its legal framework includes provisions related to 
insolvency
Doing business 2015
Doing business 2015
Doing business 2015
Doing business 2015
Doing business 2015
Doing business 2015
Doing business 2015
Doing business 2015
Doing business 2015
Doing business 2015
Doing business 2015
Doing business 2015
Doing business 2015
Doing business 2015
Doing business 2015
Doing business 2015
Doing business 2015
Doing business 2015
Doing business 2015
Doing business 2015
Doing business 2015
Doing business 2015
Doing business 2015
Doing business 2015
Doing business 2015
Doing business 2015
Doing business 2015
Doing business 2015
Doing business 2015
Doing business 2015
Doing business 2015
Doing business 2015
Doing business 2015
Doing business 2015
Doing business 2015
Doing business 2015
Doing business 2015
Doing business 2015
Doing business 2015
Doing business 2015
Doing business 2015
Doing business 2015
Doing business 2015
Doing business 2015
Doing business 2015
Doing business 2015
Doing business 2015
Doing business 2015
Doing business 2015
Doing business 2015
Doing business 2015
Doing business 2015
Doing business 2015
Doing business 2015
Doing business 2015
Doing business 2015
Doing business 2015
Doing business 2015
Doing business 2015
Doing business 2015
Doing business 2015
Doing business 2015
Doing business 2015
Doing business 2015
Doing business 2015
Doing business 2015
Doing business 2015
Doing business 2015
Doing business 2015
Doing business 2015
Doing business 2015
Doing business 2015
Doing business 2015
Doing business 2015
Doing business 2015
Doing business 2015
Doing business 2015
Doing business 2015
Doing business 2015
Doing business 2015
Doing business 2015
Doing business 2015
Doing business 2015
Doing business 2015
Doing business 2015
Doing business 2015
Doing business 2015
Doing business 2015
Doing business 2015
Doing business 2015
Doing business 2015
Doing business 2015
Doing business 2015
Doing business 2015
Doing business 2015
Doing business 2015
Doing business 2015
Doing business 2015
Doing business 2015
Doing business 2015
Doing business 2015
Doing business 2015
Doing business 2015
Doing business 2015
Doing business 2015
Doing business 2015
Doing business 2015
Doing business 2015
Doing business 2015
Doing business 2015
Doing business 2015
Doing business 2015
Doing business 2015
Doing business 2015
Doing business 2015

Doing business 2015

  • 1.
    Doing Business 2015 Going Beyond Efficiency Comparing Business Regulations for domestic firms in 189 Economies A World Bank Group Flagship Report 12th edition
  • 2.
    © 2014 InternationalBank for Reconstruction and Development / The World Bank 1818 H Street NW, Washington DC 20433 Telephone: 202-473-1000; Internet: www.worldbank.org Some rights reserved 1 2 3 4 17 16 15 14 This work is a product of the staff of The World Bank with external contributions. The findings, interpretations, and conclusions expressed in this work do not necessarily reflect the views of The World Bank, its Board of Executive Directors, or the governments they represent. The World Bank does not guarantee the accuracy of the data included in this work. The boundaries, colors, denomina-tions, and other information shown on any map in this work do not imply any judgment on the part of The World Bank concerning the legal status of any territory or the endorsement or acceptance of such boundaries. Nothing herein shall constitute or be considered to be a limitation upon or waiver of the privileges and immunities of The World Bank, all of which are specifically reserved. Rights and Permissions This work is available under the Creative Commons Attribution 3.0 IGO license (CC BY 3.0 IGO) http://creativecommons.org /licenses/by/3.0/igo. Under the Creative Commons Attribution license, you are free to copy, distribute, transmit, and adapt this work, including for commercial purposes, under the following conditions: Attribution—Please cite the work as follows: World Bank. 2014. Doing Business 2015: Going Beyond Efficiency. Washington, DC: World Bank. DOI: 10.1596/978-1-4648-0351-2. License: Creative Commons Attribution CC BY 3.0 IGO Translations—If you create a translation of this work, please add the following disclaimer along with the attribution: This translation was not created by The World Bank and should not be considered an official World Bank translation. The World Bank shall not be liable for any content or error in this translation. Adaptations—If you create an adaptation of this work, please add the following disclaimer along with the attribution: This is an adaptation of an original work by The World Bank. Views and opinions expressed in the adaptation are the sole responsibility of the author or authors of the adaptation and are not endorsed by The World Bank. Third-party content—The World Bank does not necessarily own each component of the content contained within the work. The World Bank therefore does not warrant that the use of any third-party-owned individual component or part contained in the work will not infringe on the rights of those third parties. The risk of claims resulting from such infringement rests solely with you. If you wish to re-use a component of the work, it is your responsibility to determine whether permission is needed for that re-use and to obtain permission from the copyright owner. Examples of components can include, but are not limited to, tables, figures, or images. All queries on rights and licenses should be addressed to the Publishing and Knowledge Division, The World Bank, 1818 H Street NW, Washington, DC 20433, USA; fax: 202-522-2625; e-mail: pubrights@worldbank.org. ISBN (paper): 978-1-4648-0351-2 ISBN (electronic): 978-1-4648-0352-9 DOI: 10.1596/978-1-4648-0351-2 ISSN: 1729-2638 Cover design: Corporate Visions, Inc.
  • 3.
    Doing Business 2015 Going Beyond Efficiency COMPARING BUSINESS REGULATIONS FOR DOMESTIC FIRMS IN 189 ECONOMIES A World Bank Group Flagship Report 12TH EDITION
  • 4.
    Doing Business 2015 Going Beyond Efficiency Resources on the Doing Business website Current features News on the Doing Business project http://www.doingbusiness.org Rankings How economies rank—from 1 to 189 http://www.doingbusiness.org/rankings Data All the data for 189 economies—topic rankings, indicator values, lists of regulatory procedures and details underlying indicators http://www.doingbusiness.org/data Reports Access to Doing Business reports as well as subnational and regional reports, reform case studies and customized economy and regional profiles http://www.doingbusiness.org/reports Methodology The methodologies and research papers underlying Doing Business http://www.doingbusiness.org/methodology Research Abstracts of papers on Doing Business topics and related policy issues http://www.doingbusiness.org/research Doing Business reforms Short summaries of DB2015 business regulation reforms, lists of reforms since DB2008 and a ranking simulation tool http://www.doingbusiness.org/reforms Historical data Customized data sets since DB2004 http://www.doingbusiness.org/custom-query Law library Online collection of business laws and regulations relating to business http://www.doingbusiness.org/law-library Contributors More than 10,700 specialists in 189 economies who participate in Doing Business http://www.doingbusiness.org /contributors/doing-business Entrepreneurship data Data on business density (number of newly registered companies per 1,000 working-age people) for 139 economies http://www.doingbusiness.org/data /exploretopics/entrepreneurship Distance to frontier Data benchmarking 189 economies to the frontier in regulatory practice http://www.doingbusiness.org/data /distance-to-frontier Information on good practices Showing where the many good practices identified by Doing Business have been adopted http://www.doingbusiness.org/data /good-practice Doing Business iPhone app Doing Business at a Glance—presenting the full report, rankings and highlights for each topic for the iPhone, iPad and iPod touch http://www.doingbusiness.org /special-features/iphone
  • 5.
    Doing Business 2015 Going Beyond Efficiency Contents v Foreword 1 Overview 15 About Doing Business 24 What is changing in Doing Business? 33 Reforming the business environment in 2013/14 Case studies 47 Starting a business The growing efficiency of company registries 53 Zoning and urban planning Understanding the benefits 60 Registering property Measuring the quality of land administration systems 67 Getting credit The importance of registries 76 Protecting minority investors Going beyond related-party transactions 83 Paying taxes Trends before and after the financial crisis 90 Enforcing contracts How judicial efficiency supports freedom of contract 96 Resolving insolvency Measuring the strength of insolvency laws 102 Highlights from the Doing Business research conference 109 References 1 14 Data notes 146 Distance to frontier and ease of doing business ranking 152 Summaries of Doing Business reforms in 2013/14 167 Country tables 231 Labor market regulation data 252 Acknowledgments Doing Business 2015 is the 12th in a series of annual reports investigating the regulations that enhance business activity and those that constrain it. Doing Business presents quantitative indicators on business regulations and the protection of property rights that can be compared across 189 economies—from Afghanistan to Zimbabwe—and over time. Doing Business measures regulations affecting 11 areas of the life of a business. Ten of these areas are included in this year’s ranking on the ease of doing business: starting a business, dealing with construction permits, getting electricity, registering property, getting credit, protecting minority investors, paying taxes, trading across borders, enforcing contracts and resolving insolvency. Doing Business also measures labor market regulation, which is not included in this year’s ranking. Data in Doing Business 2015 are current as of June 1, 2014. The indicators are used to analyze economic outcomes and identify what reforms of business regulation have worked, where and why.
  • 7.
    Doing Business 2015 Going Beyond Efficiency Foreword How to use Doing Business indicators and how not to The public discourse on eco-nomic policy is overwhelmingly focused on fiscal measures, monetary interventions, welfare pro-grams and other such highly visible instruments of government action. Thus when an economy does poorly, a disproportionate amount of our debate centers on whether or not it needs a fiscal stimulus, whether there should be liquidity easing or tightening, whether its welfare programs have been too profligate or too paltry and so on. What gets much less attention but is equally—and, in some situations, even more—important for an economy’s success or failure is the nuts and bolts that hold the economy together and the plumbing that underlies the economy. The laws that determine how easily a business can be started and closed, the efficiency with which contracts are enforced, the rules of administration pertaining to a variety of activities— such as getting permits for electricity and doing the paperwork for exports and imports—are all examples of the nuts and bolts that are rarely visible and in the limelight but play a critical role. Their malfunctioning can thwart an economy’s progress and render the more visible policy instruments, such as good fiscal and monetary poli-cies, less effective. Just as the Space Shuttle Challenger broke apart on takeoff from Cape Canaveral, Florida, on January 28, 1986, not because (as was later realized) something major had gone wrong but because a joint held together by a circular nut called the O-ring had failed, an economy can be brought down or held back by the failure of its nuts and bolts. The World Bank Group’s Doing Business report is an annual statement of the state of the nuts and bolts of economies around the world and, as such, is one of the most important compendiums of information and analysis of the basis of an economy’s effective day-to-day functioning and development. Creating an efficient and inclusive ethos for enterprise and business is in the interest of all societies. An economy with an efficient bureaucracy and rules of governance that facilitates entrepreneurship and creativity among individuals, and provides an enabling atmosphere for people to realize their full potential, can enhance living standards and promote growth and shared prosperity. It can also help in creating an environment in which standard macroeconomic policies are more effective and course through the economy more easily. After decades of debate there is now some conver-gence in economics about the roles of the market and the state. To leave everything to the free market can lead to major economic malfunction and elevated levels of poverty, and have us be silent witnesses to, for instance, discrimination against certain groups. Moreover, there is a logical mistake that underlies the market fundamentalist philosophy. To argue that individuals and private businesses should have all the freedom to pursue what they
  • 8.
    vi DOING BUSINESS2015 wish and that government should not intervene overlooks the fact that gov-ernment is nothing but the outcome of individual actions. Hence the edict is internally inconsistent. Fortunately, market fundamentalism has, for the most part, been relegated to the mar-gins of serious policy discourse. Turning to the other extreme, it is now widely recognized that to have the state try to do it all is a recipe for eco-nomic stagnation and cronyism. In any national economy there are too many decisions to be made, and too great a variety of skills and talents scattered through society, for any single author-ity to take effective charge. It is true that government should inter-vene in the market to help the disadvan-taged, to keep inequality within bounds, to provide public goods and to create correctives for market failures such as those stemming from externalities, information asymmetries and systemic human irrationalities.1 But over and above these, government also has the critical responsibility to provide a nimble regulatory setup that enables ordinary people to put their skills and talents to the best possible use and facilitates the smooth and efficient functioning of businesses and markets.2 It is this critical role of providing an enabling and facilitating ethos for individual tal-ent and enterprise to flourish—which includes an awareness of where not to intervene and interfere—that the Doing Business report tries to measure. There is no unique way of doing this, and there are plenty of open conceptual questions one has to contend with. In brief, by its very nature Doing Business has all the ingredients of being both important and controversial, and it has lived up to both qualities in ample measure. SWITCHING SIDES As an independent researcher and, later, as Chief Economic Adviser to the Indian government, I used, criticized, valued and debated the Doing Business report, unaware that I would be at the World Bank one day and hence be shifted from the side of the consumer to that of the manufacturer of this product. This shift has given me a 360-degree view of Doing Business and, along with that, an awareness of its strengths and weaknesses, which oth-ers, luckier than I, may not have. Its greatest strength is its transpar-ency and adherence to clearly stated criteria. Doing Business takes the same set of hypothetical questions to 189 economies and collects answers to these. Thus, for instance, when check-ing on an economy’s efficacy in “enforc-ing contracts,” it measures the time, cost and procedures involved in resolv-ing a hypothetical commercial lawsuit between 2 domestic firms through a local court. The dispute involves the breach of a sales contract worth twice the size of the income per capita of the economy or $5,000, whichever is greater. This meticulous insistence on using the same standard everywhere gives Doing Business a remarkable comparability across economies. However, this same strength is inevi-tably a source of some weaknesses. It means that, contrary to what some people believe, Doing Business is not based on sample surveys of firms. It is not feasible, at least not at this stage, to conduct such surveys in 189 econo-mies. A lot of the Doing Business data are based on careful collection of de jure information on what an economy’s laws and regulations require. Further, even when, based on a study of one economy or a cluster of economies, some measure is found to be an important determinant of the ease of doing business, it may not be possible to put this measure to use unless a way is found to collect informa-tion on it from all 189 economies. Nor does the fact that the same mea-sures are collected for all economies automatically mean that they are the right measures. The same measure may be more apt for one economy and less so for another. As Ken Arrow once pointed out, the medieval English law under which no one was allowed to sleep on park benches applied to both pau-pers and aristocrats, but since the latter typically did not consider the use of park benches for napping, it was amply clear that this horizontally anonymous law was actually meant for only one class of people, namely the poor.3 Another problem arises from the fact that the overall ease of doing business ranking is an aggregation of 10 com-ponent indicators—measuring how easy it is (in the economy concerned) to start a business, deal with construc-tion permits, get electricity, register property, get credit, pay taxes, trade across borders, enforce contracts and resolve insolvency and how strong the protections for minority investors are. Further, each of these 10 component indicators is itself an amalgam of several even more basic measures. The way all this is aggregated is by giving each basic measure the same weight to get to each component indicator, and then giving an equal weight to each of the 10 component indicators to get to the final score. Questions may indeed be asked about whether it is right to give the same weight to different indicators.4 Is an economy’s speed at 1. There is evidence that human beings are not just frequently irrational but have certain systematic propensities to this, which can be and has been used to exploit individuals (Akerlof and Shiller 2009; Johnson 2009). By this same logic, these irrationalities can be used to promote development and growth. The next World Development Report (World Bank, forthcoming), to be published in December 2014, is devoted to this theme. 2. This convergent view can increasingly be found in microeconomics books, such as Bowles (2006); Basu (2010); and Ferguson (2013). 3. Arrow 1963. 4. There is a lot of research on the choice of weights when aggregating and on the algebra of ranking; see, for example, Sen (1977); Basu (1983); and Foster, McGillivray and Seth (2012).
  • 9.
    FOREWORD vii givingan electricity connection to a new enterprise as important as its ability to enforce contracts efficiently? Further, the measures count both the time taken to get certain permits and clearances and also the number and intricacy of procedures. These also entail weights. There is a way of doing away with weights, an approach that involves declaring one economy to be ranked above another only if it dominates the other in all 10 indicators. This is referred to as the criterion of vector-dominance, and its properties have been studied and are well understood. The trouble with this criterion is that it leads to incompleteness in rankings. For many pairs of economies it will not be possible to treat either as ranked above the other; nor can we, in such cases, declare the 2 to be equally good in terms of the ease of doing business. This is illustrated in the figure, which ranks a small cluster of economies by using vector-dominance in terms of the 10 indicators. A downward line between 2 economies represents dominance, and 2 economies that cannot be connected by a downward line cannot be compared with each other. Hence Singapore is unequivocally ranked above Ireland, which is ranked above Cyprus and so on. Singapore is also ranked above Latvia. Similarly, New Zealand is ranked above Latvia, which is above Morocco and Benin, and so on. Singapore and New Zealand, which are this year’s winner and runner-up in our ordinal ranking, cannot, however, be ranked in terms of vector-dominance; nor can we rank New Zealand and Ireland.5 It is true that the figure shows only a small segment of the quasi-order over the 189 economies; but even if we showed the full set, the picture would be populated with pairs of economies that cannot be ranked. That is indeed the disadvantage of vector-dominance. When it pronounces judgment, it does so with great authority, but it achieves this at the cost of total reticence over large domains. What I suspected when I was a user of Doing Business, and now know, is that a significant number of the top 30 economies in the ease of doing business ranking come from a tradition where government has had quite a prominent presence in the economy, including through the laying out of rules to regulate different dimensions of the activities of the private sector. However, all these economies have an excellent performance on the Doing Business indicators and in other international data sets capturing various dimensions of competitiveness. The top-performing economies in the ease of doing business ranking are therefore not those with no regulation but those in which governments have managed to create rules that facilitate interactions in the marketplace without needlessly hindering the development of the private sector.6 Ultimately, Doing Business is about smart regulations that only a well-functioning state can provide. The secret of success is to have the essential rules and regulations in place—but more importantly to have a good system of clearing decisions quickly and predictably, so that small and ordinary businesses do not feel harassed. To get to an evaluation of this, one has to make choices, such as what to include and what to exclude and what weights to use. This has been done in creating the Doing Business measures, and effort is being made to improve on these. Excessive taxation, for instance, can dampen incentives and adversely affect an economy’s functioning. But this does not mean that the lower the tax rates and collections, the better. There are economies where the tax revenue to GDP ratio is so low that it hampers the government’s ability to regulate efficiently, invest in infrastructure and provide basic health and education services to the poor. With that in mind, the Doing Business team changed the indicator that used to treat a lower tax rate as better. Three years ago a threshold was set such that economies with tax rates below this threshold are not rewarded. This has reduced the bias in favor of economies that choose not to levy even a reasonable tax on private companies. Our attention has been drawn to many critiques by the Independent Panel on Doing Business, chaired by Trevor Manuel, which submitted its report in 2013.7 Following this report a decision was made to set a 2-year target to improve the methodology of Doing Business without damaging the overall integrity of this valuable publication. The Doing Business team is in the midst Ranking by vector-dominance Singapore Ireland Cyprus Senegal New Zealand Latvia Morocco Benin 5. This example of vector-dominance is based only on the top 2 economies in this year’s ease of doing business ranking. The figure was constructed as follows: First, all economies were sorted by their ranking, and the first economy for which all 10 indicator rankings are lower than those of Singapore was identified: Ireland. The process was then repeated for Ireland, and so on for all 189 economies. Second, the analysis was replicated, this time starting with New Zealand. Third, all pairs of economies in the figure were compared (for example, the horizontal line between Singapore and Latvia means that Singapore vector-dominates Latvia and all economies connected with a vertical line under Latvia). 6. See Besley and Burgess (2004). 7. The report by the Independent Panel on Doing Business is available on its website at http://www.dbrpanel.org/.
  • 10.
    viii DOING BUSINESS2015 of such an exercise, and it is hoped that independent researchers, wherever in the world they happen to be, will join in the task of refining and improving this important document. STRENGTHS AND WEAKNESSES While the 2-year task of improving the methodology continues, it is worth being clear that there is no such thing as the best, all-encompassing indicator. As a consequence, responsibility rests as much with the users of the ease of doing business ranking as with its producers to make sure that it is a valuable instrument of policy. Controversy has often arisen from reading more into the ranking or indicator than what it actually captures. It has been pointed out, critically, that there are economies that do poorly on the Doing Business indicators but that nevertheless get a lot of foreign direct investment (FDI) from global corporations. These examples are usually nothing more than a reminder that an economy has many more aspects than the features that are tracked and measured by the Doing Business report. The flow of FDI into an economy is facilitated by having a better doing business ethos, true, but FDI flows can be thwarted by other policy weaknesses; and, conversely, an economy with poor performance on the Doing Business indicators may make up for it in other ways so as to attract large FDI inflows. The fact that there are examples of economies that do not do well on the Doing Business indicators but continue to receive flows of FDI shows that private corporations do not make this mistake; they will decide on the basis of a range of factors. Another common criticism is implicit in the question, If economy x is grow-ing fast, why does it not rank high on the ease of doing business? First, if the ease of doing business ranking were constructed in such a way that it had a very high correlation with GDP or GDP growth, there would be little reason to have a new ranking. We would be able to get our result from looking at GDP or GDP growth tables. Second, this question is often rooted in the common mistake, already noted, of treating the ease of doing busi-ness ranking as an all-encompassing measure of an economy’s goodness. It is not. An economy can do poorly on Doing Business indicators but do well in macroeconomic policy or social welfare interventions. In the end, Doing Business measures a slender segment of the complex organism that any modern economy is. It attempts to capture a segment that is representative of other general features of the economy (and effort will be made to improve on this), but the fact remains that an economy can undo the goodness or badness of its performance on Doing Business indi-cators through other policies. Moreover, economic efficiency is not the only measure by which we evalu-ate an economy’s performance.8 Most of us value greater equality among people; the ease of doing business ranking is not meant to measure suc-cess on that scale. We value better health, better education, literature and culture; the ease of doing business ranking is not meant to capture these either. It is a mistake to treat this as a criticism of the ease of doing business ranking; it is simply a reminder that life is a many-splendored thing, and the Doing Business report tries to capture one aspect of the good life. The need is to resurrect that once-popular expres-sion, “ceteris paribus.” Other things re-maining the same, an economy should try to improve its score underlying the ease of doing business ranking. In putting the ease of doing business ranking to use in crafting policy, it is important to keep in mind these caveats, strengths and weaknesses. Ultimately, the Doing Business indicators are meant to simply hold up a mirror to economies. A poor score should alert a government that it ought to examine its regulatory structure. On the basis of this it may decide to change some regu-latory features and policies in ways that may not even directly affect its ease of doing business ranking but nevertheless improve the economy’s performance. If this happens, and there is some evidence that it does, the Doing Business report would be serving its purpose. There are governments that attract a lot of talent into their bureaucracy but nevertheless do not have an efficient administration because the bureaucrats get trapped in their arcane rules of engagement. This is a report that can be of great value to such governments. And it is gratifying that a large number of governments have put it precisely to such use. Promoting a well-functioning, competi-tive private sector is a major undertak-ing for any government, especially for one with limited resources and techni-cal capabilities. It requires long-term comprehensive policies targeting mac-roeconomic stability; investment in in-frastructure, education and health; and the building of technological and entre-preneurial capacity. A well-functioning political system—one in which the gov-ernment is perceived to be working in the public interest while managing scarce resources in a reasonably transparent way—plays a central role. Removing administrative barriers and strengthen-ing laws that promote entrepreneurship and creativity—both of which are within the power of governments to do—can set an economy on the path to greater prosperity and development. There is compelling evidence that excessively burdensome regulations can lead to large informal and less-productive sec-tors, less entrepreneurship and lower rates of employment and growth. 8. See Stiglitz, Sen and Fitoussi (2009); World Bank (2014a); and World Bank and IMF (2014).
  • 11.
    FOREWORD ix CARDINALITY, ORDINALITY, RANKINGS AND RATINGS One feature of the report that has received a lot of attention is its use of rankings. Ultimately, what the report does is to provide a table with a simple ordinal ranking of all 189 economies. After a lot of debate and discussion a decision was made to stay with the overall ranking, even though other, cardinal features of the exercise are at the same time being strengthened, as will be explained shortly. It was in 2005 that the World Bank Group management decided to start ranking economies on the ease of doing business because it recognized the value of benchmarking exercises in generating interest among policy makers in reform.9 In an area that had received little attention from policy makers before the publication of the first Doing Business report, the rankings proved to be an important catalyst in raising the profile of regulation as a central element of a good investment climate. The rank-ings also proved effective in moving issues of performance and progress in business regulation to the center of policy discussions in a large number of economies. By capturing complex, multidimensional realities in a simple quantified framework, the rankings also helped to facilitate communica-tion between different stakeholders and made possible meaningful inter-national comparisons of the regula-tory performance of economies, con-tributing, along the way, to increasing the accountability of political actors. Members of the business commu-nity, for instance, could point to the existence of less complex and costly procedures or better-functioning insti-tutions in other economies in the region in their dealings with governments, which, by and large, had been slow to see their own Doing Business data in an international perspective. The overall ranking has value in addition to the topic-level indicators. The overall rank-ing combines a wealth of information that serves as a summary measure and allows governments to benchmark their economy’s performance against that of other economies. Notwithstanding the important ben-efits of rankings, the disaggregated data are also a clear strength of the project. Policy makers frequently become aware of the measurements through the ranking but then use the disaggregated data to shape reform programs. The data identify best prac-tices globally and identify where each economy’s practices hold inefficiencies or inadequate legal protections. For example, governments find it useful to compare their own procedures lists for firm start-up with those of other economies that pursue the same goals with less procedural complexity and at lower cost. Having noted these advantages, we would be remiss if we did not point to some of the disadvantages of ordinal ranking. When an economy is given a rank, there is no sense of how far it is from its closest contenders. Consider an economy that is ranked at 95, with no other economy at that rank. We know that its closest contenders are at 94 and 96 and this would be unchanged no matter how far or how near those other economies are. This means that when economies are very densely packed, a small improvement can lead to a vast jump in ranking and a small worsening can lead to a large drop in ranking. To see this, consider an extreme case where 50 economies have exactly the same scores on the indicators underlying the ease of doing business ranking and so each of them has the same ranking, say 95. If one economy does slightly worse, with no change in the performance of all the other economies, it will drop not to 96 in the ranking but to 145. On an ordinal ranking scale this will show up as a seemingly alarming drop, but noth-ing alarming has actually happened. Similarly, if an economy is far behind the economy ahead of it, it can make a large improvement and yet show no gain in the ordinal rank measure. In response to this, there are 2 comments in defense of the methods used. First, the Doing Business team worked over the past 3 years to deepen the indices by adding a “distance to frontier” measure. This measure has certain cardinal qualities because it tries to capture the actual distance each economy has to go to reach the frontier of “best performance.” This puts on display how each economy performs not only vis-à-vis other economies but also in absolute terms. Further, the distance to frontier score can shed light on the progress made by individual economies over time in comparison with their own regulatory practices of previous years. This makes it transparent that an economy can make actual progress and still lose ground in the ranking when rank-neighboring economies do even better. Recent Doing Business reports have given increasing attention to long-term trends in the data—with an emphasis on economies’ performance with respect to their past performance—to balance the short-term perspective that the ranking provides. Further, for reasons of transparency Doing Business makes the disaggregated data available on its website. This allows users to construct alternative rankings with any set of weights they may wish to attach to individual indicators. Second, the ranking issue crops up for both the final aggregate score and the basic indicators that go into the 9. See World Bank (2006).
  • 12.
    x DOING BUSINESS2015 creation of this final score. Here, the use of ordinal ranks is more problem-atic because they get absorbed in the final measure and economies making small improvements or regressions in densely packed areas can have a disproportionate gain or loss in rank-ing. This information being buried in the basic indicators makes it harder to discern. For this reason from this year we decided to switch from using the or-dinal ranks of basic indicators to using absolute or cardinal measures before they are aggregated in the final rank-ing. There are also other options. One is to switch from rankings to ratings, which would have economies appear in clusters that are then ranked. But this method too comes with its own share of strengths and weaknesses. CONCLUSION The economy is a complex machine, be-yond the full comprehension of any per-son. Over the years meticulous research, collection of increasingly sophisticated data and the advance of economic theory and innovative modeling have given us a better understanding of this machine. Nevertheless, one has to ap-proach economic policy making with a certain humility, keeping an eye on the fact that what we, all this time, took to be an established feature of economics may be open to question. In brief, the discipline is evolving and we must be willing participants in the process. The World Bank Group’s Doing Business initiative is no exception to this. It tries to track and measure one of the most important features of an economy— the ease with which it is possible to do business, trade and exchange. It provides governments, administrators and researchers with valuable data and analysis to promote a better regula-tory framework for development, job creation and growth. There are econo-mies that have benefited greatly from this and it is hoped that Doing Business will continue to provide this service. At the same time, as this foreword has argued, we are aware that we still have some distance to go in our understand-ing of an economy. For that reason we welcome research and criticism and hope that this will lead to a better Doing Business report. This year’s report is a small, first step in that direction. Kaushik Basu Senior Vice President and Chief Economist The World Bank Washington, DC
  • 13.
    Doing Business 2015 Going Beyond Efficiency Overview Great ideas for new business ventures happen every day and everywhere. Some go far, while others never take off. Great ideas are at the heart of development; they allow economies to grow, and they improve people’s lives. So it is important to un-derstand why some great ideas never come to fruition even as others thrive. What do entrepreneurs need to pursue a great idea? First of all, they need the ability to give legal form to the idea— that is, to start a business—simply, quickly and inexpensively and with the certainty of limited liability. They also need the certainty of a well-designed insolvency system, in case the idea fails to work out. In addition, they will need to hire people to help realize the idea, will probably need to obtain financing (both equity and credit) and, in today’s increasingly interdependent global economy, may in many cases need a simple way to import and export. And they will need a straightforward way to pay their taxes. Sound business regulations are funda-mental to all this. The right business regulations enable good ideas to take root, leading to the creation of jobs and to better lives. But where business regulations make it difficult to start and operate a business, good ideas may never see the light of day and important opportunities may be missed. Budding entrepreneurs, daunted by burden-some regulations, may opt out of doing business altogether or, if they have the resources, take their ideas elsewhere. Doing Business looks at how business regulations determine whether good ideas can get started and thrive or will falter and wither away. Many other di-mensions of the business environment also matter but are outside the scope of Doing Business. For example, Doing Business does not capture such aspects as security, market size, macroeco-nomic stability and the prevalence of bribery and corruption. Nevertheless, improving in the areas measured by Doing Business is an important step toward a better business environment for all. WHAT DOES DOING BUSINESS MEASURE—AND HOW IS IT CHANGING? This year’s Doing Business report launches a 2-year process of introduc-ing important improvements in 8 of the 10 sets of Doing Business indicators. These improvements provide a new conceptual framework in which the emphasis on the efficiency of regula-tion is complemented by an increased emphasis on its quality. In the area of dealing with construction permits, for example, Doing Business will measure the quality of building regulations and the qualifications of the people review-ing the building plans in addition to the efficiency of the process for completing all the formalities to build a warehouse. With a few exceptions, the original Doing Business indicators focused mainly on measuring efficiency, such as ƒ This year’s Doing Business report launches a 2-year process of introducing improvements in 8 of the 10 Doing Business indicator sets—to complement the emphasis on the efficiency of regulation with a greater emphasis on its quality. ƒ New data show that efficiency and quality go hand in hand. Insolvency cases are resolved more quickly, and with better outcomes, where insolvency laws are well designed. Property transfers are faster and less costly in economies with good land administration systems. And commercial disputes are resolved more efficiently by courts using internationally recognized good practices. ƒ For the first time this year, Doing Business collected data for 2 cities in large economies. The data show few differences between cities within economies in indicators measuring the strength of legal institutions, which typically apply nationwide. Differences are more common in indicators measuring the complexity and cost of regulatory processes, where local jurisdictions play a larger role. ƒ Sub-Saharan Africa accounts for 5 of the 10 top improvers in 2013/14. The region also accounts for the largest number of regulatory reforms making it easier to do business in the past year—75 of the 230 worldwide. More than 70% of its economies carried out at least one such reform. ƒ Business regulations such as those measured by Doing Business are important for new business creation and for the performance of small firms.
  • 14.
    2 DOING BUSINESS2015 by recording the procedures, time and cost to start a business or to transfer property. These are very important aspects to measure. But as the proj-ect’s importance grew, it became clear that there was a need to expand what was being measured to include more aspects of regulatory quality. Many of the improvements in methodology were inspired and informed by the report of the Independent Panel on Doing Business as well as by input from policy makers and data users.1 They also benefited from discussions at the Doing Business research conference held in Washington, DC, in February 2014. (For more details on the changes in methodology, see the chapter on what is changing in Doing Business.) Doing Business continues to focus on regulations that affect domestic small and medium-size enterprises, operat-ing in the largest business city of an economy, across 10 areas: starting a business, dealing with construction permits, getting electricity, registering property, getting credit, protecting minority investors, paying taxes, trad-ing across borders, enforcing contracts and resolving insolvency. Doing Business also measures labor market regulation, which is not included in any of the aggregate measures. The indicator sets for 3 of the 10 topics are being expanded in this year’s report; those for 5 others will be expanded in next year’s report (figure 1.1). In another change starting in this year’s report, Doing Business has extended its coverage to include the second larg-est business city in economies with a population of more than 100 million. These economies are Bangladesh, Brazil, China, India, Indonesia, Japan, Mexico, Nigeria, Pakistan, the Russian Federation and the United States. In addition, while Doing Business contin-ues to publish the ease of doing business ranking, this year’s report introduces a change in the basis for the ranking, from the percentile rank to the distance to frontier score. The distance to frontier score benchmarks economies with respect to a measure of regulatory best practice—showing the gap between each economy’s performance and the best performance on each indicator.2 This measure captures more informa-tion than the simple rankings previously used as the basis for the ease of doing business ranking because it shows not only how economies are ordered on their performance on the indicators but also how far apart they are. The distance to frontier score also provides an important complement to the ease of doing business ranking in analyzing changes in an economy’s business regulatory environment. An example at the global level suggests why: the time series of the distance to frontier scores overwhelmingly shows improvements in business regulations around the world, while in the ease of doing business ranking, for every economy that goes up another must go down. (For more details on the differ-ences between the 2 measures, see the chapter on the distance to frontier and ease of doing business ranking.) While the changes being implemented this year are substantive, there is a strong correlation at the aggregate level between this year’s data under the old methodology and the same data under the new one (figure 1.2). This is not surprising, since changes are being in-troduced for only 3 of the 10 topics this year. But even with a high correlation there can still be relatively large shifts in ranking in some cases. This is particu-larly likely for economies in the middle of the distribution, in part because they are more closely bunched and small shifts in their distance to frontier scores will therefore tend to have a greater im-pact on their positions relative to other economies. Another reason is that these are the economies that historically have made more intense efforts to reform business regulation. The Doing Business website presents comparable data for this year and last, making it possible to assess the extent to which there has been an improve-ment in business regulation in any economy as tracked by the distance to frontier measure. Moreover, because most of the changes in methodology involve adding new indicators rather than revising existing ones, data for more than 90% of the previously exist-ing indicators remain comparable over time. The full series are available on the website. FIGURE 1.1 What Doing Business continues to cover and what it is adding What Doing Business continues to cover ²ƀaŦͳÊÀƖŦÊŬ½ƀƃĊĥʽƀ³ĶŬƃƀĩÀƀŎĊÀĉĊĩƀĥĊĩĊĥƖĥƀ³ŎĊƃĚƀƃĶƀŬƃŦƃƀƀªƖŬĊĩÊŬŬ ²ƀaŦͳÊÀƖŦÊŬ½ƀƃĊĥÊƀĩÀƀ³ĶŬƃƀƃĶƀ³ĶĥŎĚÊƃÊƀĚĚƀâĶŦĥĚĊƃĊÊŬƀƃĶƀªƖĊĚÀƀƀƦŦÊĆĶƖŬÊ ²ƀaŦͳÊÀƖŦÊŬ½ƀƃĊĥÊƀĩÀƀ³ĶŬƃƀƃĶƀöÊƃƀ³ĶĩĩʳƃÊÀƀƃĶƀƃĆÊƀÊĚʳƃŦĊ³ĚƀöŦĊÀ ²ƀaŦͳÊÀƖŦÊŬ½ƀƃĊĥÊƀĩÀƀ³ĶŬƃƀƃĶƀƃŦĩŬâÊŦƀƀŎŦĶŎÊŦƃƭ ²ƀMĶƥªĚÊƀ³ĶĚ̏ƃÊŦĚƀ̏ƦŬƀĩÀƀ³ŦÊÀĊƃƀĊĩâĶŦĥƃĊĶĩƀŬƭŬƃÊĥŬ ²ƀMĊĩĶŦĊƃƭƀŬƏŦÊĆĶĚÀÊŦŬŤƀŦĊöĆƃŬƀĊĩƀŦÊ̏ƃÊÀĉŎŦƃƭƀƃŦĩŬ³ƃĊĶĩŬ ²ƀaƭĥÊĩƃŬ½ƀƃĊĥÊƀĩÀƀƃĶƃĚƀƃƫƀŦƃÊƀâĶŦƀƀæŦĥƀƃĶƀ³ĶĥŎĚƭƀƦĊƃĆƀĚĚƀƃƫƀŦÊöƖ̏ƃĊĶĩŬ ²ƀͳƖĥÊĩƃŬ½ƀƃĊĥÊƀĩÀƀ³ĶŬƃƀƃĶƀÊƫŎĶŦƃƀĩÀƀĊĥŎĶŦƃƀªƭƀŬʏŎĶŦƃ ²ƀaŦͳÊÀƖŦÊŬ½ƀƃĊĥÊƀĩÀƀ³ĶŬƃƀƃĶƀŦÊŬĶĚƥÊƀƀ³ĶĥĥÊŦ³ĊĚƀÀĊŬŎƖƃÊ ²ƀnĊĥʽƀ³ĶŬƃ½ƀĶƖƃ³ĶĥÊƀĩÀƀŦʳĶƥÊŦƭƀŦƃÊƀâĶŦƀƀ³ĶĥĥÊŦ³ĊĚƀĊĩŬĶĚƥÊĩ³ƭ ²ƀMĶŦÊƀâʏƃƖŦÊŬƀĶĩƀƃĆÊƀŬƃŦÊĩöƃĆƀĶâƀĚÊöĚƀŦĊöĆƃŬƀĩÀƀÀÊŎƃĆƀĶâƀ³ŦÊÀĊƃƀĊĩâĶŦĥƃĊĶĩ ²ƀMĶŦÊƀâʏƃƖŦÊŬƀĶĩƀĥĊĩĶŦĊƃƭƀŬƏŦÊĆĶĚÀÊŦŬŤƀŦĊöĆƃŬ ²ƀƀĥʏŬƖŦÊƀĶâƀƃĆÊƀŬƃŦÊĩöƃĆƀĶâƀƃĆÊƀĚÊöĚƀâŦĥÊƦĶŦėƀâĶŦƀĊĩŬĶĚƥÊĩ³ƭ ²ƀĩƀÀÀĊƃĊĶĩĚƀ³ĊƃƭƀĊĩƀƃĆÊƀŀŀƀʳĶĩĶĥĊÊŬƀƦĊƃĆƀƀŎĶŎƖ̏ƃĊĶĩƀĶâƀĥĶŦÊƀƃƏĩƀŀƿƿƀĥĊĚĚĊĶĩ ²ƀŬÊƀĶâƀÀĶĊĩöƀªƖŬĊĩÊŬŬƀŦĩėĊĩöƀªŬÊÀƀĶĩƀƃĆÊƀÀĊŬƃĩ³ÊƀƃĶƀâŦĶĩƃĊÊŦƀŬ³ĶŦÊ ²ƀMʏŬƖŦÊŬƀĶâƀƃĆÊƀśƖĚĊƃƭƀĶâƀªƖĊĚÀĊĩöƀŦÊöƖ̏ƃĊĶĩŬ ²ƀMʏŬƖŦÊŬƀĶâƀƃĆÊƀŦÊĚĊªĊĚĊƃƭƀĶâƀƃĆÊƀÊĚʳƃŦĊ³ĊƃƭƀŬƖŎŎĚƭ ²ƀMʏŬƖŦÊŬƀĶâƀƃĆÊƀśƖĚĊƃƭƀĶâƀƃĆÊƀ̏ĩÀƀÀĥĊĩĊŬƃŦƃĊĶĩƀŬƭŬƃÊĥ ²ƀMʏŬƖŦÊŬƀĶâƀƃĆÊƀŎĶŬƃæĚĊĩöƀŎŦͳÊŬŬƀĊĩƀŎƭĊĩöƀƃƫÊŬ ²ƀMʏŬƖŦÊŬƀĶâƀƃĆÊƀśƖĚĊƃƭƀĶâƀƃĆÊƀĕƖÀĊ³ĊĚƀÀĥĊĩĊŬƃŦƃĊĶĩƀŬƭŬƃÊĥ What this year’s report adds What next year’s report will add
  • 15.
    OVERVIEW 3 WHEREARE REGULATIONS MORE BUSINESS-FRIENDLY? Singapore continues to be the economy with the most business-friendly regu-lations (table 1.1). And while there was some reordering of economies within the top 20 in the ease of doing business ranking, the list remains very similar to last year’s: 17 economies stayed on the list, while 3 entered this year—Estonia, Germany and Switzerland. Economies in the top 20 continued to improve their business regulatory environ-ment in the past year. For example, Switzerland made starting a business easier by introducing online procedures and strengthened minority investor protections by increasing the level of transparency required from listed com-panies. And Sweden made registering property easier through a new online system that became fully operational in the past year. The system provides comprehensive coverage, allowing us-ers to conduct searches and file regis-trations from anywhere in the country. The 20 economies at the top of the ease of doing business ranking perform well not only on the Doing Business indicators but also in other interna-tional data sets capturing dimensions of competitiveness. The economies performing best in the Doing Business rankings therefore are not those with no regulation but those whose govern-ments have managed to create rules that facilitate interactions in the mar-ketplace without needlessly hindering the development of the private sector. Moreover, even outside the top 20 economies there is an association be-tween performance in the ease of doing business ranking and performance on measures of quality of government and governance. For example, in a sample of 78 mostly low- and lower-middle-income economies the distance to frontier score is strongly correlated with the International Development Association (IDA) Resource Allocation Index, which measures the quality of a country’s policies and institutional arrangements.3 The distance to frontier scores under-lying the ease of doing business rank-ings reveal some regional patterns. OECD high-income economies have the highest distance to frontier scores on average, indicating that this regional group has the most business-friendly regulations overall (figure 1.3). But best practices in business regulation can be FIGURE 1.2 Distance to frontier scores remain similar under the new methodology 100 90 80 70 60 50 40 30 30 40 50 60 70 80 90 100 Distance to frontier score under new methodology (0–100) Distance to frontier score under old methodology (0–100) Note: The figure compares distance to frontier scores based on this year’s data computed using the old (Doing Business 2014) methodology with scores based on the same data computed using the new methodology. The differences between the 2 series are in protecting minority investors, resolving insolvency, the depth of credit information index in getting credit and the distance to frontier calculation for the total tax rate in paying taxes. It is not possible to isolate the changes in the strength of legal rights index in getting credit. The 45-degree line shows where the scores under the old and new methodologies are equal. The correlation between the 2 scores is 0.99. For analysis of the effect of the change in ranking calculation, see figure 3.1 in the chapter on what is changing in Doing Business. Source: Doing Business database. FIGURE 1.3 Big gaps between the highest and lowest distance to frontier scores in some regions 100 80 60 40 20 0 51.87 Sub-Saharan Africa 54.56 South Asia 59.23 Middle East North Africa 60.66 Latin America Caribbean 63.19 East Asia Pacific 66.67 Europe Central Asia 76.47 OECD high income 74.81 Worst score Best score Average score 66.70 86.91 48.57 79.46 43.55 88.27 41.41 72.29 33.35 76.81 41.16 61.36 33.16 Distance to frontier score Source: Doing Business database.
  • 16.
    4 DOING BUSINESS2015 TABLE 1.1 Ease of doing business ranking Rank Economy DTF score Rank Economy DTF score Rank Economy DTF score 1 Singapore 88.27 64 Cyprus 66.55 127 Mozambique 56.92 2 New Zealand 86.91 65 Croatia 66.53 128 Lesotho 56.64 3 Hong Kong SAR, China 84.97 66 Oman 66.39 128 Pakistan 56.64 4 Denmark 84.20 67 Samoa 66.17 130 Iran, Islamic Rep. 56.51 5 Korea, Rep. 83.40 68 Albania 66.06 131 Tanzania 56.38 6 Norway 82.40 69 Tonga 65.72 132 Ethiopia 56.31 7 United States 81.98 70 Ghana 65.24 133 Papua New Guinea 55.78 8 United Kingdom 80.96 71 Morocco 65.06 134 Kiribati 55.48 9 Finland 80.83 72 Mongolia 65.02 135 Cambodia 55.33 10 Australia 80.66 73 Guatemala 64.88 136 Kenya 54.98 11 Sweden 80.60 74 Botswana 64.87 137 Yemen, Rep. 54.84 12 Iceland 80.27 75 Kosovo 64.76 138 Gambia, The 54.81 13 Ireland 80.07 76 Vanuatu 64.60 139 Marshall Islands 54.72 14 Germany 79.73 77 Kazakhstan 64.59 140 Sierra Leone 54.58 15 Georgia 79.46 78 Vietnam 64.42 141 Uzbekistan 54.26 16 Canada 79.09 79 Trinidad and Tobago 64.24 142 India 53.97 17 Estonia 78.84 80 Azerbaijan 64.08 143 West Bank and Gaza 53.62 18 Malaysia 78.83 81 Fiji 63.90 144 Gabon 53.43 19 Taiwan, China 78.73 82 Uruguay 63.89 145 Micronesia, Fed. Sts. 53.07 20 Switzerland 77.78 83 Costa Rica 63.67 146 Mali 52.59 21 Austria 77.42 84 Dominican Republic 63.43 147 Côte d’Ivoire 52.26 22 United Arab Emirates 76.81 85 Seychelles 63.16 148 Lao PDR 51.45 23 Latvia 76.73 86 Kuwait 63.11 149 Togo 51.29 24 Lithuania 76.31 87 Solomon Islands 63.08 150 Uganda 51.11 25 Portugal 76.03 88 Namibia 62.81 151 Benin 51.10 26 Thailand 75.27 89 Antigua and Barbuda 62.64 152 Burundi 51.07 27 Netherlands 75.01 90 China 62.58 153 São Tomé and Príncipe 50.75 28 Mauritius 74.81 91 Serbia 62.57 154 Algeria 50.69 29 Japan 74.80 92 Paraguay 62.50 155 Djibouti 50.48 30 Macedonia, FYR 74.11 93 San Marino 62.44 156 Iraq 50.36 31 France 73.88 94 Malta 62.11 157 Bolivia 49.95 32 Poland 73.56 95 Philippines 62.08 158 Cameroon 49.85 33 Spain 73.17 96 Ukraine 61.52 159 Comoros 49.56 34 Colombia 72.29 97 Bahamas, The 61.37 160 Sudan 49.55 35 Peru 72.11 97 Dominica 61.37 161 Senegal 49.37 36 Montenegro 72.02 99 Sri Lanka 61.36 162 Suriname 49.29 37 Slovak Republic 71.83 100 St. Lucia 61.35 163 Madagascar 49.25 38 Bulgaria 71.80 101 Brunei Darussalam 61.26 164 Malawi 49.20 39 Mexico 71.53 102 Kyrgyz Republic 60.74 165 Equatorial Guinea 49.01 40 Israel 71.25 103 St. Vincent and the Grenadines 60.66 166 Tajikistan 48.57 41 Chile 71.24 104 Honduras 60.61 167 Burkina Faso 48.36 42 Belgium 71.11 104 Lebanon 60.61 168 Niger 47.63 43 South Africa 71.08 106 Barbados 60.57 169 Guinea 47.42 44 Czech Republic 70.95 107 Bosnia and Herzegovina 60.55 170 Nigeria 47.33 45 Armenia 70.60 108 Nepal 60.33 171 Zimbabwe 46.95 46 Rwanda 70.47 109 El Salvador 59.93 172 Timor-Leste 46.89 47 Puerto Rico (U.S.) 70.35 110 Swaziland 59.77 173 Bangladesh 46.84 48 Romania 70.22 111 Zambia 59.65 174 Liberia 46.61 49 Saudi Arabia 69.99 112 Egypt, Arab Rep. 59.54 175 Syrian Arab Republic 46.51 50 Qatar 69.96 113 Palau 59.50 176 Mauritania 44.21 51 Slovenia 69.87 114 Indonesia 59.15 177 Myanmar 43.55 52 Panama 69.22 115 Ecuador 58.88 178 Congo, Rep. 43.29 53 Bahrain 69.00 116 Maldives 58.73 179 Guinea-Bissau 43.21 54 Hungary 68.80 117 Jordan 58.40 180 Haiti 42.18 55 Turkey 68.66 118 Belize 58.14 181 Angola 41.85 56 Italy 68.48 119 Nicaragua 58.09 182 Venezuela, RB 41.41 57 Belarus 68.26 120 Brazil 58.01 183 Afghanistan 41 .1 6 58 Jamaica 67.79 121 St. Kitts and Nevis 58.00 184 Congo, Dem. Rep. 40.60 59 Luxembourg 67.60 122 Cabo Verde 57.94 185 Chad 37.25 60 Tunisia 67.35 123 Guyana 57.83 186 South Sudan 35.72 61 Greece 66.70 124 Argentina 57.48 187 Central African Republic 34.47 62 Russian Federation 66.66 125 Bhutan 57.47 188 Libya 33.35 63 Moldova 66.60 126 Grenada 57.35 189 Eritrea 33.16 Note: The rankings are benchmarked to June 2014 and based on the average of each economy’s distance to frontier (DTF) scores for the 10 topics included in this year’s aggregate ranking. For the economies for which the data cover 2 cities, scores are a population-weighted average for the 2 cities. An arrow indicates an improvement in the score between 2013 and 2014 (and therefore an improvement in the overall business environment as measured by Doing Business), while the absence of one indicates either no improvement or a deterioration in the score. The score for both years is based on the new methodology. Source: Doing Business database.
  • 17.
    OVERVIEW 5 foundin almost all regions. In 6 of the 7 regions the highest distance to fron-tier score is above 70. The difference between the best and worst scores in a region can be substantial, however, especially in East Asia and the Pacific, the Middle East and North Africa and Sub-Saharan Africa. WHO IMPROVED THE MOST IN 2013/14? Since 2004 the Doing Business report has captured more than 2,400 regula-tory reforms making it easier to do business. In the year from June 1, 2013, to June 1, 2014, 123 economies imple-mented at least one reform in the areas measured by Doing Business—230 in total. More than 63% of these reforms reduced the complexity and cost of regulatory processes, while the oth-ers strengthened legal institutions. Twenty-one economies, including 6 in Sub-Saharan Africa and 6 in the OECD high-income group, implemented 3 or more reforms reducing burdensome bureaucracy or improving legal and regulatory frameworks.4 Globally, more than 80% of the economies covered by Doing Business had an improvement in their distance to frontier score—it is now easier to do business in most parts of the world. Sub-Saharan Africa, the region with the largest number of economies, accounted for the largest number of regulatory reforms in 2013/14, with 39 reducing the complexity and cost of regulatory processes and 36 strengthening legal institutions. As in previous years, however, Europe and Central Asia had the largest share of economies implementing at least one regulatory reform, with some 85% doing so (figure 1.4). Sub-Saharan Africa had the second largest share of economies implementing at least one reform and the second largest average improvement in distance to frontier scores. Latin America and the Caribbean and South Asia remain the 2 regions with the smallest share of economies implementing regulatory reforms as captured by Doing Business. Among the 21 economies with the most reforms making it easier to do business in 2013/14, 10 stand out as having improved the most in performance on the Doing Business indicators: Tajikistan, Benin, Togo, Côte d’Ivoire, Senegal, Trinidad and Tobago, the Democratic Republic of Congo, Azerbaijan, Ireland and the United Arab Emirates (table 1.2). Together, these 10 top improvers imple-mented 40 regulatory reforms making it easier to do business. Among these 10, only Côte d’Ivoire featured among the 10 top improvers in last year’s report. And only 4 place among the top 100 in the overall ease of doing business ranking; Ireland has the highest ranking, at 13. Being recognized as top improvers does not mean that these economies have ex-emplary business regulations; instead, it shows that thanks to serious efforts in regulatory reform in the past year, they made the biggest advances toward the frontier in regulatory practice (figure 1.5). Many of the 10 top improvers still face many challenges on their way to international best practices in business regulation, including high bureaucratic obstacles, political instability and weak financial institutions. Among the 10 top improvers, Tajikistan made the biggest advance toward the regulatory frontier in the past year, thanks to improvements in several ar-eas. For example, starting a business in Tajikistan is now easier as a result of the implementation of new software at the one-stop shop and the elimina-tion of one of the business registration procedures. A reduction of fees made FIGURE 1.4 Europe and Central Asia had both the largest share of economies making it easier to do business in 2013/14 . . . Share of economies with at least one reform making it easier to do business (%) 100 80 60 40 20 0 85 . . . and the biggest average improvement in distance to frontier scores Average change in distance to frontier score between 2013 and 2014 2.0 1.5 1.0 0.5 0 South Asia Latin America Caribbean Middle East North Africa East Asia Pacific OECD high income Sub-Saharan Africa Europe Central Asia South Asia Latin America Caribbean Middle East North Africa East Asia Pacific OECD high income Sub-Saharan Africa Europe Central Asia 74 65 60 55 50 50 1.56 1.11 0.77 0.74 0.52 0.39 0.31 Source: Doing Business database.
  • 18.
    6 DOING BUSINESS2015 TABLE 1.2 The 10 economies improving the most across 3 or more areas measured by Doing Business in 2013/14 Reforms making it easier to do business Ease of doing business rank Starting a business Dealing with construction permits Getting electricity Registering property Getting credit Protecting minority investors Paying taxes Trading across borders Enforcing contracts Resolving insolvency Tajikistan 166 √ √ √ √ Benin 151 √ √ √ √ Togo 149 √ √ √ √ Côte d’Ivoire 147 √ √ √ √ √ Senegal 161 √ √ √ √ √ √ Trinidad and Tobago 79 √ √ √ Congo, Dem. Rep. 184 √ √ √ √ √ Azerbaijan 80 √ √ √ Ireland 13 √ √ √ United Arab Emirates 22 √ √ √ Note: Economies are selected on the basis of the number of their reforms and ranked on how much their distance to frontier score improved. First, Doing Business selects the economies that implemented reforms making it easier to do business in 3 or more of the 10 topics included in this year’s aggregate distance to frontier score. Regulatory changes making it more difficult to do business are subtracted from the number of those making it easier. Second, Doing Business ranks these economies on the improvement in their distance to frontier score from the previous year. The improvement in their score is calculated not by using the data published in 2013 but by using comparable data that capture data revisions and methodology changes. The choice of the most improved economies is determined by the largest improvements in the distance to frontier score among those with at least 3 reforms. Source: Doing Business database. FIGURE 1.5 How far have economies moved toward the frontier in regulatory practice since 2013? Distance to frontier score 100 75 50 25 0 Singapore New Zealand Hong Kong SAR, China Denmark Korea, Rep. Norway United States United Kingdom Finland Australia Sweden Iceland Ireland Germany Georgia Canada Estonia Malaysia Taiwan, China Switzerland Austria United Arab Emirates Latvia Lithuania Portugal Thailand Netherlands Mauritius Japan Macedonia, FYR France Poland Spain Colombia Peru Montenegro Slovak Republic Bulgaria Mexico Israel Chile Belgium South Africa Czech Republic Armenia Rwanda Puerto Rico (U.S.) Romania Saudi Arabia Qatar Slovenia Panama Bahrain Hungary Turkey Italy Belarus Jamaica Luxembourg Tunisia Greece Russian Federation Moldova Cyprus Croatia Oman Samoa Albania Tonga Ghana Morocco Mongolia Guatemala Botswana Kosovo Vanuatu Kazakhstan Vietnam Trinidad and Tobago Azerbaijan Fiji Uruguay Costa Rica Dominican Republic Seychelles Kuwait Solomon Islands Namibia Antigua and Barbuda China Serbia Paraguay San Marino Regulatory frontier 2014 2013 Note: The distance to frontier score shows how far on average an economy is at a point in time from the best performance achieved by any economy on each Doing Business indicator since 2005 or the third year in which data for the indicator were collected. The measure is normalized to range between 0 and 100, with 100 representing the frontier. The vertical bars show the change in the distance to frontier score from 2013 to 2014; for more details, see the note to table 1.1. The 30 economies improving the most are highlighted in red. Source: Doing Business database.
  • 19.
    OVERVIEW 7 dealingwith construction permits less costly, and the introduction of an electronic system for filing and paying the corporate income tax, value added tax and labor taxes made paying taxes easier. Finally, the Credit Information Bureau of Tajikistan improved access to credit information by starting to provide credit scores in June 2013. Eight of the 10 top improvers carried out reforms making it easier to start a business, while 7 implemented reforms making it easier to get credit. Some of these changes were inspired by transnational initiatives. One such ini-tiative was the revision by the Council of Ministers of the Organization for the Harmonization of Business Law in Africa (OHADA) of the Uniform Act on Commercial Companies and Economic Interest Groups. The revised act authorizes each member state to adopt national legislation reducing its paid-in minimum capital require-ment— the amount of capital that entrepreneurs need to deposit in a bank account or with a notary before or within 3 months of incorporation. Benin, Côte d’Ivoire, Senegal and Togo were all among the OHADA member economies that did so in 2013/14. Côte d’Ivoire and Senegal also took measures within the framework of the West African Economic and Monetary Union. Both adopted the Uniform Law on the Regulation of Credit Information Bureaus ahead of other member states, providing a legal framework to establish credit information bureaus. Reforms making it easier to get credit were also undertaken at the national level. In the United Arab Emirates the credit bureau Emcredit and the Dubai Electricity and Water Authority (DEWA) began exchanging credit information in October 2013. As a result, the credit bureau can now identify customers with unpaid DEWA accounts beyond 90 days and the utility has access to the bureau’s bounced check repository. Ireland im-proved its credit information system by passing a new act that provides for the establishment and operation of a credit registry. And in Trinidad and Tobago a new insolvency law strengthened pro-tections of secured creditors’ rights in insolvency proceedings, giving greater flexibility in enforcement actions. Six of the 10 top improvers reformed their property registration processes and 6 strengthened the rights of mi-nority shareholders, with Côte d’Ivoire, Senegal, Togo and the United Arab South Sudan Central African Republic Libya Eritrea Malta Philippines Ukraine Bahamas, The Sri Lanka St. Lucia Brunei Darussalam Kyrgyz Republic St. Vincent and the Grenadines Honduras Lebanon Barbados Bosnia and Herzegovina Nepal El Salvador Swaziland Zambia Egypt, Arab Rep. Palau Indonesia Ecuador Maldives Jordan Belize Nicaragua Brazil St. Kitts and Nevis Cabo Verde Guyana Argentina Bhutan Grenada Mozambique Pakistan Lesotho Iran, Islamic Rep. Tanzania Ethiopia Papua New Guinea Kiribati Cambodia Kenya Yemen, Rep. Gambia, The Marshall Islands Sierra Leone Uzbekistan India West Bank and Gaza Gabon Micronesia, Fed. Sts. Mali Côte d’Ivoire Lao PDR Togo Uganda Benin Burundi São Tomé and Príncipe Algeria Djibouti Iraq Bolivia Cameroon Comoros Sudan Senegal Suriname Madagascar Malawi Equatorial Guinea Tajikistan Burkina Faso Niger Guinea Nigeria Zimbabwe Timor-Leste Bangladesh Liberia Syrian Arab Republic Mauritania Myanmar Congo, Rep. Guinea-Bissau Haiti Angola Venezuela, RB Afghanistan Congo, Dem. Rep. Chad Dominica .
  • 20.
    8 DOING BUSINESS2015 Emirates reforming in both these areas. These 4 economies strengthened mi-nority investor protections by making it possible for shareholders to inspect documents pertaining to related-party transactions as well as to appoint audi-tors to conduct inspections. Moreover, the United Arab Emirates introduced additional approval requirements for related-party transactions, greater requirements for disclosure of such transactions to the stock exchange and a requirement that interested directors be held liable if a related-party transac-tion is unfair or constitutes a conflict of interest. The United Arab Emirates also made it possible for shareholders to request the rescission of unfair related-party transactions. Highlights of reforms making it easier to register property include Azerbaijan’s introduction of an online procedure for obtaining nonencumbrance certificates for property transfers. Senegal made property transfers easier by eliminating the requirement for authorization by the tax authority. Now applicants for a property transfer need only notify the tax authority before proceeding with the property transaction at the land registry. Two of the 10 top improvers imple-mented reforms making it easier to trade across borders. Benin reduced the number of documents needed for customs clearance of imports. The technical standard or health certifi-cate is now no longer required except for food imports. Côte d’Ivoire simpli-fied the process for producing the inspection report for imported cargo and lowered port and terminal han-dling charges at the port of Abidjan by introducing new customs and port management. Among the areas with the fewest reforms by the 10 top improvers are enforcing contracts, with 2, and re-solving insolvency, with 1. Benin made enforcing contracts easier by creating a commercial section within its court of first instance. Trinidad and Tobago made resolving insolvency easier by introducing a statutory mechanism for rehabilitation of insolvent compa-nies as an alternative to previously available voluntary and court-ordered winding-up proceedings. (For more de-tail on the reform patterns in the past year, see the chapter on reforming the business environment.) WHAT DO THE NEW DATA SHOW ABOUT DIFFERENCES BETWEEN CITIES? Subnational Doing Business reports have covered more than 300 cities in 55 economies in the nearly 10 years that they have been published. For the first time this year, the global Doing Business report also extends its cover-age beyond the largest business city in each economy. For the 11 economies with a population of more than 100 million, Doing Business now covers the second largest business city as well as the largest one. The data provide new insights into the variability of business regulation within economies. The sets of indicators showing limited variability across cities in the same economy tend to be those measuring the strength of legal institutions— getting credit, protecting minority investors, enforcing contracts and resolving insolvency, which mainly draw from national laws with general applicability (figure 1.6). Variability is more common for the sets of indicators measuring the complexity and cost of regulatory processes—starting a business, dealing with construction permits, getting electricity, registering property, paying taxes and trading across borders. But this variability is more likely to be in time and cost than in the number of procedures, suggesting that in most cases the law is the same across cities though its implementation may vary. In all 11 economies the data for getting credit—both on the strength of legal rights and on the depth of credit information—are the same for the 2 cities covered. This is easy to explain. Credit information systems tend to operate at the national level, not at the city or state level. Collateral laws also tend to be national, and even in the United States, where these laws are under state jurisdiction, there is enough legal harmonization so that the 2 cities in the sample have the same score on the strength of legal rights index. In the area of protecting minority investors all 11 economies again show no difference between the 2 cities in the aggregate score. In the United States, however, there are differences in some of the data embedded in the indicators for Los Angeles and New York City—because company law is under state jurisdiction and there are measurable differences between the California and New York company law. In the area of resolving insolvency only 4 of the 11 economies have a difference between the 2 cities in the recovery rate and none have a difference in the strength of insolvency framework index. The pattern is different in the area of enforcing contracts. Only 4 of the 11 economies have a difference in the number of procedures to resolve a commercial dispute. In all 4 of these economies one of the pair of cities has a specialized commercial court (Rio de Janeiro, Monterrey, Lagos and New York City) while the other does not (São Paulo, Mexico City, Kano and Los Angeles). But the time and cost to resolve a commercial dispute dif-fer between the 2 cities in 7 of the 11 economies and the differences in time can be significant. In Nigeria, for ex-ample, resolving a commercial dispute takes 720 days in Kano but 447 days in Lagos. There is also more variation at the city level in the other indicators. For
  • 21.
    OVERVIEW 9 example,only 4 economies have the same tax system in both the 2 major business cities—Bangladesh, India, Indonesia and Nigeria. In all the other large economies the total tax rate differs between the 2 cities. In the area of starting a business the paid-in minimum capital requirement is the same in the 2 cities in all 11 economies, and the number of procedures differs in only 4 economies. But the time and cost to start a business differ between the 2 cities in 8 economies. Only in Bangladesh and Pakistan is the pro-cess the same in the 2 cities. Similarly, the procedures to transfer a property between 2 firms differ in only 4 econo-mies but the cost to do so differs in 9 economies. Only in Japan and Russia is the process the same in the 2 cities. In dealing with construction permits and getting electricity 10 economies show some degree of difference between the 2 cities, and in trading across borders all 11 economies do so. These are the areas of regulation mea-sured by Doing Business where location matters the most. Building permits are commonly issued by municipalities. Similarly, electricity connections are often provided by local utilities. And the distance to the nearest port is an important factor in determining the time and cost to export and import, leading to differences even within the same economy. Labor market regulation can also vary across cities within an economy. In 6 of the 11 economies—Brazil, China, India, Indonesia, Japan and Russia—the 2 cities in the sample have different minimum wage levels. This is mainly to account for differences in the cost of living. In all these cases except Brazil and India, the largest business city has a higher minimum wage than the second largest one. In addition, in India the largest business city (Mumbai) has longer paid annual leave, with 21 days, than the second largest one (Delhi), with 15. Does city size matter for having business-friendly regulations? At first glance the data suggest that it does not. In 6 of the 11 economies the larg-est business city performs better on the Doing Business indicators overall than the second largest one, while in the other 5 the second largest busi-ness city has the higher score. And in the economies where the second larg-est business city has a substantially smaller population (at most 30% of the largest business city’s population), the second city has more business-friendly regulations overall. This is the case for Kano, Monterrey and Surabaya. Among the 11 economies, the United States has the highest number of differences between the largest and second largest business cities: Los Angeles and New York City differ in 9 of the 10 topics (while the 2 cities have the same overall score on the strength of minority investor protec-tions, they have differences in the underlying indicators). Japan has the fewest: Osaka and Tokyo differ in only 4 topics—starting a business, getting electricity, paying taxes and trading across borders. Overall, the differ-ences between cities within the same economy are very small, as shown in figure 3.2 in the chapter on what is changing in Doing Business. WHAT IS THE RELATIONSHIP BETWEEN EFFICIENCY AND QUALITY? One of the big innovations in this year’s report is the expansion of the data on the quality of regulation. Measuring aspects of the quality of regulation is not new for Doing Business; some indi-cator sets, such as getting credit and protecting minority investors, already included a focus on regulatory quality. But starting this year a systematic ef-fort is being made to include measures of quality in most of the indicator sets. This year’s report introduces a new measure of quality in the resolving insolvency indicator set and expands the measures of quality in the getting FIGURE 1.6 Indicators measuring the strength of legal institutions show less difference between cities within economies than those measuring the complexity and cost of regulatory processes Starting a business Dealing with construction permits Getting electricity Registering property Getting credit Protecting minority investors Paying taxes Trading across borders Enforcing contracts Resolving insolvency 9 10 10 9 7 8 4 11 0 1 2 3 4 5 6 7 8 9 10 11 Distance to frontier score differs between largest and second largest business cities Average difference in distance to frontier score (absolute value) 2.99 6.96 7.53 4.84 0.00 0.00 0.34 4.18 3.06 0.55 Distance to frontier score is the same for largest and second largest business cities Note: The figure shows data for the 11 large economies for which Doing Business covers both the largest and the second largest business city. Source: Doing Business database.
  • 22.
    10 DOING BUSINESS2015 credit and protecting minority inves-tors indicator sets. Next year’s report will add measures of regulatory quality to the indicator sets for dealing with construction permits, getting electric-ity, registering property, paying taxes and enforcing contracts. The results so far suggest that effi-ciency and quality go hand in hand. For resolving insolvency the data show that there is a positive correlation between the recovery rate for creditors and the strength of the legal framework for insolvency (figure 1.7). The recovery rate measures the cents on the dollar recouped by secured creditors through insolvency proceedings and is a measure of efficiency because time and cost are 2 important components. The strength of insolvency framework index measures how well insolvency laws accord with in-ternationally recognized good practices and is therefore a proxy for quality. Very few economies have an insolvency system with both high efficiency (a recovery rate of more than 50 cents on the dollar) and low quality (a score on the strength of insolvency framework index of less than 8 of the possible 16 points). But many economies have an insolvency system with low efficiency and high quality. These are economies that have well-designed laws but face challenges in implementing them effectively. These results suggest that well-designed laws are necessary but not sufficient to achieve efficiency in an in-solvency system. The Federated States of Micronesia, for example, has a score of 11.5 on the strength of insolvency framework index, yet creditors in that country should expect to recover only 3.3 cents for every dollar they have loaned to a firm that becomes insol-vent. So an insolvency law of above-average quality does not necessarily mean above-average recovery rates for creditors. On average, though, econo-mies with better-designed laws tend to have higher recovery rates. FIGURE 1.7 Better insolvency laws, higher recovery rate High quality, low efficiency Preliminary data for a new indicator being developed to measure regula-tory quality in registering property reinforce the idea that efficiency and quality go hand in hand: economies that offer a simple, fast and inexpen-sive process for transferring property are also likely to have a land adminis-tration system providing reliable land records (figure 1.8). The new indicator under development measures the reliability, transpar-ency and geographic coverage of land administration systems as well as ele-ments of land dispute resolution. The indicator focuses on such aspects as whether the land registry and mapping system (cadastre) have adequate infra-structure to guarantee high standards of quality for the information recorded, whether information is easily acces-sible to the public and whether the land registry and cadastre cover the entire territory of the economy. Preliminary data show that virtually all economies that score well on the overall quality of land administration (with a distance to frontier score above 50 for the indicator) also score well on efficiency in transferring property (with an aver-age distance to frontier score above 50 for the procedures, time and cost). But many economies have a property transfer process that is efficient yet lacks quality. Thus while these econo-mies make the transfer of property simple, fast and inexpensive, the lack of quality in the land administration system is likely to undermine the value of the property title. In the Republic of Yemen, for example, a transfer of property between 2 firms takes 6 procedures and only 19 days and costs 1.8% of the property value. But the land administration system keeps most of the land records on paper and does not assign a unique, searchable number to land parcels, making it difficult to provide reliable information. Efforts are ongoing for other Doing Business topics as well. Preliminary data for a new measure of judicial quality and court infrastructure show a clear posi-tive link between efficiency and qual-ity in the area of enforcing contracts. Micronesia, Fed. Sts. Canada Cyprus 0 10 20 30 40 50 60 70 80 90 100 16 14 12 10 8 6 4 2 0 Venezuela, RB Low quality, low efficiency High quality, high efficiency Low quality, high efficiency Strength of insolvency framework index (0–16) Recovery rate (cents on the dollar) Note: The correlation between the strength of insolvency framework index and the recovery rate is 0.59. The relationship is significant at the 1% level after controlling for income per capita. Source: Doing Business database.
  • 23.
    OVERVIEW 11 Economiesthat make resolving a com-mercial dispute simpler, faster and less expensive also tend to have a judicial system that follows well-established good practices—such as having a spe-cialized commercial court or division, having a small claims court, offering arbitration and voluntary mediation and making judgments in commercial cases available to the general public. Unlike for resolving insolvency and registering property, however, for enforcing contracts the economies are more evenly spread across the 4 quadrants of quality and efficiency (figure 1.9). Singapore is among those that combine high efficiency and high quality. In that country resolving the standard commercial dispute in the Doing Business case study takes only 21 procedures and 150 days and costs 25.8% of the value of the claim. And not surprisingly, the judicial system follows several internationally recognized good practices, such as having a separate commercial court, providing arbitra-tion, making judgments available to the public, using case management and allowing plaintiffs to file their initial complaint electronically. On the other hand, the judicial system in Mongolia, with no specialized commercial court or small claims court, can resolve the standard commercial dispute through 32 procedures in 374 days and at a cost of 30.6% of the claim value. WHAT ARE THE BENEFITS OF MORE BUSINESS-FRIENDLY REGULATIONS? As earlier Doing Business reports have discussed, the benefits of business-friendly regulations are well established in the economic literature. To name just a few: ƒ Reforms simplifying business regis-tration lead to more firm creation.5 ƒ Increasing trade openness has greater effects on growth where labor markets are more flexible.6 FIGURE 1.8 Better land administration system, faster property transfers Distance to frontier score for overall quality of land administration 100 90 80 70 60 50 40 30 20 10 0 0 10 20 30 40 50 60 70 80 90 100 Distance to frontier score for registering property High quality, low efficiency Low quality, low efficiency Low quality, high efficiency Belgium Sweden Yemen, Rep. Afghanistan High quality, high efficiency Note: The figure compares the distance to frontier score for the existing registering property indicators with the distance to frontier score for the new indicator on the quality of land administration (to be published for the first time in Doing Business 2016). The data for the new indicator are obtained through a set of questions on reliability, transparency, coverage and dispute resolution. For example, an economy receives 1 point if it has a functional electronic database for encumbrances, 1 point if it makes the documents and fee schedules for property registration publicly available (online or on public boards), 1 point if it compiles statistics on land transactions and makes them publicly available, and so on. The correlation between the 2 distance to frontier scores is 0.56. The relationship is significant at the 1% level after controlling for income per capita. Source: Doing Business database. FIGURE 1.9 Better courts, faster courts Distance to frontier score for judicial quality index Singapore Belize Mongolia Angola 0 10 20 30 40 50 60 70 80 90 100 100 90 80 70 60 50 40 30 20 10 0 Distance to frontier score for enforcing contracts High quality, low efficiency Low quality, low efficiency High quality, high efficiency Low quality, high efficiency Note: The figure compares the distance to frontier score for the existing enforcing contracts indicators with the distance to frontier score for the new index on judicial quality (to be published for the first time in Doing Business 2016). The index measures such aspects as whether the judicial system has a specialized commercial court or division, has a small claims court, offers voluntary mediation and arbitration and makes judgments in commercial cases available to the general public. The correlation between the 2 distance to frontier scores is 0.41. The relationship is significant at the 1% level after controlling for income per capita. Source: Doing Business database.
  • 24.
    12 DOING BUSINESS2015 ƒ Cumbersome, poorly functioning business regulation undermines entrepreneurship and economic performance.7 ƒ Introducing collateral registries and debt recovery tribunals leads to better-performing credit markets.8 ƒ Reforms improving access to credit and the efficiency of property regis-tration are correlated with product and process innovation by young firms.9 In addition, with the time series of Doing Business data now available, it is possible to study how changes in regulations within an economy over time lead to changes in development outcomes in that economy. One study shows, for example, that an improvement of 10 points in the overall distance to frontier score is linked to an increase in new firm density (the number of new firms created in a year per 1,000 adults) of around 0.5 (figure 1.10). And while small changes in the overall distance to frontier score may have a negligible link with growth, moving from the lowest quartile of improvement in business regulations to the highest quartile is associated with a significant increase in the an-nual per capita growth rate of around 0.8 percentage points.10 These results apply for different types of indicators but their intensity varies. For example, an increase of 10 points in the average distance to frontier score for the indicators measuring the com-plexity and cost of regulatory processes is associated with an increase in new firm density of about 0.2. The equiva-lent result for the indicators measuring the strength of legal institutions that support business regulation, such as commercial courts and credit bureaus, is 0.4. These results suggest that com-bining good regulations across different areas is important for business entry and that piecemeal regulatory reforms may be less effective than a broad re-form program. FIGURE 1.10 Combined regulatory reforms are likely to have greater effects on new business registration than isolated ones 0 0.1 0.2 0.3 0.4 0.5 Distance to frontier score for indicators measuring the complexity and cost of regulatory processes Distance to frontier score for indicators measuring the strength of legal institutions These results encourage further research to better understand the mechanisms behind the link between business regula-tions and firm creation and potentially economic growth. Firm-level data can provide some insights into these mecha-nisms. The analysis combined data from World Bank Enterprise Surveys for more than 40,000 observations (across firms and years) with Doing Business data to test how business regulations affect the performance of firms of different size classes. The analysis used distance to frontier scores to measure business regulations in the areas covered by Doing Business and growth in sales and em-ployment to measure firm performance. The results show that improvements in the distance to frontier score have greater effects on sales and employ-ment growth for small firms than for large ones.11 These results indicate that sound busi-ness regulations in the areas measured by Doing Business benefit small firms more than large ones. This is in line with earlier research findings. One study found that a heavy regulatory burden— measured by the share of management time spent dealing with regulations or inspections—can stunt the growth of small firms.12 Another found that in general there is a significant relation-ship between entrepreneurial activity and indicators of the quality of the legal and regulatory environment and gover-nance. 13 The finding that good business regulations in areas such as those mea-sured by Doing Business benefit small firms more than large ones is an impor-tant one—since small firms account for the largest shares of job creation and the highest growth in sales and employment in developing economies.14 HOW HAVE BUSINESS REGULATIONS CHANGED OVER THE PAST DECADE? Among the more encouraging trends shown by Doing Business data over the past decade is the gradual improve-ment in economies’ performance in the areas tracked by the indicators. Moreover, economies with the weak-est regulatory institutions and the most complex and costly regulatory processes tend to focus on the areas where their regulatory performance is worse, slowly but steadily beginning to adopt some of the better practices seen among the best performers. Overall distance to frontier score Increase in new firm density associated with 10-point increase in distance to frontier score Note: New firm density is defined as the number of newly registered limited liability companies per 1,000 working-age people (ages 15–64). Indicators measuring the strength of legal institutions are those on getting credit, protecting minority investors, enforcing contracts and resolving insolvency. Indicators measuring the complexity and cost of regulatory processes are those on starting a business, dealing with construction permits, getting electricity, registering property, paying taxes and trading across borders. The analysis uses data from 2003–13 for all economies covered by Doing Business. Source: Divanbeigi and Ramalho 2014.
  • 25.
    OVERVIEW 13 FIGURE1.11 Strong convergence across economies since 2005 Averages by group 800 600 400 200 250 200 150 100 50 70 60 50 40 30 20 10 Best 3 quartiles Worst quartile Best 3 quartiles Worst quartile Best 3 quartiles Cost to start a business (% of income per capita) 300 250 200 150 100 50 0 2005 2006 2007 2008 2009 2010 2011 2012 2013 2014 140 120 100 80 60 40 20 400 350 300 250 200 150 100 50 60 50 40 30 20 10 Worst quartile Best 3 quartiles Cost to register property (% of property value) 18 16 14 12 10 8 6 4 2 0 2005 2006 2007 2008 2009 2010 2011 2012 2013 2014 Time to import (days) 0 2005 2006 2007 2008 2009 2010 2011 2012 2013 2014 Time to export (days) 0 2005 2006 2007 2008 2009 2010 2011 2012 2013 2014 Time to register property (days) 0 2005 2006 2007 2008 2009 2010 2011 2012 2013 2014 Time to deal with construction permits (days) 0 2005 2006 2007 2008 2009 2010 2011 2012 2013 2014 Time to pay taxes (hours per year) 0 2005 2006 2007 2008 2009 2010 2011 2012 2013 2014 Time to start a business (days) 0 2005 2006 2007 2008 2009 2010 2011 2012 2013 2014 Worst quartile Worst quartile Best 3 quartiles Best 3 quartiles Worst quartile Worst quartile Best 3 quartiles Worst quartile Best 3 quartiles Note: Economies are ranked in quartiles by performance in 2005 on the indicator shown. The data refer to the 174 economies included in Doing Business 2006 (2005). Fifteen economies were added in subsequent years. Source: Doing Business database.
  • 26.
    14 DOING BUSINESS2015 This process is leading to a conver-gence toward best practices. Here is an example: In 2005 the time to transfer property averaged 235 days among the economies ranking in the worst quartile on this indicator. Among the best 3 quartiles it averaged 42 days. Today that gap is substantially narrower. While the difference is still substantial at 62 days, it is considerably smaller than the 193 days in 2005 (figure 1.11). Similar trends can be seen in other in-dicators measuring the complexity and cost of regulatory processes. WHAT IS IN THIS YEAR’S REPORT? This year’s report presents several case studies focusing on legal and regulatory features covered by new or expanded indicators being introduced this year or next year. One case study, on protect-ing minority investors, discusses the importance of corporate governance rules that are now being measured. Another discusses the importance of a strong legal framework for insolvency, also among the features being mea-sured by new indicators—while a third examines the new components of the getting credit indicators. A fourth case study analyzes good practices in land administration systems that will be measured in Doing Business 2016. These case studies provide new insights from the newly collected data. The case study on resolving insolvency shows, for example, that OECD high-income economies have the highest average score on the strength of insolvency framework index. And economies that have reformed their insolvency laws in the past several years score sub-stantially higher on this index than economies with outdated insolvency provisions. This is important, because economies with better insolvency laws as measured by Doing Business tend to have more credit available to the private sector. Other case studies in this year’s report focus on good practices in the areas of business regulation covered. A case study on starting a business analyzes good practices in operating a company registry and the benefits of those prac-tices. This case study discusses how company registries empower businesses to operate in the formal economy, al-lowing them to reap the benefits that come with formalization, and how online platforms for company incorporation make the process faster and cheaper. A case study on zoning regulations looks at good practices that can increase ef-ficiency in construction permitting. Another case study analyzes the time series of data on paying taxes with an emphasis on patterns before, during and after the global financial crisis. This case study shows that over the 9-year period ending in 2012, the global aver-age total tax rate as measured by Doing Business fell by 9.1 percentage points, with the fastest rate of decline occur-ring in the years immediately following the crisis. The reduction was accompa-nied by a tangible improvement in the quality of tax administration in many economies thanks to their adoption of the latest technologies to facilitate online filing and payment. The report also presents a case study on enforcing contracts that analyzes new data on freedom of contract. These new data will not be included in the enforcing contracts indicators; they were collected solely for research, with the aim of better understanding the link between contract enforcement and freedom of contract. Finally, this year’s report presents a summary of some of the research pre-sented at the Doing Business research conference that took place in February 2014. This research used Doing Business data or studied areas relevant to the Doing Business indicators. Doing Business will continue to monitor prog-ress in business regulation in economies around the world with the aim of keep-ing governments informed about good practices and enabling researchers to further our knowledge of how laws and regulations affect development. NOTES 1. For information on the Independent Panel on Doing Business, see its website at http:// www.dbrpanel.org/. 2. The distance to frontier score shows how far on average an economy is at a point in time from the best performance achieved by any economy on each Doing Business indicator since 2005 or the third year in which data for the indicator were collected. The measure is normalized to range between 0 and 100, with 100 representing the frontier. 3. The correlation between the distance to frontier score and the IDA Resource Allocation Index is 0.73. The relationship is significant at the 1% level after controlling for income per capita. 4. Regulatory changes making it more difficult to do business are subtracted from the number of those making it easier. 5. Branstetter and others 2013; Bruhn 2011; Kaplan, Piedra and Seira 2011; Monteiro and Assunção 2012. 6. Chang, Kaltani and Loayza 2009. 7. Dreher and Gassebner 2013. 8. Love, Martínez Pería and Singh 2013. 9. Dutz 2014. 10. Divanbeigi and Ramalho 2014. 11. These results take into account differences in performance due to country-level time-invariant characteristics and firms’ sector, age and export status. The regression method used counts every firm equally even if the number of firms varies across countries. 12. Aterido, Hallward-Driemeier and Pages 2009. 13. Klapper and others 2010. 14. Ayyagari, Demirguc-Kunt and Maksimovic 2014.
  • 27.
    Doing Business 2015 Going Beyond Efficiency About Doing Business Economic activity requires sensible rules that encourage firm start-up and growth and avoid creating distortions in the marketplace. Doing Business measures the rules and regula-tions that can help the private sector thrive—because without a dynamic private sector, no economy can provide a good, and sustainable, standard of liv-ing for people. Doing Business promotes rules that establish and clarify property rights, minimize the cost of resolving disputes, increase the predictability of economic interactions and provide con-tractual partners with core protections against abuse. The Doing Business data highlight the important role of the government and government policies in the day-to-day life of domestic small and medium-size firms. The objective is to encourage regulations that are designed to be ef-ficient, accessible to all who use them and simple in their implementation. Where regulation is burdensome and competition limited, success tends to depend on whom one knows. But where regulation is efficient, trans-parent and implemented in a simple way, it becomes easier for aspiring entrepreneurs to compete on an equal footing and to innovate and expand. In this sense Doing Business values good rules as a key to social inclusion. Enabling growth—and ensuring that all people, regardless of income level, can participate in its benefits—requires an environment where new entrants with drive and good ideas can get started in business and where good firms can invest and grow, thereby creating more jobs. Doing Business was designed with 2 main types of users in mind: policy makers and researchers.1 Doing Business is a tool that governments can use to design sound policies for the creation of firms and jobs. But this tool should not be used in isolation. Doing Business provides a rich opportunity for bench-marking by capturing key dimensions of regulatory regimes. Nevertheless, the Doing Business data are limited in scope and should be complemented with other sources of information. Doing Business is also an important source of information for researchers. It provides a unique data set that enables analysis aimed at better understanding the role of business regulation in eco-nomic development. This year’s report discusses the results of some of this work in the chapter on highlights from the Doing Business research confer-ence. Doing Business 2014 presented a detailed summary of recent research on the effects of business regulation in the areas measured by Doing Business. WHAT DOES DOING BUSINESS MEASURE? Doing Business captures several im-portant dimensions of the regulatory environment as it applies to local firms. It provides quantitative measures of regulations for starting a business, dealing with construction permits, ƒ Doing Business measures business regulations that affect domestic small and medium-size firms in 11 areas across 189 economies. Ten of these areas—starting a business, dealing with construction permits, getting electricity, registering property, getting credit, protecting minority investors, paying taxes, trading across borders, enforcing contracts and resolving insolvency—are included in the distance to frontier score and ease of doing business ranking. Doing Business also measures labor market regulation, which is not included in these 2 measures. ƒ Doing Business does not capture other aspects of the business environment, such as security, market size, macroeconomic stability and the prevalence of bribery and corruption. ƒ The Doing Business methodology is based on standardized case scenarios in the largest business city of each economy. In addition, for 11 economies a second city has been added this year. ƒ Doing Business relies on 4 main sources of information: the relevant laws and regulations, Doing Business respondents, the governments of the economies covered and the World Bank Group regional staff. ƒ Governments use Doing Business as a source of objective data providing unique insights into good practices worldwide. Many Doing Business indicators are “actionable”—though depending on the context, they may not always be “action-worthy.”
  • 28.
    16 DOING BUSINESS2015 getting electricity, registering prop-erty, getting credit, protecting minority investors, paying taxes, trading across borders, enforcing contracts and re-solving insolvency. Doing Business also measures labor market regulation. This year’s report does not present rankings of economies on the labor market regu-lation indicators or include the topic in the aggregate distance to frontier score or ranking on the ease of doing business. It does present the data for these indicators. Doing Business provides 2 main types of indicators: those that broadly measure the complexity and cost of regulatory processes and those that measure the strength of legal institutions (table 2.1). Indicators of the first type promote ef-ficiency in transactions handled by the government, such as in the process to register a transfer of property. A simpler and less costly process results in better performance on the indicators and, if all else is constant, a more favorable ranking on the ease of doing business. These indicators are being expanded to also include components on the quality of regulation. Indicators of the second type reflect better institutions for private sector development, such as well-functioning courts and credit information systems. Accordingly, some of these indicators give a higher score for better and more developed regulation, as the protecting minority investors indicators do for stricter disclosure requirements for related-party transactions. Three sets of these indicators—getting credit, pro-tecting minority investors and resolving insolvency—have been expanded for this year’s report to further focus on the strength of legal institutions (for details on the expansion of the scope of indicator sets, see the chapter on what is changing in Doing Business). How the indicators are selected The choice of the 11 sets of Doing Business indicators has been guided by economic research and firm-level data, particularly data from the World Bank Enterprise Surveys.2 These surveys provide data highlighting the main obstacles to business activity as reported by entrepreneurs in more than 120 economies. For example, among the factors that the surveys have identified as important to businesses have been access to finance and access to elec-tricity— inspiring the design of the Doing Business indicators on getting credit and getting electricity. The design of the Doing Business indica-tors has also been informed by theo-retical insights gleaned from extensive research and the literature on the role of institutions in enabling economic de-velopment. In addition, the background papers developing the methodology for each of the Doing Business indicator sets have established the importance of the rules and regulations that Doing Business measures for such economic outcomes as trade volumes, foreign di-rect investment, market capitalization in stock exchanges and private credit as a percentage of GDP.3 Two aggregate measures Doing Business presents data both for individual indicators and for 2 aggregate measures—the distance to frontier score and the ease of doing business ranking—to provide different perspectives on the data. The distance to frontier score aids in assessing the absolute level of regulatory performance and how it improves over time. This measure shows the distance of each economy to the “frontier,” which represents the best performance observed on each of the indicators across all economies in the Doing Business sample since 2005 or the third year in which data for the indicator were collected. This allows users both to see the gap between a particular economy’s performance and the best performance at any point in time and to assess the absolute change in the economy’s regulatory environment over time as measured by Doing Business. This year, for the first time, the ease of doing business ranking is based on the distance to frontier score. The ranking complements the distance to frontier score by providing information about an economy’s performance in business TABLE 2.1 What Doing Business measures—11 areas of business regulation Complexity and cost of regulatory processes Starting a business Procedures, time, cost and paid-in minimum capital to start a limited liability company Dealing with construction permits Procedures, time and cost to complete all formalities to build a warehouse Getting electricity Procedures, time and cost to get connected to the electrical grid Registering property Procedures, time and cost to transfer a property Paying taxes Payments, time and total tax rate for a firm to comply with all tax regulations Trading across borders Documents, time and cost to export and import by seaport Strength of legal institutions Getting credit Movable collateral laws and credit information systems Protecting minority investors Minority shareholders’ rights in related-party transactions and in corporate governance Enforcing contracts Procedures, time and cost to resolve a commercial dispute Resolving insolvency Time, cost, outcome and recovery rate for a commercial insolvency and the strength of the insolvency legal framework Labor market regulation Flexibility in employment regulation, benefits for workers and labor dispute resolution
  • 29.
    ABOUT DOING BUSINESS17 FIGURE 2.1 An economy’s regulatory environment may be more business-friendly in some areas than in others Austria Latvia Portugal Japan France Spain Peru Mexico Chile Armenia Slovenia Bahrain Turkey Belarus 100 90 80 70 60 50 40 30 20 10 regulation relative to the performance of other economies as measured by Doing Business. For each topic covered and for all topics, Doing Business uses a simple averaging approach for weighting component indi-cators, calculating rankings and deter-mining the distance to frontier score.4 To test the robustness of this approach, other approaches were explored, includ-ing using principal components and unobserved components.5 These turn out to yield results nearly identical to those of simple averaging. In the ab-sence of a strong theoretical framework that assigns different weights to the topics covered for the 189 economies, the simplest method is used: weighting all topics equally and, within each topic, giving equal weight to each of the topic components.6 Each topic covered by Doing Business relates to a different aspect of the regulatory environment. The distance to frontier scores and rankings of each economy vary, often substantially, across topics, indicating that strong performance by an economy in one Greece Moldova Croatia Samoa Tonga Morocco Guatemala Kazakhstan Fiji Antigua and Barbuda San Marino Philippines Bahamas, The Bosnia and Herzegovina area of regulation can coexist with weak performance in another. A quick way to assess the variability of an economy’s regulatory performance is to look at its distance to frontier scores across topics (see the country tables). Croatia, for ex-ample, has an overall distance to frontier score of 66.53. Its distance to frontier score is 85.43 for starting a business, 82.92 for paying taxes and 80.05 for getting electricity. At the same time, it has a score of 44.97 for dealing with construction permits, 55.00 for getting credit and 53.92 for resolving insolvency (figure 2.1). WHAT DOES DOING BUSINESS NOT MEASURE? Doing Business does not cover many important policy areas, and even within the areas it covers its scope is narrow (table 2.2). Doing Business does not measure the full range of factors, policies and institutions that affect the quality of an economy’s business en-vironment or its national competitive-ness. It does not, for example, capture aspects of security, the prevalence of Cambodia Yemen, Rep. Côte d’Ivoire São Tomé and Príncipe Burkina Faso Zimbabwe Bangladesh Myanmar Angola Chad Eritrea bribery and corruption, market size, macroeconomic stability, the state of the financial system or the level of training and skills of the labor force. Even within the relatively small set of indicators included in Doing Business, the focus is deliberately narrow. The trading across borders indicators, for example, capture the documents, time and cost required for the logistical process of exporting and importing Hong Kong SAR, China United States Singapore Korea, Rep. Finland Sweden Ireland Georgia Estonia Taiwan, China Netherlands Slovak Republic South Africa Puerto Rico (U.S.) Saudi Arabia Luxembourg Kosovo Trinidad and Tobago Costa Rica Seychelles Solomon Islands Serbia Sri Lanka Brunei Darussalam St. Vincent and the Grenadines Honduras El Salvador Zambia Palau Ecuador Jordan Nicaragua St. Kitts and Nevis Mozambique Guyana Bhutan Lesotho Tanzania Papua New Guinea Marshall Islands Uzbekistan West Bank and Gaza Micronesia, Fed. Sts. Togo Benin Djibouti Bolivia Comoros Senegal Madagascar Equatorial Guinea Guinea Syrian Arab Republic Guinea-Bissau Afghanistan Central African Republic Distance to frontier score 0 Average of highest 3 topic scores Average of all topic scores Average of lowest 3 topic scores Note: The distance to frontier scores reflected are those for the 10 Doing Business topics included in this year’s aggregate distance to frontier score. Figure is illustrative only; it does not include all 189 economies covered by this year’s report. See the country tables for the distance to frontier score for each Doing Business topic for all economies. Source: Doing Business database. TABLE 2.2 What Doing Business does not cover Examples of areas not covered Security Prevalence of bribery and corruption Market size Macroeconomic stability State of the financial system Level of training and skills of the labor force Examples of aspects not included within the areas covered In getting electricity, the reliability of electricity supply In getting credit, the availability of credit for firms In trading across borders, export or import tariffs and subsidies
  • 30.
    18 DOING BUSINESS2015 containerized goods by seaport, but they do not measure the cost of the sea transport or of tariffs or capture any aspects relating to international trade agreements. Thus through these indi-cators Doing Business provides a nar-row perspective on the infrastructure challenges that firms face, particularly in the developing world. It does not ad-dress the extent to which inadequate roads, rail, ports and communications may add to firms’ costs and undermine competitiveness (except to the extent that the trading across borders indica-tors indirectly measure the quality of ports and roads). Similarly, the indica-tors on starting a business or protect-ing minority investors do not cover all aspects of commercial legislation. And the getting electricity indicators do not currently address the quality of the electricity supply or the rate of electrification. Doing Business does not attempt to measure all costs and benefits of a particular law or regulation to society as a whole. For example, the paying taxes indicators measure the total tax rate, which, in isolation, is a cost to busi-nesses. The indicators do not measure, nor are they intended to measure, the benefits of the social and economic programs funded through tax revenues. Measuring business laws and regula-tions provides one input into the debate on the regulatory burden associated with achieving regulatory objectives. These objectives can differ across economies. Doing Business provides a starting point for this discussion and should be used in conjunction with other data sources. WHAT ARE THE STRENGTHS AND LIMITATIONS OF THE METHODOLOGY? The Doing Business methodology was designed to be an easily replicable way to benchmark business regulation. It has advantages and limitations that should be understood when using the data (table 2.3). A key consideration for the Doing Business indicators is that they should ensure comparability of the data across a global set of economies. The indicators are therefore developed around standardized case scenarios with specific assumptions. One such assumption is the location of a notional business—the subject of the Doing Business case study—in the largest business city of the economy. The reality is that business regulations and their enforcement may differ within a country, particularly in federal states and large economies. But gathering data for every relevant jurisdiction in each of the 189 economies covered by Doing Business would be infeasible. In addition, while variation is inevitable across different locations, the variation is unlikely to deliver significantly dif-ferent results commensurate with the scale of the effort. Nevertheless, where policy makers are interested in gener-ating data at the local level, beyond the largest business city, Doing Business has complemented its global indica-tors with subnational studies (box 2.1). And this year, for the first time, Doing Business has extended its coverage to the second largest business city in economies with a population of more than 100 million. Doing Business recognizes the limita-tions of the standardized case sce-narios and assumptions. But while such assumptions come at the expense of generality, they also help ensure the comparability of data. For this reason it is common to see limiting assump-tions of this kind in economic indica-tors. Inflation statistics, for example, are often based on prices of a set of consumer goods in a few urban areas, since collecting nationally representa-tive price data at high frequencies would be prohibitively costly in many countries. GDP estimates are also sub-ject to a number of limiting assump-tions, which have not prevented their widespread use. Some Doing Business topics include complex areas, and so it is important that the standardized cases are carefully defined. For example, the standardized case scenario usually involves a limited liability company or its legal equivalent. The considerations TABLE 2.3 Advantages and limitations of the Doing Business methodology Feature Advantages Limitations Use of standardized case scenarios Makes the data comparable across economies and the methodology transparent Reduces the scope of the data and means that only regulatory reforms in the areas measured can be systematically tracked Focus on largest business citya Makes the data collection manageable (cost-effective) and the data comparable Reduces the representativeness of the data for an economy if there are significant differences across locations Focus on domestic and formal sector Keeps the attention on where regulations are relevant and firms are most productive—the formal sector Fails to reflect reality for the informal sector—important where that is large—or for foreign firms where they face a different set of constraints Reliance on expert respondents Ensures that the data reflect the knowledge of those with the most experience in conducting the types of transactions measured Results in indicators that do not measure the variation in experiences among entrepreneurs Focus on the law Makes the indicators “actionable”— because the law is what policy makers can change Fails to reflect the reality that where systematic compliance with the law is lacking, regulatory changes may not achieve the full desired results a. In economies with a population of more than 100 million, Doing Business covers business regulation in both the largest business city and the second largest one.
  • 31.
    ABOUT DOING BUSINESS19 BOX 2.1 Comparing regulations at the local level: subnational Doing Business studies The subnational Doing Business studies expand the Doing Business analysis beyond the largest business city of an econo-my. They measure variation in regulations or in the implementation of national laws across locations within an economy (as in Nigeria) or a region (as in Central America). Projects are undertaken at the request of governments. Data collected by subnational reports over the past 2 years show that there can be substantial variation within an econ-omy. In Mexico in 2013, for example, transferring property took as few as 2 days in Colima and as many as 74 in Mexico City. Indeed, within the same economy one can find cities that perform as well as economies ranking in the top 20 on the ease of registering property and cities that perform as poorly as economies ranking in the bottom 40 on that indicator (see figure). Despite these large differences across cities of varied sizes, the differences between the largest and the sec-ond largest business cities in an economy tend to be small, as discussed in the overview. Different locations, different regulatory processes, same economy 43.76 53.04 49.89 48.96 64.86 59.94 53.51 Distance to frontier score for registering property (0–100) 35.61 32.95 47.11 41.15 89.60 43.17 90th percentile (88.16) 10th percentile (42.27) 29.14 57.64 Nigeria, 2014 Colombia, 2012 Egypt, Arab Rep., 2013 Italy, 2012 Mexico, 2013 Worst score Best score Average score Note: The average score shown for each economy is based on all locations covered by the data: 36 cities in Nigeria, 23 cities in Colombia, 15 locations and governorates in the Arab Republic of Egypt, 13 cities in Italy and 31 states and Mexico City in Mexico. The worst score shown for each economy is that of the location with the most complex process for transferring property, and the best score that of the location with the most efficient one. The 10th and 90th percentile values are based on economy-level scores for the 189 economies covered by Doing Business. Source: Subnational Doing Business database. The subnational Doing Business studies create disaggregated data on business regulations. But they go beyond a data collection exercise. They have proved to be strong motivators for regulatory reform at the city level: ě The data produced are comparable across locations within the economy and internationally, enabling locations to benchmark their results both locally and globally. Comparisons of locations that are within the same economy and therefore share the same legal and regulatory framework can be revealing: local officials find it hard to explain why doing business is more difficult in their jurisdiction than in a neighboring one. ě Pointing out good practices that exist in some locations but not others within an economy helps policy makers rec-ognize the potential for replicating these good practices. This can prompt discussions of regulatory reform across different levels of government, providing opportunities for local governments and agencies to learn from one another and resulting in local ownership and capacity building. Since 2005 subnational reports have covered 367 cities in 55 economies, including Brazil, China, India, Indonesia, Morocco and Pakistan. This year subnational studies were completed in the Arab Republic of Egypt, Mexico and Nigeria. Ongoing studies include those in Central America and the Dominican Republic (covering 22 cities and 10 ports across 7 countries), Poland (18 cities), South Africa (9 cities and 4 ports) and Spain (19 cities and 5 ports). Subnational reports are available on the Doing Business website at http://www.doingbusiness.org/subnational.
  • 32.
    20 DOING BUSINESS2015 in defining this assumption are twofold. First, private limited liability companies are, empirically, the most prevalent business form for firms with more than one owner in many economies around the world. Second, this choice reflects the focus of Doing Business on expand-ing opportunities for entrepreneurship: investors are encouraged to venture into business when potential losses are limited to their capital participation. Another assumption underlying the Doing Business indicators is that en-trepreneurs have knowledge of and comply with applicable regulations. In practice, entrepreneurs may not know what needs to be done or how to comply and may lose considerable time trying to find out. Alternatively, they may deliberately avoid compli-ance altogether—by not registering for social security, for example. Where regulation is particularly onerous, firms may opt for bribery and other informal arrangements intended to bypass the rules—an aspect that helps explain differences between the de jure data provided by Doing Business and the de facto insights offered by World Bank Enterprise Surveys. In economies with particularly burdensome regulation, levels of informality tend to be higher. Compared with their formal sector counterparts, firms in the informal sector typically grow more slowly, have poorer access to credit and employ fewer workers—and these workers remain outside the protections of labor law.7 Firms in the informal sector are also less likely to pay taxes. Doing Business measures one set of factors that help explain the occurrence of informality and give policy makers insights into potential areas of regula-tory reform. Rules and regulations fall under the direct control of policy makers—and they are often where policy makers start when intending to change the set of incentives under which businesses operate. Doing Business not only shows where problems exist in the regulatory framework; it also points to specific regulations or regulato-ry procedures that may lend themselves to reform. And its quantitative measures of business regulations enable research on how specific regulations affect firm behavior and economic outcomes. HOW ARE THE DATA COLLECTED? The Doing Business data are based on domestic laws and regulations as well as administrative requirements. The data cover 189 economies—including small economies and some of the poorest economies, for which little or no data are available in other data sets. The data are collected through several rounds of in-teraction with expert respondents (both private sector practitioners and govern-ment officials)—through responses to questionnaires, conference calls, written correspondence and visits by the team. Doing Business relies on 4 main sources of information: the relevant laws and regu-lations, Doing Business respondents, the governments of the economies covered and the World Bank Group regional staff (figure 2.2). For a detailed explanation of the Doing Business methodology, see the data notes. Relevant laws and regulations Most of the Doing Business indicators are based on laws and regulations. Indeed, more than two-thirds of the data embedded in the Doing Business indicators are based on a reading of the law. Besides filling out written ques-tionnaires, Doing Business respondents provide references to the relevant laws, regulations and fee schedules. The Doing Business team collects the texts of the relevant laws and regulations and checks questionnaire responses for accuracy. For example, the team will examine the commercial code to confirm the paid-in minimum capital requirement, look at the legislation to see whether borrowers have the right to access their data at the credit bureau and read the tax code to find applicable tax rates. (Doing Business makes these and other types of laws available on the Doing Business law library website.)8 Because of the data checking and qual-ity assurance, having large samples of respondents is not necessary. In princi-ple, the role of the contributors is largely advisory—helping the Doing Business team in finding and understanding the FIGURE 2.2 How Doing Business collects and verifies the data Data sources: • The relevant laws and regulations • Responses to questionnaires by private sector practitioners and government officials • Governments • World Bank Group regional staff Steps included in the data verification process: • Conference calls and videoconferences with private sector practitioners and government officials • Travel to selected economies The Doing Business team develops questionnaires for each topic and sends them to private sector practitioners and government officials. The Doing Business team analyzes the relevant laws and regulations along with the information in the questionnaires. Governments and World Bank Group regional teams submit information on regulatory changes that could potentially be included in the global count of regulatory reforms. The Doing Business team shares preliminary information on reforms with governments (through the World Bank Group’s Board of Executive Directors) and World Bank Group regional teams for their feedback. The report is published and disseminated. The Doing Business team analyzes the data and writes the report. Comments on the report and the data are received from across the World Bank Group through an internal review process.
  • 33.
    ABOUT DOING BUSINESS21 laws and regulations—and there are quickly diminishing returns to an ex-panded number of contributors. For the rest of the data the team conducts extensive consultations with multiple contributors to mini-mize measurement error. For some indicators—for example, those on dealing with construction permits, enforcing contracts and resolving insolvency—the time component and part of the cost component (where fee schedules are lacking) are based on actual practice rather than the law on the books. This introduces a degree of judgment. When sources indicate dif-ferent estimates, the time indicators reported in Doing Business represent the median values of several responses given under the assumptions of the standardized case. Doing Business respondents Over the past 12 years more than 30,000 professionals in 189 economies have assisted in providing the data that inform the Doing Business indicators.9 This year’s report draws on the inputs of more than 10,700 professionals.10 Table 14.2 in the data notes lists the number of respondents for each indi-cator set. The Doing Business website shows the number of respondents for each economy and each indicator set. Respondents are professionals who routinely administer or advise on the legal and regulatory requirements in the specific areas covered by Doing Business, selected on the basis of their expertise in these areas. Because of the focus on legal and regulatory ar-rangements, most of the respondents are legal professionals such as lawyers, judges or notaries. In addition, officials of the credit registry or bureau complete the credit information questionnaire. Freight forwarders, accountants, archi-tects, engineers and other profession-als answer the questionnaires related to trading across borders, paying taxes and dealing with construction permits. Certain public officials (such as regis-trars from the company or property registry) also provide information that is incorporated into the indicators. The Doing Business approach has been to work with legal practitioners or professionals who regularly undertake the transactions involved. Following the standard methodological approach for time-and-motion studies, Doing Business breaks down each process or transaction, such as starting a business or registering a building, into separate steps to ensure a better estimate of time. The time estimate for each step is given by practitioners with significant and routine experience in the transac-tion. When time estimates differ, fur-ther interactions with respondents are pursued to converge on one estimate or a narrow range that reflects the major-ity of applicable cases. Doing Business does not survey firms for 2 main reasons. The first relates to the frequency with which firms engage in the transactions captured by the indicators, which is generally low. For example, a firm goes through the start-up process once in its existence, while an incorporation law-yer may carry out 10 such transactions each month. The incorporation lawyers and other experts providing information to Doing Business are therefore better able to assess the process of starting a business than are individual firms. They also have access to the latest regulations and practices, while a firm may have faced a different set of rules when incor-porating years before. The second reason is that the Doing Business questionnaires mostly gather legal information, which firms are unlikely to be fully familiar with. For example, few firms will know about all the many legal procedures involved in re-solving a commercial dispute through the courts, even if some of them have gone through the process themselves. But a litigation lawyer would have no difficulty in providing the requested information on all the procedures. Governments and World Bank Group regional staff After receiving the completed ques-tionnaires from the Doing Business respondents, verifying the information against the law and conducting follow-up inquiries to ensure that all relevant infor-mation is captured, the Doing Business team shares the preliminary reform de-scriptions with governments through the Board of Executive Directors and regional staff of the World Bank Group. Through this process government authorities and local World Bank Group staff in the 189 economies covered can alert the team about, for example, regulatory reforms not picked up by the respondents or ad-ditional achievements of regulatory re-forms already captured in the database. In response to such feedback, the Doing Business team turns to the local private sector experts for further consultation and, as needed, corroboration. In addi-tion, the team responds formally to the comments of governments or regional staff and provides explanations of the scoring decisions. Data adjustments Information on data corrections is provided in the data notes and on the Doing Business website. A transparent complaint procedure allows anyone to challenge the data. From November 2013 to October 2014 the team received and responded to more than 160 queries on the data. If changes in data are con-firmed, they are immediately reflected on the website. HOW DO GOVERNMENTS USE THE DATA? Over the past decade governments have increasingly focused on reforming busi-ness regulation as one way of maintain-ing competitiveness in an increasingly globalized economy. Doing Business pro-vides one source of actionable, objective data that give useful insights into good practices worldwide. Indeed, since 2003 governments have implemented more
  • 34.
    22 DOING BUSINESS2015 than 600 regulatory reforms that have been informed by Doing Business.11 One venue for sharing success stories in business regulation reform is peer-to- peer learning events—workshops where officials from different govern-ments across a region or even across the globe meet to discuss the challenges of regulatory reform and to share their experiences (figure 2.3). In addition, reform committees within governments frequently use the Doing Business indicators as one input to inform their programs for improving the business environment. More than 50 economies have formed such committees—typically at the interministerial level or reporting directly to the president or the prime minister—to ensure the coordination of efforts across agencies. In East and South Asia they include Indonesia, the Republic of Korea, Malaysia, the Philippines and Sri Lanka. In the Middle East and North Africa: Algeria, Kuwait, Morocco, Saudi Arabia and the United Arab Emirates. In Europe and Central Asia: Azerbaijan, Croatia, the Czech Republic, Georgia, Kazakhstan, Kosovo, the Kyrgyz Republic, the former Yugoslav Republic of Macedonia, Moldova, Montenegro, Poland, the Russian Federation, Tajikistan, Ukraine, the United Kingdom and Uzbekistan. In Sub-Saharan Africa: Botswana, Burundi, the Central African Republic, the Comoros, the Democratic Republic of Congo, the Republic of Congo, Côte d’Ivoire, Guinea, Kenya, Liberia, Malawi, Mali, Nigeria, Rwanda, Sierra Leone, Togo and Zambia. And in Latin America: Chile, Colombia, Costa Rica, the Dominican Republic, Guatemala, Mexico, Panama and Peru. One reason behind the use of Doing Business indicators by governments is that many of these indicators can be considered “actionable,” measuring aspects over which governments have direct control. For example, govern-ments can reduce (or even eliminate) the minimum capital requirement for new firms. They can invest in company and property registries to increase the efficiency of these public agencies. They can improve the efficiency of tax admin-istration by adopting the latest technol-ogies to facilitate the preparation, filing and payment of taxes by businesses. And they can undertake court reforms to shorten delays in the enforcement of contracts. On the other hand, some Doing Business indicators capture costs that involve private sector participants, such as lawyers, notaries, architects, electricians or freight forwarders—costs over which governments may have little influence in the short run. While many Doing Business indica-tors are actionable, this does not necessarily mean that they are always “action-worthy” in a particular context.12 Business regulation reforms are one ele-ment of a strategy aimed at improving competitiveness and establishing a solid foundation for sustainable economic growth. There are many other important goals to pursue—such as effective man-agement of public finances, adequate attention to education and training, adoption of the latest technologies to boost economic productivity and the quality of public services, and appropri-ate regard for air and water quality to safeguard people’s health. Governments have to decide what set of priorities best fits the needs they face. To say that governments should work toward a sensible set of rules for private sector activity does not suggest that doing so should come at the expense of other worthy economic and social goals. NOTES 1. The focus of the Doing Business indicators remains the regulatory regime faced by domestic firms engaging in economic activity in the largest business city of an economy. Doing Business was not initially designed to inform decisions by foreign investors, though investors may in practice find the data useful as a proxy for the quality of the national investment climate. Analysis done in the World Bank Group’s Global Indicators Group has shown that countries that have sensible rules for domestic economic activity also tend to FIGURE 2.3 How governments use Doing Business as a policy tool Reform committees use Doing Business indicators to help inform programs to improve the business environment. improvements as part of broader reform Successful business regulation reforms programs. Governments learn from one another about good practices in the areas measured by Doing Business. Governments use Doing Business as a tool to stimulate regulatory
  • 35.
    ABOUT DOING BUSINESS23 have good rules for the activities of foreign subsidiaries engaged in the local economy. 2. For more on the World Bank Enterprise Surveys, see the website at http:// www.enterprisesurveys.org. 3. These papers are available on the Doing Business website at http:// www.doingbusiness.org/methodology. 4. For getting credit, indicators are weighted proportionally, according to their contribution to the total score, with a weight of 60% assigned to the strength of legal rights index and 40% to the depth of credit information index. In this way each point included in these indices has the same value independent of the component it belongs to. Indicators for all other topics are assigned equal weights. 5. A technical note on the different aggregation and weighting methods is available on the Doing Business website at http://www.doingbusiness.org/methodology. 6. For more details, see the chapter on the distance to frontier and ease of doing business ranking. 7. Schneider 2005; La Porta and Shleifer 2008. 8. http://www.doingbusiness.org/law-library. 9. The annual data collection exercise is an update of the database. The Doing Business team and the contributors examine the extent to which the regulatory framework has changed in ways relevant for the features captured by the indicators. The data collection process should therefore be seen as adding each year to an existing stock of knowledge reflected in the previous year’s report, not as creating an entirely new data set. 10. While about 10,700 contributors provided data for this year’s report, many of them completed a questionnaire for more than one Doing Business indicator set. Indeed, the total number of contributions received for this year’s report is more than 13,500, which represents a true measure of the inputs received. The average number of contributions per indicator set and economy is just over 6. For more details, see http:// www.doingbusiness.org/contributors /doing-business. 11. These are reforms for which Doing Business is aware that information provided by the Doing Business report was used in shaping the reform agenda. 12. One study using Doing Business indicators illustrates the difficulties in using highly disaggregated indicators to identify reform priorities (Kraay and Tawara 2011).
  • 36.
    Doing Business 2015 Going Beyond Efficiency What is changing in Doing Business? Good practices in business regulation have evolved since the Doing Business indicators were first developed in 2003. Some changes have come, for example, as new technologies have transformed the ways governments interact with citizens and the business community. The new developments have created a need to expand and update the Doing Business methodology. While the Doing Business report has introduced changes in methodology of varying degrees every year, this year’s report and Doing Business 2016 are implementing more substantive improvements. Most were inspired by recommendations of the Independent Panel on Doing Business and by broader consultations that have taken place over the years with World Bank Group staff, country govern-ments and the private sector.1 AN OVERVIEW OF THE CHANGES The improvements are in 3 areas: revision of the calculation of the ease of doing business ranking, expansion of the sample of cities covered in large economies and a broadening of the scope of indicator sets (table 3.1). Some of the changes imply a break in the data series and will compromise the comparability of data over time. For getting credit, for example, the changes in the strength of legal rights index are substantial enough to pre-vent comparability over time. But for all Doing Business topics, including get-ting credit, the data have been back-calculated 1 year to allow for at least 2 comparable years of data.2 Moreover, since most of the changes in method-ology involve adding new indicators rather than revising existing ones, data for more than 90% of the previously existing indicators remain comparable over time. The full data series are avail-able on the Doing Business website. Revising the ranking calculation Doing Business continues to publish the ease of doing business ranking. But beginning in this year’s report the ranking is based on the distance to frontier score rather than on the ƒ This year’s report and Doing Business 2016 are introducing changes in 8 of the 10 Doing Business indicator sets: dealing with construction permits, getting electricity, registering property, getting credit, protecting minority investors, paying taxes, enforcing contracts and resolving insolvency. ƒ The improvements have 2 main goals. The first is to expand the focus of indicator sets that primarily measure the efficiency of a transaction or service to also cover aspects of the quality of that service. The second is to expand the focus of indicator sets that already measure some aspects of the quality of regulation to include recent good practices in the areas covered. ƒ Starting this year the ease of doing business ranking is based on the distance to frontier score. ƒ For the 11 economies with a population of more than 100 million, a second city has been added to the sample this year. TABLE 3.1 Timeline of the changes in Doing Business Changes in Doing Business 2015 Revision of the ranking calculation Expansion of the city sample in large economies Broadening of the scope of indicator sets ě Getting credit ě Protecting minority investors ě Resolving insolvency Changes in Doing Business 2016 Broadening of the scope of indicator sets ě Registering property ě Dealing with construction permits ě Getting electricity ě Paying taxes ě Enforcing contracts Note: No changes are planned for starting a business or trading across borders. Minor updates in methodology are introduced in this year’s report for dealing with construction permits, paying taxes and enforcing contracts, as explained in the data notes.
  • 37.
    WHAT IS CHANGINGIN DOING BUSINESS? 25 percentile rank. The distance to frontier score benchmarks economies with re-spect to a measure of regulatory best practice—showing the gap between each economy’s performance and the best performance on each indicator. For indices, such as the strength of legal rights index (which ranges from 0 to 12), the frontier is set at the best theoretical score (in this case 12) even if no economy attains it. For most of the other indicators the frontier is set at the lowest number that occurs in practice—for example, 1 for the num-ber of procedures to start a business. The exceptions are the recovery rate in insolvency, for which the frontier is set at the highest value, and the total tax rate, for which a threshold has been established. The ranking based on the distance to frontier score is highly correlated with that based on the percentile rank. But the distance to frontier score captures more information than the percentile rank because it shows not only how economies are ordered but also how far apart they are. Economies with greater variance across topics are more likely to have a less favorable position in the distance to frontier ranking than in the percentile ranking. Those with relatively better performance in topics with a compressed distribution, such as start-ing a business, also tend to place lower in the distance to frontier ranking. Two country examples can better il-lustrate the practical implications of the change in the ranking calculation. In Doing Business 2014 Côte d’Ivoire had rankings between 115 and 173 for 8 of the 10 topics, and rankings of 88 and 95 for the other 2. This resulted in a ranking of 167 on the overall ease of doing business. If the ranking had been computed using the distance to frontier score rather than the percentile rank, Côte d’Ivoire’s ranking, based on the same data, would have been 153 (figure 3.1). This higher ranking would have been due mainly to the low variation in Côte d’Ivoire’s performance across topics. For Mongolia the opposite would have happened. In Doing Business 2014 Mongolia’s topic rankings ranged be-tween 22 and 181. Mongolia ranked in the top 40 for 4 of the topics, and in the bottom 60 for 3. Its overall ranking based on the percentile rank method was 76. If the ranking had been com-puted using the distance to frontier method instead, Mongolia’s ranking would have been 94. This lower ranking would have been attributable to the high variation in Mongolia’s perfor-mance across topics. How do the 2 countries fare in this year’s ease of doing business ranking? Côte d’Ivoire stands at 147 in the rank-ing, 6 places higher than in last year’s ranking when based on the new meth-odology— and Mongolia stands at 72, 22 places higher. The changes in ranking are due to other changes in methodol-ogy, changes in the data for these 2 countries and changes in the data for other economies. (For more details, see the chapter on the distance to frontier and ease of doing business ranking.) Expanding the sample of cities covered Since its inception Doing Business has focused on the largest business city of each economy, taking it as a proxy for the entire national territory. Depending on the indicator and the size of the economy, this focus can be a limitation in extrapolating results to the economy level. As the subnational Doing Business reports have shown, the indicators measuring the procedures, time and cost to complete a transaction (such as the dealing with construction permits indicators) tend to show more variation across cities within an economy than do indicators capturing features of the law applicable nationwide (such as the protecting minority investors or resolv-ing insolvency indicators). Moreover, this limitation is likely to be more important in larger economies—where the largest business city is likely to represent a smaller share of the overall economy—and in those with greater regional diversity in business practices. To address this issue, this year Doing Business has expanded its sample of FIGURE 3.1 How much difference is there between the 2 calculations of the ease of doing business ranking? 200 180 160 140 120 100 80 60 40 20 0 0 20 40 60 80 100 120 140 160 180 200 DB2014 ranking based on distance to frontier scores DB2014 ranking based on percentiles Mongolia Côte d’Ivoire Note: The 45-degree line shows where the rankings based on percentiles and the rankings based on distance to frontier scores are equal. The correlation between the 2 rankings is 0.99. Source: Doing Business database.
  • 38.
    26 DOING BUSINESS2015 cities in large economies, defined as those with a population of more than 100 million. Today there are 11 such economies in the world: Bangladesh, Brazil, China, India, Indonesia, Japan, Mexico, Nigeria, Pakistan, the Russian Federation and the United States. For each of these economies the sample now includes the second largest busi-ness city. Population size was used as the criterion for selecting these econo-mies for 2 main reasons: First, econo-mies with a large population, because of their size and diversity, are more likely to have differences in performance on indicators. Second, the larger the population in an economy, the larger the number of people who can benefit from improvements in business regulation. Within each economy the second city was also selected on the basis of popu-lation size. Another criterion was that the second city must be in a different metropolitan area than the largest business city.3 Other criteria were also considered, such as contribution to to-tal GDP or level of city dynamism, but these were not used in the end because of the lack of comparable data across the economies. What do the data for the new cities in the sample show about the differences within economies? Overall, the differ-ences are small. In 7 of the 11 econo-mies the difference in the distance to frontier score between the 2 cities is less than 1 point (figure 3.2). Broadening the scope of indicator sets Eight of the 10 sets of Doing Business indicators are being improved over a 2-year period. The improvements are aimed at addressing 2 main concerns. First, in indicator sets that primarily measure the efficiency of a transaction or service provided by a government agency (such as registering property), the focus is being expanded to also cover aspects of the quality of that service. And second, in indicator sets that already measure some aspects of the quality of regulation (such as pro-tecting minority investors), the focus is being expanded to include additional good practices in the areas covered. INTRODUCING NEW MEASURES OF QUALITY Efficiency in regulatory transactions is important. Many research papers have highlighted the positive effect of improvements in areas measured by Doing Business on such economic outcomes as firm or job creation.4 But increasing efficiency may have little impact if the service provided is of poor quality. For example, the ability to complete property transfers quickly and inexpensively is important, but if the land records are unreliable or other features of the property rights regime are flawed, the property title will have little value. There is a well-established literature linking regulatory quality with eco-nomic outcomes at the macro level. An important part of this literature stems from the Worldwide Governance Indicators, which measure regulatory quality as 1 of 6 pillars of governance. This literature has produced important findings: Better governance (includ-ing better regulatory quality) leads to higher income per capita.5 Better governance is linked to faster economic growth.6 And a heavier regulatory burden reduces economic growth and increases macroeconomic volatility.7 While this research uses data far from the areas into which Doing Business indicators are expanding, these find-ings are encouraging and they suggest a need to better understand what aspects of regulatory quality drive these results. Measures of the quality of business regulation at the micro level are lacking. By expanding its focus on regulatory quality, Doing Business will open a new area for research. The aim is to help develop greater understand-ing of the importance of the quality of business regulation and its link to regulatory efficiency and economic outcomes. Six indicator sets are being expanded to measure regulatory quality: dealing with construction permits, getting electricity, registering property, pay-ing taxes, enforcing contracts and FIGURE 3.2 Small differences in the distance to frontier score between cities in the same economy Distance to frontier score of second largest business city (0–100) 40 40 Indonesia China Brazil Pakistan 60 60 Japan Russian Federation 80 80 100 100 90 70 50 United States Nigeria India 50 70 90 Distance to frontier score of largest business city (0–100) Bangladesh Mexico Note: The 45-degree line shows where the scores for the 2 cities are equal. Source: Doing Business database.
  • 39.
    WHAT IS CHANGINGIN DOING BUSINESS? 27 resolving insolvency. The new indica-tors being introduced emphasize the importance of having the right type of regulations. In general, economies with less regulation or none at all will have a lower score on the new indicators. Changes in Doing Business 2015 Resolving insolvency The resolving insolvency indicators measure the time, cost and outcome of an insolvency process for a case study firm and the recovery rate for its secured creditors. The indicators have focused mainly on the efficiency of the bank-ruptcy court system. But by measuring the outcome of the process—that is, whether the firm continues to operate or not—the indicators were already as-sessing some dimensions of the quality of insolvency regulation. In this year’s report the indicators go further, by explicitly measuring the strength of the legal framework for insolvency. A new indicator, the strength of in-solvency framework index, measures good practices in accordance with the World Bank’s Principles for Effective Insolvency and Creditor/Debtor Regimes and the United Nations Commission on International Trade Law’s (UNCITRAL) Legislative Guide on Insolvency Law.8 The index measures 4 aspects. First, it records whether debtors and creditors have the right to commence liquidation proceedings, reorganization proceed-ings or both and what standard is used to determine whether a debtor is insol-vent. Second, it tests what happens to the contracts of a debtor during insolvency proceedings, whether post-commencement financing is permitted and what level of priority is granted to post-commencement creditors. Third, it tests the approval process for a reorganization plan as well as certain substantive requirements for the plan. Finally, it tests the extent to which creditors can participate in insolvency proceedings as a group as well as the rights of individual creditors to litigate and appeal decisions that affect their rights. Under the old methodology the distance to frontier score for resolving insolvency was based only on the recovery rate, which measures the cents on the dollar recouped by secured creditors through insolvency proceedings. Under the new methodology the score is based on both the recovery rate and the strength of insolvency framework index. A comparison of the 2 scores shows that many economies have insolvency laws that follow some good practices even if they may face challenges in implementing those laws (figure 3.3). For example, Brazil receives a score of 13 (of 16 possible points) on the strength of insolvency framework index while its recovery rate is only 25.8% of the estate value. Economies not performing well on the new indicator are those that use foreclosure to resolve the insolvency in the Doing Business standardized case. Foreclosure is normally a relatively fast process, typically resulting in a higher recovery rate—but it ignores unsecured creditors, something that would not be true of a well-designed insolvency framework. In Maldives, for example, secured creditors should expect to re-cover 49.9% of the estate value, but the country receives a score of only 2 on the strength of insolvency framework index. For more details on the new index and its scoring methodology, see the data notes. For a complete discussion of the new indicator and an analysis of the data, see the case study on resolving insolvency. Changes in Doing Business 2016 Registering property The registering property indicator set has measured the procedures, time and cost to transfer a property from one company to another since 2004. Starting in Doing Business 2016, the indicator set will be expanded to cover the reliability, transparency and geographic coverage of land admin-istration systems as well as dispute resolution for land issues. Ensuring the reliability of information on property titles is a crucial function of land administration systems. To FIGURE 3.3 Comparing distance to frontier scores for resolving insolvency under the old and new methodologies Distance to frontier score for resolving insolvency under new methodology 100 90 80 70 60 50 40 30 20 10 0 Maldives Brazil 0 10 20 30 40 50 60 70 80 90 100 Distance to frontier score for resolving insolvency under old methodology Note: Under the new methodology the distance to frontier score for resolving insolvency includes both the recovery rate and the strength of insolvency framework index; under the old one it includes only the recovery rate. Both scores are based on this year’s data. The 45-degree line shows where the scores under the old and new methodologies are equal. The correlation between the 2 scores is 0.90. Source: Doing Business database.
  • 40.
    28 DOING BUSINESS2015 assess how well these systems are per-forming this function, a new indicator will record the practices used for col-lecting, recording, storing and process-ing information on land parcels and property titles. Specific attention will be given to practices that support data reliability, such as unifying, standard-izing and synchronizing records across different sources and putting in place the necessary infrastructure to reduce the risk of errors. The indicator will also provide informa-tion allowing comparison of transpar-ency standards for land administration systems around the world. New data will record what land-related informa-tion is made publicly available, whether procedures and property transactions are transparent and whether informa-tion on fees for public services is easily accessible. In addition, the indicator will measure the coverage levels attained by land registration and mapping systems. A land administration system that does not cover the economy’s entire territory is unable to guarantee the protection of property rights in areas that lack institutionalized information on land. The result is a dual system, with both formal and informal land markets. To be enforceable, all transactions need to be publicly verified and authenticated at the registry. Finally, the indicator will allow compar-ative analysis of land dispute resolu-tion across economies. It will measure the accessibility of conflict resolution mechanisms and the extent of liability for the entities or agents recording land transactions. For a complete discussion of the new indicator and a preliminary data analysis, see the case study on registering property. Dealing with construction permits The existing indicator set on dealing with construction permits measures the procedures, time and cost to comply with the formalities to build a warehouse—including obtaining necessary licenses and permits, completing required notifications and inspections and obtaining utility connections. The indicator set will be expanded in Doing Business 2016 to measure good practices in construc-tion regulation (see figure 3.4 for some of the new aspects that will be added to the indicator set). The changes will address important issues facing the building community. One is the need for clarity in the rules, to ensure that regulation of construc-tion can fulfill the vital function of helping to protect the public from faulty building practices. Besides be-ing clear, building rules also need to be adaptable, so that they can keep up with economic and technological change. To assess these character-istics, a new indicator on regulatory quality will examine how clearly the building code or building regulations specify the requirements for obtaining a building permit and how easily ac-cessible the regulations are. Beyond measuring the clarity and accessibility of regulations, the indi-cator will assess the effectiveness of inspection systems. Good inspection systems are critical to ensuring public safety. They can ensure that buildings comply with proper safety standards, reducing the chances of structural faults. And requirements that techni-cal experts review the proposed plans before construction even begins can re-duce the risk of structural failures later on. The new indicator will cover quality control at 3 stages: before, during and after construction. Measures of quality control before construction will look at 2 points: which entity is required to verify that the architectural plans and drawings comply with the building regulations and who makes up the team or com-mittee that reviews and approves building permit applications at the permit-issuing agency. Measures of quality control during construction will examine 3 points: what types of mandatory inspections (if any) are required by law during construction; which agency is responsible for con-ducting these inspections; and whether inspections required by law are actually carried out (or, if not required by law, commonly occur in practice). Measures of quality control after construction will also examine 3 points: whether a final inspection is required by law to FIGURE 3.4 What will be added to dealing with construction permits Does the building code follow good practices? Is it easily accessible? Who approves the designs? How are inspections carried out before, during and after construction? What qualifications are required for the professionals reviewing plans or conducting inspections? What are the rules on liability and insurance?
  • 41.
    WHAT IS CHANGINGIN DOING BUSINESS? 29 verify that the building was built in ac-cordance with the approved plans and the building regulations; which agency is responsible for conducting the final inspection; and whether the final inspection required by law is actually carried out (or, if not required by law, commonly occurs in practice). The professionals who conduct the inspections play a vital part in ensuring that buildings meet safety standards. So it is important that these profes-sionals be certified and that they have the necessary technical qualifications. And if safety violations or construction flaws occur despite their efforts, it is im-portant to have a well-defined liability and insurance structure to cover losses resulting from any structural faults. The new indicator will cover several points relating to these issues: what the qualification requirements are for the professionals responsible for verifying the architectural plans and for those authorized to supervise the construction; which parties are held legally liable for construction flaws or problems affecting the structural safe-ty of the building once occupied; which parties are required by law to obtain an insurance policy to cover possible flaws or problems affecting the structural safety of the building once occupied; and what the consequences are for the construction company and the professionals authorized to supervise construction if construction flaws or problems are found or if building regu-lations were not complied with. Getting electricity The existing data set on getting elec-tricity measures the efficiency of the process for obtaining an electricity con-nection for a standard warehouse—as reflected in the procedures, time and cost required. While the efficiency of the connection process has proved to be a useful proxy for the overall ef-ficiency of the electricity sector, these measures cover only a small part of the sector’s performance. Beyond the complexity and high cost of getting an electricity connection, inadequate or unreliable power supply is also perceived as an important constraint on business activity, particularly in the developing world. To offer a more complete view of the electricity sector, Doing Business will broaden the scope of the getting electricity indicators to include the reli-ability of the power supply (figure 3.5). The expanded data set will be published in Doing Business 2016. A new indicator will assess the reliability of electricity supply by measuring both the duration and the frequency of power outages. The indicator will use the system average interruption duration index (SAIDI) and the system average interruption frequency index (SAIFI). SAIDI is the average total duration of outages over the course of a year for each customer served, while SAIFI is the average number of service interruptions experienced by a customer in a year. Collecting these data can be challeng-ing. The SAIDI and SAIFI measures are often recorded by utility companies, and the availability and quality of the data depend on the utilities’ ability to collect the information. To provide an understanding of the quality of moni-toring, the indicator will also record the methods used by electricity distribution companies to measure power outages. Paying taxes The paying taxes indicators measure the taxes and mandatory contributions that a medium-size company must pay in a given year as well as the administrative burden of paying taxes and contributions. The indicators now measure only the administrative burden associated with preparing, filing and paying 3 major tax categories (profit taxes, consumption taxes and labor taxes). But the postfiling process— involving tax audits, tax refunds and tax appeals—can also impose a substantial administrative burden on firms. Starting in Doing Business 2016, the paying taxes indicator set will therefore be expanded to include measures of the postfiling process. In addition, this year’s report includes an important change in the methodol-ogy for the paying taxes indicators. The distance to frontier score for the total tax rate now enters the distance to frontier score for paying taxes in a nonlinear fashion. As a result of this change, an increase in the total tax rate has a smaller impact on the distance to frontier score for paying taxes than previously for economies with a below-average total tax rate and a larger impact for economies with a very high total tax rate relative to the average (see figure 15.2 and the related discussion in the chapter on the distance to frontier and ease of doing business ranking). FIGURE 3.5 What will be added to getting electricity Reliability of electricity supply ²ƀƖŦƃĊĶĩƀĶâƀŎĶƦÊŦƀĶƖƃöÊŬ ²ƀ/ŦÊśƖÊĩ³ƭƀĶâƀŎĶƦÊŦƀĶƖƃöÊŬ
  • 42.
    30 DOING BUSINESS2015 Enforcing contracts The enforcing contracts indicators measure the procedures, time and cost to resolve a commercial dispute between 2 firms. The indicators have focused on the efficiency of the com-mercial court system without directly addressing the quality of the judiciary or the judicial infrastructure. In Doing Business 2016 the indicator set will be expanded to cover aspects of judicial quality and court infrastructure, focusing on well-established good practices that promote quality and efficiency in the commercial court system (figure 3.6). To assess the quality of the judiciary and judicial infrastructure, a new in-dicator will record whether there is a specialized commercial court or divi-sion; whether there is a small claims court; whether voluntary mediation is available; whether arbitration is avail-able; whether pretrial attachment of assets is available; whether it is com-mon practice for the parties in a com-mercial case to request adjournments and whether the law sets a limit on the total number allowed; and whether judgments in commercial cases are made available to the general public. Another new indicator will measure court efficiency. This indicator will re-cord whether the initial complaint can be filed electronically; whether case management is available; whether electronic case management is avail-able; whether there is a pretrial confer-ence as part of the case management system; and whether process can be served electronically. Once these new data are collected and presented in Doing Business 2016, the indicator on the number of procedures to enforce a contract will be dropped. EXPANDING THE EXISTING MEASURES OF QUALITY Two sets of Doing Business indicators— getting credit and protecting minority investors—already measure aspects of regulatory quality. These indicator sets have been expanded in this year’s report to incorporate more recent knowledge on good practices. These changes are reflected in this year’s ranking on the ease of doing business. Getting credit The getting credit indicators assess the legal rights of borrowers and lenders in secured transactions and the sharing of credit information. Measures compiled in the strength of legal rights index focus on whether collateral and bank-ruptcy laws include certain features that facilitate lending. Those combined in the depth of credit information index focus on the coverage, scope and accessibility of credit information available through credit bureaus and registries. Both sets of measures have been expanded this year to cover more good practices (figure 3.7). The strength of legal rights index has been expanded from 10 points to 12, with the new aspects selected in ac-cordance with UNCITRAL’s Legislative Guide on Secured Transactions.9 One of the new points is awarded for having an integrated secured transactions system. Modern secured transactions systems are aimed at ensuring that a prospective creditor can easily deter-mine not only whether an asset has already been pledged as collateral but also whether there is some other type of right over that asset. Such rights might be established by legal instru-ments that are functional equivalents to security interests. In an integrated secured transactions system these instruments are regulated under the same law as traditional security interests. This approach provides the greatest transparency and predict-ability— because all rights in collateral, whether traditional security interests or their functional equivalents, are registered at the same registry, and the law will contemplate how priority rules apply across the different types of contracts. FIGURE 3.6 What will be added to enforcing contracts Quality of the judiciary Electronic filing of complaints Case management Electronic case management Pretrial conference Electronic service of process Specialized commercial court Small claims court Voluntary mediation Arbitration Pretrial attachment Adjournments Publication of judgments Court efficiency
  • 43.
    WHAT IS CHANGINGIN DOING BUSINESS? 31 Other new points are awarded for hav-ing a well-functioning collateral regis-try, defined by several characteristics. One is that the registry must cover any type of secured transaction, regard-less of the type of debtor, creditor or assets.10 Another is that the registry must be a notice-based registry. This type of registry has much lower ad-ministrative and archival costs than a document registry, which must register voluminous documentation and have specialists review the documents pro-vided and the assets used as collateral. Finally, the registry must offer modern features. Secured creditors (or their representatives) should be able to register, search, amend and cancel security interests online. Information in the database should be updated imme-diately or no more than 24 hours after registration documents are submitted. And the registry should have a digital database for storing the informa-tion. These types of online solutions enhance the efficiency of a registry and the reliability of the information it records. Establishing and maintaining such systems can be costly, however, and these systems need to be backed by adequate legislation, such as pri-vacy laws and regulations on electronic signatures. The depth of credit information index has been expanded from 6 points to 8. In addition, because of the importance of coverage in assessing the effective-ness of a credit information system, only credit bureaus or registries that cover at least 5% of the adult popula-tion are being scored. One of the new points is awarded to economies where credit information can be accessed through an online platform or through a system-to-system connec-tion between financial institutions and the credit information system. Online access can improve data quality and security, increase efficiency and trans-parency and ensure a high standard of service for users—and thus might increase the number of reporting insti-tutions that share credit information. Another new point is awarded to econo-mies where credit scores are available. Credit scores, considered more effective in predicting risk than credit histories alone, may improve market efficiency and provide borrowers with more op-portunities to obtain credit. Their availability enables lenders that would otherwise not be capable of analyzing the raw credit data to extend credit to underserved markets at lower cost. For more details on the expanded indi-cators and their scoring methodology, see the data notes. For a complete discussion of the indicators and an analysis of the data, see the case study on getting credit. Protecting minority investors The name of the protecting investors indicator set has been changed this year to protecting minority investors to better reflect its scope—and the scope of the indicator set has been expanded. The indicators have traditionally mea-sured the strength of minority share-holder protections against directors’ misuse of corporate assets for personal gain. This year a new indicator has been added to measure shareholders’ rights in corporate governance beyond related-party transactions, following internationally accepted good practic-es such as those proposed by the OECD Principles of Corporate Governance.11 The new indicator, the extent of shareholder governance index, encompasses a range of issues and data: ƒ Shareholders’ rights and role in major corporate decisions—the extent to which shareholders can influence important corporate decisions, such as appointing and removing board members, issuing new shares and amending the company’s bylaws and articles of association. ƒ Governance structure—the extent to which the law mandates separation between corporate constituencies to minimize potential agency conflicts. The issues covered include whether the chief executive officer (CEO) can also be chair of the board of direc-tors, whether a board must include a minimum number of independent directors and whether there are rules relating to cross-shareholding and subsidiary ownership. ƒ Transparency—the extent to which companies are required to disclose information about their finances, about the remuneration of their managers and directors and about other directorships they hold. Transparency has been found to im-prove governance and lower the cost of investment in capital markets. ƒ Allocation of legal expenses—the extent to which the expenses as-sociated with lawsuits brought by shareholders can be recovered from the company or the payment of the expenses can be made contingent on a successful outcome. The data provide information on whether FIGURE 3.7 What has been added to getting credit ²ƀƀ9ĩƃÊöŦƃÊÀƀĚÊöĚƀ ŦĊöĆƃŬƀâŦĥÊƦĶŦė ²ƀƀMĶŦÊƀâʏƃƖŦÊŬƀĶâƀƃĆÊƀ ³ĶĚ̏ƃÊŦĚƀŦÊöĊŬƃŦƭ ²ƀƀƫĊŬƃÊĩ³ÊƀĶâƀĩƀĶĩĚĊĩÊƀ Ŏ̏ƃâĶŦĥ ²ƀƀƥĊ̏ªĊĚĊƃƭƀĶâƀ ³ŦÊÀĊƃƀŬ³ĶŦÊŬ hƃŦÊĩöƃĆƀĶâƀ ĚÊöĚƀŦĊöĆƃŬ ÊŎƃĆƀĶâƀ³ŦÊÀĊƃƀ ĊĩâĶŦĥƃĊĶĩ
  • 44.
    32 DOING BUSINESS2015 FIGURE 3.8 Comparing distance to frontier scores for protecting minority investors under the old and new methodologies Distance to frontier score for protecting minority investors under new methodology Switzerland filing a shareholder action is pro-hibitively expensive—and therefore impracticable even if allowed by law. By expanding the scope of the indica-tors Doing Business has raised the bar, making it more difficult to reach the frontier. The highest distance to frontier score for protecting minority investors observed under the new methodology is lower than the highest one under the old methodology (figure 3.8). The average score across all economies covered by Doing Business is also lower under the new methodology than under the old one. This is true even though the pos-sible range of the overall measure, the strength of minority investor protection index, continues to be 0–10. Yet some economies score higher on the overall in-dex under the new methodology. One of them is Switzerland. While it performs relatively poorly in protecting minority investors in related-party transactions, it does considerably better on general corporate governance rules. For others, such as Paraguay, the opposite is true. For more details on the methodology for the protecting minority investors Paraguay indicators, see the data notes. For a complete discussion of the new indica-tor and an analysis of the data, see the case study on protecting minority investors. NOTES 1. For more information on the Independent Panel on Doing Business and its work, see its website at http://www.dbrpanel.org. 2. See the data notes for more details. 3. Where the second and third largest cities were very close in population size, the GDP of the city or relevant state was used to determine which city was the second largest business city. 4. For more details, see the chapter in Doing Business 2014 on research on the effects of business regulations. 5. Kaufmann and Kraay 2002. 6. Cuzman, Dima and Dima 2010. 7. Loayza, Oviedo and Servén 2010. 8. World Bank 2011b; UNCITRAL 2004. 9. UNCITRAL 2007. 10. Excluding exemptions such as planes, boats and the like, which are traditionally covered by different registries. 11. OECD 2004. 100 90 80 70 60 50 40 30 20 10 0 0 10 20 30 40 50 60 70 80 90 100 Distance to frontier score for protecting minority investors under old methodology Note: Under the new methodology the distance to frontier score for protecting minority investors includes 6 areas of corporate governance; under the old one it includes 3 of the 6 areas. Both scores are based on this year’s data. The 45-degree line shows where the scores under the old and new methodologies are equal. The correlation between the 2 scores is 0.87. Source: Doing Business database.
  • 45.
    Doing Business 2015 Going Beyond Efficiency Reforming the business environment in 2013/14 As many studies have shown, the business environment can have an important influence on the development of the private sector and economic growth—and thus on the creation of jobs and better livelihoods. Where well designed and properly implemented, regulatory reforms can promote private sector growth by elimi-nating bureaucratic obstacles, reducing cost and time constraints to doing business and improving the efficiency of legal institutions. They can also have an important impact on perceptions of an economy’s business environment. One important area of regula-tory reform is the process for starting a business. Research provides strong evidence that reforms making it easier to start a business are associated with more firm creation,1 which in turn is strongly associated with job creation and economic growth. Using a sample of OECD countries, researchers found that, on average, halving the number of procedures required to start a business is associated with a 14% increase in the number of new business registrations. A similar reduction in the days required is linked to a 19% increase, while an equivalent cut in the cost is associated with a 30% increase. These findings are borne out by evidence at the country level. After a reform in Mexico that reduced the number of procedures to start a business by about 60%, the country saw a 5% increase in the total number of firms.2 Portugal ex-perienced similar effects after it reduced the time and cost to start a business by 50%. New start-ups increased by about 17%, with most of the growth among less productive firms, those “that would have been most deterred by burdensome regulations, such as small firms in low-tech sectors.”3 Comparable evidence exists on a regional level for Italy: provinces with a longer process for starting a business have lower rates of firm creation than those with a more streamlined process.4 Regulatory reforms can have impor-tant positive spillover effects. In trade logistics, evidence shows that improv-ing port efficiency not only reduces shipping times but also ultimately cuts shipping costs. According to analysis of data for the Doing Business indicators on trading across borders, increasing port efficiency from the 25th to the 75th percentile can reduce shipping costs by 12%.5 These spillover effects on ship-ping costs decrease with an economy’s income level: high-income economies showed greater effects than low- and middle-income ones. Moreover, better regulation is strongly correlated with better perceptions of the quality of the business environment in an economy.6 And there is strong evidence that regulatory reforms in the areas measured by Doing Business indicators improve perceptions of quality. But the research is inconclusive about which reforms have a greater effect—those affecting the indicators that measure the complexity and cost of regulatory processes or those ƒ Doing Business has captured more than 2,400 regulatory reforms making it easier to do business since 2004. ƒ In the year ending June 1, 2014, 123 economies implemented at least one such reform in areas measured by Doing Business—230 in total. ƒ Among reforms to reduce the complexity and cost of regulatory processes in 2013/14, those in the area of starting a business were the most common, followed by reforms in the areas of paying taxes and registering property. ƒ Among reforms to strengthen legal institutions in 2013/14, the largest numbers were recorded in the areas of getting credit and protecting minority investors, and the smallest in the area of resolving insolvency. ƒ Eight of the 11 economies with a population of more than 100 million implemented at least one reform making it easier to do business in the past year. China, Mexico and the Russian Federation each implemented 2, while India and Indonesia each implemented 3. ƒ Greece, Italy, Portugal and Spain— all among the economies most adversely affected by the global financial crisis—have maintained a steady pace of regulatory reform.
  • 46.
    34 DOING BUSINESS2015 affecting the indicators that measure the strength of legal institutions. Overall, there appears to be no statistically significant differences between the 2 groups of indicators. Using its indicators to track changes in business regulations, Doing Business has captured more than 2,400 regulatory reforms making it easier to do business since 2004. In the year ending June 1, 2014, 123 economies implemented at least one such reform in areas mea-sured by Doing Business—230 in total. From year to year Doing Business has recorded many more reforms reducing the complexity and cost of regulatory processes than reforms strengthening legal institutions. It is no different for 2013/14, with a count of 145 reforms re-ducing regulatory complexity and cost and 85 strengthening legal institutions (table 4.1). This pattern is no surprise. It happens in small economies and in large ones (box 4.1). Reforms aimed at cutting red tape and improving regula-tory efficiency are generally easier to implement, because they rarely involve large institutional players and they yield relatively quick results. By contrast, reforms aimed at improving legal institutions are typically com-plex. Most entail substantial changes to legal frameworks, are costly to implement and can take years to yield positive results. HIGHLIGHTS OF REFORMS REDUCING REGULATORY COMPLEXITY AND COST Among reforms to reduce the complex-ity and cost of regulatory processes in 2013/14, those in the area of starting a business were the most common, followed by reforms in paying taxes. The area with the third largest number of reforms was registering property, though in previous years it tended to be trading across borders. TABLE 4.1 Reforms making it easier to do business in 2013/14 and in the past 5 years Easing bureaucratic barriers to start-up Start-up formalities, while they still vary around the world, are converging toward good practices. In 2013/14, as in earlier years, many of the reforms making it easier to start a business focused on introducing a one-stop shop or eliminating the minimum capital requirement (see table 4A.1 at the end of the chapter). Timor-Leste, the economy that improved the ease of starting a business the most, did so by creating a one-stop shop. Now entrepreneurs can complete several formalities in one place—reserving a company name, submitting company documents, applying for registration and publishing company statutes. By streamlining start-up formalities and centralizing services, the new one-stop shop reduced the time required to start a business from 94 days to just 10. São Tomé and Príncipe eliminated the minimum capital requirement for busi-ness entities with no need to obtain a commercial license. Moldova abolished the minimum capital requirement for all limited liability companies. The Russian Federation, through amend-ments to its civil code and federal law, eliminated the requirement for a com-pany’s founders to deposit the charter capital before incorporation. Russia also abolished the requirement for companies to notify the tax authorities of the opening of bank accounts. Cutting red tape in construction permitting Doing Business recorded 16 reforms making it easier to deal with construc-tion permits in 2013/14. Most were in Europe and Central Asia and Sub- Saharan Africa. Djibouti and Ghana both streamlined their permitting pro-cess. Madagascar and Senegal reduced the time required to obtain a building permit. Mali reduced the time needed to obtain a geotechnical study. And Rwanda eliminated the fee to obtain a freehold title and streamlined the pro-cess for obtaining an occupancy permit. Area of reform Number of reforms in 2013/14 Average annual number of reforms in past 5 years Economy improving the most in area in 2013/14 Complexity and cost of regulatory processes Starting a business 45 45 Timor-Leste Dealing with construction permits 16 19 Croatia Getting electricity 12 12a Solomon Islands Registering property 21 22 Greece Paying taxes 31 34 Romania Trading across borders 20 23 Myanmar Strength of legal institutions Getting credit—legal rights 9 10 Colombia Getting credit—credit information 22 20 Jamaica Protecting minority investors 30 14 United Arab Emirates Enforcing contracts 15 13 Kosovo Resolving insolvency 10 17 Mozambique Note: Because Jamaica implemented changes in the past year in both the strength of legal rights and depth of credit information components of getting credit, the table shows a total of 231 reforms for 2013/14, though only 230 are counted as separate reforms. a. Refers to the average for the past 4 years. Source: Doing Business database.
  • 47.
    REFORMING THE BUSINESSENVIRONMENT IN 2013/14 35 BOX 4.1 Most economies with a population of more than 100 million implemented at least one regulatory reform in 2013/14 Some people might assume that reforming business regulation is easier in small economies because their government structures tend to be less complex. The Doing Business data do not suggest that this is so. Eight of the 11 economies with a population of more than 100 million reformed in at least one of the areas measured by Doing Business in 2013/14, while only 18 of the 34 economies with a population of less than 1 million did so. Among the 11 large economies, China, Mexico and the Russian Federation each implemented 2 reforms making it easier to do business, while India and Indonesia each implemented 3 (see table). What did these economies do? India made starting a business easier by considerably reducing the registration fees— though it also added a requirement to file a declaration before commencing business operations. It made obtaining a new electricity connection in Mumbai less costly by reducing the security deposit. And it strengthened minority investor protections by requiring greater disclosure by board members, increasing the remedies available in case of prejudicial related-party transactions and introducing additional safeguards for shareholders of privately held companies. Indonesia made starting a business easier by making it possible to issue the approval letter for the deed of establishment electronically. It made getting electricity in Jakarta easier by eliminating the need for multiple certificates guaranteeing the safety of internal installations. And it lowered labor taxes. China also made starting a business easier, by eliminating the minimum capital requirement and thus the need for a capital verification report from an auditing firm. In addition, it reduced employers’ social security contribution rate in Shanghai and enhanced the electronic system for filing and paying taxes. Mexico improved access to credit by amending its insolvency proceedings law and establishing clear grounds for relief from a stay of enforcement actions by secured creditors during reor-ganization Croatia made the biggest improve-ment in the ease of dealing with construction permits (figure 4.1). New regulations in the Building Act and Physical Planning Act that took effect on January 1, 2014, made it possible to obtain a building permit before paying contribution fees for utilities, speeding up the permitting process. The fees for building permits were also reduced. In addition, registration of the new building with the land registry is now done automatically, with no action re-quired by the builder: the municipality sends documentation to the cadastre for registration, and the cadastre sends documentation on to the land registry. And the final inspection is now done with greater timeliness, dra-matically reducing the time required for the issuance of the occupancy per-mit. As a result of all these changes, the number of procedures required to comply with the formalities to build a warehouse in Croatia fell from 22 to 21, the time from 379 days to 188 and the cost by 0.3% of the warehouse value. Making it easier to get electricity Doing Business recorded only 12 reforms making it easier to get electricity in proceedings. And it made resolving insolvency easi-er by shortening the time extensions during reorganization pro-ceedings and facilitating electronic submission of documents. Russia made starting a business easier by eliminating the re-quirement to deposit the charter capital before company reg-istration as well as the requirement to notify tax authorities of the opening of bank accounts. And it made transferring prop-erty easier by eliminating the need for notarization and reduc-ing the time required for property registration. In 2013/14 the 11 large economies were more likely to imple-ment reforms reducing the complexity and cost of regulatory processes than reforms strengthening legal institutions—a pattern also evident in smaller economies. Among the 15 re-forms captured by Doing Business in these large economies, most were at the national level and affect both cities mea-sured. One of the exceptions was in the United States, where the reform making it easier to start a business applies to New York City but not to Los Angeles. Reforms making it easier to do business in the 11 large economies in 2013/14 Economy Reforms reducing regulatory complexity and cost Reforms strengthening legal institutions Bangladesh 1 0 Brazil 0 0 China 2 0 India 2 1 Indonesia 3 0 Japan 0 0 Mexico 0 2 Nigeria 0 0 Pakistan 1 0 Russian Federation 2 0 United States 1 0 Note: The table shows data for the 11 large economies for which Doing Business covers both the largest and the second largest business city. Source: Doing Business database.
  • 48.
    36 DOING BUSINESS2015 FIGURE 4.1 Croatia cut more than 6 months from the time required to deal with construction permits 180 160 140 120 100 80 60 40 20 1 2 3 4 5 6 7 8 9 10 11 12 13 14 15 16 17 18 19 20 21 22 450 400 350 300 250 200 150 100 50 0 2013/14. Revision of the costs for new connections was the most common feature of the reforms. In Rwanda, where increasing the electrification rate is a government priority, the distribu-tion utility waived all fees for complet-ing a new connection, including the security deposit. The big reduction in cost provides a strong incentive to seek an official connection to the network and encourages new business ventures. In Poland the utility in Warsaw revised the fee structure for new connections in ways that reduced the cost for new customers. In India the electricity utility in Mumbai changed its method for cal-culating the security deposit. The utility now calculates it as a fixed charge per kilowatt rather than basing it on a cus-tomer’s estimated monthly consump-tion, increasing the transparency of the related costs. Another common feature of electricity reforms was improvement in the effi-ciency of distribution utilities’ internal processes. The utility in the Democratic Republic of Congo, Société Nationale d’Electricité, reduced the time required to get electricity by improving its administrative management of new connection requests. Starting in 2014 the utility began tracking how much time each of its departments takes to deal with connection requests. The utility also streamlined its internal approval process: its staff no longer seeks approval from the head office for each individual connection request but instead submits batches once a month. The utility in Malawi reduced the time required to get electricity by outsourcing external connection works to subcontractors. In many economies shortages in the materials needed for external works— such as transformer substations—are a source of substantial delays in the connection process. Tackling this issue was a focus of the utility in the Solomon Islands. By improving procurement practices, the utility cut the wait time for new connections by two-thirds (figure 4.2). As a result, the Solomon Islands made the biggest improvement in the ease of getting electricity in 2013/14. Simplifying property registration In 2013/14, 21 economies made it easier for businesses to register property by reducing the time, cost or number of procedures required. Among the most common improvements were reducing property transfer taxes, combining or eliminating procedures, and introduc-ing computerized procedures. Lowering the property transfer tax can substan-tially reduce the cost of transferring property and improve compliance with property registration and tax regula-tions, though this type of change needs to be informed by broader tax policy discussions. FIGURE 4.2 The Solomon Islands reduced the time to obtain an electricity connection by two-thirds 0 Procedures 2013 2014 Time to get electricity (days) Await inspection of the internal wiring by SIEA and installation of the meter; electricity starts flowing Await completion of the external connection works by SIEA Await completion of an external inspection by SIEA for purposes of preparing the estimate Submit application for a connection to SIEA and await a cost estimate Time cut from 160 days to 53 Note: SIEA is the Solomon Islands Electricity Authority. Source: Doing Business database. Procedures One procedure cut, 191 days saved Time to deal with construction permits (days) 2013 2014 Source: Doing Business database.
  • 49.
    REFORMING THE BUSINESSENVIRONMENT IN 2013/14 37 Payments (number per year) Total tax rate (% of commercial profit) Time (hours per year) 120 100 80 60 40 20 Greece made the largest improvement in the ease of registering property (figure 4.3). In December 2013 it established a new property transfer tax of 3% of the property value, substantially lower than the previous one of 10%. In addition, it simplified property transfers by elimi-nating the need to submit a tax clear-ance certificate from the municipality before signing the sale agreement. 240 200 160 120 80 40 Sub-Saharan Africa accounted for the largest number of property registra-tion reforms in 2013/14. For example, Mozambique streamlined registration procedures at the land registry and the municipality. Côte d’Ivoire established a single process for tax and property registration and lowered the property registration tax. Senegal replaced the requirement for authorization from the tax authority with a notification requirement and set up a single step for the property transfer at the land registry. Making it easier and less costly to pay taxes Doing Business recorded 31 reforms in 2013/14 making it easier or less costly for firms to pay taxes. Europe and Central Asia accounted for the largest number, with 9. Globally, the most com-mon feature of tax reforms in the past year was the introduction or enhance-ment of electronic systems for filing and paying taxes. Thirteen economies implemented such changes, including Azerbaijan, Belarus, Moldova, Mongolia, Romania, Tajikistan and Ukraine. Electronic tax systems, if implemented well and used by most taxpayers, ben-efit both tax authorities and firms. For tax authorities, they ease workloads and reduce operational costs. And for firms, they reduce the time required to comply with tax obligations as well as the potential for errors. Romania improved the ease of paying taxes the most in 2013/14 (figure 4.4). The government has developed an electronic system for filing and paying corporate income tax, value added tax and all 6 mandatory labor contribu-tions measured by Doing Business.7 The system was initially launched in 2010, though with only the possibility of submitting tax returns online. Over the past 2 years, however, online payment of taxes and contributions became possible with the use of banking cards and was gradually taken up by the business community. By January 2013 the majority of firms were making their tax payments online. Other economies making noteworthy changes in the area of paying taxes in the past year include Belarus, China, the Democratic Republic of Congo and Latvia. Belarus improved its system for keeping online records for corporate income tax and value added tax. The FIGURE 4.3 Greece made registering property both easier and less expensive Time to register property (days) Cost to register property (% of property value) 1 2 3 4 5 6 7 8 9 10 11 25 20 15 10 5 0 14 12 10 8 6 4 2 0 2013 Procedures Cost 2014 Procedures Cost One procedure eliminated, and cost reduced by 6.86% of the property value Procedures Note: In 2014 procedures 3, 4 and 5 occur simultaneously with procedure 2 (although procedures may take place simultaneously, they cannot start on the same day). Procedure 6 starts after procedure 2. Source: Doing Business database. FIGURE 4.4 Romania has been making compliance with tax obligations easier in recent years 2004 2005 2006 2007 2008 2009 2010 2011 2012 2013 0 0 Payments Total tax rate Time Source: Doing Business database.
  • 50.
    38 DOING BUSINESS2015 system now automatically updates all relevant tax rates, alerts users of potential errors and automatically col-lects and checks data required for filling out tax returns. Belarus also simplified its rules for deducting expenses for the calculation of corporate income tax. Four other economies merged or elimi-nated certain taxes—the Republic of Congo, Hungary, Senegal and Zambia. Eleven economies reduced profit tax rates, the second most common fea-ture of tax reforms in 2013/14. These include 4 high-income economies (Portugal, Spain, St. Kitts and Nevis, and the United Kingdom), 3 upper-middle- income economies (Colombia, the Seychelles and Tunisia) and 4 lower-middle- income economies (the Republic of Congo, Guatemala, Swaziland and Vietnam). Reductions in profit tax rates are often combined with efforts to widen the tax base by removing exemp-tions and with increases in the rates of other taxes, such as value added tax. Facilitating trade Myanmar made the biggest improve-ment in the ease of trading across borders in 2013/14 (figure 4.5). Its Ministry of Commerce abolished the export license requirement for 166 types of goods and the import license requirement for 152—reducing the time, cost and number of documents required to export and import general cargo products. As measured by Doing Business, exporting now takes 20% less time than before, and importing 19% less time. Tanzania invested in port infrastruc-ture. New cranes, a conveyor belt and anchorage tankers at the port of Dar es Salaam helped reduce berthing and unloading time as well as congestion. The reduction in the time required for port and terminal handling activities benefits not only traders in Tanzania but also those in the landlocked econo-mies of Burundi and Rwanda that use the port. FIGURE 4.5 Myanmar reduced the time to export and import by abolishing license requirements for many types of goods Time to export (days) Time to import (days) Document preparation 30 25 20 15 10 5 Eighteen other economies also implemented reforms making it easier to trade across borders in 2013/14. Introducing or improving electronic submission and processing of documents was the most common feature of these reforms. Eight economies—Bangladesh, Croatia, Ecuador, Pakistan, Palau, St. Lucia, Uganda and Uzbekistan—reduced the time to export and import by implementing computerized systems that allow web-based submission of documents. Croatia switched to an electronic customs system as part of reforms in preparation for accession to the European Union. Improving customs administration remained an important item on reform agendas. Benin, Côte d’Ivoire, the Dominican Republic, Morocco, Myanmar, St. Lucia and Uzbekistan all did so by reducing the number of documents required by customs or streamlining the process to obtain and submit certain documents. Five economies—Algeria, Ghana, Jordan, Kazakhstan and Tanzania— strengthened transport or port Port and terminal handling Inland transport and handling 30 25 20 15 10 5 infrastructure. Kazakhstan opened a new border station and railway link that reduced congestion at the border with China. Poland improved port procedures by launching a new terminal operating system at the port of Gdansk. And Uruguay implemented a risk-based in-spection system that reduced customs clearance time. HIGHLIGHTS OF REFORMS STRENGTHENING LEGAL INSTITUTIONS Among reforms to strengthen legal institutions in 2013/14, the largest numbers were recorded in the areas of getting credit and protecting minority investors (with 30 in each area), and the smallest in the area of resolving insolvency. Economies in Europe and Central Asia implemented the most reforms aimed at strengthening legal institutions, followed by economies in Sub-Saharan Africa. Strengthening legal rights of borrowers and lenders In 2013/14, 9 economies improved ac-cess to credit by strengthening the legal Customs clearance and inspections 0 2013 2014 0 2013 2014 Source: Doing Business database.
  • 51.
    REFORMING THE BUSINESSENVIRONMENT IN 2013/14 39 rights of borrowers and lenders—either by reforming secured transactions legislation or by enhancing secured creditors’ rights in bankruptcy pro-ceedings (see table 4A.1 at the end of the chapter). Colombia, Hungary and Jamaica all implemented a functional approach to secured transactions. The Czech Republic and the Lao People’s Democratic Republic both created a modern, notice-based collateral reg-istry. Hungary and Panama expanded the range of movable assets that can be used as collateral. Mexico, Rwanda, and Trinidad and Tobago strengthened the rights of secured creditors during reorganization proceedings. Globally, Colombia strengthened the legal rights of borrowers and lenders the most, by implementing a new legal framework for secured transactions (table 4.2). The country launched a col-lateral registry with modern features in May 2014, following approval of a new law on movable property guarantees. The new law permits all types of mov-able assets, present or future, to be used as collateral to secure a loan. The law also regulates legal instruments that are the functional equivalents of traditional security interests, such as assignments of receivables and sales with retention of title. In addition, it pro-vides priority rules for creditors’ claims within bankruptcy and establishes the rights of secured creditors during reorganization proceedings. Finally, the law allows out-of-court enforcement of collateral. Jamaica also made noteworthy im-provements in the area of legal rights in the past year. It adopted a new law on secured transactions that broadens the range of assets that can be used as collateral, allows a general description of assets granted as collateral and establishes a modern, unified, notice-based collateral registry. Panama implemented similar changes and also introduced the possibility of out-of-court enforcement of collateral. The Czech Republic, through an amendment to its civil code, made it possible to register receivables at the pledge registry. It also introduced the possibility for the parties to a secu-rity agreement to agree to out-of-court enforcement of the collateral. The government of Lao PDR established a centralized, online, notice-based reg-istry where financial institutions can register any security interest held over movable property—including functional equivalents to more traditional security interests, such as financial lease agree-ments, assignments of receivables, fiduciary transfers of title and sales with retention of title. Improving credit information systems Jamaica made the biggest improve-ment in credit reporting in 2013/14. Two new credit bureaus, Creditinfo Jamaica and CRIF-NM Credit Assure Limited, having received business licenses in 2012, began operations in 2013. Twenty-one other economies also improved credit reporting, with the largest number of them in Sub- Saharan Africa. The Democratic Republic of Congo and Tanzania both established new credit reporting agencies. The Democratic Republic of Congo’s central bank es-tablished an electronic system allow-ing the exchange of credit information between its credit registry and banks and financial institutions. Tanzania’s central bank issued an operating license to the country’s first credit bureau, Creditinfo Tanzania, in June 2013, and to its second one, Dun Bradstreet Credit Bureau Tanzania, in September 2013. Creditinfo Tanzania began responding to inquiries from data users 2 months after receiving its license. Vietnam’s first credit bureau, Vietnam Credit Information, started serving data users in January 2014 along with the existing credit registry managed by the country’s central bank. TABLE 4.2 A comparison of Colombia’s previous and new legal frameworks for secured transactions Previous legal New legal framework framework Is there a functional secured transactions system? No. Yes. Is the collateral registry unified or centralized geographically for the entire economy? No. Yes. Is the collateral registry notice-based? No. Yes. Does the collateral registry have a modern online system (such as for registrations and amendments)? No. Yes. Can secured creditors apply for relief from an automatic stay during reorganization proceedings? No. Yes, the new law establishes clear grounds for relief. Do secured creditors’ claims have priority inside bankruptcy? No clear priority rules for secured creditors. Yes, the new law gives priority to secured creditors’ claims. Can security rights in a single category of assets be described in general terms? No, detailed description of the assets required by law. Yes, the new law allows a general description. Can parties agree to enforce security rights out of court? No, out-of-court enforcement not permissible by law. Yes, the new law allows out-of-court enforcement of collateral. Source: Doing Business database. Five Sub-Saharan African economies— Cabo Verde, Cameroon, Côte d’Ivoire, Kenya and Senegal—strengthened their regulatory frameworks for credit reporting. Cameroon’s government passed legislation establishing an in-tegrated database that records nega-tive payment information on bank accounts, checks and cards as well as credit information on firms and micro-finance institutions. Kenya issued new regulations allowing the exchange of positive credit information and estab-lishing guidelines for data retention.
  • 52.
    40 DOING BUSINESS2015 Time for enforcement cut from 180 days to 90 Time to enforce a contract (days) 200 180 160 140 120 100 80 60 40 20 Among OECD high-income economies, Ireland and the Slovak Republic im-proved their regulatory frameworks for credit reporting. Ireland created a regu-latory framework for the establishment and operation of a central credit register that will be managed by the country’s central bank. The Slovak Republic ad-opted a new regulation to protect the rights of individuals in the processing of their personal data. And New Zealand, under its Credit Reporting Privacy Code, introduced more comprehensive credit reporting. In addition to negative credit information, credit bureaus now collect and report positive credit information on individuals and firms from banks, financial institutions and telephone companies. Strengthening minority investor protections The United Arab Emirates strength-ened minority investor protections the most in 2013/14, through a new ministerial resolution on corporate gov-ernance rules and corporate discipline standards. The resolution establishes requirements for related-party trans-actions to be approved by a general meeting of shareholders, to undergo prior review by a specialized external firm and to be disclosed in detail to the Securities and Commodities Authority. The resolution also establishes director liability for any damage resulting from prejudicial related-party transactions and enables courts to cancel such transactions on grounds of unfairness. Finally, it permits shareholders repre-senting 5% or more of the shares of a company involved in a related-party transaction to access documents relat-ing to the transaction. The most far-reaching change in minor-ity investor protections, however, took place in January 2014, when the OHADA (Organization for the Harmonization of Business Law in Africa) Revised Uniform Act on Commercial Companies and Economic Interest Groups simul-taneously updated the regulatory frameworks of 17 member economies in Sub-Saharan Africa. The revised act addresses multiple aspects of corporate law. Among other things, it increases the requirements for directors to disclose their conflicts of interest and grants shareholders the right to access and ob-tain copies of all documents pertaining to related-party transactions. One OHADA member, Senegal, made further improvements by amending its code of civil procedure—and with these changes became the economy that most strengthened minority investor protections in Sub-Saharan Africa in 2013/14. Notably, the amendments grant litigants increased rights to obtain evidence relevant to their claims from the opposing parties. Elsewhere in the region, The Gambia adopted a new Companies Bill, clarifying the duties of directors and offering new venues and remedies for minority shareholders harmed by abusive conduct by company insiders. Making it easier to enforce contracts Doing Business recorded 15 reforms making it easier to enforce contracts in 2013/14. Kosovo made the biggest improvement—by introducing a private bailiff system (figure 4.6). The effort began in 2010, when the local judiciary was short of resources and facing a heavy backlog. Less than 4% of civil enforcement cases on court dockets were completed in 2009, and for many courts the share was less than 1%. The Kosovo Judicial Council, with the assistance of the U.S. Agency for International Development, analyzed the legal framework and identified the main causes of delay. This map-ping exercise showed that the lack of penalties for filing groundless appeals, the impossibility of seizing most kinds of assets and the inadequacy of the regulatory framework for enforcement officers contributed substantially to the growing backlog. A 3-year work plan was undertaken to provide more suitable ways to deal with business dis-putes. In 2013 Kosovo finished privatiz-ing its judicial enforcement process and FIGURE 4.6 Kosovo cut the time for enforcing judgments in half by introducing a private bailiff service Filing and service Trial and judgment Enforcement 2013 2014 0 Source: Doing Business database.
  • 53.
    REFORMING THE BUSINESSENVIRONMENT IN 2013/14 41 created private bailiff services, expedi-ent execution procedures and penalties for noncompliant debtors. Globally, one of the most common features of reforms in contract en-forcement in the past year was the in-troduction of electronic filing. Greece, Kazakhstan, Lithuania, Mauritius and Turkey all made their courts more effi-cient by implementing electronic filing platforms. These enable litigants to file initial complaints electronically— increasing transparency, expediting the filing and the service of process, limiting opportunities for corruption and preventing the loss, destruction or concealment of court records. In Singapore the judiciary launched an electronic litigation system designed to streamline the litigation process and improve access to justice. The system allows litigants to file their cases online—and it enables courts to keep litigants and lawyers informed about their cases through e-mail, text messages and text alerts; to manage hearing dates; and even to hold certain hearings through videoconference. The Bahamas, Portugal and Uruguay adopted a new code of civil procedure or amended procedural rules ap-plicable to commercial cases, mainly to reduce case backlog, simplify and expedite court proceedings and limit obstructive techniques. In 2013 Uruguay passed a law setting tight deadlines that parties to a commercial case must comply with throughout the entire court proceedings. Three econo-mies— the Czech Republic, Ireland and South Africa—reorganized their court systems by amending the rules on the size of monetary claims that can be filed with courts at different levels, thus redistributing the workload among courts and reducing backlog. Creating specialized commercial courts or divisions has been a common feature of reforms in contract enforcement over the years. Two economies undertook such changes in 2013/14. Benin estab-lished a commercial chamber within its court of first instance and assigned 6 judges to solely hear commercial cases. The Seychelles established a special-ized commercial court and assigned a permanent local judge to resolve only commercial disputes. Increasing efficiency in resolving insolvency Doing Business recorded 10 reforms making it easier to resolve insolvency in 2013/14, most of them in OECD high-income and Sub-Saharan African economies. Among the most common features of these reforms were promot-ing reorganization and improving the likelihood of successful outcomes in insolvency proceedings. Mozambique, the Seychelles, and Trinidad and Tobago introduced a court-supervised reorganization procedure. Switzerland allowed cancellation of long-term contracts that could jeopardize the debtor’s rehabilitation. Slovenia es-tablished a simplified reorganization procedure for small companies and a preventive restructuring procedure for medium-size and large ones. Slovenia also made it easier for creditors to initiate reorganization proceedings and propose a reorganization plan, introduced provisions on debt-equity swaps and allowed new equity hold-ers to take over management of the debtor to ensure continuation of the business. Mozambique improved the ease of re-solving insolvency the most in the past year (table 4.3). A new legal framework for insolvency adopted in 2013 intro-duced a reorganization procedure for commercial entities, granted creditors better access to information during in-solvency proceedings and provided for more active participation by creditors in the proceedings. Other insolvency reforms recorded in 2013/14 focused on streamlining and shortening time frames for proceedings. TABLE 4.3 A comparison of Mozambique’s previous and new legal frameworks for insolvency Previous legal New legal framework framework Can a debtor initiate reorganization proceedings? No. Yes. Do creditors vote on the reorganization plan? No reorganization Yes, all creditors vote. available. Do creditors vote on the reorganization plan in classes? No reorganization available. Creditors are divided into classes, creditors within each class are treated equally, and the plan is approved by a simple majority of creditors in each class. Can creditors request information about insolvency proceedings? No specific provisions. The insolvency administrator has the duty to provide any creditor with information requested by the creditor. Can creditors object to decisions that affect their rights? No specific provisions. A creditor has the right to object to decisions to accept or reject claims of other creditors. Source: Doing Business database. The former Yugoslav Republic of Macedonia tightened time frames for several stages of insolvency proceed-ings and established a framework for electronic auctions of debtors’ assets. Mexico shortened the time extensions allowed during reorganization pro-ceedings and made it easier to submit documents electronically. Several other economies reformed their insolvency laws to strengthen the rights of credi-tors. For example, Kazakhstan estab-lished provisions for direct participa-tion of all creditors through creditors’ meetings. Another common feature of insolvency reforms in the past year was to im-prove regulations on the profession of insolvency administrators. Trinidad and
  • 54.
    42 DOING BUSINESS2015 Tobago created a public office respon-sible for the general administration of insolvency proceedings and clarified rules on the appointment and duties of trustees. And Uganda established explicit rules on the enforcement of the duties of liquidators during liquidation proceedings. Addressing labor market regulation In 2013/14 Doing Business recorded 9 reforms relating to labor market regu-lation. The economies implementing reforms included Portugal, which has made the most reforms aimed at im-proving the labor market environment in recent years. In 2013 Portugal re-vised the rules on fixed-term contracts executed under the labor code that reach their maximum duration before November 8, 2015; under the new rules these contracts can be renewed 2 more times, with an additional maximum duration of 12 months, though the renewed contracts need to end by December 31, 2016. In previous years Portugal reduced the wage premium required for work on weekly holidays and also made redundancy easier by eliminating the need to follow a specific order in dismissals when eliminating a worker’s position. Portugal’s continual reforms in labor market regulation are in part a response to the economic downturn that followed the global financial crisis. And Portugal is one of several Southern European economies that reformed business regulation in areas beyond labor market regulation in 2013/14 (box 4.2). Other economies implementing re-forms in labor market regulation in 2013/14 focused on different areas. Cabo Verde introduced a minimum wage. Finland made the redundancy process more flexible by eliminating the requirement to notify a third party be-fore dismissing 1 redundant worker or a group of 9 redundant workers. Croatia lifted the 3-year limit on the duration of first-time fixed-term contracts, BOX 4.2 Southern European economies continue a steady pace of regulatory reform Greece, Italy, Portugal and Spain—all among the economies most adversely affected by the global financial crisis—have maintained a steady pace of regu-latory reform. As Doing Business 2013 reported, the pace picked up in the after-math of the crisis, and this year’s report shows that the trend has continued. In 2013/14 Greece reformed in 3 areas of business regulation measured by Doing Business, and Spain in 4. Greece made starting a business easier by lowering the cost of registration. It made transferring property easier by reducing the property transfer tax and eliminating the requirement for a municipal tax clearance certificate. And it made enforcing contracts easier by introducing an electronic filing system for court users. Italy and Spain also made starting a business easier. Italy reduced the minimum capital requirement, while Spain simplified business registration by introducing an electronic system that links several public agencies. Portugal lowered its corporate income tax rate and introduced a reduced corporate tax rate for a portion of the taxable profits of qualifying small and medium-size enterprises. Spain reduced its statutory corporate income tax rate. Portugal made enforcing contracts easier by adopting a new code of civil pro-cedure designed to reduce court backlog, streamline court procedures, enhance the role of judges and speed up the resolution of standard civil and commer-cial disputes. Spain made resolving insolvency easier by introducing new rules for out-of-court restructuring as well as provisions applicable to prepackaged reorganizations. These economies, by actively reducing the complexity and cost of regulatory processes and strengthening legal institutions, are narrowing the gap with the regulatory frontier at a faster pace than the rest of the European Union. while Mauritius reduced the maximum duration of fixed-term contracts to 24 months and Georgia reduced it to 30 months. NOTES 1. Klapper and Love 2011. 2. Bruhn 2011. 3. Branstetter and others 2013. 4. Bripi 2013. 5. Portugal-Perez and Wilson 2012. 6. Kraay and Tawara 2013. 7. The 6 mandatory labor contributions measured by Doing Business are those for social security, health insurance, unemployment, an accident risk fund, a guarantee fund and medical leave.
  • 55.
    REFORMING THE BUSINESSENVIRONMENT IN 2013/14 43 TABLE 4A.1 Who reduced regulatory complexity and cost or strengthened legal institutions in 2013/14—and what did they do? Feature Economies Some highlights Making it easier to start a business Simplified preregistration and Albania; Bulgaria; The Gambia; Guatemala; registration formalities (publication, India; Islamic Republic of Iran; Jamaica; Malawi; notarization, inspection, other Malta; Mauritius; Nicaragua; Norway; Slovak requirements) Republic; Spain; Swaziland; United Kingdom Guatemala’s official gazette reduced the time to publish a notice of incorporation by modifying internal processes. The Islamic Republic of Iran combined name reservation with company registration at a single window. Abolished or reduced minimum capital requirement Austria; Benin; China; Côte d’Ivoire; Czech Republic; Denmark; Italy; Moldova; São Tomé and Príncipe; Senegal; Togo China and Côte d’Ivoire both abolished the minimum capital requirement. In doing so, China also eliminated the need to open a preliminary bank account, deposit the capital and obtain a certificate of deposit. Cut or simplified postregistration procedures (tax registration, social security registration, licensing) Armenia; Greece; Jamaica; Lithuania; Mauritania; Russian Federation; United States Lithuania abolished the requirement for a company seal, no longer used in practice. Mauritania eliminated the requirement to publish company statutes in the official gazette. Introduced or improved online procedures Azerbaijan; Croatia; Iceland; Indonesia; FYR Macedonia; Switzerland; Trinidad and Tobago Trinidad and Tobago introduced an online platform for business registration, reducing registration time from 38 days to 14.5. The former Yugoslav Republic of Macedonia introduced a free online company registration system. Created or improved one-stop shop Democratic Republic of Congo; France; Suriname; Tajikistan; Timor-Leste Timor-Leste created a one-stop shop—making it possible to reserve a company name, file the company statutes, apply for and obtain the final registration number and publish the statutes all at one agency. Making it easier to deal with construction permits Reduced time for processing permit applications Albania; Croatia; Djibouti; Ghana; Lithuania; Madagascar; Senegal; Thailand Lithuania tightened the time limit for issuing special architectural requirements, cutting the time to obtain a building permit from 42 days to 21. Madagascar completed the computerization of its one-stop shop, reducing the time to obtain a building permit from 90 days to 45. Streamlined procedures Albania; Brunei Darussalam; Djibouti; Ghana; Madagascar; Mali; Rwanda Djibouti streamlined the review of building permits by adopting a 3-step process. Ghana made it mandatory to submit all required clearances when applying for a building permit. Adopted new building regulations Albania; Croatia; Lithuania; Montenegro; Nepal Albania adopted a new law on territory planning, consolidating the land permit and construction permit into a single construction development permit. Croatia’s adoption of the Building Act and a new Physical Planning Act made it possible to obtain a building permit before paying contribution fees for utilities. Improved building inspection process Kosovo; Nepal; Puerto Rico (U.S.) Kosovo introduced a new inspection scheme and made the final inspection process easier by breaking the approval process into several phases. Puerto Rico (territory of the United States) introduced the option of hiring an authorized professional and authorized inspector to carry out the fire safety recommendations and issue the fire prevention and environmental health certificates. Reduced fees Croatia; Rwanda; Tajikistan Rwanda eliminated the fee to obtain a freehold title. Tajikistan reduced the fee for obtaining an architectural planning assignment. Improved or introduced electronic platforms or online services Nepal Nepal launched an online system for obtaining building permits. Making it easier to get electricity Improved regulation of connection processes and costs India; Jamaica; Poland; Rwanda; Sierra Leone; Taiwan, China In Poland the electricity utility made obtaining a new connection less costly by revising its fee structure. In Rwanda the electricity utility eliminated all its fees for a new connection. Improved process efficiency Democratic Republic of Congo; Costa Rica; Malawi; Solomon Islands The electricity utility in Malawi engaged private subcontractors to carry out external connection works, reducing the time required to complete the works by 50 days. Streamlined approval process Indonesia; Islamic Republic of Iran Indonesia eliminated a redundant internal wiring inspection by dropping the requirement for a certificate guaranteeing that the internal installation meets the standards. Making it easier to register property Reduced taxes or fees Bahrain; Côte d’Ivoire; Greece; San Marino; Spain; Togo Greece reduced the property transfer tax from 10% of the property value to 3%. Spain reduced the property registration tax to 6% of the property value. Combined or eliminated procedures Colombia; Greece; Mozambique; Russian Federation; Senegal Colombia eliminated the need for a provisional registration. The Russian Federation eliminated the requirement for notarization of certain documents. Computerized procedures Albania; Côte d’Ivoire; Ireland; Sweden; Vanuatu Ireland enhanced its land registry’s computerized system and implemented an online system for title registration. In Vanuatu property records have been scanned, and the land registry is now using a fully computerized system for land transactions. Increased administrative efficiency Guinea; Republic of Korea; United Arab Emirates The District Registration Courts in the Republic of Korea increased efficiency by streamlining internal processes. The United Arab Emirates started licensing companies to act on behalf of the Dubai Land Department and use its system for property registration.
  • 56.
    44 DOING BUSINESS2015 TABLE 4A.1 Who reduced regulatory complexity and cost or strengthened legal institutions in 2013/14—and what did they do? Feature Economies Some highlights Making it easier to register property (continued) Set effective time limits Albania; Kazakhstan; Russian Federation Albania established effective time limits for processing requests at the local offices for registration of immovable property. Kazakhstan introduced effective time limits for issuing technical passports and nonencumbrance certificates on immovable property. Introduced online procedures Azerbaijan; Poland Azerbaijan introduced a system allowing notaries to obtain nonencumbrance certificates online. Poland provided legal status to land extracts obtained online. Introduced fast-track procedures Sierra Leone Sierra Leone introduced a fast-track procedure for property registration. Making it easier to pay taxes Introduced or enhanced electronic systems Azerbaijan; Belarus; China; Costa Rica; Gabon; Guatemala; Moldova; Mongolia; Romania; Taiwan, China; Tajikistan; Ukraine; Zambia Belarus introduced electronic filing and payment for the obligatory insurance fund in 2013. Reduced profit tax rate by 2 percentage points or more Colombia; Republic of Congo; Guatemala; Portugal; Seychelles; Spain; Swaziland; St. Kitts and Nevis; Tunisia; United Kingdom; Vietnam Portugal reduced the corporate income tax rate from 25% to 23% for 2013. Simplified tax compliance process Belarus; Brunei Darussalam; China; Democratic Republic of Congo; Latvia; Seychelles Latvia introduced a simplified value added tax return in January 2013. Reduced labor taxes and mandatory contributions by 1 percentage point or more China; Colombia; Indonesia; Togo China reduced the social security contribution rate for firms in Shanghai from 37% to 35% for 2013. Merged or eliminated taxes other than profit tax Republic of Congo; Hungary; Senegal; Zambia Hungary abolished the special tax that had been introduced in 2010. Reduced number of tax filings or payments Belarus; Cyprus; West Bank and Gaza Cyprus reduced the number of provisional tax installments for corporate income tax from 3 to 2 in 2013. Making it easier to trade across borders Introduced or improved electronic submission and processing Bangladesh; Croatia; Ecuador; Pakistan; Palau; St. Lucia; Uganda; Uzbekistan Ecuador upgraded to a new electronic data interchange system, reducing customs clearance time. Improved customs administration Benin; Côte d’Ivoire; Dominican Republic; Morocco; Myanmar; St. Lucia; Uzbekistan St. Lucia reduced the number of export documents that must be submitted to customs by merging 2 forms. Strengthened transport or port infrastructure Algeria; Ghana; Jordan; Kazakhstan; Tanzania Ghana invested in infrastructure at the port of Tema, which helped reduce the wait time for vessels outside the port. Improved port procedures Côte d’Ivoire; Poland Poland launched a new terminal operating system at the port of Gdansk. Introduced or improved risk-based inspections Uruguay Uruguay implemented a risk-based inspection system that reduced customs clearance time. Strengthening legal rights of borrowers and lenders Created a unified registry for movable property Colombia; Hungary; Jamaica; Lao PDR The Lao People’s Democratic Republic established a registry in the Ministry of Finance for security interests in movable property. The registry began operating in November 2013. Introduced a functional, integrated and comprehensive secured transactions regime Colombia; Hungary; Jamaica Colombia approved a new law establishing a modern legal framework for secured transactions. The law allows all types of movable assets, present or future, to be used as collateral to secure a loan. It also regulates functional equivalents to loans secured with movable property, such as assignments of receivables and sales with retention of title. Strengthened rights of secured creditors during reorganization procedures Mexico; Rwanda; Trinidad and Tobago In Mexico amendments to the insolvency proceedings law established new grounds for relief from a stay of enforcement actions by secured creditors during a reorganization procedure. Allowed out-of-court enforcement Czech Republic; Panama The Czech Republic adopted new legislation making it possible to execute a security in any way established by the parties to a security agreement. Expanded range of movable assets that can be used as collateral Hungary; Panama Panama introduced a new law governing chattel mortgages that expands the range of movable assets that can be used as collateral to secure a loan. Improving the sharing of credit information Expanded scope of information collected and reported by credit bureau or registry Bahrain; Cyprus; Mauritania; New Zealand; Sierra Leone; Taiwan, China; United Arab Emirates; Zambia New Zealand implemented comprehensive credit reporting and began distributing both positive and negative information in credit reports. Improved regulatory framework for credit reporting Cabo Verde; Cameroon; Côte d’Ivoire; Dominican Republic; Ireland; Kenya; Senegal; Slovak Republic Ireland adopted a new credit reporting act providing for the establishment of a central credit register to be managed by the central bank. Established a credit bureau or registry Democratic Republic of Congo; Jamaica; Tanzania; Vietnam In Jamaica 2 new credit bureaus, licensed in 2012, started serving banks and other financial institutions in 2013. Introduced bureau or registry credit scores as a value added service Nicaragua; Tajikistan In Nicaragua in June 2013 the credit bureau TransUnion Nicaragua started offering the service of credit scoring based on its data.
  • 57.
    REFORMING THE BUSINESSENVIRONMENT IN 2013/14 45 TABLE 4A.1 Who reduced regulatory complexity and cost or strengthened legal institutions in 2013/14—and what did they do? Feature Economies Some highlights Strengthening minority investor protections Increased disclosure requirements for related-party transactions Benin; Burkina Faso; Cameroon; Central African Republic; Chad; Comoros; Democratic Republic of Congo; Republic of Congo; Côte d’Ivoire; Ecuador; Arab Republic of Egypt; Equatorial Guinea; Gabon; Guinea; Guinea-Bissau; Hong Kong SAR, China; India; Lao PDR; FYR Macedonia; Mali; Mongolia; Niger; Senegal; Togo; United Arab Emirates; Uzbekistan Uzbekistan adopted a new law on joint stock companies and protection of shareholder rights that establishes higher standards for disclosure of related-party transactions by interested directors and requires companies to include information on such transactions in their annual reports. Enhanced access to information in shareholder actions Benin; Burkina Faso; Cameroon; Central African Republic; Chad; Comoros; Democratic Republic of Congo; Republic of Congo; Côte d’Ivoire; Equatorial Guinea; Gabon; Guinea; Guinea-Bissau; Mali; Niger; Senegal; Togo; United Arab Emirates Senegal’s code of civil procedure, amended in August 2013, now permits judges to grant requests from parties to a civil case to compel evidence from the other party, as long as they are relevant to the subject matter of the claim. Expanded shareholders’ role in company management Dominican Republic; India; Republic of Korea; Switzerland Switzerland issued a federal ordinance against abusive remuneration in publicly listed joint stock companies. The ordinance introduced multiple safeguards, including establishing compensation committees and increasing the transparency of directors’ compensation schemes. Increased director liability The Gambia; India; United Arab Emirates India’s new companies act came into effect in 2014, bringing a host of enhancements, notably on the prevention of abuse by corporate insiders and company mismanagement. Making it easier to enforce contracts Increased procedural efficiency at main trial court The Bahamas; Czech Republic; Ireland; Portugal; South Africa; Uruguay The Bahamas and Portugal introduced new rules of civil procedure to streamline and expedite court proceedings and ensure less costly resolution of disputes. The Czech Republic, Ireland and South Africa amended the monetary thresholds for courts at different levels to reduce backlog. Introduced electronic filing Greece; Kazakhstan; Lithuania; Mauritius; Turkey Greece, Kazakhstan, Lithuania, Mauritius and Turkey all introduced an electronic filing system for commercial cases, allowing attorneys to submit the initial summons online. Introduced or expanded specialized commercial court Benin; Seychelles Benin established a commercial chamber within its court of first instance and assigned 6 judges to solely hear commercial cases. The Seychelles established a specialized commercial court and assigned a permanent local judge to resolve only commercial disputes. Expanded court automation Singapore Singapore launched a new electronic litigation system that streamlines litigation proceedings. Made enforcement of judgment more efficient Kosovo Kosovo introduced private bailiffs and strengthened its enforcement process by establishing penalties for noncompliant debtors. Making it easier to resolve insolvency Introduced a new restructuring procedure Mozambique; Seychelles; Slovenia; Trinidad and Tobago; Uganda Uganda established a reorganization procedure for insolvent but viable companies. Strengthened creditors’ rights Kazakhstan; Mexico; Mozambique; Switzerland; Uganda Kazakhstan expanded the rights of creditors in insolvency, making it possible for them to remove the debtor from management, nominate an insolvency representative and approve a plan for the sale of assets in case of liquidation. Improved the likelihood of successful reorganization Mexico; Seychelles; Slovenia; Switzerland Mexico introduced provisions allowing debtors to apply for post-commencement financing, establishing priority rules for post-commencement financing and permitting debtors facing imminent insolvency to apply for reorganization proceedings. Established framework for out-of-court restructuring FYR Macedonia; Slovenia; Spain Spain established a framework for a prebankruptcy, out-of-court payment agreement. Regulated the profession of insolvency administrators Mozambique; Trinidad and Tobago; Uganda Trinidad and Tobago created a public office responsible for the general administration of insolvency proceedings and clarified rules on the appointment and duties of trustees. Streamlined and shortened time frames for insolvency proceedings Kazakhstan; FYR Macedonia; Mexico FYR Macedonia tightened time frames for several stages of insolvency proceedings, including inventory and assessment of the debtor’s property, submission of creditors’ claims and the hearing to examine claims. Improved provisions applicable to voidable transactions Seychelles; Uganda The Seychelles introduced provisions allowing the avoidance of undervalued transactions or transactions made as a gift, if entered into within 2 years before the commencement of liquidation proceedings. Changing labor market regulation Altered hiring rules Cabo Verde; Croatia; Georgia; Italy; Mauritius; Portugal Cabo Verde introduced a minimum wage. Croatia lifted the 3-year limit on the duration of first-time fixed-term contracts. Changed redundancy cost and procedures Belgium; Croatia; Finland; France; Georgia; Portugal Finland eliminated the requirement to notify a third party before dismissing 1 or a group of 9 redundant employees. Note: Reforms affecting the labor market regulation indicators are included here but do not affect the ranking on the ease of doing business. Source: Doing Business database.
  • 58.
    Doing Business 2015 Going Beyond Efficiency Starting a business The growing efficiency of company registries Entrepreneurs should have the op-portunity to turn their ideas into a business. Often a first step is to formally register a company. Yet in many countries the bureaucratic obstacles and high costs imposed by inefficient com-pany registries deter people with good business ideas from embarking on the path of formal entrepreneurship. Formal registration has substantial benefits for businesses and for the economy as a whole. Registered companies can benefit from legal and financial services provided by courts and commercial banks, services not available to unregistered businesses. Their employees benefit from social security protections. And the economy benefits from positive spillovers: where formal entrepreneurship is higher, job creation and economic growth also tend to be higher.1 Moreover, as more businesses formalize, the tax base expands, enabling the government to spend on productivity-enhancing areas and pursue other social and economic policy objectives. As the first interface between the regu-lator and a potential new entrepreneur, company registries hold the key to the formal economy, providing businesses with a legal identity and empowering them to participate fully and within the framework of the law. Thus the relative ease or difficulty of start-up can have important economic consequences. Evidence suggests that regulatory re-forms making it easier to start a formal business are associated with increases in the number of newly registered firms and with higher levels of employment and productivity. Conversely, exces-sively cumbersome regulation of start-up is associated with higher levels of corruption and informality.2 WHAT IS AN EFFICIENT REGISTRY? Institutional efficiency at company registries is thus a critical element of a healthy economy.3 What makes an efficient registry? Answering that question first requires understanding what registries do. A company registry records and updates information on new and exist-ing companies in its jurisdiction and enables registered entities to comply with their obligations under the current regulatory framework, including those related to the company laws.4 In do-ing so, the registry incorporates legal entities, providing them with a unique identification, and deregisters insol-vent firms. Other services provided by a registry commonly include conduct-ing company name searches, reserving company names and processing ap-plications for business licenses. These functions enable the government to measure tax compliance or avoidance in the formal sector and to derive other business statistics by economic sector or by company size or ownership type. They also enable the government to determine which ƒ Company registries empower businesses to operate in the formal economy—and to reap the benefits that come with formalization. ƒ Online platforms for company incorporation make the process faster and cheaper. ƒ Electronic registration and online services substantially reduce the opportunities for bribery and other forms of corruption. ƒ Rwanda has made promoting private sector development a top priority on its reform agenda—and making it easier to register a business is part of that. ƒ Chile’s new online business registry experienced rapid take-up, accounting for nearly half of new registrations of limited liability companies in just 7 weeks. ƒ The United Kingdom’s corporate registry actively promotes the use of electronic services and data transparency.
  • 59.
    48 DOING BUSINESS2015 entities are eligible to participate in public tenders and bids (generally only formally registered companies). In addition, they promote consumer protection, as business licensing often represents a quality check to ensure that business activities in certain “high-risk” industries—such as food preparation and pharmaceuticals— meet the required health, safety and environmental standards.5 In evaluating a registry’s efficiency in providing daily services, several ele-ments are often considered to be key: a comprehensive electronic database, a one-stop shop and an online platform for business registration. An effective electronic database maintains up-to- date information and documents on both newly registered and existing companies and makes this information easily accessible, whether online or on-site at the registry’s office. Historically, records were kept in a paper-based for-mat. But the growing trend of comput-erization among company registries has enabled the electronic storage and maintenance of records. This not only helps reduce errors in inputting and updating business information but also speeds up searches. In addition, elec-tronic record keeping makes it easier to extract statistics. One-stop shops for business registra-tion have become increasingly com-mon. Globally, 100 economies have already launched one. And these 100 one-stop shops are quite widely dis-tributed, with 64 of them located in low- or middle-income economies. A one-stop shop provides a single service point for completing several business registration processes. It might consist of several windows or offices occupied by representatives from different government agencies that entrepre-neurs need to visit sequentially. Some one-stop shops are even “one-window shops”—providing a single point of in-teraction between an entrepreneur and all the government agencies involved in business registration. In these one-stop shops an entrepreneur can submit all the necessary documents at one window, and the documents are then distributed to the appropriate agencies for processing and approval. A GLOBAL TREND OF GOING ELECTRONIC Putting processes online takes efficien-cy one step further. Doing Business data show that among the 189 economies covered, 144 have introduced online platforms for business incorporation. These enable entrepreneurs to file incorporation documents electronically and sometimes even to complete the entire business registration process online. Company registries in 95 economies around the world reported extensive use of online services in the World Bank Group Entrepreneurship Survey in 2013. Among those in the sample, 60% offer an online application to register a business, and 58% allow entrepreneurs to register a business remotely. The most common online features offered include online company name search, electronic submission of documents and applications, online filing of annual accounts and the exchange of data between different agencies. In New Zealand and Singapore, for example, entrepreneurs can complete the entire business registration process online. Thanks to the interconnectivity be-tween different agencies’ systems, they can register their business with tax and social security authorities at the same time as they complete the incorporation process. Some economies, especially low- and middle-income ones, start the digiti-zation process by putting just some features online—such as conducting a company name search, filling out and submitting registration forms and obtaining an electronic identifica-tion number. In Costa Rica, Ecuador, Trinidad and Tobago, and Zambia en-trepreneurs can check the uniqueness and availability of company names online. In Kenya business registration reforms made it possible to complete the value added tax registration online. FIGURE 5.1 Company registries in high-income economies offer more electronic services Share of economies with electronic service available (%), 2013 100 80 60 40 20 0 High income Upper middle income Lower middle income Low income Online application Remote registration Electronic access to data Source: World Bank Group, Entrepreneurship Database.
  • 60.
    STARTING A BUSINESS49 To implement an effective online registration system, all paper-based registration records need to be digitized in a single database—and online name search, electronic document filing and online fee payment functions enabled. Streamlining data exchange with other government agencies to automate such actions as enrollment in tax and social security systems can further reduce processing times. Effective security measures are needed to ensure data security. And reliable internet and elec-tricity connections are critical to ensure that online platforms function properly. The most technologically advanced registries are concentrated in OECD high-income economies and Europe and Central Asia. Company registries in high-income and upper-middle-income economies tend to offer a much broader array of online services than those in lower-income ones (figure 5.1). This pat-tern is not surprising, because develop-ing and launching online services can be costly. Online platforms are usually designed by large international infor-mation technology consulting firms and can take months to implement. The cost can range from as low as $20,000 to as high as several million dollars, depending on the features included.6 In Nepal the Ministry of Finance allocated 32.20 million Nepalese rupees (about $447,000) over 3 years to modernize the country’s registration office.7 Once a system is in place, funds are needed to operate it. In Colombia the operating costs of the online national business registration database RUE, which is hosted on 9 different servers, amount to $1 million a year.8 WHAT ARE THE GAINS FROM GOING ELECTRONIC? Using online services for business regis-tration has several advantages. Online platforms make the process faster and more efficient by eliminating the need for entrepreneurs to travel to meet with FIGURE 5.2 Online registration makes starting a business faster and cheaper 35 30 25 20 15 10 5 government officials, wait in long lines and return if some information turns out to be missing or incorrect. Analysis of data from 71 economies shows that business registration for lim-ited liability companies is significantly faster in those using online platforms (figure 5.2). And in most cases online registration is either substantially less expensive than paper-based processes or costs the entrepreneur nothing at all. Using online registration services also greatly reduces the opportunities for corruption and bribery. Where entrepre-neurs have no need to interact directly with public officials, they are less likely to use informal payments or to face deliberate delays aimed at encouraging bribes. Analysis shows strong positive relationships between international measures of transparency or gover-nance quality—including rankings on the rule of law by the World Justice Project and rankings on voice and ac-countability, control of corruption and regulatory quality as measured by the Worldwide Governance Indicators—and the use of online systems for company 35 30 25 20 30 15 20 10 5 50 registration.9 Economies whose com-pany registry uses online registration, allowing entrepreneurs to set up new businesses remotely, tend to score high on such measures. THREE COUNTRY CASE STUDIES Three country case studies—on Rwanda, Chile and the United Kingdom—provide good examples of how corporate registries have improved efficiency and service quality over time. The choice of these countries is based on geographic diversity, adoption of good practices, consistent pace of business registration reform and avail-ability of data. Rwanda—promoting a competitive business environment The government of Rwanda has been working to improve the efficiency of business registration as part of broader business regulation reforms aimed at promoting private sector 0 0 Online registration Paper registration SCALE 0 10 40 Average cost (% of income per capita) Average time (days) Average time Average cost Note: The sample consists of 71 economies, with 20 having online registration. Data are for 2013. The relationship is significant at the 5% level after controlling for income per capita. Source: Doing Business database; World Bank Group, Entrepreneurship Database.
  • 61.
    50 DOING BUSINESS2015 1.2 1.0 0.8 0.6 0.4 0.2 development—a top priority on its re-form agenda. The reforms are driven by the conviction that an efficient business climate can reduce poverty by fostering economic growth and job creation.10 As part of a series of reforms of the start-up process, in 2008 the govern-ment established the Office of the Registrar General to maintain an ef-ficient business register and promote a competitive business environment. The new entity oversees the implementa-tion of applicable commercial laws, such as the Companies Act,11 and the registration and deregistration of busi-nesses. 12 By May 2009 it had set up a one-stop shop, streamlining company name checking, payment of incorpora-tion fees, and tax and company regis-tration procedures. As a result of these reforms com-pany registrations surged (figure 5.3). In 2009 alone, 3,028 new limited li-ability companies were formed—almost equivalent to the total for the previous 5 years, when 3,374 new limited liability companies had been registered. Further simplification of the start-up process followed as a new company law was en-acted in 2009. This helped sustain the annual increase in the number of new limited liability companies, a number that reached 6,655 in 2012.13 Today Rwanda’s Office of the Registrar General is focused on making its reg-istration system completely paperless by promoting electronic registration services. Other priorities include en-suring accurate and timely delivery of information on its services and raising awareness of the importance of formalizing businesses. Consistent with good practices in ensuring trans-parency, the Office of the Registrar General makes official fee schedules for business services easily available to the general public at its premises as well as on its website.14 Rwanda has made important strides in improving its business environment over the past 10 years. Its business regulation reforms have resulted in cost savings for the private sector estimated at $5 million, investments totaling $45 million and about 15,000 jobs.15 In 2006, before these reforms, starting a limited liability company in Rwanda took 9 procedures, 18 days and 235.5% of income per capita in fees. Today it takes 8 procedures, 6.5 days and 52.3% of income per capita. Rwanda, a country facing a range of other development challenges, has shown that improvements in the regulatory environment—including the adoption of global good practices—are well within the reach of low-income economies. Chile—creating a new online registry In recent years the government of Chile has been trying to reduce the size of the country’s informal sector and encourage entrepreneurs to formalize their businesses. In 2013, as part of these efforts, a new Chilean law made it possible for entrepreneurs to register limited liability companies through an electronic, unified company registry hosted by the Ministry of Economy and accessible from anywhere free of charge.16 The new law was part of a strategy aimed at continuing to en-hance the efficiency of public services through the use of the latest tech-nologies, moving the country closer to e-government and fostering entrepre-neurship and competitiveness. It was also motivated by the government’s desire to make further strides in the fight against excessive bureaucracy and red tape, a widespread problem in Latin America. Private sector associations supported the new law, but Chilean notaries ini-tially opposed it, because it dispensed with the requirement for the business incorporation services they offered. For business owners, however, the new law represented an opportunity to save time and money and to get access to the growing amount of funding that the Chilean government was investing in business start-ups. The electronic registration system— called “Your Company in One Day”—is FIGURE 5.3 A surge in newly registered firms after start-up reforms in Rwanda 0 2004 2005 2006 2007 2008 2009 2010 2011 2012 Year with reform New firm density Note: New firm density is defined as the number of newly registered limited liability companies per 1,000 working-age people (ages 15–64). Source: World Bank Group, Entrepreneurship Database.
  • 62.
    STARTING A BUSINESS51 Share of new companies created through online system (%) 50 40 30 20 10 not only a new process of incorporation but also a new company registry that runs alongside the existing paper-based one. It allows users to register a company online at no cost. All they need to do is to fill out an electronic form providing information about the company and its shareholders. The process takes only a few minutes and provides the certificate of existence instantaneously. The system also automatically assigns a taxpayer identification number to the newly reg-istered company, a function made pos-sible by the interconnectivity with the online platform of the tax agency. And through a web service, the system per-forms automatic identity checks with the tax and civil registry authorities. The rapid take-up of the online ser-vices testifies to the success of Your Company in One Day. Only 7 weeks after the launch, nearly half of new limited liability companies in Chile were being created through the new online registry (figure 5.4). In the first 8 months, the government estimates, more than 20,000 companies were created electronically. The number of limited liability companies registered through the electronic system in 2013 (more than 85,000) was more than twice the number created in 2009 (close to 39,000). The ultimate goal should be to reach an electronic regis-tration rate of nearly 100% (see the U.K. case study as an example). Chile’s online company registry has allowed greater productivity among business founders by making the incorporation process faster and more convenient. And more changes are set to come. The online registry is built for expansion, and the government plans to add new services as well as to allow other types of legal entities to incorpo-rate electronically. The United Kingdom— simplifying start-up In the United Kingdom interacting with the national business registry— Companies House—is an imperative for starting a business. According to the 2006 Companies Act and its 1985 pre-decessor, all new limited liability com-panies must register with Companies House to do business. Before the digital age this was often a costly and labori-ous task. It involved visits to Companies House, long lines and the higher costs associated with postal mail. Company founders often had to hire solicitors to handle paperwork such as the articles of association. But Companies House has greatly simplified the process—by introducing electronic filing in 2001, increasing the transparency of its data and provid-ing model articles of association for FIGURE 5.4 Chile’s online system was soon registering almost half of new limited liability companies 0 Week 1 Week 2 Week 3 Week 4 Week 5 Week 6 Week 7 Note: Data cover the period May 2–June 16, 2013. Source: Chile, Ministry of Economy, Register of Companies (Registro de Empresas y Sociedades). FIGURE 5.5 Electronic registration has become almost universal in the United Kingdom 4 3 2 1 0 Share of new companies registered electronically (%) 1990 1995 2000 2001 2003 2005 2007 2009 2010 2011 2012 2013 2014 0 Total number of registered companies (millions) 100 75 50 25 Share of new companies registered electronically Total number of registered companies Note: Data for 2014 are projected. Source: U.K. Companies House 2013a.
  • 63.
    52 DOING BUSINESS2015 companies.17 These changes have made incorporation faster, more convenient and less expensive. Now entrepre-neurs can register their business with Companies House in just a few hours by simply filing incorporation docu-ments. All the incorporation forms are available at no cost on the Companies House website and come with detailed instructions. Registration can be done online or at the Companies House office, where computers are available to enable entrepreneurs to register electronically. Entrepreneurs are making good use of the electronic filing option. The share of new companies registered electroni-cally grew sharply in the first few years, rising from around 25% in 2001 to 95% in 2009 (figure 5.5). Indeed, electronic filing has become virtually universal, with more than 98% of new companies registered electronically in 2013.18 Besides offering online registration, Companies House has also simpli-fied the preregistration process. One important step was to increase the transparency of registry data, mak-ing initial business start-up research easier. Companies House made basic information on existing companies available at no charge in 1996, allowing business founders to easily conduct name searches both online and in its office. Today Companies House pro-cesses 235 million free basic company information searches online or through its mobile application every year. Beginning in 2012, Companies House expanded its company information to include company number, address, sta-tus, incorporation date, accounts and filing dates for annual returns. There were almost 15,000 unique downloads of this company information data set in 2013.19 Over the past decade, as Companies House has increased its data transparency, electronic procedures and free resources for business founders, the number of registered companies in the United Kingdom has doubled. CONCLUSION Many economies have modernized their company registries, offering a wide array of online services for a lower fee or at no cost at all. But many others lag behind. For low-income economies, introducing online platforms may not be an affordable or practical solution, especially if electricity shortages are common. But other steps can be taken to increase the efficiency of business registration. For example, economies could create physical one-stop shops— or improve existing ones—to streamline incorporation processes and coordi-nate the work of different agencies. Improving the efficiency and transpar-ency of company registries can not only make incorporation faster and cheaper; it can also reduce the opportunities for corruption and bribery associated with business start-up processes. Two important (and related) observa-tions emerge from this comprehensive overview of the Doing Business data on business start-up. First, a low level of income need not be an insurmount-able obstacle to implementing reforms that reduce the complexity and cost of regulatory processes and improve the quality of the underlying institutions. And second, as the latest informa-tion and communication technologies spread around the world, low-income economies will find a broader range of opportunities to adopt good prac-tices used in higher-income economies, further contributing to the process of convergence seen in the Doing Business indicators. A growing number of economies with difficult business environments are gradually adopting the practices seen in those with more business-friendly climates. NOTES This case study was written by Baria Nabil Daye, Paula García Serna, Julie Ryan and Valentina Saltane. 1. Fritsch and Noseleit 2013. 2. Motta, Oviedo and Santini 2010; Klapper and Love 2011. 3. While in some economies the registry is the first and only interface for formally commencing business operations, in other economies the start-up process involves other government agencies as a result of more burdensome regulations. 4. See, for example, the website of the Companies Office of Jamaica at http:// www.orcjamaica.com/profile/ and that of the Companies Registry of Hong Kong at http://www.cr.gov.hk/en/home/. 5. De Sa 2005. 6. Wille and others 2011. 7. “IFC Helps Nepal Simplify Business Registration,” World Bank Group, https:// www.wbginvestmentclimate.org /advisory-services/regulatory-simplification /business-regulation/business-entry /nepal-business-registration.cfm. 8. World Bank Group, Investment Climate Advisory Services 2009. 9. The relationship is significant at the 5% level after controlling for income per capita. 10. “Rwanda’s Vision 2020: Improving the Investment Climate for Private Sector Development,” World Bank Group, http:// go.worldbank.org/2U51FR33M0. 11. Rwandan Law 07/2009 relating to companies, April 27, 2009. 12. Information from the website of the Rwandan Office of the Registrar General at http://org.rdb.rw/. 13. World Bank Group, Entrepreneurship Database. 14. Information from the website of the Rwandan Office of the Registrar General at http://org.rdb.rw/. 15. World Bank Group, Investment Climate Advisory Services 2013. 16. Simplifica el régimen de constitución, modificación y disolución de las sociedades comerciales, Chilean Law 20.659, January 22, 2013. 17. Moss 2014. 18. U.K. Companies House 2013b. 19. U.K. Companies House 2013a.
  • 64.
    Doing Business 2015 Going Beyond Efficiency Zoning and urban planning Understanding the benefits Sound regulation of construction helps strengthen property rights, protects the public from faulty building practices and contributes to the process of capital formation.1 But if procedures are too complicated or costly, builders tend to proceed without a permit.2 By some estimates 60–80% of building projects in developing econo-mies are undertaken without the proper permits and approvals.3 For many entrepreneurs, construction regulation is an important consideration when deciding where to establish their business. According to a competitive-ness report by KPMG, construction costs are the 5th most important factor determining the location of a start-up in the United States and the permitting process is the 17th most important.4 One element of construction regulation is zoning, which regulates the location and use of certain types of buildings within a city. HOW DOES ZONING RELATE TO CONSTRUCTION PERMITTING? Zoning is an essential tool in successful urban planning. Maps divide com-munities into different zones based on the types of uses allowed—such as residential, commercial, industrial, public buildings, parks and green areas. In most economies with zoning plans, each zone has its own ordinance gov-erning development within that sec-tion. These ordinances determine such factors as building size, height, shape and color; building location; and urban densities.5 Zoning regulations can provide a useful framework for investors and develop-ers by specifying the most appropriate location for their projects before they apply for a construction permit (figure 6.1). They can also help municipal authorities establish a consistent and predictable basis for granting construction permits and approving or rejecting construction proposals. Having an up-to-date zoning system is therefore essential not only in support-ing the coordination among agencies that is needed for prosperous urban planning but also in ensuring efficiency in granting construction permits. Also important is that such zoning systems be developed through a consultative process with broad participation, to ensure that they benefit all social groups. HOW CAN ZONING AFFECT ECONOMIC DEVELOPMENT? Through zoning, governments can ensure the proper use of land and avoid mixing incompatible land uses. Zoning has been used as a regulatory tool to respond to changing environ-mental and development conditions as well, including flooding, rising sea levels and the loss of infrastructure.6 Zoning regulations that take into ac-count environmental threats such as flooding protect citizens by ensuring ƒ Zoning—the process of planning for land use across geographic areas—can help avoid the mixing of incompatible land uses. This has both environmental and economic benefits. ƒ Zoning practices vary widely around the world. Economies with an efficient and effective zoning process make zoning maps of cities accessible to builders. Others limit access to the building permit authority, which checks the zoning compliance of permit applications. Still others have no zoning system at all. ƒ Among OECD high-income economies the process for obtaining a building permit, as measured by Doing Business, takes 19 fewer days on average in those where the process includes zoning procedures than in those where it does not. ƒ In New Zealand all municipalities have a detailed, up-to-date zoning plan that has been approved through a process with intensive public involvement—including public hearings to allow residents to offer suggestions or objections. ƒ Guatemala, a recent success story, introduced a land management plan in its capital city in January 2009. A new zoning system established zones based on the general use of land, including mixed-use zones.
  • 65.
    54 DOING BUSINESS2015 that future development keeps them and their possessions out of harm’s way. More generally, zoning plans can promote the conservation of energy and natural resources, foster a greener environment, improve sustainability and enhance the ability to adapt to climate change. A good zoning plan can help reduce greenhouse gas emissions by cutting down on vehicle travel—such as by promoting higher-density development and concentrating residential develop-ment near job centers. A zoning plan can also help reduce greenhouse gas emissions by promoting an adequate and accessible public transportation system.7 By ensuring that certain municipalities include new areas for housing development and new indus-tries, zoning plans can help address the challenges associated with demo-graphic change and shifts in business activity. In addition, municipal zoning can protect and improve the health of citizens by removing or minimizing pol-lution from industrial plants and con-tamination from landfills and sewage. Zoning can help ensure an adequate supply of safe water and the suitable disposal of waste. And it can enhance property values—by reducing pollu-tion, providing suitable light, avoiding overcrowding and traffic congestion, developing green zones and offering proximity to schools, hospitals and other public necessities.8 But where a zoning process is too complex or restrictive, it can have an adverse effect on factors such as hous-ing supply and prices. Consider the ex-ample of Sweden, where zoning policies mandate that municipalities must ap-prove a detailed development plan for most housing projects before issuing a construction permit. According to the Stockholm Planning Department and an OECD study, more than half of all construction projects—including most apartment buildings—involve designing or modifying a detailed development plan.9 This can take 18 months on av-erage, according to estimates from the municipality of Stockholm, and in 20% of cases it can take 3–4 years.10 Many researchers agree that administrative FIGURE 6.1 Where does zoning generally fit into the construction permitting process? Builder decides on type of construction project. Builder obtains zoning approval (recorded by Doing Business as a separate procedure only if builder is required to obtain approval directly from the relevant agency). Builder prepares the necessary drawings and other required documentation. Builder applies for the necessary preapprovals for the project (if required), such as land use approval, environmental approval and fire safety approval (including any necessary inspections). Builder applies for and obtains a building permit. Builder begins construction and receives either random or phased inspections during construction by the relevant parties. Builder completes construction and receives final inspection from the relevant parties to ensure that the construction was completed in compliance with building regulations and the conditions set forth in the building permit. Builder receives a completion certificate or occupancy permit, ensuring that the building is ready to be occupied. Builder applies for and obtains the final water and sewerage connection from the water and sewerage authorities. In some instances builder must apply for a zoning certificate or zoning approval for the intended location of the project. The relevant authority consults the zoning maps of the city to determine whether the project will be built in an appropriate location, based on its specifications. In some instances builder may consult the zoning maps while the relevant authority simply does a verification check when reviewing the permit application. Source: Doing Business database.
  • 66.
    ZONING AND URBANPLANNING 55 barriers to new construction are one of the 2 main factors (the other being rent control policies) that have led to a housing shortage in Sweden over the past decade.11 WHAT ARE SOME GOOD PRACTICES IN ZONING? Recognizing the importance of zoning and urban planning, many economies require builders to obtain some form of zoning or urban planning approval before building or even before obtaining a construction permit. This is done to ensure that the intended building will be located in the appropriate zone (industrial, commercial or residential) according to the city’s zoning require-ments. But economies go about this process in different ways. Some economies complete the process efficiently and effectively by mak-ing zoning maps of cities accessible to builders (in some cases online). In these cases builders access the maps to verify that their project’s intended location is in compliance with zoning regulations, and they can include this information with the building permit application. In Swaziland, for example, builders are responsible for checking the zoning maps and including the zon-ing information when submitting their permit application to the municipality. In the United States builders in New York City must complete a zoning diagram form available online and sub-mit it along with other required forms to the Department of Buildings. The Department of Buildings will still review the form to check that the project complies with the city’s zoning policies. In other economies the permit-issuing authority checks the zoning compli-ance itself after receiving the building permit application. In The Bahamas, for example, a builder is required only to submit a permit application to the Building Control Unit. This unit then automatically forwards the applica-tion to the Town Planning Department for zoning approval, with no involve-ment from the builder. In Belize the Building Plan Committee of the Central Building Authority checks the permit application to ensure compliance with zoning, environmental and fire safety requirements. Neither of these processes requires the builder to take the extra step of actually obtaining a zoning approval before applying for a building permit— a good-practice scenario if completed efficiently without significant delays. But efficiency is not all that is impor-tant. Around the world, good zoning systems also need to be broadly inclusive, incorporating all groups in society to bring about positive social outcomes. They also need to be regu-larly updated to reflect changing needs and developments. Sixty-five of the 189 economies cov-ered by Doing Business do require that builders go through the additional step of getting urban planning ap-proval before obtaining a construction permit. Of those 65, the largest shares are in Europe and Central Asia (26%) and Latin America and the Caribbean (22%) (figure 6.2). This is a second-best scenario: a zoning system is still in place and zoning compliance is still verified, though not in the most ef-ficient way. Nevertheless, requiring verification of zoning compliance is better than having no zoning system at all—with builders able to construct any type of project in any part of the city. Thirty-six of the 65 economies require builders to obtain approval to build in their intended location before they can receive a construction permit (table 6.1). Twenty-two of these 36 economies require a zoning permit as this form of approval. A zoning permit or zoning clearance signifies that the land use for the planned development is consistent with the zoning regulations. In Canada the building code requires a builder to obtain a zoning permit before even applying for a site plan approval and the technical review of a development application. Among the 22 economies requiring a zoning permit, some issue it more expeditiously than others. In the Philippines it takes 5 days on average to obtain the site clearance from the City Planning and Development Office that a builder must have to apply for a construction permit. In Bangladesh obtaining a zoning clearance from the Capital Development Authority (Rajuk) in Dhaka takes 45 days on FIGURE 6.2 Half the economies that require the additional step of obtaining a zoning or urban planning approval are in Europe and Central Asia or Latin America Latin America Caribbean (14 of 32 economies) Middle East North Africa (7 of 20 economies) 12% OECD high income (9 of 31 economies) East Asia Pacific (8 of 25 economies) Sub-Saharan Africa (8 of 47 economies) South Asia (2 of 8 economies) Europe Central Asia (17 of 26 economies) 26% 22% 14% 12% 11% 3% Note: The numbers in parentheses are the number of economies out of the total in each region that require the additional step of obtaining a zoning or urban planning approval. Source: Doing Business database.
  • 67.
    56 DOING BUSINESS2015 average, while obtaining one from the Chittagong Development Authority takes 40 days on average. In other economies the process is entirely different. In Belgium, for ex-ample, an urban planning certificate is required only for large-scale projects. This certificate not only verifies that the project can be built in the specified zone but also guarantees that the con-struction permit will be issued without problems—because much of the verifi-cation for the permit is done as part of the process for issuing the certificate. For smaller-scale projects all plan-ning regulations are available online. These regulations are set at several levels—regional, municipal or special zoning—providing several options for verifying the regulatory compliance of the project. In 29 of the 65 economies there is no legal requirement to obtain an urban planning clearance or certificate. But architects normally request a certificate because it provides all the information needed to ensure that architectural plans are in compliance with building regulations. In some economies the information is available online, but in most the information can be obtained upon request. IS PERMITTING MORE EFFICIENT WITH ZONING? While obtaining a zoning or urban plan-ning clearance represents an additional step in the construction permitting process, this does not necessarily mean that economies that require this step have inefficient permitting systems. Consider OECD high-income econo-mies. As measured by Doing Business, the process for obtaining approval of a building permit takes 43 days on average in those where it includes zoning procedures, 62 days in those where it does not. Obtaining a zoning or urban planning clearance actually speeds up the process—by 19 days on average in these OECD high-income economies—especially where the builder can obtain the clearance directly on-line. The reason is that this step avoids back-and-forth interactions between the permit-issuing agency and the architect or even outright rejection of the project because of noncompliance. On average across all 65 economies that require the additional step, ob-taining the zoning or urban planning clearance takes 26 days (of a total of 177 days on average to comply with all formalities to build a warehouse) and costs $402 (of a total of $15,709). These economies generally require only TABLE 6.1 What type of clearance is needed in economies with zoning requirements? Zoning permit is mandatory Urban planning clearance or certificate is mandatory Urban planning clearance or certificate is generally obtained but not mandatory Afghanistan Albania Algeria Argentina Bosnia and Herzegovina Antigua and Barbuda Australia Côte d’Ivoire Bahamas, The Bangladesh Ecuador Bahrain Bolivia Iran, Islamic Rep. Cameroon Canada Kosovo Cyprus Comoros Lebanon Finland Costa Rica Macedonia, FYR France Czech Republic Madagascar Kazakhstan Dominican Republic Moldova Latvia El Salvador Nicaragua Lithuania Fiji Serbia Montenegro Indonesia South Africa Morocco Kuwait Spain Netherlands Mexico New Zealand Namibia Palau Philippines Papua New Guinea Puerto Rico (U.S.) Qatar Solomon Islands Romania United States Russian Federation Uruguay Senegal Venezuela, RB Singapore Sudan Tajikistan Trinidad and Tobago Turkey Ukraine Uzbekistan Vanuatu Note: A zoning permit signifies that the land use for the planned development is consistent with the zoning regulations. An urban planning clearance or certificate generally outlines conditions relating to the plot of land where the builder intends to build, including where construction is permitted on the plot (that is, the specific coordinates). Source: Doing Business database.
  • 68.
    ZONING AND URBANPLANNING 57 one procedure to obtain the zoning cer-tificate or clearance. Very few require a site inspection as part of this process, but in those that do, the overall permit-ting system tends to be less efficient. In Indonesia, for example, a builder must first request a city planning permit and building site plan—in Jakarta, from the zoning office, and in Surabaya, from the one-stop shop—then receive an on-site inspection and finally receive the city planning permit. This process takes 22 days on average in Jakarta (where the entire construction permitting process takes 202 days) and 23 days in Surabaya (where the entire process takes 243 days). By contrast, Namibia requires only one zoning procedure: the builder must consult with the Town Planning Department to ensure that the land is in the correct zoning area. Zoning approvals are issued on the spot and at no cost. Overall, zoning requirements can lead to more efficient and less costly con-struction permitting systems. They can help guarantee compliance with zoning regulations even before the permit-issuing agency receives the building permit application. This allows architects and engineers to finalize the building specifications with the knowl-edge that there will be no need to ad-just them later in the process because of possible zoning issues. TWO EXAMPLES OF GOOD PRACTICE New Zealand and Guatemala both provide examples of well-implemented zoning systems. In New Zealand all mu-nicipalities have a detailed, up-to-date zoning plan that has been approved through a participatory process and supports an efficient construction permitting system. And in Guatemala planning authorities in the capital city recently switched to a mixed-use land planning system and digitized the zoning maps—all in the span of just 5 years. Construction activity has increased substantially under the new zoning system in Guatemala City. New Zealand—an efficient and predictable process New Zealand illustrates the use of mu-nicipal planning and zoning as a tool to facilitate the construction permitting process. Its planning and zoning regula-tions are among the world’s most effi-cient. They are comprehensive, predict-able and streamlined in implementation. New Zealand uses 2 main types of plan-ning documents: regional plans and district plans. Regional plans specify general requirements, such as air and water quality and the use of coastal areas. District plans are detailed plan-ning guidelines that outline the specific land use and design requirements for builders. The district plans are legally bind-ing, cover the entire usable land in a municipality and are periodically re-viewed to ensure that they reflect the changing urban needs. Each district plan is approved through a participato-ry process in which the district council holds public hearings to allow residents to submit suggestions or objections. Once the residents’ comments have been processed, the plan becomes “operative”—as a statutory document that regulates land development ac-tivities for the entire municipality. This means that all municipalities in New Zealand have a detailed, up-to-date zoning plan in place that has been approved through meaningful public involvement. The plan provides inves-tors and developers with a reliable ref-erence to guide them in the design and conceptual stage of a project, before they apply for a construction permit. And it provides municipal authorities with a consistent basis for approving or rejecting construction permits, with little discretion involved (figure 6.3). FIGURE 6.3 New Zealand’s district plans support an efficient, predictable process for construction permitting The district plan specifies 6 categories of construction projects—ranging from permitted to prohibited. A project not in the permitted category requires a resource consent, an official approval verifying compliance with the resource use requirements of the district plan. Apply for a construction permit No Apply for a resource consent Provide an assessment of environmental effects Provide a written consent from the affected parties Undergo public hearings No Notify directly affected parties and obtain the resource consent Yes Yes Is the land plot in a permitted zone? Is the project complex? Source: “An Everyday Guide to the Resource Manangement Act Series 1.1: Getting in on the Act,” New Zealand, Ministry of Environment, http://www.mfe.govt.nz/publications/rma/everyday/overview/.
  • 69.
    58 DOING BUSINESS2015 Municipalities face official time limits for making a decision—20 working days for simple cases and 4 months for more complex cases that involve public hearings. According to Doing Business data, most complex cases are processed in 100 days. There are 3 main factors behind the efficient processing of construction permits in New Zealand in cases where a change in zoning is necessary. First, there are clearly defined steps for mod-ifying a zoning plan (that is, obtaining a resource consent), requiring differ-ent levels of review depending on the complexity of the project. A resource consent is not required if the proposed construction is already in a permit-ted zone. Second, there are objective criteria for municipalities to use in making a decision to approve or reject a construction proposal—an assess-ment of environmental effects and a written consent from affected parties. And third, there are official time limits for completing each procedure related to obtaining a resource consent (zoning modification) or construction permit.12 Guatemala—a recent success story Until 5 years ago Guatemala’s capital city had a weak zoning system with no digital zoning maps. In January 2009, however, the Municipality of Guatemala City adopted a new land management plan that established land use classifi-cations based on 10 objectives: ƒ Encourage access to housing and diversify its supply ƒ Promote high-density construction where there is an adequate trans-port network ƒ Limit construction in high-risk areas and protect natural and historically significant areas ƒ Ensure public participation in local land use planning ƒ Ensure compatibility in the use of buildings in close proximity ƒ Encourage mixed land use ƒ Create public spaces with high urban vitality ƒ Promote an interconnected road network ƒ Provide certainty to owners and investors, including by promoting the desired urban development practices through incentives ƒ Secure the necessary resources for municipal investment While the old system had divided the land into industrial, residential and com-mercial zones, the new one established zones according to the general use of land, a change that included introducing mixed-use zones. The city was divided into 6 main zones that range from rural to more urban (table 6.2). The municipality developed the new plan in consultation with both the private and public sector and widely publicized it. The zoning maps have been digitized over the past 5 years, and the process is now complete for the entire city. Builders can access the maps through an online link to verify that a planned building is in compliance with the city’s zoning system before applying for a building permit.13 The new zoning system has shown positive results, including a substantial increase in construction activity, a welcome development given pervasive shortages. The square meters of con-struction authorized by Guatemala City’s one-stop shop for construction permitting almost doubled in the first few years, rising from 1.1 million in 2009 to 2.08 million in 2013.14 And the munici-pality expects to authorize 2.2 million square meters by the end of 2014. But implementing the system was not without its challenges. Some citizens felt that the government was regulat-ing what they could do with their own land. And many objected to the notion of mixed land use, fearing an increase in negative externalities such as noise and traffic in residential areas. In introducing TABLE 6.2 Zoning classifications in Guatemala City’s new land management plan Zone Share of total land in Guatemala City (%) Primary use of zone Share of buildings in zone that can be residential (%) G0—natural 18 Natural reserve areas where residential buildings are not allowed for environmental reasons and because of high risk levels 0 G1—rural 20 Areas that are still rural or agricultural with an intermediate level of risk, where low-density residential buildings are allowed though preservation of the environment is a priority 75 G2—semiurban 9 Areas where low-density buildings in closer proximity are allowed but because of location or topography, preservation of the environment is a priority 75 G3—urban 37 Areas that comprise most of the city’s currently urbanized area, including a medium density of single-family and multi-family dwellings 50 G4—central 13 Areas with a high density of mid-rise buildings, where most of the land has been developed and open spaces have been converted into public parks 35 G5—núcleo (core) 3 Areas with a high density of high-rise buildings and towers, where most of the land has been developed and open spaces have been converted into public parks 25 Source: “Plan de Ordenamiento Territorial,” Municipality of Guatemala City, http://pot.muniguate.com/docts _soporte/07_procedimientos_pot.php.
  • 70.
    ZONING AND URBANPLANNING 59 mixed land use, however, the municipal-ity was seeking to address both traffic issues, by reducing the need for long commutes, and security concerns, by ensuring that all neighborhoods would have activity throughout the day. CONCLUSION Without properly implemented zoning systems, urban planning becomes dif-ficult, as does ensuring the proper uses of land and mitigating environmental concerns. Recognizing the importance of zoning and urban planning, many economies have adopted zoning systems to varying extents. These economies require builders to obtain some form of zoning or urban planning approval before building or even before obtaining a construction permit. These requirements can lead to more efficient and less costly construction permitting systems. NOTES This case study was written by Marie Lily Delion, Anushavan Hambardzumyan, Joyce Ibrahim, Ana Maria Santillana Farakos and Melissa Scanlan. 1. World Bank Group, Investment Climate Department 2013. 2. Moullier 2009. 3. De Soto 2000. 4. KPMG 2009. 5. Grannis 2011; Neumann 2014. 6. Grannis 2011. 7. Schaffner and Waxman 2009. 8. Crone 1982; Karkkainen 1994. 9. In-depth interview with an expert in the Stockholm Planning Department conducted by the Doing Business team on December 5, 2013; Hüfner and Lundsgaard 2007. 10. “Planprocessen,” City of Stockholm, http:// www.stockholm.se/TrafikStadsplanering /Stadsutveckling/Stadsplanering /Planprocessen/. 11. Swedish National Board of Housing, Building and Planning 2013. 12. For more information on New Zealand’s zoning system, see the chapter on urban planning and construction permitting in World Bank (2014b). 13. Zoning maps are available on the website of the Municipality of Guatemala City at http://vu.muniguate.com /index.php?id=14opc=10. 14. Statistics provided by the Municipality of Guatemala City.
  • 71.
    Doing Business 2015 Going Beyond Efficiency Registering property Measuring the quality of land administration systems Insecure title to land prevents people from taking full advantage of the productive uses of the land.1 Where people have proper title to their land, however, they can use the property as collateral for a loan or transfer land par-cels in which they have invested.2 And titles can serve as a valuable insurance and savings tool for families, providing protection during difficult times and in retirement. Indeed, with the protection of secure title guaranteed by a reliable land registration system, land can be used to create wealth for the broader benefit of society and contribute to the eradication of poverty. Because land and buildings account for between half and three-quarters of the wealth in most economies, having a reliable system for registering and transferring property titles matters.3 Doing Business, through its registering property indicators, measures the efficiency of property registration systems through the time, cost and number of procedures required to transfer a commercial property. These indicators do not provide information on the overall quality of land admin-istration systems. This year, for the first time, Doing Business has collected preliminary data in 170 economies on the reliability, transparency and coverage of land registration systems and on land dispute resolution (figure 7.1). Next year Doing Business will refine the newly collected data and intends to add a new indicator on the quality of land administration to its current set of registering property indicators. ƒ This year Doing Business has collected new data in 170 economies on the overall quality of land administration systems through a set of indicators on reliability, transparency, coverage and dispute resolution. ƒ Half of economies around the world use an electronic database for checking for charges on property (encumbrances)—and half have a geographic information system for recording maps. ƒ In 72% of economies the land registry makes fee schedules publicly available, either online or on public display boards. ƒ Only 56 economies make statistics about transactions at the land registry publicly available, and only 63 provide specific means for filing an official complaint about land services. ƒ Around the world, 27% of economies have a registry with full coverage of private land, and 34% a mapping system with complete coverage. ƒ A reliable, transparent, complete and secure land registration system is associated with greater access to credit, lower income inequality and a lower incidence of bribery at the land registry. FIGURE 7.1 What do the data on the quality of land administration systems cover? Reliability Data on reliability assess whether the land registry and mapping system (cadastre) have adequate infrastructure to guarantee high standards and reduce the risk of errors. Reliable land administration systems can provide up-to-date information that is sufficient to make meaningful inferences on ownership. Data on transparency record whether the land administration system makes land-related information publicly available. This can inform the public about transaction possibilities and foster the development of a unified and more efficient land market. Data on coverage assess the extent to which the land registry and mapping system (cadastre) provide complete geographic coverage of privately held land parcels. To be accessible to third parties, and thus enforceable to anyone, all transactions need to be publicly verified and authenticated at the registry. Data on dispute resolution measure the accessibility of conflict resolution mechanisms and the extent of liability for entities or agents recording land transactions. Unclear responsibilities in land transactions lead to more land disputes, diverting land from productive uses. Clear responsibilities can help keep the number of unresolved disputes low. Transparency Coverage Dispute resolution
  • 72.
    REGISTERING PROPERTY 61 HOW TO PROVIDE RELIABLE INFORMATION? A reliable land administration system provides clear information on the ownership of property, supports the security of tenure and facilitates the development of a land market (figure 7.2). It also inhibits fraudulent actions, such as using false documents to conduct land transactions or selling properties multiple times without the knowledge of the true owners. One key to fulfilling these functions is to have in place the infrastructure needed to maintain land information, supported by an appropriate institutional frame-work and adequate capacity. Doing Business has developed a series of questions to assess the quality of the infrastructure of land administration systems. These questions focus mainly on how land records are stored at the land registry, whether the informa-tion is kept in an electronic database, whether the databases for landowner-ship and maps are linked and whether each parcel has a unique, searchable identification number. In many economies property titles are registered manually and most titles remain stored in paper archives with restricted access. In 62 economies property titles are kept only in paper format. Relying on a paper-based FIGURE 7.2 What does land administration cover? Land administration Land registration system system increases the time required to conduct a title search and the oppor-tunities for fraud.4 It also increases the vulnerability of the records to political instability, poor climate conditions, natural disasters or such incidents as the Great Chicago Fire of 1871, which destroyed almost all the city’s real es-tate records. More recently, in Kosovo the entire cadastral system had to be reconstructed after years of armed conflict led to the loss or destruction of the system’s records.5 In Pakistan the floods of 2010 destroyed thousands of paper land records, leading to the loss of the only evidence that people had of their land tenure.6 There was no backup. Computerization can provide a backup system to protect information. It can also make cross-checking data easier Surveying and mapping system for the public agencies that deal with land issues as well as for the general public. Many economies are moving toward computerized land administra-tion systems. Over the past 6 years 51 economies computerized their land registries. Mozambique, where a flood affected land records in 2000, scanned most of its titles in 2013. Mauritius implemented a new electronic system that allows the automatic population of property registration information dating back to 1978 and enables differ-ent branches of the Registrar General Department to share information. Other economies scanned all their historical records. Digital records also make it easier to access key information on the legal status of properties. An electronic da-tabase for encumbrances can quickly show whether there is a mortgage or other charges on a property or any other limitations that would impede its sale to a third party. According to Doing Business research, half of economies around the world have an electronic database for rights and encumbrances (figure 7.3). Cadastral maps play an important part in increasing tenure security—by providing information about the physical characteristics of land, the boundaries of parcels and any changes in those boundaries. They can also help ensure a stable source of public revenue by supporting more complete A land registry records the ownership and other legal rights over land. The function of land registration is to provide a safe and certain foundation for the acquisition, enjoyment and disposal of rights in land. A property map index (cadastre) provides descriptions of land parcels in a specific jurisdiction based on land surveys. It typically includes information about the location, owner and zoning use of parcels. It can be used for land taxation purposes. FIGURE 7.3 Half of economies have an electronic database for encumbrances—and half have a geographic information system Share of economies with an electronic database for encumbrances (%) Share of economies with a geographic information system (%) High income Upper middle income Lower middle income Low income 90 80 70 60 50 40 30 20 10 0 High income Upper middle income Lower middle income Low income 90 80 70 60 50 40 30 20 10 0 Source: Doing Business database.
  • 73.
    62 DOING BUSINESS2015 coverage of property taxes.7 A case in point was the Maputo Structure Plan in Mozambique—an initiative to col-lect geographic data that was aimed at aiding the physical development of the capital but that also has the potential to help further improve the collection of property taxes.8 Today, half of economies around the world have a geographic information system in place—a computerized system that can capture, store and analyze geographic data. While most are high-income economies, some are low- and middle-income economies. In Sub- Saharan Africa, for example, South Africa and Swaziland both have an electronic database to record property boundaries, check maps and provide updated geographic information on land parcels. Linking the land registry with the cadastral system has important advantages. It helps in maintaining up-to-date records on the legal rights to properties and the spatial charac-teristics of land plots, thus increasing tenure security. And it provides a single point of contact for those conducting land transactions.9 In recent years several economies, mostly in Europe and Central Asia, have merged their land registries and cadastral systems. For example, the Russian Federation created a unified electronic land and property registry in 2013 by merging the state registry of immovable prop-erty and the state topographical and cadastral mapping system. Having all agencies use a single iden-tification number for property is also beneficial. It allows quick identification of the legal status of a parcel, provid-ing greater certainty for the parties engaged in a transfer of property and reducing the likelihood of mistakes. A majority of economies use a single identification number, with the highest shares doing so in Europe and Central Asia, the OECD high-income group and the Middle East and North Africa. HOW DOES TRANSPARENCY SUPPORT QUALITY? Transparency is a key element in the quality of land administration systems. It helps eliminate asymmetries in in-formation between users and officials in a land administration system and increases the efficiency of the land market.10 Doing Business has collected data about transparency through a set of questions focusing on who has ac-cess to land information, whether the fee schedule for land registry services is publicly available, whether there are service standards for property transac-tions, whether statistics about land transactions are collected and made available to the public and whether any specific mechanism is in place for filing a complaint. Transparency in a land administration system provides a defense against requirements for informal payments, such as to register property, change a title, acquire information on land or process cadastral surveys. Complicated processes and limited availability of information in the land sector facilitate such bribery.11 But a transparent land administration system—one in which all land-related information is publicly available, all procedures and property transactions are clear, and information on fees for public services is easy to access—minimizes the possibilities for informal payments and abuses of the system. Indeed, cross-country data show that the greater the quality and transparency of a land administration system, the lower the incidence of bribery at the land registry (figure 7.4). Among all economies included in the re-search, 45 do not make the fee sched-ule for land registry services publicly available. In 7 of these economies the fee schedule is not accessible, and in 38 it is accessible only by asking for it in person from a public official. In stark contrast, 83 economies make informa-tion on fee schedules available online. Some economies go even further: FIGURE 7.4 A better and more transparent land administration system is associated with a lower incidence of bribery at the land registry Score on overall quality of land administration Reported incidence of bribery for land services (%) 80 70 60 50 40 30 20 10 0 0 5 10 15 20 25 30 Note: The score on the overall quality of land administration is obtained through a set of questions on reliability, transpar-ency; coverage and dispute resolution. For example; an economy receives 1 point if it has a functional electronic database for encumbrances; 1 point if it makes the documents and fee schedules for property registration publicly available (online or on public boards); 1 point if it compiles statistics on land transactions and makes them publicly available and so on. The highest possible score; indicating the highest overall quality; is 30 points. The reported incidence of bribery refers to the share of people reporting in Transparency International’s Global Corruption Barometer 2013 survey that when they had contact with land services in the previous 12 months; they paid a bribe for services. The correlation between the score on the overall quality of land administration and the reported incidence of bribery is −0.60. The relationship is significant at the 1% level after controlling for income per capita. The analysis is based on 88 observations. Source: Doing Business database; Transparency International data.
  • 74.
    REGISTERING PROPERTY 63 Sweden has an online system allowing anyone to access not only information on fees but also any information on plots going back 400 years.12 Advanced systems like Sweden’s are not easy to afford. A much cheaper alternative is to make fees available through public boards or brochures—the approach used by land registries in 34 economies (figure 7.5). Governments can give citizens the chance to be informed and contribute to a better business environment by promoting transparency about their operations—for example, by tracking the performance of their land services and openly sharing statistics about property transactions. Lithuania com-piles statistics on the performance of its land registries and makes them available to the public.13 Panama’s land registry dedicates a page on its online portal to transparency, publish-ing monthly data on the number of transactions broken down by type— mortgages, first registrations, trans-fers. 14 Overall, 98 economies compile statistics on land transactions (figure 7.6), though only 56 of those make their statistics public. One powerful consequence of trans-parency is accountability: information gives citizens the power of knowing what to expect and whom to hold accountable in case things go awry. But if the mechanisms through which individuals or agencies are held ac-countable function poorly, information alone will not be enough. Of all econo-mies included in the research, only 63 have specific means for filing an official complaint about land services. One is Malaysia, where the land registry and the cadastre allow users to file anony-mous complaints through their web-site, which are then sent directly to the director of the department.15 Another is Mauritius, where the website of the Registrar General Department enables users to fill out a form providing feed-back or filing a complaint.16 WHERE IS COVERAGE COMPLETE? The utility of even the most reliable and transparent land administration sys-tem will be undermined if it covers only a limited area of the economy. Where land registries do not provide complete geographic coverage, companies and individuals cannot be sure whether the areas not covered at the registry might be relevant to their interests.17 For maximum effectiveness, the registry and cadastre should make records of all registered private land readily avail-able and the records should cover the entire economy.18 Around the world, only 27% of econo-mies have a registry with full coverage of private land—and only 34% a ca-dastre with complete coverage (figure 7.7). South Asia, Latin America and the Caribbean and Sub-Saharan Africa have the smallest shares of economies with full coverage of private land, while the OECD high-income group and Europe and Central Asia have the larg-est shares with full coverage. Several economies have increased the coverage of their land registry and cadastre by registering properties and the associated rights through either systematic adjudication or a more sporadic approach. Between 1984 and 2004 Thailand implemented one of the world’s largest land titling pro-grams, using efficient, systematic land titling procedures and issuing more than 8.5 million titles.19 Recognized as very successful, the project has served as a model for other countries in East Asia and the Pacific.20 More recently, in 2014 Rwanda completed its process of regularizing land tenure, aimed at registering all land in the country. The effort required surveying all land parcels and providing land titles to all rightful claimants. It registered 10.3 million parcels through a low-cost, community-based process starting in 2010.21 With the process complete, FIGURE 7.5 The accessibility of fee schedules for land registries varies across income groups Economies by type of access provided (%) 100 80 60 40 20 0 High income Middle income Low income Online Public boards/ brochures In person Not publicly available Source: Doing Business database. FIGURE 7.6 Where do land registries have statistics on land transactions and a specific mechanism for filing a complaint? Share of economies with accountability mechanism (%) 90 80 70 60 50 40 30 20 10 0 Statistics on the number of transactions Specific complaint mechanism High income Upper middle income Lower middle income Low income Source: Doing Business database.
  • 75.
    64 DOING BUSINESS2015 80 70 60 50 40 30 20 10 Caribbean Economies by time required (%) 100 80 60 40 20 Central Asia income the land registry is now able to provide information on different categories of tenure, through a database searchable by parcel across the entire country. 80 70 60 50 40 30 20 10 Caribbean Caribbean HOW TO DEAL WITH LAND DISPUTES? In many economies disputes over land can make up the lion’s share of all disputes in court.22 To prevent land disputes and better manage existing ones, the legal framework for land administration needs to assign clear responsibilities to the stakeholders involved in land transactions and pro-vide effective mechanisms of dispute resolution that can be implemented in a consistent way and are acces-sible to all.23 Data collected by Doing Business on the legal framework for land administration cover several aspects, including who is held respon-sible for verifying the identities of the parties to a land transaction, whether the property registration system is guaranteed, whether any specific com-pensation mechanism is in place, how long it takes to resolve a land dispute between 2 domestic companies in the first instance and whether statistics on land disputes are collected and made publicly available. To help avoid land disputes, it is es-sential to ensure the accuracy of the in-formation underlying land transactions and to identify cases of fraud—by veri-fying and authenticating the identity of parties to a property transaction and validating all property records. This can be done by the registrar or by profes-sional agents such as notaries and law-yers, whose legal responsibilities should be clearly specified in the law. In some economies the state requires a profes-sional agent—a public notary in France and Italy, a public officer in the Republic of Korea—to be fully responsible for the transaction. In many economies the state provides a guarantee over property registra-tion. Among all economies covered by the research, 149 have a property registration system backed by a state guarantee. The most advanced forms of guarantee indemnify individuals for losses suffered because of deficien-cies in information provided by the registry.24 In Shanghai, for example, the state will provide full compensation FIGURE 7.7 Land registries and cadastres provide the highest coverage of private land in OECD high-income economies and Europe and Central Asia 0 South Asia Latin America Sub-Saharan Africa Middle East North Africa East Asia Pacific Europe Central Asia OECD high income 0 South Asia Latin America Sub-Saharan Africa East Asia Pacific Middle East North Africa Europe Central Asia OECD high income Share of economies where land registry has full coverage (%) Share of economies where mapping system has full coverage (%) Source: Doing Business database. FIGURE 7.8 How long does it take to resolve a land dispute in the first instance? 0 1 year 2 years 3 years or more Latin America South Asia Sub-Saharan Africa Middle East North Africa East Asia Pacific Europe OECD high Note: Data refer to a standardized case involving a dispute over a property transfer between 2 domestic companies. Source: Doing Business database.
  • 76.
    REGISTERING PROPERTY 65 for losses due to a technical error by a public officer. In England and Wales indemnity is also payable for losses incurred because of a mistake in an official search or an official copy. Accuracy of information in land regis-tries can help avoid potential disputes. But when disputes do arise, alternative dispute resolution mechanisms—such as voluntary mediation procedures— can help deal with them at a pre-liminary stage, easing the burden on congested courts.25 A dozen economies have mediation procedures specifically for land disputes. One is Liberia, which instituted a program for resolving land disputes through mediation to fill a gap left by the virtual collapse of its court system after the civil war.26 The government set up the National Land Commission to address fundamental land tenure issues and develop interim measures for resolving land disputes. When land disputes end up in court, an efficient legal system should be able to provide a timely resolution. But time requirements vary considerably across economies. Obtaining a judgment in a standard land dispute takes less than a year in 58 economies, but up to 3 years or more in another 55 economies. There is also much variation across regions. In 61% of economies in the OECD high-income group and 58% in Europe and Central Asia, land disputes can be resolved within a year. In 80% of economies in South Asia and 62% in Latin America and the Caribbean, the process usually takes 3 years or more (figure 7.8). Whether a judicial system provides official statistics on the number of land disputes filed and resolved can be an indicator of its overall quality—reflect-ing something about how well it func-tions and how transparent it is. Among all economies included in the research, about 20 have such statistics available. In Finland, for example, statistics show that 1,173 land disputes were settled FIGURE 7.9 Good land administration systems are associated with higher levels of domestic credit provided by the financial sector Domestic credit provided by financial sector (% of GDP) 250 200 150 100 50 0 -50 70 60 50 40 30 20 10 in the district courts in 2012; these represented about 0.25% of all disputes resolved through court in the country. In Georgia 168 land disputes were -100 0 5 10 15 20 25 30 Score on overall quality of land administration Note: For an explanation of the scoring on the overall quality of land administration, see the note to figure 7.4. Domestic credit provided by the financial sector includes all credit to various sectors on a gross basis, with the exception of credit to the central government, which is net. The data are for the most recent year available. The correlation between the overall quality of land administration and domestic credit provided by the financial sector is 0.56. The relationship is significant at the 1% level after controlling for income per capita. The analysis is based on 150 observations. Source: Doing Business database; World Bank, World Development Indicators database. FIGURE 7.10 Economies with a good land administration system are likely to have lower inequality 0 0 5 10 15 20 25 30 Score on overall quality of land administration Gini index Note: For an explanation of the scoring on the overall quality of land administration, see the note to figure 7.4. The Gini index measures the extent to which the distribution of income or consumption expenditure among individuals or households within an economy deviates from a perfectly equal distribution. A Gini index of 0 represents perfect equality, an index of 100 perfect inequality. The data are for the most recent year available. The correlation between the overall quality of land administration and the Gini index is −0.37. The relationship is significant at the 1% level after controlling for income per capita. The analysis is based on 123 observations. Source: Doing Business database; World Bank, World Development Indicators database.
  • 77.
    66 DOING BUSINESS2015 resolved in 2013, accounting for 1.92% of all disputes settled by the courts of first instance. And in Latvia 324 land dispute claims were filed in 2013, rep-resenting 0.91% of all claims submitted to the courts of first instance. WHY DOES THE QUALITY MATTER FOR ALL? A reliable, transparent, complete and secure land registration system plays an important part in supporting access to credit and economic growth for all. Providing a sound property registration system is a first step toward improving access to credit. Indeed, the higher the quality of the land administration sys-tem, the higher the level of domestic credit provided by the financial sector to the economy (figure 7.9). In addition, clear property boundaries and ownership are important factors in social stability and social development. If people feel secure in their homes and on their land, they are more likely to invest in them, such as by making improvements that benefit health and well-being. Having a safe property registration system for all is associated with lower levels of inequality (figure 7.10). Economies with a reliable and transparent land administration sys-tem tend to have lower inequality and to be more inclusive. CONCLUSION Expanding the registering property indicators to measure the quality of land administration systems as well as the efficiency of property transac-tions enriches the substance of these indicators. It provides measures of key elements of land administration systems—elements that matter for all people in a society. New data on reliability, transparency, coverage and dispute resolution show much variation in the overall quality of land administration systems among the 170 economies covered. The data also show that examples of good practice exist in all regions of the world—and will help policy makers identify those examples. NOTES This case study was written by Edgar Chavez, Laura Diniz, Frédéric Meunier, Parvina Rakhimova and Marilyne Youbi. 1. UN-Habitat 2013. Title refers to the formal legal document serving as evidence of ownership. This document can take a range of forms. 2. Galiani and Schargrodsky 2010. 3. World Bank 1989. 4. UN-Habitat 2013. 5. UN-Habitat 2012. 6. “Provincial Government of Khyber Pakhtunkhwa and UN-Habitat Inaugurates GIS Labs for Computerization and Digitization Process of Land Records,” United Nations Human Settlements Programme (UN-Habitat), October 3, 2012, http://www.fukuoka.unhabitat.org /projects/voices/pakistan/detail01_en.html. 7. Hanstad 1998. 8. UN-Habitat 2012. 9. UNECE 2012. 10. One definition of a transparent business environment is one in which individuals possess essential information about the environment in which they operate, meaning that information asymmetries do not place an unjustifiable burden on them (OECD 2002). 11. Transparency International 2011. 12. For more on the information available, see the website of Sweden’s mapping, cadastral and land registration authority (Lantmäteriet) at http://www.lantmateriet.se /en/Maps-and-geographic-information. 13. For more on the information available, see the website of the Lithuanian Real Property Cadastre and Register at http:// www.registrucentras.lt. 14. For more on the information available, see the website of the Land Registry of Panama at https://www.registro-publico.gob.pa /index.php/es/icons.html. 15. For more information, see the website of the Department of the Director General of Land and Mines of Malaysia at http:// www.kptg.gov.my/?q=en/content /complaints-enquiries. 16. For more information, see the website of the Registrar General Department of Mauritius at http://registrar.mof.gov.mu/English /Pages/About%20the%20department /Land.aspx. 17. Deininger, Selod and Burns 2012. 18. UNECE 2012. 19. Burns 2004. 20. Brits, Grant and Burns 2002. 21. Gillingham and Buckle 2014. 22. Wehrmann 2008. 23. Deininger, Selod and Burns 2012. 24. Deininger, Selod and Burns 2012. 25. FAO 2012. 26. Bruce 2013.
  • 78.
    Doing Business 2015 Going Beyond Efficiency Getting credit The importance of registries Small and medium-size enterpris-es account for the largest share of employment in the developing world. They are also more likely than large firms to be credit constrained.1 These businesses need working capital to operate, to grow and to compete in the marketplace. So access to finance is crucial to their success. The Doing Business indicators on get-ting credit measure 2 types of institu-tions and systems that can facilitate access to finance and improve its allocation. One set of these indicators focuses on the secured transactions system, examining the legal rights of borrowers and lenders in secured transactions and bankruptcy laws. The second focuses on the credit reporting system, looking at the in-formation collected and distributed through credit bureaus or registries. Research has shown that these insti-tutions and systems work best when implemented together.2 What is an effective secured transac-tions system? One that promotes the availability of credit by reducing the risk to lenders of accepting movable assets as collateral. This can be achieved by taking a functional approach to se-cured transactions and implementing modern collateral registries—such as those in Honduras and New Zealand— to ensure their publicity. What is an effective credit reporting system? One that provides creditors with the most relevant, reliable, timely and sufficient credit data as well as value added services. Among the many features offered by a modern credit reporting service provider are online access to credit information and the provision of credit scores. Doing Business collected new data this year to strengthen the understanding of secured transactions and credit reporting systems around the world. The strength of legal rights index has been expanded from 10 points to 12 to also cover the functional approach to secured transactions and more fea-tures of collateral registries. The depth of credit information index has been expanded from 6 points to 8 to also cover the existence of credit scoring and online platforms for exchanging credit data. WHY A FUNCTIONAL APPROACH TO SECURED TRANSACTIONS? For lenders considering a loan to a small or medium-size enterprise, one of the biggest deterrents is the pos-sibility that the borrower has hidden liens—that is, that the borrower has already given its assets as collateral to another lender. As more complex fi-nancial instruments develop and are adopted worldwide—such as factoring (where a business sells its invoices to a third party, called a factor, at a discount) or financial leases that cre-ate hidden rights over property held by the borrowing company—the need for ƒ Doing Business has expanded its measures of the legal rights of borrowers and lenders and the sharing of credit information. They now also cover the functional approach to secured transactions, more features of the collateral registry and the availability of credit scores and online access to credit information. ƒ A functional approach to secured transactions provides transparency and predictability for creditors—because the legal framework covers all rights in movable assets that secure the performance of an obligation, regardless of the type of transaction. Forty-seven of 189 economies have a functional approach as recorded by Doing Business. ƒ A modern collateral registry— centralized, notice-based and allowing online access—is important. Among 189 economies, 18 have such a registry, while 25 have a notice-based registry and 28 an online registry. ƒ Credit bureaus or registries offering online access can provide faster service and better data quality. Online access is available in 119 of 126 economies with a functioning credit bureau or registry covering at least 5% of the adult population as recorded by Doing Business. ƒ Credit scores based on credit bureau or registry data provide highly predictive measures of a borrower’s future repayment capacity and so can help expand access to finance. They are offered in 64 of the 126 economies with a functioning credit bureau or registry covering at least 5% of the adult population.
  • 79.
    68 DOING BUSINESS2015 a system that limits the impression of “false wealth” becomes paramount. One way to minimize the potential for secret liens is to adopt a functional approach to secured transactions. This requires legislation that covers all rights in movable assets that are created by agreement and that secure the payment or performance of an obligation, regardless of the type of transaction or the terminology used.3 In this approach what matters is no longer the form that the agreement takes (whether a floating charge or a pledge agreement, for example) but the rights and obligations that it creates. These rights then need to be publicized through a reliable and affordable public registration system (figure 8.1). In a system that includes several registries, the registries need to be integrated to the greatest extent possible to ensure that potential creditors can easily retrieve all notices of security interests that have been recorded.4 This functional approach to secured transactions, also known as the unitary model, has been promoted through model laws in regions as far apart as Eastern Europe and Latin America and the Caribbean (figure 8.2).5 The functional approach has also been considered in some high-income economies whose current system poses no significant problems but where the legal community sees possible advantages in the approach.6 In the European Union, as part of the efforts to harmonize private law, schol-ars from economies with different legal traditions have reached consensus on the importance of a single notion of security right—with pledges covered by the same rules and principles for creation, publicity and enforcement as assignments of claims, transfers of ownership, and sales and leaseback agreements.7 The benefits of a functional approach have inspired legal reforms all over the world. In Belgium a new unitary regime will come into force in December 2014. The provisions on pledges in the coun-try’s civil code as well as the 1919 law relating to pledges of commercial assets will be abolished,8 and the distinction between the commercial pledge and civil pledge eliminated. The new legal framework will incorporate the provi-sions on retention of title now included in the country’s bankruptcy law and will formally recognize fiduciary transfer of title. This will create a single legal framework for all pledges over movable assets—a big step toward a functional approach to secured transactions. Once implemented, the reform will arguably be the first of its kind in Western Europe. Colombia established a modern legal framework for secured transactions in the past year. The new legal framework allows the use of all types of movable assets, present or future, as collateral to secure a loan. It also regulates the functional equivalents of loans secured with movable property, such as financial leases and sales with retention of title.9 FIGURE 8.1 Recording all types of secured transactions in a collateral registry promotes transparency What are some transactions that can be recorded? Nonpossessory security interest Fiduciary transfer of title Financial lease Assignment of receivables Sale with retention of title What form does the transaction take? Debtor keeps title possession of movable asset Note: Priority is established by time of registration of the security interest. Collateral registry Who has priority over claims on the asset? Debtor transfers title Bank Leasing company leases asset Debtor Company assigns receivables Bank Wholesaler sells asset keeps title Company Bank Bank Leasing company Bank Wholesaler
  • 80.
    GETTING CREDIT 69 Sub-Saharan Africa Latin America Caribbean OECD high income Europe Central Asia East Asia Pacific Middle East North Africa 18 29 7 25 5 26 5 21 10 15 This change is expected to increase transparency and protect the rights of creditors when taking movable property as collateral. Jamaica also established a new legal framework to modernize its secured transactions system. The aim is to improve the availability of credit to the private sector while minimizing the risk of nonpayment of loans. The Security Interests in Personal Property Act, which came into force on January 2, 2014, repealed provisions governing tra-ditional securities under the Agricultural Loans Act, the Bills of Sale Act and the Debenture Registration Act. The new legal framework applies to all types of security documents, including pledges, leases and floating charges. Jamaica is following a path laid by other jurisdictions with a common law tradi-tion. The most recent previous example was Australia’s implementation of the Personal Property Security Act of 2009. The reform had a massive legal scope, re-placing 77 commonwealth and state acts and regulations and affecting 30 com-monwealth, state and territory agencies. All these reforms entailed creating new collateral registries or transforming existing ones. To help in understanding how these institutions function, the Doing Business indicators on the legal rights of borrowers and lenders look at several features of their operation. A CRITICAL PIECE—THE COLLATERAL REGISTRY To be effective, an integrated legal framework for secured transactions needs to be accompanied by a modern collateral registry for movable assets. Such registries allow a lender to take security rights in an asset without having to take physical custody of it. The debtor retains title and posses-sion. Without registration of these transactions, there is no transparent security for the lender and no assur-ance that the lender is the only one laying claim to the asset. Collateral registries both enable potential credi-tors or buyers to discover any existing liens over property and allow them to register their own security interest, establishing priority over other credi-tors in case of the debtor’s default.10 Studies show that a new collateral registry can have a substantial eco-nomic impact. In economies that introduce one, access to bank finance rises by about 8 percentage points on average, while interest rates decline by about 3 percentage points and the terms of loans increase by about 6 months.11 Experience shows how ac-tive collateral registries can be, even in countries with small populations. In 5 such countries that recently cre-ated registries and reformed secured transactions laws—the Marshall Islands (2010), the Federated States of Micronesia (2007), the Solomon Islands (2009), Tonga (2011) and Vanuatu (2009)—the number of filings had reached a total of more than 20,000 by January 31, 2014, while the number of searches had exceeded 60,000.12 In Australia, whose 2009 re-form included implementing a new col-lateral registry, the number of filings exceeded 2 million in 2013 alone, while the number of searches exceeded 6 million.13 Implementing and maintain-ing a modern and well-functioning col-lateral registry may entail significant financial and administrative efforts. It is encouraging to note that, costs not-withstanding, a number of low-income countries have found the associated investments to be fully justified when examined in light of other benefits for the economy at large. Key features of a modern collateral registry As model laws and legislative guides have evolved with technology over the years, they have encapsulated a set of good practices that serve as gener-ally accepted standards for modern collateral registries. These include using notice-based registration, allowing online access to data and centralizing registries. While traditional registries usually require a copy of the loan agreement or other documents, notice-based registries require no documentation other than a simple generic form that records the existence of a security interest, providing the names of the creditor and the debtor as well as a general description of the collateral asset and the obligation secured. This FIGURE 8.2—How many economies have adopted a functional approach to secured transactions? 0 5 10 15 20 25 30 35 40 45 50 South Asia Using functional approach Not using functional approach 2 6 20 Number of economies Source: Doing Business database.
  • 81.
    70 DOING BUSINESS2015 avoids the need for a specialist to review lengthy documents, which can be costly and time-consuming. It also improves the quality of registration: with less documentation, the potential for errors is minimized. Notice-based registration has also been successfully adopted for other registration sys-tems, such as patent and trademark registries. Online systems allow users to perform searches and register security interests from anywhere and at any time. Unlike with paper-based systems, there is no need for users to appear before the registrar and wait their turn to enter information in the registry index. Online registration also transfers the burden of preventing errors to the interested party. Centralized registries enable potential creditors to determine whether an as-set has been pledged as collateral by searching a single database, regard-less of the location of the borrower. To be effective, these registries also need to allow searches based on unique search criteria—such as a debtor’s unique identifier (or name, if no unique identifiers exist) or a serial number (for serial-numbered assets such as vehicles)—and they need to encom-pass both legal and natural persons as well as all types of assets. Where registries are not centralized, searches can be time-consuming and even useless. In the fragmented collateral registry system for chattel mortgages in the Philippines, for example, finding out whether an asset is mortgaged requires submitting a request to more than a hundred registries. Different legal traditions, different practices While the registration of collateral claims is common practice in many economies, the type and role of reg-istries may vary depending on the legal tradition. In some economies with a common law tradition, rights over movable property are customar-ily recorded in separate registries for incorporated and nonincorporated entities. For example, not all security instruments may be available to both companies and sole proprietorships or registered at the same place. In some civil law economies registra-tion of securities takes place at the local court of first instance or at the commercial registry. In many other economies there is no requirement at all to register security interests over movable property (figure 8.3). The strength of legal rights index is consistent with good practices in secured transactions law, such as allowing both incorporated and FIGURE 8.3 Which economies have collateral registries—and of which type? Note: The map reports operational collateral registries as recorded by Doing Business—those that are for all entities, are centralizied geographically and by asset type and have an electronic database indexed by the debtor’s name or unique identifier. Functional equivalents to traditional security interests include financial leases, sales with retention of title, assignments of receivables and fiduciary transfers of title, among others. Registries that are fully online allow searches, registrations, amendments and cancellations to be carried out online by any party with a legitimate right to do so. Source: Doing Business database.
  • 82.
    GETTING CREDIT 71 nonincorporated companies to create security interests over all categories of movable assets. Good practices also call for registering all types of security interests and functional equivalents at the same place—in-cluding financial leases, sales with retention of title, assignments of receivables, fiduciary transfers of title and tax liens—to ensure that they are not hidden from prospective creditors or buyers. The indicator focuses on the first 4 of these functional equivalents and rewards economies in the scor-ing if at least 3 of them are recorded at the same collateral registry. This unitary approach has increasingly become part of the secured transac-tions reforms in Central and Eastern Europe, most recently in Hungary. But because of different approaches in their implementation, the wave of reforms in the region has not led to consistent results.14 WHY ARE CREDIT BUREAUS AND REGISTRIES IMPORTANT? Credit reporting service providers can be grouped into 2 main types: credit bu-reaus, which aim primarily to improve the quality and availability of data that creditors need to make informed decisions, and credit registries, which seek mainly to support banking super-vision while also improving the quality and availability of data for supervised financial intermediaries (figure 8.4). (In practice, many credit bureaus also support financial supervision activities, and some credit registries also aim to improve data for creditors.) While their primary objectives might differ, both types serve the same purpose: reducing information asymmetries to help increase access to credit. They also improve borrower discipline, lower interest rates and support bank super-vision and credit risk monitoring. Borrowers have more information about their past credit behavior and current financial situation than credi-tors do. This makes it hard for individu-als and small firms trying to get a loan to make their case to lenders. Banks are more likely to lend to larger firms, which usually are required to adopt international accounting standards, are more transparent and bear less risk of default.15 By collecting information on indi-viduals and small firms, credit bureaus and registries provide banks with the information they need to assess cred-itworthiness. This information sharing helps poor people and micro and small businesses.16 It can especially benefit new entrepreneurs, by enabling formal credit providers to check their past repayment patterns and track their current credit behavior.17 A 2007 study found that in developing economies access to credit grew twice as fast FIGURE 8.4 How credit information flows in a system with both a credit registry and credit bureaus Data providers Service providers Products Users Credit card issuers Consumers Nonregulated financial institutions Credit card issuers Retailers Telecoms and utilities Public records Court judgments Credit registry Data bank Consumers or credit applicants Debt classification Credit bureau 1 Credit bureau 2 Credit bureau 3 Reports Reports Credit scoring Antifraud Portfolio monitoring Statistics unit of central bank Supervisory unit of central bank Banks and regulated financial institutions Nonregulated financial institutions Retailers Telecoms and utilities Central bank Banks and regulated financial institutions Note: Some economies have only a credit registry, some have only one or more credit bureaus, and some have both a credit registry and one or more credit bureaus. Credit bureau networks tend to be more complex than credit registry networks because they generally include a larger variety of data providers and data users. Source: World Bank 2011a, p. 51.
  • 83.
    72 DOING BUSINESS2015 for small firms as for large ones after new credit reporting systems were introduced.18 Good credit reporting systems com-bined with strong rule of law can be a catalyst for growth in frontier econo-mies with many young firms and en-trepreneurial ventures. Research based on World Bank Enterprise Survey data from 123 countries found that in those with better credit reporting systems, younger firms have better access to bank finance than older firms do.19 Credit information systems also reduce firms’ reliance on informal credit, whose high interest rates and lack of protec-tions can be destabilizing both to the firms and to the overall economy. Sharing credit information can improve borrower behavior and reduce interest rates. According to a study surveying more than a thousand consumers in the United States with primary or joint responsibility for paying bills, half said that they would be more likely to pay their bills on time if those payments were fully reported to credit bureaus and could affect their credit score.20 A study in Albania found that loans given after the launch of its credit registry were 3 percentage points less likely to turn problematic.21 And when credit re-porting compels borrowers to establish consistent repayment patterns, finan-cial institutions face less uncertainty in their debt exposure and can lower interest rates.22 Credit information systems also help maintain the health of financial sys-tems, with credit registries enabling policy makers and regulators to monitor large flows of money and credit bureaus allowing them to assess developments in credit markets and interest rates. One study found that credit registries played a valuable role in calculating credit risk for capital and in supervising and checking banks’ internal ratings in Argentina, Brazil and Mexico.23 Coverage by credit bureaus and regis-tries is extensive, encompassing more than 2 billion individuals and 120 million firms worldwide by January 2014.24 The number of economies with a credit bureau covering at least 5% of the adult population as recorded by Doing Business grew from 49 of 145 economies in 2004 to 94 of 189 in 2014—while the number with a credit registry covering at least 5% increased from 22 of 145 economies to 58 of 189 (figure 8.5). Globally, 28 economies have both a credit registry and a credit bureau covering at least 5% of the adult population. Coverage continues to grow as econo-mies establish or enhance credit report-ing systems. Several did so in the past year. In Jamaica 2 new credit bureaus, Creditinfo Jamaica and CRIF-NM Credit Assure Limited, having received licenses in 2012, began serving banks and finan-cial institutions in 2013. Thanks to the launch of their operations, Jamaica was the economy that made the biggest FIGURE 8.5 Which economies have a credit bureau or registry? Note: Coverage is the number of individuals and firms covered as a percentage of the adult population. The map reports operational credit reporting service providers as recorded by Doing Business that have a coverage of at least 0.1% of the adult population. Source: Doing Business database.
  • 84.
    GETTING CREDIT 73 improvement in credit reporting in 2013/14. Three other economies also developed new credit reporting systems in the past year. The Democratic Republic of Congo’s central bank established a credit registry by launching an elec-tronic credit reporting system, YSYS– CERI, in April 2013. Tanzania’s central bank licensed the country’s first credit bureau, Creditinfo Tanzania, in June 2013, and its second credit bureau, Dun Bradstreet Credit Bureau Tanzania, in September 2013. Vietnam’s first credit bureau, Vietnam Credit Information, started operating in January 2014. By April it was providing credit informa-tion to 23 of 47 commercial banks in the country as well as market educa-tion and training. Some economies have development plans under way. In June 2013 the West African Economic and Monetary Union set up a legal framework pro-viding for the establishment of credit bureaus in member states. Two have adopted the law so far, Senegal in January 2014 and Côte d’Ivoire in March 2014. FEATURES OF MODERN CREDIT INFORMATION SYSTEMS The vast majority of credit reporting service providers offer online access to their databases, which provides data users with faster, more efficient service and can ensure better data quality. Many also provide credit scores based on credit bureau or credit registry data as a value added service. These scores are different from those developed on the basis of individual lenders’ data and provide a highly predictive measure of a borrower’s re-payment behavior. Online access and credit scoring are 2 of many features that define a modern credit reporting system. The efficiencies of online access More efficient credit reporting service providers share their data online. Offering online access for subscribed banks and financial institutions has become a must for many credit bureaus and registries. One way to do so is through an online platform accessed with a traditional internet browser. This kind of system allows a user to connect once it has validated the user’s log-in information. Once connected to the system, the user can retrieve credit reports autonomously. Another way to provide online access is through a system-to-system connec-tion, where the user’s system is con-nected to and integrated with the credit reporting service provider’s system. Both parties have software installed that allows host-to-host connectiv-ity without human interaction. Data are updated automatically, and users retrieve credit information by accessing their own system, with no need to log into the service provider’s system.25 Online access to data is fast and can ensure transparency, data qual-ity and security. A system-to-system connection further ensures system ef-ficiency and high service standards for users because it eliminates data dupli-cation, reduces the risk of human error and allows the streamlining of work flows with appropriate business and validation rules. These advantages may encourage more data providers to share information with the credit bureaus and registries. Online access is widespread. In 119 of 126 economies with a functioning credit bureau or registry covering at least 5% of the adult population as recorded by Doing Business, data users can access borrowers’ credit information online. Globally, data providers and users can exchange credit information elec-tronically in 94 of the economies with a credit bureau that covers at least 5% of the adult population—and in 50 of those with a credit registry that does so. In East Asia and the Pacific, Europe and Central Asia, Latin America and the Caribbean, the OECD high-income group and South Asia data providers and us-ers can exchange data electronically in all economies that have a functioning credit bureau or registry covering at FIGURE 8.6—How many economies have a credit bureau or registry providing online access to credit data? 12 5 21 9 20 1 11 30 1 25 1 16 2 7 11 2 5 2 5 21 0 5 10 15 20 25 30 35 40 45 50 Sub-Saharan Africa Latin America Caribbean OECD high income Europe Central Asia East Asia Pacific Middle East North Africa South Asia Number of economies Credit bureau or registry exists but has less than 5% coverage No credit bureau or registry exists Credit bureau or registry with at least 5% coverage exists and offers online access Credit bureau or registry with at least 5% coverage exists but does not offer online access Note: Coverage is the number of individuals and firms covered as a percentage of the adult population. Source: Doing Business database.
  • 85.
    74 DOING BUSINESS2015 least 5% of the adult population (figure 8.6). In the Middle East and North Africa this is the case in about 85% of econo-mies that have such a credit bureau or registry, while in Sub-Saharan Africa it is the case in only 71%. Online access to credit reporting systems is growing in the developing world. Ethiopia’s central bank estab-lished a credit information center to allow banks to submit data and inquiries electronically. A pilot program was launched in August 2011 with 3 commercial banks, and by April 2012 the online system was fully imple-mented. Today 17 Ethiopian banks are registered as data users and provide monthly updates. The objective for the online system is to preserve and distribute 5 years of historical data on the repayment status of all loans. Bangladesh’s central bank (Bangla-desh Bank) launched an online system for its credit information bureau in July 2011 to allow banks and other financial institutions to exchange information on borrowers and loan repayments electronically. Before, Bangladesh Bank had a semiautomatic system in place: banks provided information on computer disks and had to pick up printed copies of credit reports from Bangladesh Bank’s office. Paraguay’s central bank introduced a new online system in April 2011. This system is aimed at improving both the credit registry’s efficiency—by reducing the time it takes to verify credit information from one week to just a few minutes—and the accu-racy of data. The system, called Red de Comunicación Financiera, allows financial institutions to transfer data to the credit registry and access credit information on both firms and individuals. The predictive value of credit scores Many credit bureaus and registries pro-vide value added services to data users. These include credit scoring, marketing services, portfolio monitoring, fraud detection and debt collection. An impor-tant tool in expanding access to finance is credit scoring, a statistical method of evaluating the probability that a pro-spective borrower will fulfill the financial obligations associated with a loan. Credit scores based on credit bureau or credit registry data pool informa-tion across many creditors as well as some public information sources. They therefore include characteristics oth-erwise unavailable to any individual creditor, such as total exposure, num-ber of outstanding loans and previous defaults within the system. Credit scoring models typically incorporate historical data such as defaults, posi-tive payment behavior and previous inquiries. To sharpen the predictive value of credit scores, credit bureaus and registries also are increasingly collecting data from a wider range of sources (such as bankruptcies and court judgments). As a result, credit scores generally have a higher predic-tive value than assessments derived from credit histories alone.26 Credit scores may improve market efficiency and provide borrowers with more opportunities to obtain credit. The availability of credit scores allows lenders that would otherwise not be capable of analyzing the raw credit data to extend credit to underserved markets at lower cost. Credit scoring based on credit bureau or credit registry data is offered in 64 of 126 economies with a credit reporting service provider covering at least 5% of the adult population as measured by Doing Business. This value added product is most widely available in Latin America and the Caribbean and the OECD high-income group, offered in 80% of economies with a credit bu-reau or registry covering at least 5% of the adult population—compared with 40% in Europe and Central Asia, 38% in the Middle East and North Africa, 25% in East Asia and the Pacific and 24% in Sub-Saharan Africa (figure 8.7). In South Asia credit scores are offered in only 1 of 5 economies with a credit reporting service provider covering at least 5% of the adult population. FIGURE 8.7—How many economies have a credit bureau or registry providing credit scores? 15 Number of economies Credit bureau or registry exists but has less than 5% coverage No credit bureau or registry exists 1 4 4 5 10 24 16 4 12 8 Sub-Saharan Africa Latin America Caribbean OECD high income Europe Central Asia East Asia Pacific Middle East North Africa Credit bureau or registry with at least 5% coverage exists and offers credit scores Credit bureau or registry with at least 5% coverage exists but does not offer credit scores 6 4 13 2 5 2 1 21 1 2 7 1 1 11 9 0 5 10 15 20 25 30 35 40 45 50 South Asia Note: Credit scores are those based on credit bureau or registry data. Coverage is the number of individuals and firms covered as a percentage of the adult population. Source: Doing Business database.
  • 86.
    GETTING CREDIT 75 Distance to frontier score for getting credit, 2014 100 80 60 40 20 WHAT ARE THE LINKS WITH ACCESS TO CREDIT? Where the legal framework provides stronger protection of secured creditors’ rights and credit reporting systems pro-vide more relevant, reliable, timely and sufficient data, the private sector tends to have better access to credit. Analysis of data collected for the strength of legal rights and depth of credit information indices confirms that economies that score high on these indices also have higher levels of domestic credit provided to the private sector by financial institu-tions (figure 8.8). The results show that both transparency in the secured transactions system and access to credit information—elements that create predictability for secured creditors and provide lenders with tools to assess the creditworthiness of borrowers—are associated with a higher level of private sector credit, and this leads to more business creation or expansion in the long term. Nevertheless, there are many other factors that constrain or enable firms’ access to credit, and these should be taken into account when analyzing an economy’s credit market. CONCLUSION Effective systems for secured transac-tions and credit reporting can improve access to finance for small and medium-size enterprises. This is confirmed by the data for the expanded indicators on getting credit, which this year also cover the functional approach to secured transactions, more features of the col-lateral registry and the availability of credit scores and online access to credit information. Analysis of these data shows a significant correlation between better performance on the getting credit indicators and higher levels of domestic credit provided to the private sector by financial institutions. Used in conjunction with other indicators mea-suring factors that affect firms’ access to credit, the getting credit indicators can contribute to a better understand-ing of credit markets. NOTES This case study was written by Iana Ashchian, Catrice Christ, Santiago Croci Downes, Salima Daadouche, Nan (Charlotte) Jiang, Magdalini Konidari and Yasmin Zand. 1. Kuntchev and others 2012. 2. Djankov, McLiesh and Shleifer 2007. 3. UNCITRAL 2007. 4. World Bank 2011b. 5. The European Bank for Reconstruction and Development has used its 1994 Model Law on Secured Transactions to promote a functional approach in Eastern Europe, while the Organization of American States has used its 2002 Model Inter-American Law on Secured Transactions to promote the approach in Latin America and the Caribbean. 6. According to a discussion paper by the City of London Law Society (2012, p. 3), “the advantage of this approach would be that all aspects of the law relating to secured transactions could be set out in one place. This would make it more accessible to those involved in taking or granting security, including those from outside England who engage in cross-border financing. It could also result in useful clarification and simplification of the law.” 7. Study Group on a European Civil Code and Research Group on EC Private Law (Acquis Group) 2009. 8. The relevant provisions of the Belgian Civil Code are in articles 2071–84 on pledge. 9. Law 1676, article 3. 10. Alvarez de la Campa 2011. 11. Love, Martínez Pería and Singh 2013. 12. Asian Development Bank 2013. 13. Data provided by the Australian Financial Security Authority. 14. Tajti 2013. 15. Jappelli and Pagano 2002; Behr, Entzian and Guettler 2011; Brown, Jappelli and Pagano 2009. 16. Luoto, McIntosh and Wydick 2004; Brown, Jappelli and Pagano 2009. 17. Chavis, Klapper and Love 2010. 18. Brown and Zehnder 2007. 19. Chavis, Klapper and Love 2010. 20. Turner and others 2009. 21. Behr and Sonnekalb 2012. 22. Brown and Zehnder 2007; Luoto, McIntosh and Wydick 2004; Brown, Jappelli and Pagano 2009; Behr, Entzian and Guettler 2011. 23. Powell and others 2004. 24. Statistics refer to the number of individuals and firms covered in 126 economies with functioning credit bureaus and registries covering at least 5% of the adult population as recorded by Doing Business. 25. IFC 2012. 26. World Bank 2011a. FIGURE 8.8—Economies with stronger systems for secured transactions and credit reporting have higher levels of domestic credit provided to the private sector 0 0 40 80 120 160 200 240 280 320 Domestic credit to private sector (% of GDP), 2013 Note: Domestic credit to private sector refers to financial resources provided to the private sector by financial corporations, such as through loans, purchases of nonequity securities, and trade credits and other accounts receivable, that establish a claim for repayment. The correlation between the distance to frontier score for getting credit and domestic credit to private sector as a percentage of GDP is 0.34. The relationship is significant at the 1% level after controlling for income per capita. Source: Doing Business database; World Bank, World Development Indicators database.
  • 87.
    Doing Business 2015 Going Beyond Efficiency Protecting minority investors Going beyond related-party transactions Acorporation is a legal entity distinct from its founders. This essential separation enables a business to flourish or fail separately from the personal assets and interests of its members (whether owners, direc-tors or employees). The advantages of untying a business from its founders are such that the corporation has today become the most common form of commercial entity around the world. But the separation also creates risks. Without a proper structure and al-location of duties and rights, and without clarity in decision-making processes, corporations can quickly become incapable of generating any wealth. Without adequate safeguards, corporations can become vulnerable to abuse, with insiders using corpo-rate assets for personal gain to the detriment of other stakeholders. If such abuses become widespread in an economy, they can deter investors from participating in any corpora-tion. The quality of the rules and regulations governing corporations is therefore fundamental to functioning markets and wealth-generating eco-nomic activity. The Doing Business indicators on pro-tecting minority investors analyze the regulation of related-party transac-tions and shareholder access to judicial redress as a proxy for an economy’s overall corporate governance stan-dards and ease of access to financ-ing from capital markets. Stronger protection of minority shareholders in prejudicial related-party transactions is associated with a higher level of development in capital markets—as reflected by such indicators as higher market capitalization, larger numbers of listed domestic firms, more initial public offerings and lower private ben-efits of control.1 For entrepreneurs seeking to develop or expand a business, access to external financing is a crucial concern. Stronger legal protection of minority investors increases the confidence of investors in markets, making them more likely to invest. Econometric research shows that investors’ willingness to provide entrepreneurs with equity capital is a significant factor in the development of financial markets, which in turn promotes economic development. Recent studies provide empirical evidence that corporate governance standards aimed at protecting minor-ity shareholders promote positive economic outcomes at the country and firm level. To that end, certain aspects of corporate governance are particularly important—such as board composition and independence, firm transparency and disclosure, and the rights of shareholders relative to the board of directors and management. Sound rules and regulations in these areas of corporate governance can minimize the agency problem between majority and minority shareholders as well as that between minority share-holders and the board of directors and management. ƒ Doing Business introduces 3 new measures of minority investor protections this year—indices on shareholders’ rights and role in major corporate decisions, on governance structure and on corporate transparency. ƒ Economies with the most developed securities markets tend to have the highest average scores on the 3 new indices. ƒ On average, OECD high-income economies offer the strongest protections as measured by the new indices and continue to provide the strongest protections as measured by the existing ones. ƒ Among 189 economies worldwide, India follows the largest share of the good practices measured by the new indices. ƒ On average, shareholders of listed companies are more protected than those of nonlisted companies. ƒ Overall, minority investors are more protected in economies that distinguish between shareholders of listed companies and shareholders of nonlisted ones.
  • 88.
    PROTECTING MINORITY INVESTORS77 Specifically, greater shareholder protec-tion is associated with larger capital markets,2 a lower cost of capital, higher cash flows, more efficient firm-level re-source allocation3 and greater firm val-uation4 and performance.5 In addition, numerous studies suggest that inves-tors will charge higher rates to provide financing if they are not assured of an adequate return or if they fear expro-priation by corporate insiders.6 In other words, greater shareholder protection reduces the cost of equity by mitigating the agency problem between minority shareholders and managers in relation to diverging interests in the allocation of company resources. Several other studies highlight the positive impact on firm-level resource allocation and long-term returns of having audit com-mittees, of ensuring the independence of the board and of having different people serve as chief executive officer (CEO) and chair of the board.7 WHAT DO THE INDICATORS NOW MEASURE? Since their inception, the Doing Business indicators on protecting minority investors have been measur-ing minority shareholder protections against directors’ misuse of corporate assets for personal gain. This is done by positing specific sets of assump-tions about a transaction between 2 companies that involves a clear conflict of interest. This transaction is tested against the regulations of each of the 189 economies covered by Doing Business to determine who can approve the transaction, what disclo-sure must be made, who can be held liable if the transaction causes losses, what sanctions decision makers incur and what evidence shareholders can obtain to help them win their case if they choose to initiate a legal action in court. Doing Business continues this exercise and, starting in this year’s report, also measures other aspects of corporate law that are unrelated to this trans-action but that are also indicative of the strength of protection of minor-ity shareholders. This is particularly important to identify additional areas of potential improvement for policy makers and to provide researchers with a broader set of data for analyz-ing the relationship between corporate governance and economic outcomes (box 9.1). The fundamental development goal of promoting greater access to finance for entrepreneurs by encouraging regulation conducive to investment in capital markets remains the same— and is indeed reinforced by the provi-sion of data on a more comprehensive array of issues. To expand the coverage of the indicators, the Doing Business team first used academic literature and institutional reports to identify regulatory good practices that sup-port the relevant policy goals (box 9.2). The team then selected those that could be objectively measured and independently justified, that offer variation across economies and that lend themselves to data collection and verification through the annual Doing BOX 9.1 What is new in the protecting minority investors indicators? ě Name changed from protect-ing investors to clarify what is measured by the indicators— and what is not. ě Three indices added to mea-sure protections in matters beyond conflicts of interest: extent of shareholder rights index, strength of governance structure index and extent of corporate transparency index. ě Ease of shareholder suits index expanded to take into account the allocation of legal expenses. See the data notes for a detailed description of changes and addi-tions to the methodology. Business questionnaire on minority investor protections. Previously the protecting minority investors indicators assessed 18 com-ponents of the quality of regulations. Now 20 additional components that strengthen the rights of minority investors are measured, by 3 new in-dices: the extent of shareholder rights FIGURE 9.1 Shareholder rights in listed and nonlisted companies are consistent in most economies 0 10 20 30 40 50 60 70 80 90 100 Shareholders can remove directors before the end of their term. A company must obtain shareholders’ approval to issue new shares. Shareholders approve the election and dismissal of the external auditor. Shareholders representing 10% can call for an extraordinary meeting. Shares can be freely traded prior to a major corporate action. Shareholders have preemption rights on new shares. Shareholders have the right to amend bylaws or statutes with a simple majority. Share of economies where good practice applies (%) Listed companies Nonlisted companies Note: The good practices are those measured by the extent of shareholder rights index. Source: Doing Business database.
  • 89.
    78 DOING BUSINESS2015 index, the strength of governance structure index and the extent of cor-porate transparency index. In addition, a new component on the allocation of legal expenses associated with share-holder litigation has been added to the existing ease of shareholder suits index.8 Extent of shareholder rights index The ability of shareholders to influence important corporate decisions—such BOX 9.2 Standard setters and good practices Corporate governance practices around the world have been converging over the past 2 decades. This convergence is being driven by a group of global standard setters to which governments look for guidance on how to strengthen their corporate governance, financial reporting and securities regulations. It is also being driven by capital market trends— such as the growing use of cross-listings and dual listings—that lead to the adoption of common regulatory practices. Corporate governance The Organisation for Economic Co-operation and Development (OECD) has been establishing increasingly influential good practices in such areas as related-party transactions, conflicts of interest, approval requirements and disclosure obliga-tions. The methodology for the protecting minority investors indicators promotes good practices recommended by the OECD Principles of Corporate Governance.a For example, the indicators measure whether the division of responsibilities among shareholders, officers, directors, out-side auditors and regulators is clearly articulated in cases of conflict of interest, in line with OECD principle 1 on corporate governance (ensuring the basis for an effective corporate governance framework). They also capture the rights of minority shareholders to be informed about, and to participate in, general shareholder meetings and decisions relating to extraor-dinary transactions, consistent with principle 2 (rights of shareholders and key ownership functions). They investigate rules relating to insider trading and whether all shareholders of the same series of a class are treated equally, in line with prin-ciple 3 (equitable treatment of shareholders). And the extent of disclosure index directly follows principle 5 (disclosure and transparency), while the extent of director liability index echoes principle 6 (responsibilities of the board). Financial reporting and accounting The convergence of accounting standards has helped develop good practices in financial reporting. Two organizations— the International Accounting Standards Board, an independent body that sets the International Financial Reporting Standards (IFRS), and the Financial Accounting Standards Board (FASB), a U.S.-based organization that develops the Generally Accepted Accounting Principles (US GAAP)—have focused on driving this convergence over the past 15 years, issuing unified accounting standards for use by companies worldwide in both domestic and cross-border financial reporting. IFRS and US GAAP principles mandate strict financial disclosure with the aim of reducing information asymmetries be-tween companies and investors. An important benefit of a single set of high-quality, globally accepted accounting stan-dards is that investors can understand and compare the financial results of any company in the world. For this reason many jurisdictions incorporate IFRS and, to a lesser extent, US GAAP into their domestic reporting systems.b Securities regulations The International Organization of Securities Commissions (IOSCO) is an association of organizations that regulate se-curities markets. Its more than 200 members, which oversee more than 95% of the world’s securities markets, coopera-tively develop, implement and promote standards of regulation, oversight and enforcement to protect both investors and markets.c Another important driver of convergence in securities regulations is the increase in cross-listings and dual listings. To appeal to more risk-averse investors, companies in emerging markets are listing on more developed stock exchanges—such as the London Stock Exchange, the New York Stock Exchange or NASDAQ—in addition to their home country exchanges. Research has found that cross-listing on a U.S. stock exchange by a non-U.S. firm is associated with a significantly positive stock price reaction in the home market.d One reason is that cross-listing in the United States forces firms incorporated in juris-dictions with poor investor protection and enforcement systems to commit themselves to higher standards of corporate governance—and this increases the companies’ valuation by attracting otherwise reluctant foreign investors. a. OECD 2004. b. U.S. Securities and Exchange Commission 2012. c. “Advancing the SEC’s Mission through International Organizations,” U.S. Securities and Exchange Commission, http://www.sec.gov/about/offices/oia/oia_intlorg.shtml. For more information on IOSCO, see its website at http://www.iosco.org/about/. d. Huang, Elkinawy and Jain 2013.
  • 90.
    PROTECTING MINORITY INVESTORS79 as appointing and removing board members, issuing new stock and amending the company’s bylaws—is key to avoiding abuses by corporate insiders. In measuring this aspect Doing Business gives particular attention to the allocation of power between share-holders and management; studies have shown that greater power in the hands of shareholders can lead to greater management attention to shareholder interests and therefore to increased investment (figure 9.1). Strength of governance structure index Legally mandating separation between corporate constituencies can directly minimize potential agency conflicts. For example, risks associated with conflicts of interest increase exponentially when a CEO can also be chair of the board of directors or when there is no requirement for a minimum number of independent directors. Doing Business tracks legal requirements that strengthen the governance structure of companies, such as board independence, functional separation, audit and compensation committees, and limits on cross-shareholding and subsidiary ownership (figure 9.2).9 Extent of corporate transparency index Greater access to corporate information can have beneficial effects for firms. For example, where companies are required to disclose information about their finances, about the remuneration of their managers and directors and about other directorships they hold, research has found that this transparency improves corporate governance and lowers the cost of investment in capital markets.10 Doing Business uses questions relating to a company’s audit and financial statements to measure the extent to which companies are required to accurately present their business and financial condition, based on current knowledge and future expectations. Access to complete and accurate financial information is crucial to efficiently deploying investor capital (figure 9.3). Allocation of legal expenses in shareholder litigation Comprehensive rights are moot without effective ways to assert them. In optimal regulatory environments, enforcement is the duty both of efficient government agencies with adequate resources and of private shareholders willing to initiate legal actions whenever they suspect that a company in which they have invested is being mismanaged by corporate insiders. But such lawsuits, which often target companies (and directors or managers) with deeper pockets, are unlikely to occur unless FIGURE 9.2 Some areas of corporate governance continue to be overlooked in some economies 0 10 20 30 40 50 60 70 80 90 100 Changes to voting rights of shares must be approved only by the affected shareholders. A buyer must make an offer to all shareholders upon acquiring 50% of the company. A company must have a separate audit committee. A subsidiary is barred from acquiring shares issued by its parent company. The CEO is barred from also being the chair of the board of directors. The board of directors must include independent board members. Cross-shareholding between 2 independent companies is limited to 10%. Share of economies where good practice applies (%) Listed companies Nonlisted companies Note: The good practices are those measured by the strength of governance structure index. Source: Doing Business database. FIGURE 9.3 Corporate transparency could be enhanced in some areas 0 10 20 30 40 50 60 70 80 90 100 Annual financial statements must be audited by an external auditor. Financial statements must contain explanatory notes. Audit reports must be disclosed to the public. A company must disclose ownership stakes representing 10%. Board members' other positions and directorships must be disclosed. Managerial compensation must be disclosed on an individual basis. Share of economies where good practice applies (%) Listed companies Nonlisted companies Note: The good practices are those measured by the extent of corporate transparency index. Source: Doing Business database.
  • 91.
    80 DOING BUSINESS2015 shareholder plaintiffs can recover their legal expenses or the payment of their expenses can be made contingent on a successful outcome. The indicators now measure whether legal expenses incurred by shareholder plaintiffs can be charged to the company and whether plaintiffs can pay attorney fees depending on the damages they recover in court. WHAT DO THE RESULTS SHOW? Overall, OECD high-income economies have the strongest protections of minority shareholders as measured by Doing Business. These economies have the highest average score both on the extent of conflict of interest regulation index, which is the average of 3 exist-ing indices of minority shareholder protections, and on the extent of shareholder governance index, which is the average of the 3 new ones (table 9.1).11 The average scores for all regions except South Asia reflect stronger performance on protections from con-flicts of interest than on shareholder rights in corporate governance as measured by Doing Business, with the largest gap between the 2 dimensions in East Asia and the Pacific and Latin America and the Caribbean. Worldwide, India, France, Albania, Croatia and Switzerland have among the highest scores on the 3 new in-dices. Coincidentally, both India and Switzerland introduced legislation in the past year that directly addressed some of the new components mea-sured— India with a new companies act and Switzerland with a federal ordinance on abusive compensation. Among the regions with lower average scores on the 3 new indices, Sub- Saharan Africa suffers from having less developed securities regulations and capital markets, while the re-sults in East Asia and the Pacific and TABLE 9.1 OECD high-income economies offer the strongest protections overall and as measured by the new indices 0 50 100 150 200 Latin America and the Caribbean are attributable mostly to outdated company laws and the heterogeneity of the economies in these regions. In East Asia and the Pacific financial hubs with strong securities commissions and corresponding regulations—such as Hong Kong SAR, China; Singapore; and Malaysia—score well, in contrast with some of the smaller Pacific islands. A similar phenomenon is apparent in Latin America and the Caribbean when comparing Brazil and Colombia, which have the region’s highest scores, with such economies as Haiti, Grenada and St. Lucia. Globally, the results are in line with the results of research in this area sug-gesting positive correlations between Region Average score (0–10) Extent of conflict of interest regulation index Extent of shareholder governance index Strength of minority investor protection index OECD high income 6.4 6.2 6.3 Europe Central Asia 6.0 5.9 5.9 South Asia 5.2 5.3 5.3 East Asia Pacific 5.5 4.5 5.0 Middle East North Africa 4.8 4.6 4.7 Latin America Caribbean 5.1 4.1 4.6 Sub-Saharan Africa 4.8 4.4 4.6 Note: The strength of minority investor protection index is the average of the 2 other indices shown here. The extent of conflict of interest regulation index is the average of the extent of disclosure, extent of director liability and ease of shareholder suits indices. The extent of shareholder governance index is the average of the extent of shareholder rights, strength of governance structure and extent of corporate transparency indices. For details on how the indices are constructed, see the data notes. Source: Doing Business database. FIGURE 9.4 Greater protection of minority shareholders is associated with greater market capitalization Distance to frontier score for protecting minority investors (0–100), 2014 Market capitalization of listed companies (% of GDP), 2012 100 80 60 40 20 Note: The correlation between the distance to frontier score for protecting minority investors and market capitalization as a percentage of GDP is 0.34. The relationship is significant at the 5% level after controlling for income per capita. The sample includes 116 economies for which data on market capitalization are available. Source: Doing Business database; World Bank, World Development Indicators database.
  • 92.
    PROTECTING MINORITY INVESTORS81 FIGURE 9.5 OECD high-income economies systematically offer more protection for shareholders of listed companies than for shareholders of nonlisted ones Economies by relative level of shareholder protection in listed and nonlisted companies (%) 100 75 50 25 0 31 7 21 15 16 17 17 OECD high income 1 South Asia 5 5 Europe Central Asia Middle East North Africa 30 15 9 Higher protection in listed companies Same protection in listed and nonlisted companies Note: Shareholder protection is as measured by the extent of shareholder rights, strength of governance structure and extent of corporate transparency indices. The numbers shown in the bars are the number of economies in each category within each region. Source: Doing Business database. minority investor protection and eco-nomic outcomes: economies that have stronger regulation of related-party transactions and a greater minority shareholder role in corporate gover-nance also tend to have, for example, East Asia Pacific Latin America Caribbean Sub-Saharan Africa higher market capitalization (figure 9.4). Moreover, economies that tend to have greater shareholder involvement in cor-porate governance, as measured by the 3 new indices, also tend to have greater protection of minority shareholders in prejudicial related-party transactions, as measured by the 3 existing indices. The results thus confirm the validity of using the quality of regulation of related-party transactions as a proxy for the overall quality of corporate governance. Unsurprisingly, the economies that score best on the new indices have active stock exchanges with the requisite legal frameworks and enforcement agencies. Among the 189 economies covered by Doing Business, 124 apply stronger regulations to listed companies than to nonlisted ones, so that shareholders of listed companies are more protected.12 In all OECD high-income economies the regulations that apply to listed companies are more protective of minority shareholders, consistent with the more developed capital markets in these economies (figure 9.5). Sub-Saharan Africa is the only region where the majority of economies provide the same level of protection for minority shareholders in both types of companies, further confirming the link with the level of development of capital markets. But applying the same standards to both types of companies does not necessarily mean better overall pro-tection of shareholders. Somewhat counterintuitively, data show that the larger the gap, the better the overall protection: minority investors are more protected in economies that distinguish between shareholders of listed companies and sharehold-ers of nonlisted ones (figure 9.6). Indeed, economies that distinguish between these shareholder groups have adopted 55% on average of the good practices captured by the 3 new indices—while those that do not dis-tinguish have adopted 39% on average. FIGURE 9.6 Minority investors are more protected overall in economies that distinguish between shareholders of listed companies and shareholders of nonlisted ones Average share of good practices measured by the 3 new indices that apply (%) 80 70 60 50 40 30 20 10 0 Sub-Saharan Africa Latin America Caribbean Middle East North Africa East Asia Pacific South Asia Europe Central Asia OECD high income Listed companies Nonlisted companies Note: The 3 new indices are the extent of shareholder rights, strength of governance structure and extent of corporate transparency indices. Source: Doing Business database.
  • 93.
    82 DOING BUSINESS2015 CONCLUSION Results on the 3 new indices highlight great variation across the 189 econo-mies covered in the rights, responsibili-ties and protections afforded to minority shareholders, whether they are invest-ing in a nonlisted company or in a listed one. The new data set brings attention to areas of corporate governance that are often overlooked by policy makers. It also sheds light on the protection of shareholders in nonlisted companies, an aspect on which data are seldom collected and yet that could prove to be a particularly important area of legisla-tion and source of economic growth in economies with less developed stock exchanges and capital markets. More generally, the new indices should prove to be helpful in moving beyond a focus on the regulation of related-party transactions and identifying a broader array of features that could be lacking in the corporate law and securi-ties regulations of some economies— contributing to sounder regulations that both protect minority investors and enhance entrepreneurs’ access to equity finance. NOTES This case study was written by Nadine Abi Chakra and Hervé Kaddoura. 1. Djankov, La Porta and others 2008. Private benefits of control are defined as the economic advantages of a majority ownership stake. 2. Black and others 2010; Dharmapala and Khanna 2013. 3. McLean, Zhang and Zhao 2012. 4. Cremers and Ferrell forthcoming; Balasubramanian, Black and Khanna 2010; Caixe and Krauter 2013. 5. Lima and Sanvicente 2013. 6. Chen, Chen and Wei 2011. 7. Malhotra, Poteau and Fritz 2013; Black and Kim 2012; Guo and Masulis 2013; Lo, Wong and Firth 2010; Hodgson and Ruel 2012. 8. See the data notes for the full list of components added this year. 9. Cross-shareholding refers to 2 independent companies acquiring shares in each other. 10. Gilson 2000; Lima and Sanvicente 2013; Bartha, Konchitchkib and Landsmanc 2013; Lang, Lins and Maffett 2012. 11. The 3 existing indices are the extent of disclosure, extent of director liability and ease of shareholder suits indices. 12. For the purposes of the protecting minority investors indicators, nonlisted companies are defined as joint stock companies before they are listed on any stock exchange, or their functional equivalent under the respective legislation of the economies covered by Doing Business, and do not include other types of companies such as limited liability companies or sole proprietorships.
  • 94.
    Doing Business 2015 Going Beyond Efficiency Paying taxes Trends before and after the financial crisis Taxes matter for the economy. They provide the sustainable funding needed for social programs and public investments to promote economic growth and development and build a prosperous and orderly society. But policy makers face a difficult challenge in formulat-ing good tax policies: they need to find the right balance between raising revenue and ensuring that tax rates and the administrative burden of tax compliance do not deter participation in the system or discourage business activity. This balancing act is intensi-fied during periods of crisis. In an economic downturn some categories of public spending may automati-cally rise, putting pressure on deficits. Governments may at times need to deliver tax-based stimulus packages while also providing reassurance to markets that deficits will be reversed and public debt contained. WHY TAX POLICY MATTERS DURING CRISES The global financial crisis of 2008–09 had a dramatic impact on national tax revenue and led to a sharp increase in deficits and public debt. The decline in revenue began in 2008, when general government revenue fell by an average of 0.7% of GDP worldwide. Revenue de-clined by another 1.1% of GDP in 2009.1 The financial crisis led to a shrinking of economic activity and trade in most economies. Fiscal measures were part of the policy toolkit that governments brought to bear in supporting the recovery. Policy makers in most economies applied measures aimed at improving revenue collection while keeping the taxes lev-ied on businesses and households as low as possible, trying to strike a bal-ance between reducing the disincentive effects of high taxes and generating adequate resources to fund essential expenditures.2 Governments generally reduced the rates and broadened the base for corporate income tax while in-creasing the rates for the consumption tax or value added tax (VAT).3 In the European Union, for example, most member countries raised per-sonal income tax rates—often tem-porarily, through general surcharges or through solidarity contributions from high-income earners. In addi-tion, several EU members reduced their corporate income tax rate and changed corporate tax bases. Most of these changes were aimed at providing tax relief for investment in physical capital or research and development (RD) while limiting the deductibility of other items. By contrast, EU members commonly increased VAT rates along with statutory rates for energy and environmental taxes and for alcohol and tobacco taxes.4 Some govern-ments opted to broaden the VAT base by applying VAT to goods and services that had previously been subject to a zero rate and levying the standard VAT rate on products that had had a reduced VAT rate.5 Unifying VAT rates ƒ Over the 9-year period ending in 2012, the global average total tax rate as measured by Doing Business fell by 9.1 percentage points. Its rate of decline was fastest during the global financial crisis period (2008–10), averaging 1.8 percentage points a year, then started slowing in 2011. ƒ The average profit tax rate dropped sharply during the crisis period and then started to increase slightly in 2012. The average rate for labor taxes and mandatory contributions was stable throughout the 9-year period. ƒ The administrative burden of tax compliance has been steadily easing since 2004 with the growing use of electronic systems for filing and paying taxes. ƒ During the financial crisis there was an increase in the number of tax reforms. The pace of reform accelerated with the onset of the crisis, then slowed in subsequent periods.
  • 95.
    84 DOING BUSINESS2015 across all goods and services increases revenue and reduces compliance and administrative costs.6 Along with falling revenue, the global financial and economic crisis also led to growing tax compliance risks in some economies. Compliance with tax obli-gations and collection of tax revenue are important to support social pro-grams and services, for example. But in an economic downturn businesses tend to underreport tax liabilities, underpay the taxes due, fail to file their tax returns on time and even engage in transactions in the informal sector.7 Many economies redesigned their tax systems during that period with the objective of easing compliance with tax obligations. BEFORE AND AFTER THE CRISIS—A 9-YEAR GLOBAL TAX PROFILE Doing Business has been monitoring how governments tax businesses through its paying taxes indicators for 9 years, looking at both tax admin-istration and tax rates. The data give interesting insights into the tax policies implemented during the financial crisis of 2008–09. Doing Business looks at tax systems from the perspective of the business, through 3 indicators. The total tax rate measures all the tax-es and mandatory contributions that a standardized medium-size domestic company must pay in a given year as a percentage of its commercial profit.8 These taxes and contributions include corporate income tax, labor taxes and mandatory contributions, property taxes, vehicle taxes, capital gains tax, environmental taxes and a variety of smaller taxes. The taxes withheld (such as personal income tax) or collected by the company and remitted to the tax authorities (such as VAT) but not borne by the company are excluded from the total tax rate calculation. Two other indicators measure the com-plexity of an economy’s tax compliance system. The number of payments reflects the total number of taxes and contributions paid, the method of payment, the frequency of filing and payment, and the number of agencies involved. The time indicator measures the hours per year required to comply with 3 major taxes: corporate income tax, labor taxes and mandatory contri-butions, and VAT or sales tax. The indicators show that for businesses around the world, paying taxes became easier and less costly over the 9 years from 2004 through 2012. Falling tax cost for businesses Globally, the total tax rate for the Doing Business case study company averaged 43.1% of commercial profit in 2012.9 Over the 9-year period ending that year, the average total tax rate fell by 9.1 percentage points—around 1 percentage point a year. Its rate of decline was fastest during the crisis period (2008–10), averaging 1.8 per-centage points a year, then started slowing in 2011. The total tax rate fell by an average of 0.3 percentage points in 2011. The average rate for all 3 types of taxes included in the total tax rate—profit, labor and “other” taxes—also fell over the 9 years (figure 10.1).10 “Other” taxes decreased the most, by 5.9 percentage points—followed by profit taxes (2.7 percentage points) and labor taxes (0.5 percentage points). The main driver of the drop in “other” taxes was the replacement of the cascading sales tax with VAT by a number of economies, many of them in Sub-Saharan Africa. Seven economies made this change during the 9 years, 6 of them during the crisis period.11 This shift substantially reduces the tax cost for businesses: while a cascading sales tax is a turnover tax applied to the full value at every stage of production, a VAT is imposed only on the value added at each stage, and the final consumers bear the burden. While the total tax rate fell in all regions over the 9-year period, Sub-Saharan Africa had the biggest FIGURE 10.1 A global trend of steady decline in the total tax rate Global average total tax rate (% of commercial profit) Profit tax Labor tax Other taxes 20 19 18 17 16 15 14 13 12 11 10 2004 2005 2006 2007 2008 2009 2010 2011 2012 Note: The data refer to the 174 economies included in DB2006 (2004). The Bahamas, Bahrain, Barbados, Brunei Darussalam, Cyprus, Kosovo, Liberia, Libya, Luxembourg, Malta, Montenegro, Myanmar, Qatar, San Marino and South Sudan were added in subsequent years. Source: Doing Business database.
  • 96.
    PAYING TAXES 85 decline. Its average total tax rate dropped by almost 17 percentage points between 2004 and 2012. This aligned the region more closely with the rest of the world, though its aver-age total tax rate still remains the highest, at 53.4% in 2012 (figure 10.2).12 In addition, many African economies lowered rates for the profit tax, reduc-ing its share in the total tax rate. The size of the tax cost for businesses matters for investment and growth. Where taxes are high, businesses are more inclined to opt out of the formal sector. Given the disincentive effects associated with very high tax rates, the continual decline in the total tax rate has been a good trend for Africa. Other economies introduced new taxes during the 9-year period. For example, in 2010 Hungary introduced a sector-specific surtax on business activity in retail, telecommunications and energy supply. The new tax remained in force until December 31, 2012. In 2009 Romania introduced a minimum income tax. Also in 2009, the Kyrgyz Republic introduced a new real estate tax that is set at 14,000 soms (about $270) per square meter and further adjusted depending on the city loca-tion, the property’s location within the city and the type of business. The average profit tax rate in most economies fell consistently between 2004 and 2010, dropping most sharp-ly during the crisis period (2008–10), and then started to increase slightly in 2011 and 2012. The average rate for labor taxes and mandatory con-tributions remained stable throughout the 9-year period regardless of the financial crisis. In several economies this reflects concerns on the part of the authorities about the impact of aging populations and the need to strengthen the financial situation of pension systems. The 9-year trends for the 3 types of taxes included in the total tax rate are FIGURE 10.2 Among regions, Sub-Saharan Africa had the biggest reduction in the total tax rate Regional average total tax rate (% of commercial profit) 80 70 60 50 40 30 20 Sub-Saharan Africa Latin America Caribbean South Asia Middle East North Africa reflected in the changing composition of this rate. On average, labor taxes and mandatory contributions account for the largest share of the global total tax rate today, having risen from 32% of the total tax rate in 2004 to almost 38% in 2012. The profit tax share rose slightly, while “other” taxes fell from 10 2004 2005 2006 2007 2008 2009 2010 2011 2012 Europe Central Asia East Asia Pacific OECD high income Note: The data refer to the 174 economies included in DB2006 (2004). The Bahamas, Bahrain, Barbados, Brunei Darussalam, Cyprus, Kosovo, Liberia, Libya, Luxembourg, Malta, Montenegro, Myanmar, Qatar, San Marino and South Sudan were added in subsequent years. Source: Doing Business database. BOX 10.1 Using technology to make tax compliance easier Rolling out new information and communication technologies for filing and paying taxes and then educating taxpayers and tax officials in their use are not easy tasks for any government. But electronic tax systems, if implement-ed well and used by most taxpayers, benefit both tax authorities and firms. For tax authorities, electronic filing lightens workloads and reduces opera-tional costs such as for processing, handling and storing tax returns. This al-lows administrative resources to be allocated to other tasks, such as auditing or providing customer services. Electronic filing is also more convenient for users. It reduces the time and cost required to comply with tax obligations and eliminates the need for taxpayers to wait in line at the tax office.a It also allows faster refunds. And it can lead to a lower rate of errors. Electronic systems for filing and paying taxes have become more common worldwide. Of the 314 reforms making it easier or less costly to pay taxes that Doing Business has recorded since 2004, 88 included the introduction or enhancement of online filing and payment systems. These and other im-provements to simplify tax compliance reduced the administrative burden to comply with tax obligations. By 2012, 76 economies had fully implemented electronic systems for filing and paying taxes as measured by Doing Business. OECD high-income economies have the largest representation in this group. a. Bird and Zolt 2008.
  • 97.
    86 DOING BUSINESS2015 Global average time (hours per year) 130 120 110 100 90 80 70 Global average payments (number) 18 16 14 12 10 8 6 4 2 32% of the total in 2004 to only 25% in 2012. Easing of the tax administrative burden To comply with tax obligations in 2012, the Doing Business case study company would have made 26.7 payments and put in 268 hours (nearly 7 weeks) on average. This reflects an easing of the administrative burden—with 7 fewer payments and 62 fewer hours than in 2004. Consumption taxes have consistently been the most time consuming, re-quiring 106 hours in 2012, with labor taxes and mandatory contributions not far behind (figure 10.3). Corporate income tax takes the least time. While corporate income tax can be complex, it often requires only one annual return. Labor and consumption taxes are often filed and paid monthly and involve re-petitive calculations for each employee and transaction. And consumption taxes in the form of VAT require filing information on both input and output ledgers. The administrative burden for all the types of taxes eased over the 9 years. But it eased the most for labor taxes and mandatory contributions, with the time for compliance dropping by 23 hours on average and the number of payments by 4. This is thanks mainly to the introduction of electronic systems for filing and paying taxes and to ad-ministrative changes merging the filing and payment of labor taxes levied on the same tax base into one return and one payment. For labor and consump-tion taxes, with their requirements for repetitive calculations, the use of ac-counting software and electronic filing and payment systems can offer great potential time savings (box 10.1). In contrast to the total tax rate, the time for compliance declined the most just before the onset of the financial crisis for all 3 types of taxes: profit tax, labor tax and consumption taxes. The number of payments decreased steadily over the 9-year period. PATTERNS IN TAX REFORMS DURING THE CRISIS PERIOD Over the 9-year period ending in 2012, tax reforms peaked in 2008. Doing Business recorded 118 changes imple-mented that year making it easier or less costly to pay taxes (figure 10.4).13 The pace of reform slowed in the period immediately after the crisis: in 2011 Doing Business recorded only 43 such changes. Changes making it easier or less costly to pay taxes During the crisis period (2008–10) the most common changes affecting the paying taxes indicators were those cutting the corporate income tax rate (figure 10.5). Doing Business recorded 58 such changes during the 3-year FIGURE 10.3 The administrative burden of compliance has eased for all types of taxes 60 2004 2005 2006 2007 2008 2009 2010 2011 2012 Profit tax Labor tax Consumption taxes (sales and VAT) 2004 2005 2006 2007 2008 2009 2010 2011 2012 Profit tax Labor tax Other taxes 0 Note: The data refer to the 174 economies included in DB2006 (2004). The Bahamas, Bahrain, Barbados, Brunei Darussalam, Cyprus, Kosovo, Liberia, Libya, Luxembourg, Malta, Montenegro, Myanmar, Qatar, San Marino and South Sudan were added in subsequent years. Source: Doing Business database.
  • 98.
    PAYING TAXES 87 period. The next most common chang-es were those enhancing or introducing electronic systems for filing and paying taxes online—38 such changes were reported in total. These were aimed at easing the administrative burden of tax compliance to counter the greater risk of tax evasion during economic down-turns. Also common were changes to tax deductibility and depreciation rules that would respectively lower the tax cost for businesses and provide them with greater flexibility in planning their cash flow (with a total of 33 recorded). Reducing the corporate income tax rate was a change that many gov-ernments made during the financial crisis (box 10.2). In 2008–10 around 47 economies cut their rates. Moldova temporarily reduced its rate from 15% to 0%, effectively eliminating any tax on profits in 2008–11, then set the rate at 12% from January 1, 2012. Some econo-mies (Canada, Fiji, Greece, Indonesia, Slovenia, the United Kingdom) reduced their rates gradually, over several years. Others introduced temporary additional rate reductions. Vietnam cut its corporate income tax rate from 25% to 17.5% in 2009 as part of a stimulus package for small and medium-size businesses, then restored the standard rate for the following year. Other economies abolished their minimum income tax (France, Timor- Leste). Romania, having introduced a minimum income tax in May 2009, abolished it in October 2010. Some economies amended their income tax brackets rather than reducing rates. Portugal introduced tax brackets for profit tax in January 2009. Taxable corporate income up to €12,500 be-came subject to half the standard tax rate, while all income over this amount was taxed at the standard 25% rate. To stimulate investment in specific areas, some economies increased the percentage of allowance that could be applied on certain assets or allowed the FIGURE 10.4 An accelerating pace of tax reform during the global financial crisis Number of changes making it easier or less costly to pay taxes as measured by Doing Business Changes making it easier or less costly to pay taxes as measured by Doing Business, by type deduction of more expenses. Thailand, for example, encouraged capital invest-ment with accelerated depreciation for equipment and machinery acquired before December 2010. Australia introduced an investment allow-ance— an up-front deduction of 30% of the cost of new plant contracted for between January 1, 2009, and June 30, 2009, and installed by June 30, East Asia Pacific Europe Central Asia OECD high income Latin America Caribbean Middle East North Africa South Asia Sub-Saharan Africa 120 100 80 60 40 20 0 2004 2005 2006 2007 2008 2009 2010 2011 2012 Note: The data refer to the 174 economies included in DB2006 (2004). The Bahamas, Bahrain, Barbados, Brunei Darussalam, Cyprus, Kosovo, Liberia, Libya, Luxembourg, Malta, Montenegro, Myanmar, Qatar, San Marino and South Sudan were added in subsequent years. The changes shown for each year are those recorded from June 1 of that year to June 1 of the following year. Source: Doing Business database. FIGURE 10.5 During the crisis period many economies cut the corporate income tax rate while continuing to improve tax administration Abolished or merged taxes Introduced or enhanced electronic system Reduced labor taxes Made changes in tax depreciation or deductibility rules that reduced tax cost Reduced corporate income tax rate 80 70 60 50 40 30 20 10 0 2004 2005 2006 2007 2008 2009 2010 2011 2012 Note: The data refer to the 174 economies included in DB2006 (2004). The Bahamas, Bahrain, Barbados, Brunei Darussalam, Cyprus, Kosovo, Liberia, Libya, Luxembourg, Malta, Montenegro, Myanmar, Qatar, San Marino and South Sudan were added in subsequent years. The changes shown for each year are those recorded from June 1 of that year to June 1 of the following year. The figure does not show all types of changes making it easier or less costly to pay taxes recorded by Doing Business. Source: Doing Business database.
  • 99.
    88 DOING BUSINESS2015 BOX 10.2 The Republic of Korea—a comprehensive approach to supporting an economy in recession The 2008 global credit crunch and ensuing economic recession hit Korea hard. Heavily dependent on manufactured exports and closely integrated with other developed markets through both trade and financial links, the Korean economy contracted sharply in 2009 and public finances came under pressure. Reflecting diminished confidence in the short-term outlook, the value of the Korean won fell sharply. This helped lead to rapid consideration of a package of measures aimed at putting in place the conditions for a recovery. The government set priorities for tax policy: supporting low- and middle-income taxpayers, facilitating job creation, pro-moting investment and sustainable growth, rationalizing the tax system and ensuring the sustainability of public finances.a Measures to support low- and middle-income taxpayers included changes in both individual and corporate taxation (such as a special tax credit for small and medium-size enterprises). To support the continuation of family businesses, the govern-ment reduced the inheritance tax and allowed deductions of up to 10 billion won (about $10 million) when a small or medium-size enterprise is inherited, extending this to 50 billion won (about $50 million) in 2014. To help self-employed individuals who were forced to close their businesses in 2009, the government offered an exemption from paying delinquent taxes until the end of 2010 for those starting a new business or getting a new job. The exemption was further extended until the end of 2014. To support local business development, it gave a corporate income tax deduction of 100% for the first 5 years and 50% for the next 2 years to companies relocating to Korea from abroad. To support future growth, it introduced RD incentives for companies and also increased the deductibility of education expenses for individuals. Korea also accelerated the implementation of some tax changes already in the pipeline. It reduced the corporate income tax rate for taxable income below 200 million won ($197,972) from 13% to 11% in 2008 and to 10% starting in 2010. For the up-per bracket (above 200 million won) it reduced the rate from 25% to 22% in 2009 and to 20% in 2010 and thereafter. Korea reduced the personal income tax rate by 1 percentage point for the middle bracket and by 2 percentage points for the top bracket while also increasing allowable deductions. In addition, Korea strengthened tax compliance regulation, imposing penalties on high-income earners for failure to issue cash receipts and introducing more severe punishment for frequent and high-profile tax evaders. It also increased the stat-ute 2010. Austria introduced accelerated depreciation (30% for the first year) for tangible fixed assets produced or acquired within a specified time period. Spain introduced unlimited tax depre-ciation for investments made in new fixed assets and immovable property in 2009 and 2010, later extending this to investments made before December 31, 2012. Changes making it more complex or costly to pay taxes Some economies introduced new taxes (16 in total in 2008–10). These were mostly small taxes such as en-vironmental taxes, vehicle taxes, road taxes and other social taxes. Finland increased energy taxes while cutting the income tax rate during the reces-sion. In 2011 Italy raised VAT and local property tax rates, though it also cut labor and corporate income tax rates. In 2010 Pakistan increased the VAT rate from 16% to 17% and raised the minimum tax rate from 0.5% to 1% levied on turnover. Other tax changes involved increases in labor taxes and mandatory contri-butions borne by the employer (figure 10.6). Estonia increased the unemploy-ment insurance contribution rate twice during 2009, from 0.3% to 1% on June 1, 2009, and to 1.4% on August 1, 2009. Iceland increased the social security contribution rate for employers from 5.34% to 7% in July 2009—and the pen-sion contribution rate from 6% to 7%. CONCLUSION The financial crisis had a substantial impact on national tax revenue, leading in many economies to larger govern-ment deficits and higher levels of public debt. This may have helped trigger efforts to redesign tax systems, with governments aiming to strike the right balance between raising additional rev-enue and avoiding a greater tax burden on businesses. of limitation for prosecution for certain tax crimes. Supporters of Korea’s approach believe that it enabled the country to recover faster and more strongly from the global crisis than most other OECD countries.b Korea was one of only a handful of OECD countries that actually registered a reduction in public debt levels over the period 2009–13. Most other advanced economies saw rapid increases in public indebtedness as a result of policy interventions to deal with the effects of the financial crisis.c a. Korea, Ministry of Strategy and Finance 2012. b. OECD 2012. c. International Monetary Fund, World Economic Outlook Database.
  • 100.
    PAYING TAXES 89 Changes making it more complex or costly to pay taxes as measured by Doing Business, by type The data collected for the paying taxes indicators show a clear trend of in-creasing changes to tax policies during the crisis. Among the most common changes as measured by the indica-tors were those cutting the corporate income tax rate while increasing VAT rates and those enhancing or intro-ducing electronic systems for filing and paying taxes. Changes easing the administrative burden of tax compli-ance countered the greater risk of tax evasion that arises during economic downturns. In addition, governments introduced new tax deductibility and depreciation rules that would lower the tax cost for businesses, provide them with greater flexibility in planning their cash flow and stimulate investment in specific areas. NOTES This case study was written by Michelle- Christine Hanf, Joanna Nasr and Nadia Novik. 1. World Bank, World Development Indicators database. 2. OECD 2010b. 3. Buti and Zourek 2012. 4. Buti and Zourek 2012. 5. Buti and Zourek 2012. 6. OECD 2010a. 7. Brondolo 2009. 8. Commercial profit is net profit before all taxes borne. It differs from the conventional profit before tax, reported in financial statements. In computing profit before tax, many of the taxes borne by a firm are deductible. In computing commercial profit, these taxes are not deductible. Commercial profit therefore presents a clear picture of the actual profit of a business before any of the taxes it bears in the course of the fiscal year. It is computed as sales minus cost of goods sold, minus gross salaries, minus administrative expenses, minus other expenses, minus provisions, plus capital gains (from the property sale) minus interest expense, plus interest income and minus commercial depreciation. To compute the commercial depreciation, a straight-line depreciation method is applied, with the following rates: 0% for the land, 5% for the building, 10% for the machinery, 33% for the computers, 20% for the office equipment, 20% for the truck and 10% for business development expenses. Commercial profit amounts to 59.4 times income per capita. 9. This is an unweighted average across 189 economies. 10. The terms profit tax and corporate income tax are used interchangeably in this case study. “Other” taxes include small taxes such as vehicle taxes, environmental taxes, road taxes, property taxes, property transfer fees, taxes on checks and cascading sales tax. 11. The 7 economies are Burundi, the Democratic Republic of Congo, Djibouti, The Gambia, the Seychelles, Sierra Leone and the Republic of Yemen. 12. This is the average for all Sub-Saharan African economies included in Doing Business 2013 (45 in total). 13. These reforms include both major and minor reforms as classified by Doing Business. These include changes in statutory rates, changes in deductibility of expenses and depreciation rules, administrative changes affecting time to comply with 3 major taxes (corporate income tax, labor taxes and mandatory contributions, and VAT or sales tax) and introduction or elimination of taxes. Under the paying taxes methodology, the tax system assessment for calendar year 2008 covers reforms recorded from June 1, 2008, to June 1, 2009, a period that includes the start of the financial crisis in September 2008 and the months immediately following it. FIGURE 10.6 Among other changes to tax systems during the crisis period, those introducing new taxes were the most common Introduced new tax Increased labor taxes Made changes in tax depreciation or deductibility rules that increased tax cost Increased corporate income tax rate 18 16 14 12 10 8 6 4 2 0 2004 2005 2006 2007 2008 2009 2010 2011 2012 Note: The data refer to the 174 economies included in DB2006 (2004). The Bahamas, Bahrain, Barbados, Brunei Darussalam, Cyprus, Kosovo, Liberia, Libya, Luxembourg, Malta, Montenegro, Myanmar, Qatar, San Marino and South Sudan were added in subsequent years. The changes shown for each year are those recorded from June 1 of that year to June 1 of the following year. The figure does not show all types of changes making it more complex or costly to pay taxes recorded by Doing Business. Source: Doing Business database.
  • 101.
    Doing Business 2015 Going Beyond Efficiency Enforcing contracts How judicial efficiency supports freedom of contract Freedom of contract is the abil-ity of adults and groups—such as corporations and other legal entities—to freely decide whether to enter into an enforceable agreement and to determine the rights and obligations of their bargain. This freedom is essential to an efficient economy: without it, and without enforcement of contracts, there would be little stability in financial ar-rangements, and uncertainty and lack of trust would discourage people from participating in economic life. This case study explores what freedom of contract means and examines how it is regulated in a sample of 34 econo-mies belonging to different regions and income groups, chosen mostly on the basis of the quality of the data col-lected by the Doing Business team in each economy.1 It also looks at judicial efficiency in contract resolution in the same 34 economies, using data for the enforcing contracts indicators as a proxy for judicial efficiency. Even substantial freedom of contract could become irrelevant without effective mechanisms for resolving commercial disputes, because firms would find themselves operating in an environ-ment where compliance with contrac-tual obligations is not the norm.2 As in previous years, the ranking on the ease of enforcing contracts continues to be based exclusively on the time, cost and procedural complexity of resolving commercial disputes before local first-instance courts. This year’s research on freedom of contract is a one-time exercise that will not be replicated in future editions of the report and has no implications for the data or rankings for enforcing contracts. Additionally, in carrying out this exercise the team does not intend to advocate in favor of more or less freedom of contract but instead aims to provide an overview of local regulations. In regulating freedom of contract, economies worldwide have had to draw the line between very extensive and very limited freedom of contract (figure 11.1). Most have drawn the line somewhere in between. Where freedom of contract is very narrowly regulated, most transactions fall within the strict schemes dictated by the law, leaving the contracting parties with limited negotiating power. But where it is not narrowly regulated, the law contains only the most common limitations (such as for public policy reasons and to prevent fraud and duress), allow-ing the parties to freely negotiate the terms of their agreement. Where there are few limitations to freedom of contract, 2 capable and consenting adults would be able to conclude a 10-year loan contract with an interest rate of 50% or even contract to sell a house worth $1 million for a penny. But they would not be able to circumvent public policy limitations and conclude a contract by which, for example, one of the parties sells himself as a slave or forces the other into an unwanted agreement—limitations of this sort have become widely accepted in modern law. While most would agree ƒ In regulating freedom of contract, authorities around the world have had to strike a balance between the desire to give contracting parties the ability to enter into mutually beneficial arrangements and the need to provide adequate safeguards against possible abuse. ƒ Worldwide, the most common limitations to freedom of contract stem from local legislation, through which the government attempts to draw a boundary between the use and misuse of bargaining power. Other limitations stem from the courts, which play a vital role in shaping freedom of contract by deciding whether or not to enforce certain agreements. ƒ In a sample of 34 economies, none allow the parties to a contract to exclude liability for gross negligence or for damages resulting in personal injury. Similarly, all of the economies consider contracts void or voidable if concluded in contravention of public policy or under duress, fraud or coercion. Only 4—the Democratic Republic of Congo, Pakistan, the Philippines and Sri Lanka—set no statutory limit on interest rates. Almost half (14) explicitly prohibit covenants restricting the alienation of real property. ƒ Even where there is considerable freedom of contract, slow resolution of contract disputes can impose implicit limitations. Without reasonably expeditious dispute resolution, the meaning of freedom of contract can be greatly eroded.
  • 102.
    ENFORCING CONTRACTS 91 that contracts contravening public policy should be illegitimate, some would disagree on whether the first 2 contracts should be enforced. HOW THE LITERATURE DEFINES FREEDOM OF CONTRACT In the legal and economic literature there is wide consensus on a definition of freedom of contract, intended to be the power of contracting parties to freely determine the content of their agreement without interference from the government or from other individuals.3 The concept is generally given both a negative and a positive meaning. Negative freedom of contract is freedom from interference by the government or by other individuals, while positive freedom of contract is the ability of parties to freely deter-mine the content of an agreement.4 While there is broad agreement on a general definition, every economy limits freedom of contract in different ways. In regulating these limitations, the main debate has centered on the role that should be played by the courts and by the state in general. In the late 1800s and early 1900s legislators, influenced by classical contract theory, relied on the notion that only the parties to a contract can evaluate whether it is beneficial, leading to the idea that whether agreements are prudent and profitable should be determined not by the courts but by the parties them-selves. 5 At the time, the private sphere represented a realm in which individual freedom and autonomy were protected from state intervention. Any legisla-tion that disturbed parties’ equality was seen as an arbitrary interference with liberty of contract, which no government could legally justify. In this context freedom of contract had few limitations; legislators were more con-cerned with protecting the sanctity of the bargain because they believed that maximizing individual profits through freedom of contract would promote efficiency in commercial markets.6 During the mid-1900s, however, governments and courts started to acknowledge the tension between the parties’ desire for certainty and stability in private agreements and the need to ensure fairness for weak and vulnerable individuals; concepts such as fraud, duress and undue influence began to play a bigger role in court decisions on limitations to freedom of contract.7 In this context freedom of contract was no longer seen as abso-lute but instead as a liberty to be en-joyed within the framework of the law, designed to protect individuals from threats to health, safety, morals and welfare. The court decisions spurred a debate over the government’s role in imposing limitations on freedom of contract, and a more paternalistic ap-proach emerged. This entailed overrul-ing individuals’ contractual preferences for their own good, to protect them from the damaging consequences of their agreements.8 Several countries started to regulate contractual rela-tionships under the assumption that in certain circumstances people are un-able to identify their own preferences.9 Today most economies regulate limita-tions to freedom of contract by pairing this paternalistic approach with a program of social justice animated by distributive motives, economic ef-ficiency and overall fairness, which has led to rules favoring some groups in the struggle for welfare.10 U.S. labor law offers a great example of this evolution. In the late 1800s and early 1900s courts invalidated laws that limited freedom of contract, including laws with minimum wage requirements, laws with restrictions on maximum working hours or union par-ticipation and federal child labor laws.11 In these cases the court assumed a near equality of bargaining power and found it anomalous that the law would favor one party over the other. This ap-proach dominated in the early 1900s and culminated in the 1905 decision Lochner v. New York, in which the court invalidated a New York law limiting the daily number of hours a baker could work. However, this Lochnerian freedom of contract, the freedom that required parties to live with their duly executed contracts however overreaching or disadvantageous to the weaker party, succumbed to the state’s interests.12 During the late 1930s legislation and case law relying on the notion that countries should retain the right to protect individuals from entering into a contract against their health, safety or welfare started to emerge. Laws FIGURE 11.1 Spectrum of the possible limitations to freedom of contract Parties have little to no freedom in negotiating contract conditions because of numerous limitations imposed by law. All economies in the sample fall within this category. Parties have considerable freedom in negotiating contract conditions because the law limits freedom of contract only for reasons relating to public policy, fraud and duress. Very limited freedom of contract Midrange freedom of contract Very extensive freedom of contract
  • 103.
    92 DOING BUSINESS2015 regulating child labor, maximum hours, health and safety, sexual and moral harassment, and nondiscrimination in recruitment and hiring were more and more often enforced by the courts. When distributive motives started to play a bigger role in labor laws, so did measures regulating minimum wage and retirement security. Today, despite the differences in ap-proaches to setting the boundary between the use and misuse of bargain-ing power, some limitations—such as those relating to voluntariness, freedom from coercion, and natural and legal capacity—are universally accepted. Worldwide, there are laws intended to prevent people from using force, secre-cy, duress or fraud to compel others to enter into contracts that they would not agree to under different circumstances. Similarly, there are contract rules in ef-fect to void agreements that appear to have been freely entered into but were not in actuality, because of the incapac-ity of one of the contracting parties. These limitations have become an in-dispensable part of any comprehensive definition of freedom of contract, now intended to be both freedom of the parties from interference by the state and freedom from imposition by one another.13 Among the 34 economies in the sample, all have legislation deeming contracts unenforceable for reasons of public policy, duress, coercion, fraud, incapacity or undue influence. WHY FREEDOM OF CONTRACT MATTERS FOR FIRMS Freedom of contract is a critical in-strument for economic progress and efficiency.14 Its unrestricted exercise by parties with equal bargaining power, comparable skills and good knowledge of relevant market conditions maximiz-es individual welfare and promotes the most efficient allocation of resources in the marketplace.15 In addition, freedom of contract contributes to the estab-lishment of a functional economy in which predictability is prized.16 Worldwide, the most common limita-tions to freedom of contract stem from the government, through its attempt to draw a boundary between the use and misuse of bargaining power. Others stem from the courts, which play a vital role in shaping freedom of contract when deciding whether to enforce certain agreements. Indeed, people have true freedom of contract only if the courts enforce their agree-ments. 17 Courts have a dual role in this context—both to protect individuals from unreasonable government regula-tions and to clarify and apply rightful limitations. Additionally, the judiciary must also make sure that freedom of contract remains meaningful by ensur-ing timely enforcement of contracts. WHAT METHODOLOGY WAS USED To investigate limitations to freedom of contract in the 34 sampled economies, the Doing Business team added several new questions to this year’s question-naire on enforcing contracts. These questions focus on 10 possible limita-tions to freedom of contract, relating to issues ranging from land transfers to consideration, choice of law and limited liability clauses (box 11.1). To ob-serve meaningful differences between economies, the team focused on issues that have been extensively debated throughout the relevant literature and case law, although a consensus has BOX 11.1 Possible limitations to freedom of contract explored through this year’s research O Statutory limits on interest rates O Limitations on consideration and on determination of contract price in future agreements O Limitations on clauses restricting land transfers O Limitations on “choice of law” clauses in commercial contracts (clauses specifying that any dispute arising under the contract will be determined in accordance with the law of a particular jurisdiction) O Limitations relating to asymmetry of power and to unconscionability (a doctrine in contract law referring to terms that are so one-sided in favor of a party with superior bargaining power that they are contrary to good conscience) O Limitations on disclaimers on implied warranties (guarantees that the item sold is merchantable and fit for the purpose intended) O Limitations on clauses allowing termination at will (clauses usually in-cluded in employment agreements that permit an employee or employer to terminate the employment relationship at any time for any or no reason at all) O Limitations on clauses limiting liability, such as for negligence (conduct that departs from what would be expected of a reasonably prudent person acting under similar circumstances) O Restrictions on terms included in standard-form contracts (contracts be-tween 2 parties in which the terms and conditions are set by one of the parties and the other party has little or no ability to negotiate more favor-able terms) O Limitations for reasons relating to public policy, capacity, duress, coercion, fraud and undue influence
  • 104.
    ENFORCING CONTRACTS 93 been reached on most of them. The 34 economies were chosen from the 189 covered by Doing Business in a way that ensures a representative sample across regions and income groups. One area explored through this research deals with the limitations imposed by national laws on consideration, traditionally defined as anything of value promised to the other party when concluding a contract. Consideration often takes the form of money, though it does not have to. In the sale of a house, for example, the selling party’s consideration could be the purchase price or a promise to pay this price, while the buyer’s consideration could be the house. The team investigated whether local courts can exercise any scrutiny on the adequacy of consider-ation and whether the determination of consideration can be left to a future agreement between the parties. If freedom of contract is not restricted, courts should exercise no scrutiny on consideration as long as the parties willingly and knowingly accepted the terms of the contract. But if freedom of contract is restricted, courts may rule on the adequacy of consideration to ensure the fairness of all transactions carried out in the marketplace. The inclusion of choice-of-law clauses in international contracts was also ex-amined. These clauses specify that any dispute arising under the contract will be determined under the law of a par-ticular jurisdiction. Economies limiting freedom of contract in this area usually do not allow such clauses or allow them only if the parties have a relationship with the chosen jurisdiction. Those without strict limitations on freedom of contract do not forbid such provisions. Other areas of research included in this year’s questionnaire are somewhat more controversial from a social, eco-nomic and philosophical perspective. Two research questions in particular provide an interesting example of this controversy: whether an economy has any regulations setting a cap on interest rates and what rules govern asymmetry of power. These questions go to the heart of whether usury laws and laws governing an imbalance in bargaining power should legitimately impose limits on freedom of contract. Both sides of the debate have been defended at length. Those arguing in favor of these laws conclude that with-out them, free markets would produce perverse incentives to take excessive credit risks, which drive up the cost of the welfare system as a whole.18 Those arguing against them conclude that courts should enforce all voluntary contracts that do not produce nega-tive consequences for others—while redistribution of wealth should oc-cur through the welfare system, not through laws and regulations.19 On the question of asymmetry of negotiating power, those who defend freedom of contract argue that if contracts signed between parties with unequal bargaining power were treated as invalid because of this asymmetry, those with more power would refuse to sign contracts with people with less power, leading to the exclusion of these people from the market.20 To capture the differences in the legal treatment of asymmetry of power in contracts, the team collected data on whether lo-cal laws contain restrictions on terms that can be used in standard-form contracts or on provisions allowing termination at will. In both cases, as in all other cases covered in this study, it is assumed that both parties have full legal capacity and entered into the contract freely. After analyzing the laws addressing these issues in the sampled econo-mies, the team counted the number of limitations to freedom of contract in each economy. The higher the number of limitations, the more limited the freedom of contract. The maximum number of limitations in the study is 10. Any limitation, even in the form of an exception to a general principle, is counted; no relevance is given to the in-tensity of the limitation. For limitations on contract provisions restricting land transfers, for example, 1 point is given even if the limitations are not imposed on all transactions but apply only to those involving foreigners. In carrying out this exercise the team does not intend to advocate in favor of more or less freedom of contract but instead aims to provide an overview of local regulations. Furthermore, in counting the number of limitations the team does not intend to suggest that a lower number—connected with greater freedom of contract in laws and regulations—is more desirable. The sole purpose in providing the number of limitations is to understand how the sampled economies regulate freedom of contract, without giving any judg-ment on the quality of the regulations or on their desirability. WHAT THE RESULTS SHOW Among the 34 economies covered, Tunisia has the highest number of limi-tations to freedom of contract, with 8 of the 10 limitations measured. At the opposite end of the spectrum is the Democratic Republic of Congo, with only 3 of the 10 limitations (figure 11.2). The results not only show that all 34 economies have struck a balance be-tween the extremes of very limited and very extensive freedom of contract; they also reflect some consensus on the limitations that should be imposed. For example, none of the economies allow the parties to a contract to exclude liability for gross negligence or for damages resulting in personal injury. Similarly, none of them allow contracts concluded in contraven-tion of public policy or under duress, fraud or coercion. And only 4 of the economies—the Democratic Republic
  • 105.
    94 DOING BUSINESS2015 FIGURE 11.2 The Democratic Republic of Congo has the fewest limitations to freedom of contract 10 9 8 7 6 5 4 3 2 1 of Congo, Pakistan, the Philippines and Sri Lanka—set no statutory limit on interest rates. But there is less agreement on other limitations to freedom of contract. For example, there is great variation among the economies on whether the law pro-hibits covenants restricting alienation of real property. A clause of this type would, for example, forbid the buyer from selling the property for a certain number of years after purchasing it. Of the 34 economies, 14 explicitly prohibit this kind of covenant, though 9 of these 14 economies allow restrictions on alien-ation of real property when foreigners are involved in the transaction. The rest of the economies allow these contract provisions. Among the 7 regions covered, Europe and Central Asia is the only one in which no variation was found in the number and type of limitations imposed on freedom of contract. All sampled econo-mies in the region have the following 6 limitations: ƒ A cap is imposed by law on interest rates. ƒ Courts can exercise scrutiny on the adequacy of consideration. ƒ The determination of a contract price cannot be left to a future agreement, unless the contract already establishes how the price will be determined. ƒ Limitations are imposed by law on clauses that can be included in standard-form contracts. ƒ Liability for gross negligence cannot be excluded through mutual agree-ment of the parties. ƒ A contract cannot be agreed upon if its terms are against public policy or if one of the parties does not have full legal capacity. The other 6 regions show more variation in the number and type of limitations. Sub-Saharan Africa is a good example. While the Democratic Republic of Congo has the smallest number of limitations in the overall sample, with 3, Togo has one of the largest numbers, with 7. Togo is the only Sub-Saharan African econo-my in the sample that allows the courts to deny enforcement of a contract on the basis of inadequate consideration. In addition, only 2 of the 5 Sub-Saharan African economies in the sample do not limit the terms that can be included in a standard-form contract, while all 5 allow termination at will, choice-of-law clauses and disclaimers on implied warranties as long as the seller was not acting in bad faith. Across all regions, only 3 economies forbid choice-of-law clauses in in-ternational contracts. All 3—Brazil, Colombia and Uruguay—are in Latin America and the Caribbean. Even where there is considerable freedom of contract, slow resolution of contract disputes can impose implicit limitations. Without reason-ably expeditious dispute resolution, the meaning of freedom of contract is eroded; parties might be able to conclude most contracts on their own terms, but long contract resolution times would ultimately frustrate that ability. In Singapore parties not only have broad negotiating power; they also have the certainty that their con-tracts will be enforced promptly. The country imposes few limitations on freedom of contract, and resolving Number of limitations to freedom of contract Tunisia Uruguay Togo Taiwan, China Greece Brazil Turkey Romania Poland Mozambique Malta Macedonia, FYR India Germany France Czech Republic Croatia Colombia Cambodia Bulgaria United Arab Emirates South Africa Lebanon Italy El Salvador China Bhutan Barbados Sri Lanka Singapore Philippines Pakistan Nigeria Congo, Dem. Rep. 0 Source: Doing Business database.
  • 106.
    ENFORCING CONTRACTS 95 Time to enforce a contract (days) Congo, Dem. Rep. Sri Lanka Pakistan 2 3 4 5 6 7 8 9 a standardized commercial dispute through the courts—from the filing of the case to the enforcement of the contract—takes 150 days as measured by Doing Business (figure 11.3), a global best practice. In Sri Lanka there are equally few limitations to freedom of contract, but resolving the standard-ized dispute through the courts takes 1,318 days—almost 4 years. Parties might be able to include a wide array of covenants in their agreements, but long enforcement times can nullify the utility of those covenants. A slow contract resolution process frustrates freedom of contract. The Democratic Republic of Congo is another economy where long enforce-ment times frustrate freedom of contract. It limits freedom of contract only in the areas of future determina-tion of contract price, exclusion of li-ability for gross negligence, and public policy and legal capacity. But resolv-ing the standardized dispute takes 610 days—almost 2 years. Pakistan provides a similar example: there are only 4 limitations to freedom of con-tract, but resolving the standardized dispute takes 976 days in Karachi. Freedom of contract and efficient contract enforcement are often mutu-ally dependent because one can lose meaning without the other, as shown in the examples above. Among the 34 economies in the sample, however, there are cases where neither is prized. Greece is a clear example. Not only does Greece have one of the highest numbers of limitations (7), it also has among the longest resolution times in the sample. Resolving the standardized dispute in Athens takes 1,580 days—more than 4 years. Similarly, in Tunisia, the economy with the highest number of limitations in the sample (8), enforcing a contract takes 565 days. CONCLUSION Freedom of contract and efficient con-tract enforcement matter to business-es. The exercise of freedom of contract by parties with similar negotiating power and good knowledge of market conditions promotes efficiency in the allocation of resources, maximizing in-dividual welfare and spurring efficiency in the marketplace.21 Efficient contract enforcement promotes investment by influencing the decisions of economic actors. By promoting investment, good judicial institutions can also contribute to economic growth and development. Indeed, an effective judiciary, by pro-viding a structured, timely and orderly framework for resolving disputes, fos-ters economic stability and growth. Moreover, efficient contract enforce-ment is essential to allow true freedom of contract. Even where the law allows extensive freedom of contract, the ben-efits of this can be greatly undermined if not matched by efficient contract en-forcement. Without that, the predict-ability of the legal framework—which is highly valued by firms operating in the market—would be compromised.22 NOTES This case study was written by Erica Bosio and Tanya Maria Santillan. 1. The 34 economies in the sample are Barbados; Bhutan; Brazil; Bulgaria; Cambodia; China; Colombia; the Democratic Republic of Congo; Croatia; the Czech Republic; El Salvador; France; Germany; Greece; India; Italy; Lebanon; the former Yugoslav Republic of Macedonia; Malta; Mozambique; Nigeria; Pakistan; the Philippines; Poland; Romania; Singapore; South Africa; Sri Lanka; Taiwan, China; Togo; Tunisia; Turkey; the United Arab Emirates; and Uruguay. 2. Ramello and Voigt 2012. 3. Braucher 1969. 4. Berlin 1969. 5. Eisenberg 1995; Edwards 2009; Marella 2006. 6. Scott 2002. 7. Edwards 2009; DiMatteo and Rich 2006. 8. Kronman 1983. 9 Shapiro 1988; Marella 2006. 10. Kennedy 1982, 2006; Kronman 1983. 11. Adkins v. Children’s Hospital; Adair v. United States; Coppage v. Kansas; Hammer v. Dagenhart; Carter v. Carter Coal Company; Weber 2013. 12. West Coast Hotel Co. v. Parrish; Weber 2013. 13. Kennedy 1982. 14. Basu 2006; Edwards 2009. 15. Edwards 2009. 16. Weber 2013. 17. Kennedy 1982. 18. Posner 1995. 19. Pettit 1999; Posner 1995. 20. Basu 2006. 21. Edwards 2009. 22. Brunetti, Kisunko and Weder 1997, 1998. FIGURE 11.3 Singapore is among the economies with both the fewest limitations to freedom of contract and the fastest contract resolution Tunisia Singapore Greece 1,600 1,400 1,200 1,000 800 600 400 200 0 Number of limitations to freedom of contract Source: Doing Business database.
  • 107.
    Doing Business 2015 Going Beyond Efficiency Resolving insolvency Measuring the strength of insolvency laws The word bankruptcy often evokes negative associations with fail-ure and shame. And fear of bank-ruptcy and its consequences can deter potential entrepreneurs from starting a new business venture. According to a recent survey on entrepreneurship, people from a range of social and de-mographic groups rank the possibility of going bankrupt as the greatest fear associated with starting a business, above irregular income and lack of job security.1 Yet evidence suggests that the exit of firms from the market is a neces-sary condition for economic growth, and efficient exit frameworks may in fact encourage greater entrepreneurial ac-tivity and new firm creation.2 Moreover, businesses started by previously failed entrepreneurs can grow faster than those started by first-timers.3 While reducing the stigma associ-ated with bankruptcy may be difficult, policy makers can minimize the nega-tive effects of business failures and take advantage of their positive effects by adopting efficient and well-functioning bankruptcy laws. Several studies show a strong link between bankruptcy laws and credit market development, as reflected by such aspects as collateral eligibility requirements, access to loans to finance investments, access to long-term debt and the level of firms’ financ-ing relative to their size.4 And studies on the effects of bankruptcy reforms show that speeding up the resolution of debt disputes may increase the probability of timely repayment; that increasing the protection of creditors and their participation in bankruptcy proceedings may lead to a lower cost of debt and a higher aggregate level of credit; and that introducing reorganization proceedings may reduce the rate of business failure.5 Moreover, efficient bankruptcy regimes with orderly procedures for the sale and distribution of debtors’ assets can have a positive effect on loan terms, leverage ratios and bank recovery rates.6 Bankruptcy laws play such an im-portant role because they promote predictability for both creditors and entrepreneurs—by establishing the rules for the worst-case scenario. They allow entrepreneurs to determine the maximum risk associated with a failed venture.7 And they allow creditors to calculate the maximum risk associated with an unpaid loan. Collection of debt through bankruptcy proceedings may be the least attractive option for any creditor, because these proceedings in-volve several creditors trying to enforce their claims against the same debtor.8 So, having transparent, enforceable rules on the types of decisions that creditors can influence during bank-ruptcy proceedings, on the priority of creditors and on other important issues is critical for lenders—and becomes a key factor for them in fixing interest rates and maturity terms for loans.9 AN EXPANDED FOCUS FOR THE INDICATORS The Doing Business indicators on resolv-ing insolvency measure the efficiency ƒ Doing Business introduces a new component of the resolving insolvency indicator set this year, the strength of insolvency framework index. This indicator tests whether each economy has adopted internationally recognized good practices in the area of insolvency. ƒ The good practices underlying the new indicator are based on 2 sources—the World Bank’s Principles for Effective Insolvency and Creditor/Debtor Regimes and the United Nations Commission on International Trade Law’s Legislative Guide on Insolvency Law. ƒ OECD high-income economies have the highest average score on the strength of insolvency framework index. South Asia is the region with the lowest average score on the index. ƒ Economies that have reformed their insolvency laws in the past several years score substantially higher on the strength of insolvency framework index than economies with outdated insolvency provisions. ƒ Economies with better insolvency laws as measured by Doing Business tend to have more credit available to the private sector.
  • 108.
    RESOLVING INSOLVENCY 97 of insolvency (bankruptcy) frameworks around the world. Until this year the focus was on capturing the time, cost and outcome of the most likely in-court proceeding involving a domestic debtor in each economy. These 3 measures were then used to calculate the recovery rate—how much of its loan a secured creditor would be able to recover at the end of the proceedings. This year Doing Business has introduced an important change in methodology for the resolving insolvency indicators. Besides measuring the recovery rate, it now also tests whether each economy has adopted internationally recognized good practices in the area of insol-vency. A new indicator, the strength of insolvency framework index, measures good practices in accordance with principles developed by the World Bank and the United Nations Commission on International Trade Law (UNCITRAL)— the World Bank’s Principles for Effective Insolvency and Creditor/Debtor Regimes (referred to here as the “World Bank principles”) and UNCITRAL’s Legislative Guide on Insolvency Law (“UNCITRAL guide”).10 The purpose behind expanding the scope of the methodology is to capture multiple aspects of the insolvency framework in each economy. The new strength of insolvency framework in-dex measures the quality of insolvency laws, while the previous methodology (recovery rate) captures the insolvency practice. Thus the expanded meth-odology will provide a more complete and balanced view of the insolvency framework in each economy by ad-dressing both the quality of the law and the efficiency of its implementa-tion. One of the findings this year is that economies with a higher quality of insolvency laws as measured by the strength of insolvency framework index experience on average higher recovery rates.11 Additionally, while the previous methodology focused mainly on secured creditors, the new index widens the reach of the resolving insolvency indicator set to debtors and unsecured creditors. Both the World Bank principles and the UNCITRAL guide avoid using the term bankruptcy and instead use the broader term insolvency. The 2 guidebooks generally agree on the objectives of an effective and efficient insolvency re-gime, and both provide specific recom-mendations on each of these objectives (the UNCITRAL guide, a multivolume publication, covers a multiplicity of op-tions). The good practices tested under the new indicator are closely linked with the objectives identified in both guidebooks and follow the provisions elaborated in them (table 12.1). The strength of insolvency frame-work index measures whether each economy has adopted internationally recognized good practices in 4 areas: commencement of insolvency pro-ceedings, management of the debtor’s assets, reorganization proceedings and creditor participation in insolvency proceedings. Each of these topics is addressed by a separate component index through several questions. ƒ The commencement of proceedings index measures what type of pro-ceedings (liquidation, reorganization or both) debtors and creditors can initiate and what standard is used to declare a debtor insolvent. ƒ The management of debtor’s assets index measures whether, during insolvency proceedings, a debtor can continue transactions essential to the survival of the business and terminate contracts that are overly burdensome; whether preferential and undervalued transactions made by the debtor prior to the commencement of insolvency can be avoided; and whether the debt-or can obtain new financing during insolvency proceedings to support its continuous operation. ƒ The reorganization proceedings index measures whether and how credi-tors vote on a reorganization plan and what protections are available to dissenting creditors. ƒ The creditor participation index measures whether creditors partici-pate in important decisions during insolvency proceedings, such as ap-pointment of the insolvency repre-sentative and sale of assets during the proceedings; whether creditors have access to information about the debtor and the proceedings; and whether creditors can object to decisions affecting their rights, such as approval of claims submitted by other creditors. The information used to compile the strength of insolvency framework in-dex was provided by private and public sector insolvency practitioners in each economy with reference to the appli-cable laws and regulations. The Doing Business team analyzed both primary and secondary sources in evaluating to what extent insolvency laws in each economy accord with internationally accepted good practices. Based on this analysis, the team assigned a score for each of the 4 component indices. The sum of these 4 scores is the score on the strength of insolvency framework index. (For a more detailed description of the scoring methodology, see the data notes.) WHERE ARE GOOD PRACTICES MOST COMMON? OECD high-income economies have the highest scores on average on the strength of insolvency framework index and on each of the 4 component indices (figure 12.1). Among the econo-mies in this region, Germany and the United States have the highest scores. Europe and Central Asia has the second highest average score on the strength of insolvency framework index, though there is a substantial difference be-tween the average score of Eastern and Central European economies and that
  • 109.
    98 DOING BUSINESS2015 of Central Asian economies. Economies that have recently reformed their insolvency laws—such as Bulgaria, Romania, the former Yugoslav Republic of Macedonia and Montenegro—have the region’s highest scores, having implemented many of the good prac-tices measured by the index as part of their reform efforts. East Asia and the Pacific and Sub- Saharan Africa are tied with the third highest score. Economies with some of the highest scores in Sub-Saharan Africa are those that adopted the OHADA (Organization for the Harmonization of Business Law in Africa) Uniform Act Organizing Collective Proceedings for Wiping Off Debts. In East Asia and the Pacific there is great variation in the strength of insolvency frameworks. Economies that have recently amended their insolvency laws, such as China, Cambodia and the Philippines, receive high scores, while other economies have no formal insolvency framework, such as Palau and the Marshall Islands. The region with the lowest average score on the strength of insolvency framework index is South Asia. Very few economies in the region have insolvency laws that facilitate the continuation of the debtor’s busi-ness during insolvency proceedings. Economies in the Middle East and North Africa score only slightly better. Only 2 economies in this region have a reorganization framework, and many lack a designated insolvency law; in-stead, provisions related to insolvency are found in company laws and com-mercial codes. In Latin America and the Caribbean some economies have well-developed insolvency laws, such as Brazil, Mexico and Colombia, for example, all of which score relatively high on the strength of insolvency framework index. But most of the smaller economies in the region, particularly island economies, still use winding-up provisions in companies acts that have not been amended for several decades. This analysis shows that economies that have reformed their insolvency TABLE 12.1 Objectives of an effective insolvency regime as identified by the World Bank principles and the UNCITRAL guide and measured by the resolving insolvency indicators World Bank principles UNCITRAL guide Resolving insolvency indicators Integrate with a country’s broader legal and commercial systems Provision of certainty in the market to promote economic stability and growth Maximize the value of a firm’s assets and recoveries by creditors Maximization of value of assets New indicator tests whether the value of the debtor’s assets can be preserved by continuing contracts of the debtor essential to survival of its business, by rejecting overly burdensome contracts, by invalidating preferential and undervalued transactions and by obtaining post-commencement financing. Provide for the efficient liquidation of both nonviable businesses and businesses whose liquidation is likely to produce a greater return to creditors and reorganization of viable businesses Existing indicators test whether viable businesses can be reorganized and whether businesses in liquidation can be sold as a going concern. Strike a careful balance between liquidation and reorganization, allowing for easy conversion of proceedings from one proceeding to another Striking a balance between liquidation and reorganization New indicator tests whether creditors and debtors have access to both liquidation and reorganization proceedings and what the basis is for declaring a debtor insolvent. Provide for equitable treatment of similarly situated creditors, including similarly situated foreign and domestic creditors Ensuring equitable treatment of similarly situated creditors New indicator tests how similarly situated creditors vote on a reorganization plan and what treatment they receive under the plan. Provide for timely, efficient, and impartial resolution of insolvencies Provision for timely, efficient and impartial resolution of insolvency Existing indicators test how long the proceedings take and how much the proceedings cost for the creditors. Prevent the improper use of the insolvency system New indicator tests the basis for commencing insolvency proceedings. Prevent the premature dismemberment of a debtor’s assets by individual creditors seeking quick judgments Preservation of the insolvency estate to allow equitable distribution to creditors This principle is tested by the strength of legal rights index.a Provide a transparent procedure that contains, and consistently applies, clear risk allocation rules and incentives for gathering and dispensing information Ensuring a transparent and predictable insolvency law that contains incentives for gathering and dispensing information New indicator tests the level of creditor participation during insolvency proceedings, including their ability to request information and to challenge decisions directly affecting their rights. Recognize existing creditor rights and respect the priority of claims with a predictable and established process Recognition of existing creditor rights and establishment of clear rules for ranking of priority claims New indicator tests whether post-commencement creditors receive priority over existing creditors. This principle is also tested by the strength of legal rights index.b Establish a framework for cross-border insolvencies, with recognition of foreign proceedings Establishment of a framework for cross-border insolvency Because Doing Business focuses on domestic entities and transactions, the indicators do not test this principle. a. The strength of legal rights index (part of the getting credit indicator set) tests whether the insolvency framework includes automatic stay (moratorium) provisions, which suspend all individual creditor actions during insolvency. b. The strength of legal rights index tests the level of priority of secured creditors’ claims as compared with other claims—tax claims, employee claims, judgments. Source: Analysis based on World Bank (2011b) and UNCITRAL (2004).
  • 110.
    RESOLVING INSOLVENCY 99 Average recovery rate (cents on the dollar) 16 100 12 8 4 laws in the past several years score substantially higher on the strength of insolvency framework index than economies that rely on old insolvency provisions in companies acts and commercial codes. WHAT ARE RELATIVE STRENGTHS AND WEAKNESSES? The strength of insolvency framework index can be a meaningful instrument for governments to use in reforming their insolvency system, because it enhances the ability to identify areas where each economy can improve. The data for the component indices point to 2 areas where many economies can improve: reorganization proceedings and creditor participation (figure 12.2). There is also room for improvement in the management of the debtor’s as-sets, to facilitate continuous operation during insolvency. A third of the economies covered by Doing Business have no formal judicial reorganization framework. This means that preservation of insolvent busi-nesses in these economies is virtually impossible, so that the only option for an insolvent debtor is to sell its assets. More than 40% of economies lack spe-cific provisions in their insolvency laws that would allow debtors to maintain contracts supplying essential goods and services during insolvency proceedings. While some of these economies require utilities to continue providing services to insolvent customers, for many debtors this is not enough to ensure continuous operation. For example, a manufactur-ing company must have raw materials to continue operating. And a retail business cannot operate without mer-chandise. If suppliers can cancel their contracts as soon as a debtor becomes insolvent, the debtor’s business op-erations must stop, greatly reducing the value of its assets. Many economies do not allow creditors to participate in important decisions throughout insolvency proceedings. Among the first and most important decisions made after insolvency proceedings begin is the appointment of an insolvency representative, who often has the authority to act on behalf of the debtor and make key decisions about the management of its assets. Almost 60% of economies exclude creditors from the process of choosing the insolvency representative. Lack of meaningful participation can affect creditors’ confidence in the system, making them less cooperative and more litigious and thus prolonging the proceedings. The data for the component indices also point to economies with particular strengths in the areas measured. For example, Germany is one of 51 econo-mies that receive full points on the commencement of proceedings index. The country has unified insolvency proceedings, which means that when a debtor or creditor files for insolvency, there is no requirement to specify whether liquidation or reorganization is requested. But a debtor may submit a reorganization plan together with its insolvency petition or at a later stage, and creditors may request the insolvency administrator to prepare a reorganization plan based on the financial evaluation of the company. The standard for initiating insolvency proceedings is flexible and includes both illiquidity (inability to pay debts as they mature) and overindebtedness (the debtor’s assets no longer cover existing liabilities). The German insol-vency framework also allows the com-mencement of insolvency proceedings when illiquidity is imminent, which may encourage debtors to file for insolvency before their financial circumstances become too dire. Japan is one of 26 economies that re-ceive full points on the management of debtor’s assets index. Reorganization and liquidation proceedings in Japan are covered by 2 separate laws. Both laws include provisions that facilitate the continuation of the debtor’s busi-ness during insolvency. For example, both prohibit the termination of FIGURE 12.1 OECD high-income economies have well-developed insolvency frameworks and the highest recovery rates 0 75 50 25 0 Average strength of insolvency framework index (0–16) Average strength of Average recovery rate insolvency framework index South Asia Middle East North Africa Latin America Caribbean Sub-Saharan Africa East Asia Pacific Europe Central Asia OECD high income Source: Doing Business database.
  • 111.
    100 DOING BUSINESS2015 Average index score as % of best score 100 80 60 40 20 contracts on the sole ground that the debtor has become insolvent and allow the debtor (or an administrator or trustee in bankruptcy) to decide which contracts should be continued during insolvency and which should be terminated. This allows the business to receive essential goods and services that will enable it to survive while elimi-nating overly burdensome obligations that may threaten its operation. Both laws also allow the avoidance of pref-erential and undervalued transactions concluded before the commencement of proceedings. In addition, in both liquidation and reorganization proceedings the debtor (or an administrator or trustee in bank-ruptcy) is allowed to take new loans if necessary for continuation of the business, though approval of the court may be required. New loans are treated as common benefit claims and receive preference over the claims of general unsecured creditors but not over those of secured creditors, whose preference remains unchanged. Such provisions on post-commencement financing permit a debtor in financial difficulties to continue operating while they also recognize and preserve the priority of existing creditors with preferential claims. Cambodia is one of 17 economies that receive full points on the reorganization proceedings index. In 2007 Cambodia adopted a new insolvency law that, among other features, introduced a reorganization procedure. Under the new law, when a reorganization plan is proposed, all creditors whose rights are impaired or modified by the plan vote on whether to approve or reject it. This includes secured and preferential creditors, because they may represent a substantial share of the value of the debt and their participation may be necessary to achieve successful reor-ganization. But creditors whose rights are not affected do not have the right to vote, as this would grant them un-necessary influence. For the purposes of voting on the plan, creditors are classified into different classes based on their interests (secured claims, tax claims, unsecured claims). All creditors within a class must be treated equally, and at least one class must approve the plan. To ensure equitable treatment of dissenting creditors, the Cambodian law requires that they receive at least as much under the reorganization plan as they would receive in liquidation. Despite Cambodia’s adoption of a modern and comprehensive insolvency law, however, recovery rates remain very low. As this example illustrates, a modern law is not enough to achieve an efficient insolvency practice; effec-tive implementation and a developed judiciary framework are also essential. Switzerland is one of only 3 econo-mies that receive full points on the creditor participation index. The Swiss insolvency law allows creditors to participate in many important deci-sions during insolvency. For example, creditors can reject the administrator appointed by the court and must approve the handling of the debtor’s assets during insolvency proceedings. They can obtain copies of records re-lated to the insolvency proceedings so as to stay informed about every stage of the process. And they have the right to object to decisions directly affecting their rights—for example, they can dispute decisions accepting the claims of other creditors. WHAT ARE THE LINKS WITH CREDIT MARKET DEVELOPMENT? Analysis of the data collected for the strength of insolvency framework index confirms the connection many researchers have made between insolvency laws and credit market development. Economies that score well on the index have higher levels of credit provided to the private sec-tor by domestic financial institutions (figure 12.3). These results suggest that the quality of bankruptcy laws is important not for its own sake but as an indication of FIGURE 12.2 Two areas where many economies can improve are reorganization proceedings and creditor participation 0 Middle East South Asia North Africa Latin America Caribbean Sub-Saharan Africa East Asia Pacific Europe Central Asia OECD high income Commencement of proceedings index Management of debtor’s assets index Reorganization proceedings index Creditor participation index Source: Doing Business database.
  • 112.
    RESOLVING INSOLVENCY 101 Strength of insolvency framework index (0–16), 2014 0 50 100 150 200 250 300 and perhaps a step toward a better-developed financial system. Where credit institutions and entrepreneurs can anticipate the outcome of the worst-case scenario—when a busi-ness fails to pay its loans and several creditors must compete for the best return—more banks will be willing to lend and more entrepreneurs will be willing to take on the challenge of starting a business. CONCLUSION Analysis of the data collected for the strength of insolvency framework index shows that economies with recent changes to their insolvency frameworks have better-quality laws. Among other economies, several still have no formal insolvency framework and many more rely on outdated companies acts and commercial codes for insolvency rules. Differences in regulatory quality are especially apparent in regions with emerging economies, such as Latin America and the Caribbean and East Asia and the Pacific. The strength of insolvency frame-work index can be a useful tool for governments seeking to reform their insolvency laws because it helps in identifying specific areas where in-solvency regulations are lacking. The results suggest that there is oppor-tunity in many economies to improve reorganization proceedings, facilitate the continuation of businesses during insolvency and allow greater par-ticipation by creditors in insolvency proceedings. NOTES This case study was written by Klaus Koch Saldarriaga, Olena Koltko and María Antonia Quesada Gámez. 1. European Commission 2012. 2. Cirmizi, Klapper and Uttamchandani 2010. 3. Stam, Audretsch and Meijaard 2006. 4. See Araujo, Ferreira and Funchal (2012) for a summary of different studies on the relationship between creditors’ rights and economic development. 5. Klapper 2011. 6. Cirmizi, Klapper and Uttamchandani 2010. 7. Lee, Peng and Barney 2007. 8. Haselmann, Pistor and Vig 2010. 9. Qian and Strahan 2007. 10. World Bank 2011b; UNCITRAL 2004. 11. For more on the relationship between the strength of insolvency framework index and the recovery rate, see figure 1.7 and the related discussion in the overview. FIGURE 12.3 Economies with strong insolvency frameworks have higher levels of domestic credit provided to the private sector 16 12 8 4 0 Domestic credit to private sector (% of GDP), 2013 Note: Domestic credit to private sector refers to financial resources provided to the private sector by financial corporations, such as through loans, purchases of nonequity securities, and trade credits and other accounts receivable, that establish a claim for repayment. The correlation between the strength of insolvency framework index and domestic credit to private sector as a percentage of GDP is 0.40. The relationship is significant at the 1% level after controlling for income per capita. Source: Doing Business database; World Bank, World Development Indicators database.
  • 113.
    Doing Business 2015 Going Beyond Efficiency Highlights from the Doing Business research conference Data produced by Doing Business have inspired and enabled abundant empirical research on critical questions puzzling economists, policy makers and international de-velopment professionals. Researchers have used these data to investigate the importance of business-friendly regulation for the creation of new firms, for the productivity and profit-ability of existing ones and for such key outcomes as growth, employment, in-vestment and informality. Since 2003, when the first Doing Business report was published, 2,024 research articles have been published in peer-reviewed academic journals and 5,098 working papers have been posted online.1 As a stock-taking exercise, the World Bank Group convened an international research conference, “Doing Business: Past, Present and Future of Business Regulation,” in the winter of 2014.2 The conference brought together academ-ics, World Bank Group staff and de-velopment professionals from around the world to showcase and discuss the impact of regulatory reform and to of-fer guidance for the Doing Business proj-ect in the years to come. Researchers presented 28 papers in the 8 thematic sessions, covering such issues as entry regulation, entrepreneurship, innova-tion, financial infrastructure, foreign direct investment, trade, labor mar-kets, growth, corruption and transpar-ency in regulation. This chapter presents the main findings and methodology of selected papers from the conference. All these papers point to important practical implica-tions for policy makers—about how sensible regulation can help stimulate the creation of new firms, help attract investment, facilitate a reduction in unemployment, aid innovative firms and support greater lending to the private sector, and about how bribery and corruption act as “sand” and not “grease” in the wheels of policy imple-mentation (see table 13A.1 at the end of the chapter for a summary). WHAT MATTERS FOR ENTREPRENEURSHIP? Several papers look at factors that encourage or discourage entrepreneur-ship. Klapper, Love and Randall (2014) investigate the relationship between entrepreneurship and economic growth and the effect of the 2008–09 global financial crisis on new firm registration. The authors explore the change in new firm registrations in 109 countries over the period 2002–12, which includes precrisis, crisis and recovery periods related to the global financial crisis as well as myriad other economic fluctua-tions at the region and country level. They find strongly procyclical results: country-specific GDP growth is associ-ated with higher new firm registrations, even after the global macroeconomic shocks are controlled for. Moreover, they find that growth has a stronger association with entrepreneurship in economies with a higher level of finan-cial development and a better business ƒ Doing Business data have inspired and enabled abundant research: 2,024 research articles published in peer-reviewed academic journals since 2003, and 5,098 working papers posted online. ƒ The World Bank Group convened an international research conference, “Doing Business: Past, Present and Future of Business Regulation,” in the winter of 2014. ƒ According to findings of research presented at the conference, business-friendly regulation has a positive association with the entry of new firms, the profits of innovative firms, reductions in unemployment, growth in bank lending, inflows of foreign direct investment and expansions in franchises. ƒ Striking a balance in the amount of regulation matters. Having some business entry regulation helps define the playing field for firms and reduces the cost of information search for those entering new markets. But too much regulation increases the cost of doing business, dissuading firms from entering markets at all and thus hurting economic development prospects. ƒ Corruption acts as “sand” and not “grease” in the wheels of policy implementation. Firms confronted with demands for bribes wait about 1.5 times as long to get a construction permit, operating license or electricity connection as firms that did not have to pay bribes.
  • 114.
    HIGHLIGHTS FROM THEDOING BUSINESS RESEARCH CONFERENCE 103 regulatory environment (as measured by the Doing Business indicators). One important policy implication of their findings is that fostering an effi-cient regulatory environment for the fi-nancial and private sector can contrib-ute to economic growth by aiding the efficient exit of insolvent firms during economic slowdowns and encouraging a speedier recovery in the formation of new firms during economic expansions. A growing body of empirical evidence based on cross-country variations shows that excessive regulation or burdensome legal procedures for start-ing a company can deter the entry of new firms and thus affect economic performance. But less is known about the effects on economic performance when the regulatory burden or entry regulation varies within countries—and as subnational Doing Business reports have shown, there is evidence of great variation in the regulatory burden within some countries. While most research in this area focuses on developing or emerging economies, Bripi (2013) focuses on Italy, analyzing how differences among provinces in the local regulatory burden affect firm creation. Italy is a particu-larly interesting case because it has great heterogeneity in entrepreneur-ship and economic performance, with marked differences between the more developed regions of the Center and North and the less developed ones of the South. The author analyzes differences in bureaucratic burdens across Italian provinces before a major reform (single notice) that reduced the number of procedures and the time for starting a business. In the period examined there was a negative correlation between the time and cost of procedures and the entry rate of small limited liability firms (figure 13.1). After controlling for the effect of additional variables, FIGURE 13.1 Bureaucratic time delays and costs are associated with lower entry by small limited liability firms across Italian provinces Entry rate of small limited liability firms, average for 2005–07 Potenza Perugia Aosta including measures of local financial development and efficiency of bank-ruptcy procedures, the author finds that bureaucratic time delays (and, to a lesser extent, costs) due to inefficient regulatory procedures reduced the en-try rate in industries that should have “naturally” high entry rates relative to low-entry sectors. The estimates show robust evidence of the negative effect of time delays on the entry rate of small limited liability firms. The re-lationship between cost and the entry rate is also statistically significant, though it depends on the specification used. For example, the effect of cost is significant only in less developed provinces, in those with a higher level of corruption and in the service sectors (not in manufacturing). Overall, the results confirm the view that the regulatory burden on new start-ups matters for business creation. In particular, they provide evidence that the administrative burden in the years just before the reform was a significant obstacle Entry rate of small limited liability firms, average for 2005–07 Perugia to entrepreneurship (and ultimately economic performance) in the heavily regulated provinces of the South rela-tive to the more lightly regulated ones of the Center and North of Italy. Audretsch, Belitski and Desai (2014) investigate how the overall business environment affects urban entrepre-neurship. They look at a few dimensions of the business environment (such as those measured by the Doing Business indicators on starting a business, regis-tering property, paying taxes, enforcing contracts and trading across borders) and types of regulatory reform (those affecting measures of time, cost and procedures)—and examine the links between these aspects and 2 measures of entrepreneurship, new business cre-ation and self-employment. The authors find that the national busi-ness environment is associated with both measures of entrepreneurship and that the type of regulatory reform can affect entrepreneurship outcomes. In particular, they find evidence that 2 3 4 5 6 4 2 0 -2 2 3 4 5 6 4 2 0 -2 Veneto Trieste Bolzano Sardinia Napoli Trento Milano Bologna Ancona Torino Bari L’Aquila Firenze Roma Genova Catanzaro Campobasso Palermo Veneto Trieste Bolzano Sardinia Napoli Trento Bologna Milano Ancona Bari L’Aquila Torino Firenze Aosta Genova Potenza Campobasso Roma Catanzaro Palermo Log of time Log of cost Note: Entry rate is the ratio of the number of newly registered small limited liability firms to the total number of limited liability firms. Source: Bripi 2013.
  • 115.
    104 DOING BUSINESS2015 specific regulatory dimensions (such as contract enforcement) as well as particular types of regulatory reform within each dimension (such as those affecting cost measures) are associ-ated with the rate of self-employment and new business creation. Audretsch, Belitski and Desai find evidence that different dimensions and pillars (time, cost, number of procedures) of the business environ-ment could have different effects on entrepreneurship. They also find that in some cases their 2 measures of en-trepreneurship (new business creation and self-employment) are affected dif-ferently by the same regulatory dimen-sion or same type of regulatory reform. CAN REGULATION ATTRACT INVESTMENT? Jovanovic and Jovanovic (2014) analyze whether business regulation—as mea-sured by Doing Business indicators— affects inflows of foreign direct investment in 28 Eastern European and Central Asian countries. They find that greater regulatory efficiency as measured by Doing Business indicators has a positive association with foreign direct investment inflows from OECD countries. For example, a country in which 9 documents are required to export is likely to have investment inflows around 37% lower than those in a country in which 7 such documents are required. This effect seems strong, so it may also include the effects of other barriers to trade, such as the cost or time to export, both of which are highly correlated with the number of documents required to export (with a correlation coefficient of around 0.75). The authors also find that a reduction in the cost of starting a business is positively associated with an increase in foreign direct investment inflows. Eight of the 9 sets of Doing Business indicators included in the analysis appear to have a statistically signifi-cant relationship with foreign direct in-vestment inflows (starting a business, dealing with construction permits, registering property, protecting minor-ity investors, paying taxes, trading across borders, enforcing contracts and resolving insolvency); none of the getting credit indicators do. The indica-tors measuring cost appear to be more important than those measuring time and number of procedures. The authors therefore conclude that governments may be able to attract foreign direct investment by creating a more efficient and more business-friendly regulatory environment. Hoffman, Munemo and Watson (2014) look at how different aspects of the business climate affect the location decisions of U.S. franchise companies. They find that a stable system of governance, citizen participation and good-quality public services all increase the chances of franchise location in a country. Of particular interest are the findings on business entry regulation. Having some regulation helps define the playing field for firms and reduces the cost of information search for those entering new markets. But too much regulation increases the cost of doing business, dissuading firms from entering markets at all and thus hurt-ing economic development prospects. Excessive taxation also discourages the entry of franchisors into a country. The findings suggest a diminishing return from regulation after a certain point. INNOVATION AND THE CONSTRAINTS OF RED TAPE Innovation is a key source of economic growth, so understanding the dynamics of innovative firms is important. Using firm-level panel data from emerging economies, Yang (2014) examines the relationship between the business climate and profitability for innovative and noninnovative firms. The author finds that in business climates where nonregulatory elements (such as infrastructure or levels of crime) are poor, innovative firms have higher profits than noninnovative firms. But in business climates where regulatory or governance-related elements (such as corruption or the time and cost to start a business) are poor, innovative firms have lower profits. Innovative firms tend to have more-educated managers, better tech-nologies and better access to finance, which may explain their greater ability to cope in poor business climates. But they may also suffer more from red tape. Innovative firms may experience greater friction as they attempt to expand or to enter new markets— because creating new products requires interactions with government officials to apply for licenses or permits, where firms can encounter bureaucratic de-lays or requests for bribes. HOW DEBT ENFORCEMENT CAN BOOST LENDING Legal protections of creditors’ rights are critical to support bank lending to the private sector. Judicial efficiency and substantive law defining creditors’ rights have been shown to be positively correlated with bank lending. But in India bank lending to the private sector has more than doubled in the past 2 decades despite few improvements in judicial efficiency and substantive law. What explains the expansion in bank lending over this period? Rathinam (2014) looks at the short- and long-term effect of the introduction of debt recovery tribunals, a procedural law innovation that reduced the transac-tion cost of availing the law. These quasi-judicial bodies bypass the over-burdened civil courts in adjudicating fi-nancial disputes involving banks. Debt recovery tribunals were introduced in a staggered way across Indian states,
  • 116.
    HIGHLIGHTS FROM THEDOING BUSINESS RESEARCH CONFERENCE 105 allowing comparison of lending by banks with and without access to the tribunals. Rathinam finds that the introduction of debt recovery tribunals changed the perception of lenders in the short run: banks with access to tribunals loaned more than those without access. In the long run the debt recovery tribunals have had an effect on lending, even after both bank- and state-specific fixed effects are controlled for. This finding confirms the argument that good substantive law, if effectively en-forced, enhances investors’ and credi-tors’ confidence in the system, which results in a larger volume of credit and ultimately greater economic growth. While confirming the causal link from law to finance, the author also points to the role of procedural law in enhancing adjudication and thus the availability of credit to the private sector. CAN REGULATION HELP REDUCE UNEMPLOYMENT? Freund and Rijkers (forthcoming) in-vestigate the factors that lead to swift, substantial and sustained reductions in unemployment. The authors exam-ine the incidence and determinants of episodes of drastic reductions in the unemployment rate—reductions of at least 3.25 percentage points of the initial level that persist for a minimum of 3 years. They identify 43 such epi-sodes over a period of nearly 3 decades in 94 high-income, middle-income and transition economies. Unemployment reduction episodes often coincide with an acceleration of growth and an improvement in mac-roeconomic conditions. Such episodes are much more prevalent in countries with higher levels of unemployment and, given unemployment, are more likely in those with better regulation. An efficient legal system that enforces contracts expeditiously is particularly important for reducing unemployment. The authors’ findings suggest that while employment is largely related to the business cycle, better regulation can reduce the likelihood of high un-employment and promote a more rapid recovery if unemployment builds up. They also underscore the importance of effective contract enforcement and secure property rights in enabling growth in employment. CORRUPTION—SAND OR GREASE? Freund, Hallward-Driemeier and Rijkers (2014) investigate whether corruption accelerates policy implementation. The authors start by documenting striking differences between the time it takes to complete regulatory proce-dures in practice and the time it takes when complying with the law. These are shown in figure 13.2, which plots the 10th percentile, median and 90th percentile de facto log times to get a construction permit in a given country and year as reported by entrepreneurs in the World Bank Enterprise Surveys against the time it should take to complete all the formalities to build a warehouse according to the Doing Business indicators. The authors link this heterogeneity to the incidence of demands for bribes. The authors examine the relationship between requests for bribes and the time it takes to complete various regulatory requirements—getting a construction permit, obtaining an operating license, obtaining an electric-ity connection and clearing customs. They test 3 predictions implied by the “grease the wheels” hypothesis, which contends that bribes act as speed money: that all else being equal, firms confronted with requests for bribes should get things done faster; that firms with a higher opportunity cost of waiting are willing to pay more and consequently face shorter wait times; and that bribing is more beneficial where regulation is onerous. The data are inconsistent with all 3 predictions. In the authors’ preferred specifications, all else being equal, firms confronted with demands for bribes wait about 1.5 times as long to get a construction permit, operating license FIGURE 13.2 A striking difference between the time it takes for construction permitting in practice and the time it takes when complying with the law Log of time to get a construction permit as measured by Enterprise Surveys 6 4 2 0 Colombia, 2010 Vanuatu, 2009 Tonga, 2009 4.0 4.5 5.0 5.5 6.0 6.5 Log of time to deal with construction permits as measured by Doing Business 10th percentile 50th percentile 90th percentile Note: The sample comprises 106 countries. Data are for the most recent year available. Source: Freund, Hallward-Driemeier and Rijkers 2014.
  • 117.
    106 DOING BUSINESS2015 or electricity connection as firms that did not have to pay bribes—and they wait 1.2 times as long to clear customs when exporting and 1.4 times as long when importing. The results are robust to controlling for firm fixed effects and at odds with the notion that corruption enhances efficiency. CONCLUSION The research papers reviewed in this chapter show that business-friendly regulation is integral to economic growth and development.3 Where regulation is streamlined and judicious, it unleashes innovation, promotes the creation of jobs and helps attract for-eign direct investment. But while these papers answer many questions, they also pose many new ones. For example, Hoffman, Munemo and Watson (2014) suggest that an important area for future research is to find out what the right amount of regulation is for business entry. And the pioneering study by Audretsch, Belitski and Desai (2014) invites follow-up research on the impact of multiple dimensions of the national business environment on firms in different cit-ies. The expansion of the global Doing Business sample to the second largest business city in 11 large economies, along with the data published by the subnational Doing Business reports, will enable further research to explore the effects of business regulations across different cities within a country—and to better understand the reasons for differences in outcomes. NOTES 1. Based on searches for citations of the 8 background papers that form the basis for the Doing Business indicators in the Social Science Citation Index and Google Scholar (http://scholar.google.com). 2. The conference took place at Georgetown University’s McDonough School of Business in Washington, DC. It was cosponsored by the U.S. Agency for International Development and the Kauffman Foundation. More information is available at http:// www.doingbusiness.org/special-features /conference. 3. For a comprehensive review of the literature on the effects of business regulation, see Doing Business 2014.
  • 118.
    HIGHLIGHTS FROM THEDOING BUSINESS RESEARCH CONFERENCE 107 TABLE 13A.1 Summary of the main findings and methodology of selected papers from the Doing Business research conference Theme Main findings Methodology overview Data sources Entrepreneurship Klapper, Love and Randall (2014) GDP growth, especially if combined with a higher level of financial development and a better business regulatory environment, is associated with higher new firm registrations. The initial empirical exercise uses a simple model with entry density as the dependent variable and economic growth (as a proxy for the business cycle) as the main independent variable. The authors then investigate heterogeneity in the relationship between the business cycle and new firm registration. World Bank, Entrepreneurship Database; World Bank, World Development Indicators database; Doing Business database Entrepreneurship Bripi (2013) Bureaucratic time delays and, to a lesser extent, costs due to inefficient regulatory procedures can reduce the firm entry rate in industries that should have “naturally” high entry rates relative to low-entry sectors. The analysis focuses on cross-industry and cross-province interaction effects to investigate the impact of regulation on firm entry. Bank of Italy data set measuring the time and costs of regulation across Italian regions Entrepreneurship Audretsch, Belitski and Desai (2014) Specific national regulatory dimensions (such as contract enforcement) as well as different types of reform within a dimension (such as those affecting cost) are associated with the rate of new business start-ups and self-employment in European cities. Panel data random effects regression is used to examine how the business environment affects new business creation and self-employment in a panel of European cities. Eurostat Urban Audit database, regional and city statistics; Doing Business database Investment Jovanovic and Jovanovic (2014) Greater regulatory efficiency as measured by Doing Business indicators has a positive association with foreign direct investment flows from OECD countries to Eastern European and Central Asian countries. The analysis uses the generalized method of moments technique on data on bilateral foreign direct investment flows from 22 OECD countries to 28 Eastern European and Central Asian countries during 2004–11. World Bank, World Development Indicators database; Organisation for Economic Co-operation and Development data; International Monetary Fund (IMF), World Economic Outlook and International Financial Statistics databases; International Labour Organization data; Doing Business database Investment Hoffman, Munemo and Watson (2014) Having some business entry regulation helps define the playing field for firms and reduces the cost of information search for those entering new markets. But too much regulation increases the cost of doing business, dissuading firms from entering markets at all. The analysis tests several hypotheses using a model with franchise expansion (the number of units planned for a country in the future divided by its urban population) as the dependent variable and several independent variables, including the Doing Business distance to frontier measure, entry regulation (measured by the cost of business start-up procedures as a percentage of GNI per capita) and the national corporate tax rate (measured as a percentage of profits). Additional explanatory variables include economic development (measured by real GDP per capita), measures of media infrastructure and of governance, and a dummy variable estimating the impact of the 2008–09 financial crisis on franchise expansion. Press announcements by U.S. franchise companies on expansion plans or moves made into specific international markets during 2005–11 (to develop the sample); Doing Business database; World Bank, World Development Indicators database; Worldwide Governance Indicators Innovation Yang (2014) The profits of innovative firms are lower in business climates where regulatory or governance-related factors (such as corruption or the time and cost to start a business) are poor. The analysis exploits the panel structure of the data. A first-difference regression is estimated. A number of control variables are used, and further robustness checks are applied. World Bank Enterprise Surveys; Doing Business database; World Bank data catalog enforcement Debt Rathinam (2014) In India the introduction of debt recovery tribunals—a procedural law innovation that bypasses the overburdened civil courts in adjudicating financial disputes involving banks—explains increased bank lending. The analysis uses a differences-in-differences model and data on lending by commercial banks in India (including advances to the commercial sector and total secured loans extended) for the years before and after the introduction of debt recovery tribunals (1993 and 1995). Centre for Monitoring Indian Economy, PROWESS database; Reserve Bank of India, annual accounts data on scheduled commercial banks
  • 119.
    108 DOING BUSINESS2015 TABLE 13A.1 Summary of the main findings and methodology of selected papers from the Doing Business research conference Theme Main findings Methodology overview Data sources Unemployment Freund and Rijkers (forthcoming) Episodes of drastic reductions in the unemployment rate are much more prevalent in countries with higher levels of unemployment and, given unemployment, are more likely in those with better regulation. The authors use an event-studies approach to examine how countries achieved episodes of drastic reductions in the unemployment rate over the period 1980–2008. They examine the determinants of such episodes by estimating a probit model, with the potential for an unemployment reduction episode as the dependent variable. After performing several robustness checks, they use Bayesian model averaging to investigate which aspects of regulation matter most. World Bank, World Development Indicators database; IMF data; Worldwide Governance Indicators; Heritage Foundation’s Index of Economic Freedom; Doing Business database Corruption and transparency Freund, Hallward-Driemeier and Rijkers (2014) Firms confronted with demands for bribes wait about 1.5 times as long to get a construction permit, operating license or electricity connection as firms that did not have to pay bribes—and they wait 1.2 times as long to clear customs when exporting and 1.4 times as long when importing. The analysis tests 3 related hypotheses (whether bribe requests and the time to complete regulatory processes are positively correlated; and whether “greasing the wheels” is more evident for firms with the highest opportunity cost of waiting or in countries where regulations are most burdensome) by modeling the log of policy implementation time (the time it takes to export, import, get a construction permit or obtain an operating license) as a function of firm characteristics. A dummy variable indicating whether a bribe was solicited or expected is added. Results are robust to controlling for firm fixed effects and comparing within-firm heterogeneity in wait times for different government services. World Bank Enterprise Surveys; Doing Business database
  • 120.
    Doing Business 2015 Going Beyond Efficiency Akerlof, George A., and Robert J. Shiller. 2009. Animal Spirits: How Human Psychology Drives the Economy, and Why It Matters for Global Capitalism. Princeton, NJ: Princeton University Press. Alvarez de la Campa, Alejandro. 2011. “Increasing Access to Credit through Reforming Secured Transactions in the MENA Region.” Policy Research Working Paper 5613, World Bank, Washington, DC. Araujo, Aloisio P., Rafael V. X. Ferreira and Bruno Funchal. 2012. “The Brazilian Bankruptcy Law Experience.” Journal of Corporate Finance 18 (4): 994–1004. Arrow, Kenneth J. 1963. Social Choice and Individual Value, 2nd ed. New York: John Wiley Sons. Asian Development Bank. 2013. Pacific Private Sector Development Initiative: Progress Report 2013. Mandaluyong City, Philippines: Asian Development Bank. Aterido, Reyes, Mary Hallward-Driemeier and Carmen Pages. 2009. “Big Constraints to Small Firms’ Growth? Business Environment and Employment Growth across Firms.” Economic Development and Cultural Change 59 (3): 609–47. Audretsch, David, Maksim Belitski and Sameeksha Desai. 2014. “Multidimensional Business Environment and Entrepreneurship in European Cities.” Paper presented at the conference “Doing Business: Past, Present and Future of Business Regulation,” Washington, DC, February 20–21. Ayyagari, Meghana, Asli Demirguc-Kunt and Vojislav Maksimovic. 2014. “Who Creates Jobs in Developing Countries?” Small Business Economics 43 (1): 75–99. Balasubramanian, Bala, Bernard Black and Vikramaditya Khanna. 2010. “The Relation between Firm-Level Corporate Governance and Market Value: A Study of India.” Emerging Markets Review 11: 319–40. Bartha, Mary, Yaniv Konchitchkib and Wayne Landsmanc. 2013. “Cost of Capital and Earnings Transparency.” Journal of Accounting and Economics 55 (2–3): 206–24. Basu, Kaushik. 1983. “Cardinal Utility, Utilitarianism and a Class of Invariance Axioms in Welfare Analysis.” Journal of Mathematical Economics 12 (3): 193–206. . 2006. “Coercion, Contract and the Limits of the Market.” Social Choice and Welfare 29 (4): 559–79. . 2010. Beyond the Invisible Hand: Groundwork for a New Economics. Princeton, NJ: Princeton University Press. Behr, Patrick, Annekathrin Entzian and Andre Guettler. 2011. “How Do Lending Relationships Affect Access to Credit and Loan Conditions in Microlending?” Journal of Banking and Finance 35: 2169–78. Behr, Patrick, and Simon Sonnekalb. 2012. “The Effect of Information Sharing between Lenders on Access to Credit, Cost of Credit, and Loan Performance— Evidence from a Credit Registry Introduction.” Journal of Banking and Finance 36: 3017–32. Berlin, Isaiah. 1969. “Two Concepts of Liberty.” In Four Essays on Liberty. Oxford: Oxford University Press. Besley, Timothy, and Robin Burgess, 2004. “Can Labor Regulation Hinder Economic Performance? Evidence from India.” Quarterly Journal of Economics 119 (1): 91-134. Bird, Richard M., and Eric M. Zolt. 2008. “Technology and Taxation in Developing Countries: From Hand to Mouse.” Law-Econ Research Paper 08-07, UCLA School of Law, Los Angeles. Black, Bernard, and Woochan Kim. 2012. “The Effect of Board Structure on Firm Value: A Multiple Identification Strategy Approach Using Korean Data.” Journal of Financial Economics 104: 203–26. Black, Bernard, Woochan Kim, Hasung Jang and Kyung Suh Park. 2010. “How Corporate Governance Affects References
  • 121.
    110 DOING BUSINESS2015 Firm Value: Evidence on Channels from Korea.” Finance Working Paper 103/2005, European Corporate Governance Institute, Brussels. Botero, Juan C., Simeon Djankov, Rafael La Porta, Florencio Lopez-de-Silanes and Andrei Shleifer. 2004. “The Regulation of Labor.” Quarterly Journal of Economics 119 (4): 1339–82. Bowles, Samuel. 2006. Microeconomics: Behavior, Institutions, and Evolution. Princeton, NJ: Princeton University Press. Branstetter, Lee G., Francisco Lima, Lowell J. Taylor and Ana Venâncio. 2013. “Do Entry Regulations Deter Entrepreneurship and Job Creation? Evidence from Recent Reforms in Portugal.” Economic Journal. Published electronically July 16, 2013. doi:10.1111 /ecoj.12044. Braucher, Robert. 1969. “Freedom of Contract and the Second Restatement.” Yale Law Journal 78 (4): 598–616. Bripi, Francesco. 2013. “The Role of Regulation on Entry: Evidence from the Italian Provinces.” Working Paper 932, Bank of Italy, Rome. Brits, Anne-Marie, Chris Grant and Anthony Burns. 2002. “Comparative Study of Land Administration Systems with Special Reference to Thailand, Indonesia and Karnataka (India).” Synthesis paper prepared for Asia Region, World Bank, Washington, DC. Brondolo, John. 2009. “Collecting Taxes during an Economic Crisis: Challenges and Policy Options.” IMF Staff Position Note 09/17, International Monetary Fund, Washington, DC. Brown, Martin, Tullio Jappelli and Marco Pagano. 2009. “Information Sharing and Credit: Firm-Level Evidence from Transition Countries.” Journal of Financial Intermediation 18: 151–72. Brown, Martin, and Christian Zehnder. 2007. “Credit Registries, Relationship Banking, and Loan Repayment.” Journal of Money, Credit and Banking 39 (8): 1883–918. Bruce, John. 2013. “Land and Conflict: Land Disputes and Land Conflicts.” Property Rights and Resource Governance Briefing Paper 12, U.S. Agency for International Development, Washington, DC. Bruhn, Miriam. 2011. “License to Sell: The Effect of Business Registration Reform on Entrepreneurial Activity in Mexico.” Review of Economics and Statistics 93 (1): 382–86. Brunetti, Aymo, Gregory Kisunko and Beatrice Weder. 1997. “Institutional Obstacles for Doing Business: Region-by- Region Results from a Worldwide Survey of the Private Sector.” Policy Research Working Paper 1759, World Bank, Washington, DC. . 1998. “Credibility of Rules and Economic Growth: Evidence from a Worldwide Survey of the Private Sector.” World Bank Economic Review 12 (3): 353–84. Burns, Anthony. 2004. “Thailand’s 20 Year Program to Title Rural Land.” World Development Report Background Paper, World Bank, Washington, DC. Buti, Marco, and Heinz Zourek. 2012. “Tax Reforms in EU Member States: Tax Policy Challenges for Economic Growth and Fiscal Sustainability.” Working Paper 34–2012, European Commission Directorate General for Taxation and Customs Union Directorate General for Economic and Financial Affairs, Luxembourg. Caixe, Daniel Ferreira, and Elizabeth Krauter. 2013. “The Influence of the Ownership and Control Structure on Corporate Market Value in Brazil.” Revista Contabilidade Finanças (University of São Paulo) 24 (62): 142–53. Chang, Roberto, Linda Kaltani and Norman Loayza. 2009. “Openness Can Be Good for Growth: The Role of Policy Complementarities.” Journal of Development Economics 90: 33–49. Chavis, Larry, Leora Klapper and Inessa Love. 2010. “Access to Financing and New Investments: Evidence from Europe.” In The Economics of Small Business: An International Perspective, edited by Giorgio Calcagnini and Ilario Favaretto, 115–32. London: Physica-Verlag. Chen, Kevin, Zhihong Chen and John Wei. 2011. “Agency Costs of Free Cash Flows and the Effect of Shareholder Rights on the Implied Cost of Capital.” Journal of Financial and Quantitative Analysis 46: 171–207. Cirmizi, Elena, Leora Klapper and Mahesh Uttamchandani. 2010. “The Challenges of Bankruptcy Reform.” Policy Research Working Paper 5448, World Bank, Washington, DC. City of London Law Society. 2012. “Discussion Paper: Secured Transactions Reform.” London. http://www.citysolicitors.org.uk /attachments/article/121 /20121120-Secured-Transactions -Reform---discussion-paper.pdf. Cremers, Martijn, and Allen Ferrell. Forthcoming. “Thirty Years of Shareholder Rights and Firm Valuation.” Journal of Finance. Crone, Theodore M. 1982. “Elements of an Economic Justification for Municipal Zoning.” Federal Reserve Bank of Philadelphia, Philadelphia, PA. Cuzman, Ioan, Bogdan Dima and Stefana Maria Dima. 2010. “New Empirical Evidence on the Linkages between Governance and Growth.” Available at http://papers.ssrn.com/sol3/papers .cfm?abstract_id=1720702. Deininger, Klaus, Harris Selod and Anthony Burns. 2012. The Land Governance Assessment Framework: Identifying and Monitoring Good Practice in the Land Sector. Washington, DC: World Bank. de Sa, Liliana. 2005. “Business Registration Start-Up: A Concept Note.” International Finance Corporation and World Bank, Washington, DC. de Soto, Hernando. 2000. The Mystery of Capital: Why Capitalism Triumphs in the West and Fails Everywhere Else. New York: Basic Books. Dharmapala, Dhammika, and Vikramaditya Khanna. 2013. “Corporate Governance, Enforcement, and Firm Value.” Journal of Law, Economics and Organization 29 (5): 1056–84. DiMatteo, Larry A., and Bruce L. Rich. 2006. “A Consent Theory of Unconscionability: An Empirical Study of Law in Action.” Florida University Law Review 33: 1067–118. Divanbeigi, Raian, and Rita Ramalho. 2014. “Business Regulations and Growth.” Draft paper, Doing Business Unit, World Bank Group, Washington, DC. Djankov, Simeon, Caroline Freund and Cong S. Pham. 2010. “Trading on Time.” Review of Economics and Statistics 92 (1): 166–73. Djankov, Simeon, Tim Ganser, Caralee McLiesh, Rita Ramalho and Andrei Shleifer. 2010. “The Effect of Corporate Taxes on Investment and Entrepreneurship.” American Economic Journal: Macroeconomics 2 (3): 31–64. Djankov, Simeon, Oliver Hart, Caralee McLiesh and Andrei Shleifer. 2008. “Debt Enforcement around the World.” Journal of Political Economy 116 (6): 1105–49. Djankov, Simeon, Rafael La Porta, Florencio Lopez-de-Silanes and Andrei Shleifer. 2002. “The Regulation of Entry.” Quarterly Journal of Economics 117 (1): 1–37. . 2003. “Courts.” Quarterly Journal of Economics 118 (2): 453–517. . 2008. “The Law and Economics of Self-Dealing.” Journal of Financial Economics 88 (3): 430–65. Djankov, Simeon, Darshini Manraj, Caralee McLiesh and Rita Ramalho. 2005. “Doing Business Indicators: Why
  • 122.
    REFERENCES 111 Aggregate,and How to Do It.” World Bank, Washington, DC. Djankov, Simeon, Caralee McLiesh and Andrei Shleifer. 2007. “Private Credit in 129 Countries.” Journal of Financial Economics 84 (2): 299–329. Dreher, Axel, and Martin Gassebner. 2013. “Greasing the Wheels? The Impact of Regulations and Corruption on Firm Entry.” Public Choice 155 (3–4): 413–32. Dutz, Mark. 2014. “Productivity-Driven Growth and Shared Prosperity.” Background paper for World Bank and International Monetary Fund Global Monitoring Report 2014/2015: Ending Poverty and Sharing Prosperity. World Bank, Washington, DC. Edwards, Carolyn. 2009. “Freedom of Contract and Fundamental Fairness for Individual Parties: The Tug of War Continues.” University of Kentucky Law Review 77: 569–646. Eisenberg, Melvin Aron. 1995. “The Limits of Cognition and the Limits of Contract.” Stanford Law Review 47: 211–60. European Commission. 2012. “Entrepreneurship in the EU and Beyond.” Flash Eurobarometer 354, European Commission, Brussels. http:// ec.europa.eu/public_opinion /flash/fl_354_en.pdf. FAO (Food and Agriculture Organization of the United Nations). 2012. Voluntary Guidelines on the Responsible Governance of Tenure of Land, Fisheries and Forests in the Context of National Food Security. Rome: FAO. Ferguson, William D. 2013. Collective Action and Exchange: A Game-Theoretic Approach to Contemporary Political Economy. Redwood City, CA: Stanford University Press. Foster, James, Mark McGillivray and Suman Seth. 2012. “Rank Robustness of Composite Indices: Dominance and Ambiguity.” OPHI Working Paper 26b, Oxford Poverty and Human Development Initiative, Department of International Development, University of Oxford. http://www.ophi.org.uk /wp-content/uploads/ophi-wp-26b .pdf?0a8fd7. Freund, Caroline, Mary Hallward-Driemeier and Bob Rijkers. 2014. “Deals and Delays: Firm-Level Evidence on Corruption and Policy Implementation Times.” Policy Research Working Paper 6949, World Bank, Washington, DC. Freund, Caroline, and Bob Rijkers. Forthcoming. “Unemployment Reduction Episodes in Rich, Middle- Income and Transition Economies.” Journal of Comparative Economics. Fritsch, Michael, and Florian Noseleit. 2013. “Investigating the Anatomy of the Employment Effect of New Business Formation.” Cambridge Journal of Economics 37 (2): 349–77. Galiani, Sebastian, and Ernesto Schargrodsky. 2010. “Property Rights for the Poor: The Effects of Land Titling.” Journal of Public Economics 94 (9): 700–29. Gillingham, Polly, and Felicity Buckle. 2014. “Rwanda Land Tenure Regularization Case Study.” Evidence on Demand. doi:10.12774/eod_hd.march2014. gillingham. Gilson, Ronald. 2000. “Transparency, Corporate Governance and Capital Markets.” OECD, Paris. Grannis, Jessica. 2011. “Adaptation Tool Kit: Sea-Level Rise and Coastal Land Use—How Governments Can Use Land- Use Practices to Adapt to Sea-Level Rise.” Georgetown Climate Center, Georgetown Law, Washington, DC. http://www.southernclimate.org /documents/resources/Adaptation _Tool_Kit_SLR.pdf. Guo, Lixiong, and Ronald W. Masulis. 2013. “Board Structure and Monitoring: New Evidence from CEO Turnovers.” Finance Working Paper 351/2013, European Corporate Governance Institute, Brussels. Hanstad, Tim. 1998. “Designing Land Registration Systems for Developing Countries.” American University International Law Review 13: 647–703. Haselmann, Rainer, Katharina Pistor and Vikrant Vig. 2010. “How Law Affects Lending.” Review of Financial Studies 23 (2): 550–80. Hodgson, Paul, and Greg Ruel. 2012. “The Costs of a Combined Chair/CEO: Executive Summary.” GMI Ratings. http://www.gmiratings.com. Hoffman, Richard C., Jonathan Munemo and Sharon Watson. 2014. “Business Climate and International Franchise Expansion.” Paper presented at the conference “Doing Business: Past, Present and Future of Business Regulation,” Washington, DC, February 20–21. Huang, Ying, Susan Elkinawy and Pankaj K. Jain. 2013. “Investor Protection and Cash Holdings: Evidence from US Cross-Listing.” Journal of Banking Finance 37 (3): 937–51. Hüfner, Felix, and Jens Lundsgaard. 2007. “The Swedish Housing Market: Better Allocation via Less Regulation.” OECD Economics Department Working Paper 559, OECD, Paris. IFC (International Finance Corporation). 2012. Credit Reporting Knowledge Guide. Washington, DC: IFC. IMF (International Monetary Fund). 2009. World Economic Outlook: Crisis and Recovery. Washington, DC: IMF. Jappelli, Tullio, and Marco Pagano. 2002. “Information Sharing, Lending and Defaults: Cross-Country Evidence.” Journal of Banking and Finance 26: 2017–45. Johnson, Simon. 2009. “The Quiet Coup.” Atlantic Monthly. May. http:// www.theatlantic.com/magazine /archive/2009/05/the-quiet-coup /307364. Jovanovic, Biljana, and Branimir Jovanovic. 2014. “Ease of Doing Business and Investment in Eastern Europe and Central Asia.” Paper presented at the conference “Doing Business: Past, Present and Future of Business Regulation,” Washington, DC, February 20–21. Kaplan, David, Eduardo Piedra and Enrique Seira. 2011. “Entry Regulation and Business Start-Ups: Evidence from Mexico.” Journal of Development Economics 95: 1501–15. Karkkainen, Bradley C. 1994. “Zoning: A Reply to the Critics.” Journal of Land Use Environmental Law (Florida State University) 10 (1). http://www.law.fsu .edu/journals/landuse/vol101/karkkain .html#FNR6. Kaufmann, Daniel, and Aart Kraay. 2002. “Growth without Governance.” Economía 3 (1): 169–229. Kennedy, Duncan. 1982. “Distributive and Paternalist Motives in Contract and Tort Law, with Special Reference to Compulsory Terms and Unequal Bargaining Power.” Maryland Law Review 41 (4): 563–658. . 2006. “Thoughts on Coherence, Social Values and National Tradition in Private Law.” In The Politics of a European Civil Code, edited by Martijn W. Hesselink. The Hague: Kluwer Law International. Klapper, Leora. 2011. “Saving Viable Businesses.” Public Policy Journal Note 328, World Bank Group, Washington, DC. Klapper, Leora, Raphael Amit, Mauro Guillen and Juan Quesada. 2010. “Entrepreneurship and Firm Formation across Countries.” In International Differences in Entrepreneurship, edited by Josh Lerner and Antoinette Schoar. Chicago: University of Chicago Press. Klapper, Leora, and Inessa Love. 2011. “The Impact of Business Environment Reforms on New Firm Registration.”
  • 123.
    112 DOING BUSINESS2015 Policy Research Working Paper 5493, World Bank, Washington, DC. Klapper, Leora, Inessa Love and Douglas Randall. 2014. “New Firm Registration and the Business Cycle.” Policy Research Working Paper 6775, World Bank, Washington, DC. Korea, Ministry of Strategy and Finance. 2012. Korean Taxation 2012. Seoul. KPMG. 2009. Competitive Alternatives: KPMG’s Guide to International Business Location. http://competitivealternatives.com. Kraay, Aart, and Norikazu Tawara. 2011. “Can Disaggregated Indicators Identify Governance Reform Priorities?” Policy Research Working Paper 5254, World Bank, Washington, DC. . 2013. “Can Specific Policy Indicators Identify Reform Priorities?” Journal of Economic Growth 18 (3): 253–83. Kronman, Anthony Townsend. 1983. “Paternalism and the Law of Contracts.” Yale Law Journal 92: 763–98. Kuntchev, Veselin, Rita Ramalho, Jorge Rodríguez-Meza and Judy S. Yang. 2012. “What Have We Learned from the Enterprise Surveys regarding Access to Finance by SMEs?” Enterprise Analysis Unit, Finance and Private Sector Development Vice Presidency, World Bank Group, Washington, DC. Lang, Mark, Karl Lins and Mark Maffett. 2012. “Transparency, Liquidity, and Valuation: International Evidence on When Transparency Matters Most.” Journal of Accounting Research 50 (3): 729–74. La Porta, Rafael, and Andrei Shleifer. 2008. “The Unofficial Economy and Economic Development.” Tuck School of Business Working Paper 2009-57, Dartmouth College, Hanover, NH. Available at http://ssrn.com /abstract=1304760. Lee, Seung-Hyun, Mike W. Peng and Jay B. Barney. 2007. “Bankruptcy Law and Entrepreneurship Development: A Real Options Perspective.” Academy of Management Review 32 (1): 257–72. Lima, Bruno Faustino, and Antonio Zoratto Sanvicente. 2013. “Quality of Corporate Governance and Cost of Equity in Brazil.” Journal of Applied Corporate Finance 25 (1): 72–80. Lo, Agnes, Raymond Wong and Michael Firth. 2010. “Can Corporate Governance Deter Management from Manipulating Earnings? Evidence from Related-Party Sales Transactions in China.” Journal of Corporate Finance 16: 225–35. Loayza, Norman V., Ana María Oviedo and Luis Servén. 2010. “Regulation and Macroeconomic Performance.” In Business Regulation and Economic Performance, edited by Norman V. Loayza and Luis Servén. Washington, DC: World Bank. Love, Inessa, María Soledad Martínez Pería and Sandeep Singh. 2013. “Collateral Registries for Movable Assets: Does Their Introduction Spur Firms’ Access to Bank Finance?” Policy Research Working Paper 6477, World Bank, Washington, DC. Luoto, Jill, Craig McIntosh and Bruce Wydick. 2004. “Credit Information Systems in Less-Developed Countries: Recent History and a Test.” Economic Development and Cultural Change 55 (2): 313–34. Malhotra, D. K., Raymond Poteau and Joseph Fritz. 2013. “Does Corporate Governance Impact Performance? An Analysis of Dow Thirty Stocks.” International Journal of Business Economics Perspectives 8 (1): 62–75. Marella, Maria Rosaria. 2006. “The Old and the New Limits to Freedom of Contract in Europe.” European Review of Contract Law 2: 257–74. McLean, David, Tianyu Zhang and Mengxin Zhao. 2012. “Why Does the Law Matter? Investor Protection and Its Effects on Investment, Finance, and Growth.” Journal of Finance 67 (1): 313–50. Monteiro, C. M. Joana, and Juliano J. Assunção. 2012. “Coming Out of the Shadows? Estimating the Impact of Bureaucracy Simplification and Tax Cut on Formality in Brazilian Microenterprises.” Journal of Development Economics 99: 105–15. Moss, Tim. 2014. “International Good Practices in Business Registers.” Presentation at Corporate Registers Forum, Rio de Janeiro, March 18. Motta, Marialisa, Ana María Oviedo and Massimiliano Santini. 2010. “An Open Door for Firms: The Impact of Business Entry Reforms.” Viewpoint 323, World Bank Group, Washington, DC. https:// www.wbginvestmentclimate.org /uploads/323-Business-entry-reforms .pdf. Moullier, Thomas. 2009. “Reforming Building Permits: Why Is It Important and What Can IFC Really Do?” International Finance Corporation, Washington, DC. Nataraj, Shantni, Francisco Perez-Arce, Sinduja Srinivasan and Krishna Kumar. 2012. “What Is the Impact of Labour Market Regulation on Employment in LICs? How Does It Vary by Gender?” Rand Working Paper WR-957, Rand Corporation, Santa Monica, CA. Neumann, Brad. 2014. “Climate Change and Local Government: Zoning for Small Wind Energy, Part 1.” Michigan State University Extension, East Lansing, MI. http://msue.anr.msu.edu /news/climate_change_and_local _government_zoning_for_small_wind _energy. OECD (Organisation for Economic Co-operation and Development). 2002. Foreign Direct Investment for Development: Maximising Benefits, Minimising Costs. Paris: OECD. . 2004. OECD Principles of Corporate Governance. Paris: OECD. . 2010a. Choosing a Broad Base–Low Rate Approach to Taxation. Tax Policy Study 19. Paris: OECD. . 2010b. Growth-Oriented Tax Policy Reform Recommendations. Tax Policy Study 20. Paris: OECD. . 2012. OECD Economic Surveys: Korea. Paris: OECD. Pettit, Mark. 1999. “Freedom, Freedom of Contract, and the Rise and the Fall.” Boston University Law Review 79: 263–354. Pierre, Gaëlle, and Stefano Scarpetta. 2007. “How Labor Market Policies Can Combine Workers’ Protection with Job Creation: A Partial Review of Some Key Issues and Policy Options.” Social Protection Discussion Paper 0716, World Bank, Washington, DC. Portugal-Perez, Alberto, and John S. Wilson. 2012. “Export Performance and Trade Facilitation Reform: Hard and Soft Infrastructure.”World Development 40 (7): 1295–307. Posner, Eric A. 1995. “Contract Law in the Welfare State: A Defense of the Unconscionability Doctrine, Usury Laws, and Related Limitations on the Freedom to Contract.” Journal of Legal Studies 24: 283–320. Powell, Andrew, Nataliya Mylenko, Margaret Miller and Giovanni Majnoni. 2004. “Improving Credit Information, Bank Regulation and Supervision: On the Role and Design of Public Credit Registries.” Policy Research Working Paper 3443, World Bank, Washington, DC. Qian, Jun, and Philip E. Strahan. 2007. “How Laws and Institutions Shape Financial Contracts: The Case of Bank Loans.” Journal of Finance 62 (6): 2803–34. Ramello, Giovanni, and Stephen Voigt. 2012. “The Economics of Efficiency and the Judicial System.” International Review of Law and Economics 32: 1–2.
  • 124.
    REFERENCES 113 Rathinam,Francis Xavier. 2014. “Procedural Law and Bank Lending to Private Sector: Evidence from India.” Paper presented at the conference “Doing Business: Past, Present and Future of Business Regulation,” Washington, DC, February 20–21. Schaffner, Philip, and Jake Waxman. 2009. “Environmental Policy Green Zoning: Creating Sustainable Communities through Incentive Zoning.” Harvard Kennedy School, Cambridge, MA. http://www.hks.harvard.edu/var /ezp_site/storage/fckeditor/file/pdfs /centers-programs/centers/rappaport /paes/schaffner _waxman.pdf. Schneider, Friedrich. 2005. “The Informal Sector in 145 Countries.” Department of Economics, University Linz, Linz. Scott, Robert E. 2002. “The Rise and Fall of Article 2.” Louisiana Law Review 62: 1009–64. Sen, Amartya. 1977. “On Weights and Measures: Informational Constraints in Social Welfare Analysis.” Econometrica 49 (7): 1539–72. Shapiro, David L. 1988. “Courts, Legislatures and Paternalism.” Virginia Law Review 74: 519–74. Stam, Erik, David B. Audretsch and Joris Meijaard. 2006. “Renascent Entrepreneurship.” ERIM Report Series 17, Erasmus Research Institute of Management, Erasmus University Rotterdam. Stiglitz, Joseph E., Amartya Sen and Jean-Paul Fitoussi. 2009. “Report by the Commission on the Measurement of Economic Performance and Social Progress.” http://www.stiglitz-sen -fitoussi.fr/documents/rapport _anglais.pdf. Study Group on a European Civil Code and Research Group on EC Private Law (Acquis Group). 2009. Principles, Definitions and Model Rules of European Private Law: Draft Common Frame of Reference. Vol. 6. Oxford: Oxford University Press. Swedish National Board of Housing, Building and Planning. 2013. The Housing Shortage and Rent Setting System: A Knowledge Base. Market Report. Stockholm. Tajti, Tibor. 2013. “Post-1990 Secured Transaction Law Reforms in Central and Eastern Europe.” Szegedi Közjegyzői Közlöny 2 (3): 14–21; 2 (4): 18–26. Transparency International. 2011. “Corruption in the Land Sector.” Working Paper 4. Berlin. Turner, Michael, Robin Varghese, Patrick Walker and Katrina Dusek. 2009. Credit Reporting Customer Payment Data: Impact on Customer Payment Behavior and Furnisher Costs and Benefits. Chapel Hill, NC: PERC Press. U.K. Companies House. 2013a. Companies House Annual Report Accounts 2012/13. London: The Stationery Office. . 2013b. Companies Register Activities 2012–2013. London: Companies House. UNCITRAL (United Nations Commission on International Trade Law). 2004. Legislative Guide on Insolvency Law. New York: United Nations. . 2007. Legislative Guide on Secured Transactions. New York: United Nations. UNECE (United Nations Economic Commission for Europe). 2012. Policy Framework for Sustainable Real Estate Markets: Principles and Guidance for the Development of a Country’s Real Estate Sector. Geneva: UNECE. UN-Habitat (United Nations Human Settlements Programme). 2012. Managing Urban Land Information: Learning from Emergent Practices. Nairobi: UN-Habitat. . 2013. Tools to Support Transparency in Land Administration. Nairobi: UN-Habitat. U.S. Securities and Exchange Commission. 2012. “Work Plan for the Consideration of Incorporating International Financial Reporting Standards into the Financial Reporting System for U.S. Issuers.” Final Staff Report, U.S. Securities and Exchange Commission, Washington, DC. http://www.sec.gov/spotlight /globalaccountingstandards /ifrs-work-plan-final-report.pdf. Weber, David P. 2013. “Restricting the Freedom of Contract: A Fundamental Prohibition.” Yale Human Rights Development Law Journal 16: 51–141. Wehrmann, Babette. 2008. Land Conflicts: A Practical Guide to Dealing with Land Disputes. Eschborn, Germany: Deutsche Gesellschaft für Technische Zusammenarbeit. Wille, John R., Karim O. Belayachi, Numa de Magalhaes and Frédéric Meunier. 2011. “Leveraging Technology to Support Business Registration Reform: Insights from Recent Country Experience.” Investment Climate in Practice Note 17, Investment Climate Department, World Bank Group, Washington, DC. World Bank. 1989. World Development Report 1989: Financial Systems and Development. New York: Oxford University Press. . 2006. Doing Business in 2006: Creating Jobs. Washington, DC: World Bank. . 2011a. General Principles for Credit Reporting. Washington, DC: World Bank. . 2011b. Principles for Effective Insolvency and Creditor/Debtor Regimes. Revised. Washington, DC: World Bank. http://siteresources.worldbank.org /EXTGILD/Resources /5807554-1357753926066 /ICRPrinciples-Jan2011[FINAL].pdf. . 2012. World Development Report 2013: Jobs. Washington, DC: World Bank. . 2013a. Doing Business 2013: Smarter Regulations for Small and Medium-Size Enterprises. Washington, DC: World Bank. . 2013b. Doing Business 2014: Understanding Regulations for Small and Medium-Size Enterprises. Washington, DC: World Bank. . 2014a. A Measured Approach to Ending Poverty and Boosting Shared Prosperity: Concepts, Data, and the Twin Goals. Policy Research Report. Washington, DC: World Bank. . 2014b. Sweden’s Business Climate: Opportunities for Entrepreneurs through Improved Regulations. Washington, DC: World Bank. . 2014c. World Development Indicators 2014. Washington, DC: World Bank. . Forthcoming. World Development Report 2015: Mind and Society: How a Better Understanding of Human Behavior Can Improve Development Policy. Washington, DC: World Bank. World Bank and IMF (International Monetary Fund). 2014. Global Monitoring Report 2014/2015: Ending Poverty and Sharing Prosperity. Washington, DC: World Bank. World Bank Group, Investment Climate Advisory Services. 2009. How Many Stops in a One-Stop Shop? A Review of Recent Developments in Business Registration. Washington, DC: World Bank Group. . 2013. “Sustaining Investment Climate, and Making Rwanda a Favorite Business Destination.” World Bank Group, Washington, DC. World Bank Group, Investment Climate Department. 2013. Good Practices for Construction Regulation and Enforcement Reform: Guidelines for Reformers. Washington, DC: World Bank Group. Yang, Judy S. 2014. “The Business Climate, Innovation, and Firm Profitability.” Paper presented at the conference “Doing Business: Past, Present and Future of Business Regulation,” Washington, DC, February 20–21.
  • 125.
    Doin Businss 2015 Goin Bond Efficinc Dt nots Th indictors prsntd nd nld in Doin Businss m- sur businss rultion nd th protction of proprt rihts—nd thir ffct on businsss, spcill smll nd mdium-si domstic firms. First, th indictors documnt th complx-it of rultion, such s th numbr of procdurs to strt businss or to ristr trnsfr of commrcil proprt. Scond, th u th tim nd cost to chiv rultor ol or compl with rultion, such s th tim nd cost to nforc contrct, o throuh bnkruptc or trd cross bordrs. Third, th msur th xtnt of ll protctions of proprt, for xmpl, th protctions of minorit invstors inst lootin b compn dirctors or th rn of ssts tht cn b usd s colltrl ccordin to scurd trnsctions lws. Fourth, st of indictors documnts th tx burdn on businsss. Finll, st of dt covrs diffrnt spcts of mplomnt rultion. Th 11 sts of indictors msurd in Doin Businss wr ddd ovr tim, nd th smpl of conomis nd citis xpndd (tbl 14.1). Th dt for ll sts of indictors in Doin Businss 2015 r for Jun 2014.1 TABLE 14.1 Topics nd conomis covrd b ch Doin Businss rport Topic DB 2004 DB 2005 DB 2006 DB 2007 DB 2008 DB 2009 DB 2010 DB 2011 DB 2012 DB 2013 DB 2014 DB 2015 Gttin lctricit Dlin with construction prmits Trdin cross bordrs Pin txs Protctin minorit invstors Ristrin proprt Gttin crdit Rsolvin insolvnc Enforcin contrcts Lbor mrkt rultion Strtin businss Numb r of conomi s 133 145 155 175 178 181 183 183 183 185 189 189 Not: Dt for th conomis ddd to th smpl ch r r bck-clcultd to th prvious r. Th xcptions r Kosovo nd Montnro, which wr ddd to th smpl ftr th bcm mmbrs of th World Bnk Group. In Doin Businss 2015, whil th numbr of conomis rmins th sm s in Doin Businss 2014, 11 citis hv bn ddd.
  • 126.
    DATA NOTES 115 METHODOLOGY Th Doin Businss dt r collctd in stndrdid w. To strt, th Doin Businss tm, with cdmic dvisrs, dsins qustionnir. Th qustion-n ir uss simpl businss cs to nsur comprbilit cross conomis nd ovr tim—with ssumptions bout th ll form of th businss, its si, its loction nd th ntur of its opr- tions. Qustionnirs r dministrd to mor thn 10,700 locl xprts, includin lwrs, businss consultnts, ccountnts, friht forwrdrs, ov- rnmnt officils nd othr profssion- ls routinl dministrin or dvisin on ll nd rultor rquirmnts (tbl 14.2). Ths xprts hv sv- rl rounds of intrction with th Doin Businss tm, involvin confrnc clls, writtn corrspondnc nd visits b th tm. For Doin Businss 2015 tm mmbrs visitd 26 conomis, includin 10 nw citis, to vrif dt nd rcruit rspondnts. Th dt from qustionnirs r subjctd to numr-ous rounds of vrifiction, ldin to rvisions or xpnsions of th inform- tion collctd. Th Doin Businss mthodolo offrs svrl dvnts. It is trnsprnt, usin fctul informtion bout wht Econom chrctristics Gross national income per capita Doin Businss 2015 rports 2013 incom pr cpit s publishd in th World Bnk’s World Dvlopmnt Indictors 2014. Incom is clcultd usin th Atls mthod (currnt U.S. dollrs). For cost indictors xprssd s prcnt of incom pr cpit, 2013 ross ntionl incom (GNI) in U.S. dollrs is usd s th dnomintor. GNI dt bsd on th Atls mthod wr not vilbl from th World Bnk for Arntin, Th Bhms, Bhrin, Brbdos, Bruni Drusslm, Djibouti, Kuwit, Libˆ, Mˆnmr, Nw Zlnd, Omn, Sn Mrino, th Sˆrin Arb Rpublic, nd Wst Bnk nd GŽ. In ths css GDP or GNP pr cpit dt nd rowth rts from othr sourcs, such s th Intrntionl Montrˆ Fund’s World Economic Outlook dtbs nd th Economist Intllinc Unit, wr usd. Region and income group Doin Businss uss th World Bnk rionl nd incom roup clssific- tions, vilbl t http://dt.worldbnk.or/bout/countrˆ-clssifictions. Whil th World Bnk dos not ssin rionl clssifictions to hih-incom conomis, rionl vrs prsntd in fiurs nd tbls in th Doin Businss rport includ conomis from ll incom roups (low, lowr middl, uppr middl nd hih incom). For th purpos of th rport, hih-incom OECD conomis r ssind th “rionl” clssifiction OECD hih incom. Population Doin Businss 2015 rports midˆr 2013 popultion sttistics s publishd in World Dvlopmnt Indictors 2014. lws nd rultions s nd llow-in multipl intrctions with locl rspondnts to clrif potntil mis-int rprttions of qustions. Hvin rprsnttiv smpls of rspondnts is not n issu; Doin Businss is not sttisticl surv, nd th txts of th rlvnt lws nd rultions r collctd nd nswrs chckd for ccurc. Th mthodolo is inx-p nsiv nd sil rplicbl, so dt cn b collctd in lr smpl of conomis. Bcus stndrd ssump-tions r usd in th dt collction, comprisons nd bnchmrks r vlid cross conomis. Finll, th dt not onl hihliht th xtnt of spcific rultor obstcls to businss but lso idntif thir sourc nd point to wht miht b rformd. LIMITS TO WHAT IS MEASURED Th Doin Businss mthodolo hs 5 limittions tht should b considrd whn intrprtin th dt. First, for most conomis th collctd dt rfr to businsss in th lrst busi-n ss cit (which in som conomis TABLE 14.2 How mn xprts dos Doin Businss consult? Economi s with iv n numb r of r spond nts (%) Indic­tor s t R spond nts 1–2 3–5 5+ Strtin businss 1,651 10 33 57 Dlin with construction prmits 1,082 18 40 42 Gttin lctricit 967 22 45 33 Ristrin proprt 1,229 20 37 43 Gttin crdit 1,538 10 25 65 Protctin minorit invstors 1,117 25 37 38 Pin txs 1,305 7 39 54 Trdin cross bordrs 1,184 22 46 33 Enforcin contrcts 1,314 18 42 40 Rsolvin insolvnc 1,051 25 40 35 Lbor mrkt rultion 1,134 23 40 37 Tot­l 13,572 18 39 43
  • 127.
    116 DOING BUSINESS2015 diffrs from th cpitl) nd m not b rprsnttiv of rultion in othr prts of th conom. (Th xcptions r 11 conomis tht hv popultion of mor thn 100 million, whr Doin Businss, for th first tim this r, lso collctd dt for th scond lrst businss cit.)2 To d-dr ss this limittion, subntionl Doin Businss indictors wr crtd (box 14.1). Scond, th dt oftn focus on spcific businss form—nrll limitd libilit compn (or its ll quivlnt) of spcifid si—nd m not b rprsnttiv of th ru-l tion on othr businsss, for xmpl, sol propritorships. Third, trnsc-tions dscribd in stndrdid cs scnrio rfr to spcific st of issus nd m not rprsnt th full st of issus tht businss ncountrs. Fourth, th msurs of tim involv n lmnt of judmnt b th xprt rspondnts. Whn sourcs indict diffrnt stimts, th tim indictors rportd in Doin Businss rprsnt th mdin vlus of svrl rsponss ivn undr th ssumptions of th stndrdid cs. Finll, th mthodolo ssums tht businss hs full informtion on wht is rquird nd dos not wst tim whn compltin procdurs. In prctic, compltin procdur m tk lonr if th businss lcks informtion or is unbl to follow up promptl. Altrntivl, th businss m choos to disrrd som burdn-som procdurs. For both rsons th tim dls rportd in Doin Businss 2015 would diffr from th rcollction of ntrprnurs rportd in th World Bnk Entrpris Survs or othr firm-l vl survs. CHANGES IN WHAT IS MEASURED As prt of 2-r updt in mthod-olo , Doin Businss 2015 incorports 7 importnt chns. First, th s of doin businss rnkin s wll s ll topic-lvl rnkins r now computd on th bsis of distnc to frontir scors (s th chptr on th distnc to frontir nd s of doin businss rnkin). Scond, for th 11 conomis with popultion of mor thn 100 mil-lion, dt for scond cit hv bn ddd to th dt st nd th rnkin clcultion. Third, for ttin crdit, th mthodolo hs bn rvisd for both th strnth of ll rihts indx nd th dpth of crdit informtion indx. Th numbr of points hs bn incrsd in both indics, from 10 to 12 for th strnth of ll rihts indx nd from 6 to 8 for th dpth of crdit informtion indx. In ddition, onl crdit burus nd ristris tht covr t lst 5% of th dult popultion cn rciv scor on th dpth of crdit informtion indx. Fourth, th nm of th protctin in-v stors indictor st hs bn chnd to protctin minorit invstors to bttr rflct its scop—nd th scop of th indictor st hs bn xpndd to includ shrholdrs’ rihts in corport ovrnnc bond rltd-p rt trnsctions. Fifth, th rsolvin insolvnc indictor st hs bn x-p ndd to includ n indx msurin th strnth of th ll frmwork for insolvnc. Sixth, th clcultion of th distnc to frontir scor for p- in txs hs bn chnd. Th totl tx rt componnt now ntrs th scor in nonlinr fshion, in n p-pro ch diffrnt from tht usd for ll othr indictors (s th chptr on th distnc to frontir nd s of doin businss rnkin). Finll, th nm of th mplo- in workrs indictor st hs bn chnd to lbor mrkt rultion, nd th scop of this indictor st hs lso bn chnd. Th indictors now focus on lbor mrkt rultions p-pl in to th rtil sctor rthr thn th mnufcturin sctor, nd thir covr hs bn xpndd to includ rultions on lbor disputs nd on bnfits providd to workrs. Th lbor mrkt rultion indictors continu to b xcludd from th rt distnc to frontir scor nd rnkin on th s of doin businss. Bond ths chns thr r 3 othr updts in mthodolo. For pin txs, th finncil sttmnt vribls hv bn updtd to b proportionl to 2012 incom pr cpit; prviousl th wr proportionl to 2005 incom pr cpit. For nforcin contrcts, th vlu of th clim is now st t twic th incom pr cpit or $5,000, whichvr is rtr. For dlin with construction prmits, th cost of construction is now st t 50 tims incom pr cpit (bfor, th cost ws ssssd b th BOX 14.1 Subntionl Doin Businss indictors Subntionl Doin Businss studis point to diffrncs in businss rultion nd its implmnttion—s wll s in th pc of rultorˆ rform—cross citis in th sm conomˆ or rion. For svrl conomis subntionl stud-i s r now priodicllˆ updtd to msur chn ovr tim or to xpnd orphic covr to dditionl citis. This ˆr subntionl studis wr compltd in th Arb Rpublic of Eˆpt, Mxico nd Niri. In ddition, th orphic covr ws xpndd for onoin studis in th Dominicn Rpublic, Polnd, South Afric, Spin nd 6 Cntrl Amricn countris. And for th first tim subntionl studis r incorportin ndr prspctiv, ssssin prctics t public ristris in Niri nd nlˆŽin ll indictors from th World Bnk Group’s Womn, Businss nd th Lw rport on Cntrl Amric.
  • 128.
    DATA NOTES 117 Doin Businss rspondnts). In ddition, this indictor st no lonr includs th procdurs for obtinin lndlin tlphon connction. DATA CHALLENGES AND REVISIONS Most lws nd rultions undrlin th Doin Businss dt r vilbl on th Doin Businss wbsit t http:// www.doinbusinss.or. All th smpl qustionnirs nd th dtils undrl- in th indictors r lso publishd on th wbsit. Qustions on th mth-odolo nd chllns to dt cn b submittd throuh th wbsit’s “Ask Qustion” function t http://www .doinbusinss.or. Doin Businss publishs 18,400 indic- tors (92 indictors pr conom) ch r. To crt ths indictors, th tm msurs mor thn 100,000 dt points, ch of which is md vilbl on th Doin Businss wbsit. Historicl dt for ch indictor nd conom r vilbl on th wbsit, binnin with th first r th indi-c tor or conom ws includd in th rport. To provid comprbl tim sris for rsrch, th dt st is bck-c lcultd to djust for chns in mthodolo nd n rvisions in dt du to corrctions. This r, howvr, th ttin crdit, pin txs nd lbor mrkt rultion indictors will b bck-clcultd for onl on r bcus of th sinificnt chns in mthodolo for ths indictors. Th wbsit lso mks vilbl ll oriinl dt sts usd for bckround pprs. Th corrction rt btwn Doin Businss 2014 nd Doin Businss 2015 is 5.3%.3 Govrnmnts submit quris on th dt nd provid nw informtion to Doin Businss. Durin th Doin Businss 2015 production ccl th tm rcivd 105 such quris from ovrnmnts. In ddition, th tm hld vidoconfrncs with ovrn-m nt rprsnttivs in 27 conomis nd in-prson mtins with ovrn-m nt rprsnttivs in 13 conomis. STARTING A BUSINESS Doin Businss rcords ll procdurs officill rquird, or commonl don in prctic, for n ntrprnur to strt up nd formll oprt n industril or commrcil businss, s wll s th tim nd cost to complt ths proc- durs nd th pid-in minimum cpitl rquirmnt (fiur 14.1). Ths proc- durs includ obtinin ll ncssr licnss nd prmits nd compltin n rquird notifictions, vrifictions or inscriptions for th compn nd mplos with rlvnt uthoritis. Th rnkin of conomis on th s of strtin businss is dtrmind b sortin thir distnc to frontir scors for strtin businss. Ths scors r th simpl vr of th distnc to frontir scors for ch of th componnt indictors (fiur 14.2). Th distnc to frontir msur illus-tr ts th distnc of n conom to th “frontir,” which is drivd from th most fficint prctic or hihst scor chivd on ch indictor. Aftr stud of lws, rultions nd publicl vilbl informtion on businss ntr, dtild list of proc- durs is dvlopd, lon with th tim nd cost to compl with ch procdur undr norml circumstncs nd th pid-in minimum cpitl rquirmnt. Subsquntl, locl incorportion lw- rs, notris nd ovrnmnt officils complt nd vrif th dt. Informtion is lso collctd on th squnc in which procdurs r to b compltd nd whthr procdurs m b crrid out simultnousl. It is ssumd tht n rquird informtion is rdil vilbl nd tht th ntr- prnur will p no bribs. If nswrs b locl xprts diffr, inquiris continu until th dt r rconcild. To mk th dt comprbl cross conomis, svrl ssumptions bout th businss nd th procdurs r usd. Assumptions about the business Th businss: ƒ Is limitd libilit compn (or its ll quivlnt). If thr is mor thn on tp of limitd libilit compn in th conom, th lim-it d libilit form most common mon domstic firms is chosn. Informtion on th most common form is obtind from incorportion lwrs or th sttisticl offic. FIGURE 14.1 Wht r th tim, cost, pid-in minimum cpitl nd numbr of procdurs to †t locl limitd libilit compn up nd runnin†? $ Cost (% of income per capita) Paid-in minimum capital Number of procedures Formal operation Preregistration Registration, Postregistration incorporation Time (days) Entrepreneur
  • 129.
    118 Doing Business2015 Rankings are based on distance to frontier scores for 4 indicators ƒƒ Operates in the economy’s largest business city. For 11 economies the data are also collected for the sec-ond largest business city (see table 14A.1 at the end of the data notes). ƒƒ Is 100% domestically owned and has 5 owners, none of whom is a legal entity. ƒƒ Has start-up capital of 10 times income per capita, paid in cash. ƒƒ Performs general industrial or commercial activities, such as the production or sale to the public of products or services. The business does not perform foreign trade ac-tivities and does not handle products subject to a special tax regime, for example, liquor or tobacco. It is not using heavily polluting production processes. ƒƒ Leases the commercial plant or of-fices and is not a proprietor of real estate. ƒƒ Does not qualify for investment incentives or any special benefits. ƒƒ Has at least 10 and up to 50 employees 1 month after the com-mencement of operations, all of them domestic nationals. ƒƒ Has a turnover of at least 100 times income per capita. ƒƒ Has a company deed 10 pages long. Procedures A procedure is defined as any interac-tion of the company founders with ex-ternal parties (for example, government agencies, lawyers, auditors or notaries). Interactions between company found-ers or company officers and employ-ees are not counted as procedures. Procedures that must be completed in the same building but in different offices or at different counters are counted separately. If founders have to visit the same office several times for different sequential procedures, each is counted separately. The founders are assumed to complete all procedures themselves, without middlemen, facilitators, ac-countants or lawyers, unless the use of such a third party is mandated by law or solicited by the majority of entrepre-neurs. If the services of professionals are required, procedures conducted by such professionals on behalf of the company are counted separately. Each electronic procedure is counted separately. If 2 procedures can be completed through the same website but require separate filings, they are counted as 2 separate procedures. Both pre- and postincorporation pro-cedures that are officially required for an entrepreneur to formally operate a business are recorded (table 14.3). Procedures required for official corre-spondence or transactions with public agencies are also included. For example, if a company seal or stamp is required on official documents, such as tax dec-larations, obtaining the seal or stamp is counted. Similarly, if a company must open a bank account before registering for sales tax or value added tax, this transaction is included as a procedure. Shortcuts are counted only if they fulfill 4 criteria: they are legal, they are available to the general public, they are used by the majority of companies, and avoiding them causes substantial delays. Only procedures required of all busi-nesses are covered. Industry-specific procedures are excluded. For example, procedures to comply with environmen-tal regulations are included only when they apply to all businesses conducting general commercial or industrial activi-ties. Procedures that the company un-dergoes to connect to electricity, water, gas and waste disposal services are not included. Time Time is recorded in calendar days. The measure captures the median duration that incorporation lawyers indicate is necessary in practice to complete a procedure with minimum follow-up with government agencies and no extra pay-ments. It is assumed that the minimum time required for each procedure is 1 day, except for procedures that can be fully completed online, for which the time required is recorded as half a day. Figure 14.2 Starting a business: getting a local limited liability company up and running As % of income per capita, no bribes included Preregistration, registration and postregistration (in calendar days) Funds deposited in a bank or with a notary before registration, as % of income per capita Procedures are completed when final document is received 25% Paid-in minimum capital 25% Time 25% Cost 25% Procedures TABLE 14.3 What do the starting a business indicators measure? Procedures to legally start and operate a company (number) Preregistration (for example, name verification or reservation, notarization) Registration in the economy’s largest business citya Postregistration (for example, social security registration, company seal) Time required to complete each procedure (calendar days) Does not include time spent gathering information Each procedure starts on a separate day (2 procedures cannot start on the same day)— though procedures that can be fully completed online are an exception to this rule Procedure considered completed once final incorporation document is received No prior contact with officials Cost required to complete each procedure (% of income per capita) Official costs only, no bribes No professional fees unless services required by law Paid-in minimum capital (% of income per capita) Funds deposited in a bank or with a notary before registration (or within 3 months) a. For 11 economies the data are also collected for the second largest business city.
  • 130.
    DATA NOTES 119 Althouh procdurs m tk plc si-mult nousl, th cnnot strt on th sm d (tht is, simultnous proc- durs strt on conscutiv ds), in with th xcption of procdurs tht cn b full compltd onlin. A proc- dur is considrd compltd onc th compn hs rcivd th finl incorpo-r tion documnt, such s th compn ristrtion crtifict or tx numbr. If procdur cn b cclrtd for n dditionl cost, th fstst procdur is chosn if tht option is mor bnficil to th conom’s rnkin. It is ssumd tht th ntrprnur dos not wst tim nd commits to compltin ch rminin procdur without dl. Th tim tht th ntrprnur spnds on thrin informtion is inord. It is ssumd tht th ntrprnur is wr of ll ntr rquirmnts nd thir s- qunc from th binnin but hs hd no prior contct with n of th officils. Cost Cost is rcordd s prcnt of th conom’s incom pr cpit. It in-clud s ll officil fs nd fs for ll or profssionl srvics if such srvics r rquird b lw. Fs for purchs-in nd lliin compn books r includd if ths trnsctions r rquird b lw. Althouh vlu ddd tx ristrtion cn b countd s sprt procdur, vlu ddd tx is not prt of th incorportion cost. Th compn lw, th commrcil cod, nd spcific rultions nd f schd-ul s r usd s sourcs for clcultin costs. In th bsnc of f schduls, ovrnmnt officr’s stimt is tkn s n officil sourc. In th bsnc of ovrnmnt officr’s stimt, stimts b incorportion lwrs r usd. If svrl incorportion lwrs provid diffrnt stimts, th mdin rportd vlu is pplid. In ll css th cost xcluds bribs. Paid­in minimum capital Th pid-in minimum cpitl rquir- mnt rflcts th mount tht th n-tr prnur nds to dposit in bnk or with notr bfor ristrtion nd up to 3 months followin incorportion nd is rcordd s prcnt of th con-om ’s incom pr cpit. Th mount is tpicll spcifid in th commrcil cod or th compn lw. Mn cono-mi s rquir minimum cpitl but llow businsss to p onl prt of it bfor ristrtion, with th rst to b pid f-t r th first r of oprtion. In Turk in Jun 2014, for xmpl, th minimum cpitl rquirmnt ws 10,000 Turkish lirs, of which on-fourth ndd to b pid bfor ristrtion. Th pid-in minimum cpitl rcordd for Turk is thrfor 2,500 Turkish lirs, or 12.14% of incom pr cpit. Th d t dt ils on st rtin businss c n b found for ch conom t http://www .doinbusinss.or. This mthodolo w s dvlopd b Dj nkov nd othrs (2002) nd is doptd hr with minor ch ns. DEALING WITH CONSTRUCTION PERMITS Doin Businss rcords ll procdurs rquird for businss in th con-struction industr to build wr- hous (fiur 14.3). Ths procdurs includ obtinin nd submittin ll rlvnt projct-spcific documnts (for xmpl, buildin plns, sit mps nd crtificts of urbnism) to th uthoritis; hirin xtrnl third-prt suprvisors, ninrs or inspctors (if ncssr); obtinin ll ncs-s r clrncs, licnss, prmits nd crtificts; submittin ll rquird notifictions; nd rqustin nd rcivin ll ncssr inspctions (un-l ss compltd b privt, third-prt inspctor). Doin Businss lso rcords procdurs for obtinin connctions for wtr nd swr. Procdurs ncssr to ristr th wrhous so tht it cn b usd s colltrl or trnsfrrd to nothr ntit r lso countd. Th qustionnir divids th procss of buildin wrhous into distinct procdurs nd solicits dt for clcultin th tim nd cost to com-pl t ch procdur. Th rnkin of conomis on th s of dlin with construction prmits is dtrmind b sortin thir distnc to frontir scors for dlin with construction prmits. Ths scors r th simpl vr of th distnc to frontir scors for ch of th componnt indictors (fiur 14.4). Informtion is collctd from xprts in construction licnsin, includin rchitcts, civil ninrs, construction lwrs, construction firms, utilit sr-vic providrs nd public officils who dl with buildin rultions, includin pprovls, prmit issunc nd inspc-tions. To mk th dt comprbl FIGURE 14.3 Wht r th tim, cost nd numbr of procdurs to compl with formlitis to build wrhous? Completed warehouse Cost (% of warehouse value) Preconstruction Construction Postconstruction and utilities PPrreeccoonnssttrruuccttiioonn CCoonnssttrruuccttiioonn A business in the construction industry Number of procedures Time (days)
  • 131.
    120 Doing Business2015 Rankings are based on distance to frontier scores for 3 indicators 33.3% Time 33.3% Cost 33.3% Procedures across economies, several assumptions about the business, the warehouse proj-ect and the utility connections are used. Assumptions about the construction company The business (BuildCo): ƒƒ Is a limited liability company. ƒƒ Operates in the economy’s largest business city. For 11 economies the data are also collected for the sec-ond largest business city (see table 14A.1). ƒƒ Is 100% domestically and privately owned. ƒƒ Has 5 owners, none of whom is a legal entity. ƒƒ Is fully licensed and insured to carry out construction projects, such as building warehouses. ƒƒ Has 60 builders and other employ-ees, all of them nationals with the technical expertise and professional experience necessary to obtain con-struction permits and approvals. ƒƒ Has at least 1 employee who is a licensed architect or engineer and registered with the local association of architects or engineers. ƒƒ Has paid all taxes and taken out all necessary insurance applicable to its general business activity (for example, accidental insurance for construction workers and third-person liability). ƒƒ Owns the land on which the ware-house will be built. Assumptions about the warehouse The warehouse: ƒƒWill be used for general storage activities, such as storage of books or stationery. The warehouse will not be used for any goods requiring special conditions, such as food, chemicals or pharmaceuticals. ƒƒWill have 2 stories, both above ground, with a total constructed area of 1,300.6 square meters (14,000 square feet). Each floor will be 3 meters (9 feet, 10 inches) high. ƒƒWill have road access and be lo-cated in the periurban area of the economy’s largest business city (that is, on the fringes of the city but still within its official limits). For 11 economies the data are also collected for the second largest business city. ƒƒWill not be located in a special eco-nomic or industrial zone. ƒƒWill be located on a land plot of 929 square meters (10,000 square feet) that is 100% owned by BuildCo and is accurately registered in the cadastre and land registry. ƒƒ Is valued at 50 times income per capita.4 ƒƒWill be a new construction (there was no previous construction on the land). ƒƒWill have complete architectural and technical plans prepared by a licensed architect. If preparation of the plans requires such steps as obtaining further documentation or getting prior approvals from exter-nal agencies, these are counted as procedures. ƒƒWill include all technical equipment required to be fully operational. ƒƒWill take 30 weeks to construct (ex-cluding all delays due to administra-tive and regulatory requirements). Assumptions about the utility connections The water and sewerage connections: ƒƒWill be 150 meters (492 feet) from the existing water source and sewer tap. If there is no water delivery infrastructure in the economy, a borehole will be dug. If there is no sewerage infrastructure, a septic tank in the smallest size available will be installed or built. ƒƒWill not require water for fire pro-tection reasons; a fire extinguishing system (dry system) will be used instead. If a wet fire protection sys-tem is required by law, it is assumed that the water demand specified below also covers the water needed for fire protection. ƒƒWill have an average water use of 662 liters (175 gallons) a day and an average wastewater flow of 568 liters (150 gallons) a day. ƒƒWill have a peak water use of 1,325 liters (350 gallons) a day and a peak wastewater flow of 1,136 liters (300 gallons) a day. ƒƒWill have a constant level of water demand and wastewater flow throughout the year. ƒƒWill be 1 inch in diameter for the wa-ter connection and 4 inches in diam-eter for the sewerage connection. Procedures A procedure is any interaction of the company’s employees or managers, or any party acting on behalf of the company, with external parties, includ-ing government agencies, notaries, the land registry, the cadastre, utility companies and public inspectors—or the hiring of private inspectors and technical experts apart from in-house architects and engineers. Interactions between company employees, such as development of the warehouse plans and inspections conducted by employees, are not counted as proce-dures. But interactions necessary to obtain any plans, drawings or other documents from external parties (in-cluding any documentation required Figure 14.4 Dealing with construction permits: building a warehouse Days to comply with formalities to build a warehouse As % of warehouse value, no bribes included Procedures are completed when final document is received; construction permits, inspections and utility connections included
  • 132.
    DATA NOTES 121 for th rchitct to prpr th plns), or to hv such documnts pprovd or stmpd b xtrnl prtis, r countd s procdurs. Procdurs tht th compn undros to connct th wrhous to wtr nd swr r includd. All procdurs tht r lll rquird, or tht r don in prctic b th mjorit of compnis, to build wrhous r countd, vn if th m b voidd in xcptionl css (tbl 14.4). Time Tim is rcordd in clndr ds. Th msur cpturs th mdin durtion tht locl xprts indict is ncssr to complt procdur in prctic. It is ssumd tht th minimum tim rquird for ch procdur is 1 d, xcpt for procdurs tht cn b full compltd onlin, for which th tim rquird is rcordd s hlf d. Althouh procdurs m tk plc simultnousl, th cnnot strt on th sm d (tht is, simultnous procdurs strt on conscutiv ds), in with th xcption of procdurs tht cn b full compltd onlin. If procdur cn b cclrtd lll for n dditionl cost nd th cclr- td procdur is usd b th mjorit of compnis, th fstst procdur is chosn. It is ssumd tht BuildCo dos not wst tim nd commits to com-pl tin ch rminin procdur with-out dl. Th tim tht BuildCo spnds on thrin informtion is not tkn into ccount. It is ssumd tht BuildCo is wr of ll buildin rquirmnts nd thir squnc from th binnin. Cost Cost is rcordd s prcnt of th wrhous vlu (ssumd to b 50 tims incom pr cpit). Onl officil costs r rcordd. All th fs ssoci- td with compltin th procdurs to lll build wrhous r rcordd, includin thos ssocitd with obtin-in lnd us pprovls nd prcon-struction dsin clrncs; rcivin inspctions bfor, durin nd ftr construction; obtinin utilit connc-tions; nd ristrin th wrhous proprt. Nonrcurrin txs rquird for th compltion of th wrhous projct r lso rcordd. Sls txs (such s vlu ddd tx) or cpitl ins txs r not rcordd. Nor r dposits tht must b pid up front nd r ltr rfundd. Th buildin cod, informtion from locl xprts, nd spcific rultions nd f schd-ul s r usd s sourcs for costs. If svrl locl prtnrs provid diffrnt stimts, th mdin rportd vlu is usd. Th d t dt ils on d lin with con-struction prmits c n b found for ch conom t http://www.doinbusinss.or. GETTING ELECTRICITY Doin Businss rcords ll procdurs rquird for businss to obtin pr-m nnt lctricit connction nd sup-pl for stndrdid wrhous (fiur 14.5). Ths procdurs includ pplic- tions nd contrcts with lctricit utilitis, ll ncssr inspctions nd clrncs from th utilit nd othr ncis, nd th xtrnl nd finl connction works. Th qustionnir di-vid s th procss of ttin n lctric-it connction into distinct procdurs nd solicits dt for clcultin th tim nd cost to complt ch procdur. Th rnkin of conomis on th s of ttin lctricit is dtrmind b sortin thir distnc to frontir scors for ttin lctricit. Ths scors r th simpl vr of th distnc to TABLE 14.4 Wht do th dlin† with construction prmits indictors msur? Proc dur s to l ­ll‡ build ­ w­r hous (numb r) Submittin ll rlvnt documnts nd obtinin ll ncssr clrncs, licnss, prmits nd crtificts Submittin ll rquird notifictions nd rcivin ll ncssr inspctions Obtinin utilit connctions for wtr nd swr Ristrin th wrhous ftr its compltion (if rquird for us s colltrl or for trnsfr of th wrhous) Tim r quir d to compl t ­ch proc dur (c­l nd­r d­‡s) Dos not includ tim spnt thrin informtion Ech procdur strts on sprt d— thouh procdurs tht cn b full compltd onlin r n xcption to this rul Procdur considrd compltd onc finl documnt is rcivd No prior contct with officils Cost r quir d to compl t ­ch proc dur (% of w­r hous v­lu ) Officil costs onl, no bribs FIGURE 14.5 Doin Businss msurs th connction procss t th lvl of distribution utilitis Generation Transmission Distribution u New connections Network operation and maintenance Metering and billing Customer
  • 133.
    122 Doing Business2015 frontier scores for each of the compo-nent indicators (figure 14.6). Data are collected from the electricity distribution utility, then completed and verified by electricity regulatory agen-cies and independent professionals such as electrical engineers, electrical contractors and construction compa-nies. The electricity distribution utility consulted is the one serving the area (or areas) where warehouses are located. If there is a choice of distribution utilities, the one serving the largest number of customers is selected. To make the data comparable across economies, several assumptions about the warehouse and the electricity con-nection are used. Assumptions about the warehouse The warehouse: ƒƒ Is owned by a local entrepreneur. ƒƒ Is located in the economy’s largest business city. For 11 economies the data are also collected for the sec-ond largest business city (see table 14A.1). ƒƒ Is located in an area where similar warehouses are typically located. In this area a new electricity connection is not eligible for a special investment promotion regime (offering special subsidization or faster service, for example). ƒƒ Is located in an area with no physi-cal constraints. For example, the property is not near a railway. ƒƒ Is a new construction and is being connected to electricity for the first time. ƒƒ Has 2 stories, both above ground, with a total surface area of ap-proximately 1,300.6 square meters (14,000 square feet). The plot of land on which it is built is 929 square meters (10,000 square feet). ƒƒ Is used for storage of refrigerated goods. Assumptions about the electricity connection The electricity connection: ƒƒ Is a permanent one. ƒƒ Is a 3-phase, 4-wire Y, 140-kilovolt-ampere (kVA) (subscribed capacity) connection (where the voltage is 120/208 V, the current would be 400 amperes; where it is 230/400 B, the current would be nearly 200 amperes). ƒƒ Is 150 meters long. The connection is to either the low-voltage or the medium-voltage distribution net-work and either overhead or under-ground, whichever is more common in the area where the warehouse is located. ƒƒ Requires works that involve the crossing of a 10-meter road (such as by excavation or overhead lines) but are all carried out on public land. There is no crossing of other owners’ private property because the ware-house has access to a road. ƒƒ Includes only a negligible length in the customer’s private domain. ƒƒWill supply monthly electricity con-sumption of 0.07 gigawatt-hours (GWh). ƒƒ Does not involve work to install the internal electrical wiring. This has already been completed, up to and including the customer’s service panel or switchboard and installa-tion of the meter base. Procedures A procedure is defined as any interac-tion of the company’s employees or its main electrician or electrical engineer (that is, the one who may have done the internal wiring) with external parties, such as the electricity distribution util-ity, electricity supply utilities, govern-ment agencies, electrical contractors and electrical firms. Interactions be-tween company employees and steps related to the internal electrical wiring, such as the design and execution of the internal electrical installation plans, are not counted as procedures. Procedures that must be completed with the same utility but with different departments are counted as separate procedures (table 14.5). The company’s employees are as-sumed to complete all procedures themselves unless the use of a third party is mandated (for example, if only an electrician registered with the utility Figure 14.6 Getting electricity: obtaining an electricity connection Rankings are based on distance to frontier scores for 3 indicators Days to obtain an electricity connection As % of income per capita, no bribes included 33.3% Time 33.3% Cost 33.3% Procedures Steps to file an application, prepare a design, complete works, obtain approvals, go through inspections, install a meter and sign a supply contract TABLE 14.5 What do the getting electricity indicators measure? Procedures to obtain an electricity connection (number) Submitting all relevant documents and obtaining all necessary clearances and permits Completing all required notifications and receiving all necessary inspections Obtaining external installation works and possibly purchasing material for these works Concluding any necessary supply contract and obtaining final supply Time required to complete each procedure (calendar days) Is at least 1 calendar day Each procedure starts on a separate day Does not include time spent gathering information Reflects the time spent in practice, with little follow-up and no prior contact with officials Cost required to complete each procedure (% of income per capita) Official costs only, no bribes Value added tax excluded
  • 134.
    DATA NOTES 123 is llowd to submit n ppliction). If th compn cn, but is not rquird to, rqust th srvics of profssion- ls (such s privt firm rthr thn th utilit for th xtrnl works), ths procdurs r rcordd if th r commonl don. For ll procdurs, onl th most likl css (for xmpl, mor thn 50% of th tim th utilit hs th mtril) nd thos followd in prctic for connctin wrhous to lctricit r countd. Time Tim is rcordd in clndr ds. Th msur cpturs th mdin durtion tht th lctricit utilit nd xprts indict is ncssr in prctic, rthr thn rquird b lw, to complt procdur with minimum follow-up nd no xtr pmnts. It is lso ssumd tht th minimum tim rquird for ch procdur is 1 d. Althouh pro-c durs m tk plc simultnousl, th cnnot strt on th sm d (tht is, simultnous procdurs strt on conscutiv ds). It is ssumd tht th compn dos not wst tim nd commits to compltin ch rminin procdur without dl. Th tim tht th compn spnds on thrin in-form tion is not tkn into ccount. It is ssumd tht th compn is wr of ll lctricit connction rquirmnts nd thir squnc from th binnin. Cost Cost is rcordd s prcnt of th conom’s incom pr cpit. Costs r rcordd xclusiv of vlu ddd tx. All th fs nd costs ssocitd with compltin th procdurs to con-n ct wrhous to lctricit r rcordd, includin thos rltd to obtinin clrncs from ovrnmnt ncis, pplin for th connction, rcivin inspctions of both th sit nd th intrnl wirin, purchsin mtril, ttin th ctul connction works nd pin scurit dposit. Informtion from locl xprts nd spcific rultions nd f schd-ul s r usd s sourcs for costs. If svrl locl prtnrs provid diffrnt stimts, th mdin rportd vlu is usd. In ll css th cost xcluds bribs. Security deposit Utilitis rquir scurit dposits s urnt inst th possibl filur of customrs to p thir consump-tion bills. For this rson th scurit dposit for nw customr is most oftn clcultd s function of th customr’s stimtd consumption. Doin Businss dos not rcord th full mount of th scurit dposit. If th dposit is bsd on th customr’s ctul consumption, this bsis is th on ssumd in th cs stud. Rthr thn th full mount of th scurit dposit, Doin Businss r- cords th prsnt vlu of th losss in intrst rnins xprincd b th customr bcus th utilit holds th scurit dposit ovr prolond priod, in most css until th nd of th contrct (ssumd to b ftr 5 rs). In css whr th scurit d- posit is usd to covr th first monthl consumption bills, it is not rcordd. To clcult th prsnt vlu of th lost intrst rnins, th nd-2013 lndin rts from th Intrntionl Montr Fund’s Intrn tion l Fin nci l St tistics r usd. In css whr th scurit dposit is rturnd with intrst, th diffrnc btwn th lndin rt nd th intrst pid b th utilit is usd to clcult th prsnt vlu. In som conomis th scurit dposit cn b put up in th form of bond: th compn cn obtin from bnk or n insurnc compn urnt issud on th ssts it holds with tht finncil institution. In contrst to th scnrio in which th customr ps th dposit in csh to th utilit, in this scnrio th compn dos not los ownrship control ovr th full mount nd cn continu usin it. In rturn th compn will p th bnk commission for obtinin th bond. Th commission chrd m vr dpndin on th crdit stndin of th compn. Th bst possibl crdit stndin nd thus th lowst possibl commission r ssumd. Whr bond cn b put up, th vlu rcordd for th dposit is th nnul commis-sion tims th 5 rs ssumd to b th lnth of th contrct. If both op-tions xist, th chpr ltrntiv is rcordd. In Hondurs in Jun 2014 customr r- qustin 140-kVA lctricit connc-tion would hv hd to put up scurit dposit of 118,434 Hondurn lmpirs (L) in csh or chck, nd th dposit would hv bn rturnd onl t th nd of th contrct. Th customr could instd hv invstd this mon t th prvilin lndin rt of 20.08%. Ovr th 5 rs of th contrct this would impl prsnt vlu of lost intrst rnins of L 70,998.58. In contrst, if th customr chos to sttl th dposit with bnk urnt t n nnul rt of 2.5%, th mount lost ovr th 5 rs would b just L 14,804.30. Th d t dt ils on ttin lctricit c n b found for ch conom t http:// www.doinbusinss.or. REGISTERING PROPERTY Doin Businss rcords th full s- qunc of procdurs ncssr for businss (th bur) to purchs proprt from nothr businss (th sllr) nd to trnsfr th proprt titl to th bur’s nm so tht th bur cn us th proprt for xpndin its businss, us th proprt s colltrl in tkin nw lons or, if ncssr, sll th proprt to nothr businss. Th procss strts with obtinin th ncssr documnts, such s cop of th sllr’s titl if ncssr, nd conductin du dilinc if rquird. Th trnsction is considrd complt whn it is opposbl to third pr-ti s nd whn th bur cn us th
  • 135.
    124 Doing Business2015 Land 2-story warehouse property, use it as collateral for a bank loan or resell it (figure 14.7). The ranking of economies on the ease of register-ing property is determined by sorting their distance to frontier scores for registering property. These scores are the simple average of the distance to frontier scores for each of the compo-nent indicators (figure 14.8). Every procedure required by law or nec-essary in practice is included, whether it is the responsibility of the seller or the buyer or must be completed by a third party on their behalf. Local prop-erty lawyers, notaries and property registries provide information on pro-cedures as well as the time and cost to complete each of them. The registering property indicators do not measure the accessibility of property registration systems, the legal security offered by formal registration, the use of informal property registration systems or the equity of land policies. To make the data comparable across economies, several assumptions about the parties to the transaction, the property and the procedures are used. Assumptions about the parties The parties (buyer and seller): ƒƒ Are limited liability companies. ƒƒ Are located in the periurban area of the economy’s largest business city. For 11 economies the data are also collected for the second largest business city (see table 14A.1). ƒƒ Are 100% domestically and privately owned. ƒƒ Have 50 employees each, all of whom are nationals. ƒƒ Perform general commercial activities. Assumptions about the property The property: ƒƒ Has a value of 50 times income per capita. The sale price equals the value. ƒƒ Is fully owned by the seller. ƒƒ Has no mortgages attached and has been under the same ownership for the past 10 years. ƒƒ Is registered in the land registry or cadastre, or both, and is free of title disputes. ƒƒ Is located in a periurban commercial zone, and no rezoning is required. ƒƒ Consists of land and a building. The land area is 557.4 square meters (6,000 square feet). A 2-story ware-house of 929 square meters (10,000 square feet) is located on the land. The warehouse is 10 years old, is in good condition and complies with all safety standards, building codes and other legal requirements. It has no heating system. The property of land and building will be transferred in its entirety. Rankings are based on distance to frontier scores for 3 indicators 33.3% Time 33.3% Cost 33.3% Procedures ƒƒWill not be subject to renovations or additional building following the purchase. ƒƒ Has no trees, natural water sources, natural reserves or historical monu-ments of any kind. ƒƒWill not be used for special purpos-es, and no special permits, such as for residential use, industrial plants, waste storage or certain types of agricultural activities, are required. ƒƒ Has no occupants, and no other party holds a legal interest in it. Procedures A procedure is defined as any interac-tion of the buyer or the seller, their agents (if an agent is legally or in practice required) or the property with external parties, including government agencies, inspectors, notaries and law-yers. Interactions between company officers and employees are not con-sidered. All procedures that are legally or in practice required for registering property are recorded, even if they may be avoided in exceptional cases (table 14.6). It is assumed that the buyer fol-lows the fastest legal option available and used by the majority of property owners. Although the buyer may use lawyers or other professionals where Figure 14.7 What are the time, cost and number of procedures required to transfer property between 2 local companies? Number of procedures Buyer can use the property, resell it or use it as collateral Preregistration Registration Postregistration Time (days) Cost (% of property value) Seller with property registered and no title disputes Figure 14.8 Registering property: transfer of property between 2 local companies Days to transfer property As % of property value, no bribes included Steps to check encumbrances, obtain clearance certificates, prepare deed and transfer title so that the property can be occupied, sold or used as collateral
  • 136.
    Data Notes 125 necessary in the registration process, it is assumed that the buyer does not employ an outside facilitator in the registration process unless legally or in practice required to do so. Time Time is recorded in calendar days. The measure captures the median dura-tion that property lawyers, notaries or registry officials indicate is necessary to complete a procedure. It is assumed that the minimum time required for each procedure is 1 day, except for procedures that can be fully completed online, for which the time required is recorded as half a day. Although proce-dures may take place simultaneously, they cannot start on the same day, again with the exception of procedures that can be fully completed online. It is assumed that the buyer does not waste time and commits to completing each remaining procedure without delay. If a procedure can be accelerated for an ad-ditional cost, the fastest legal procedure available and used by the majority of property owners is chosen. If procedures can be undertaken simultaneously, it is assumed that they are. It is assumed that the parties involved are aware of all requirements and their sequence from the beginning. Time spent on gathering information is not considered. Cost Cost is recorded as a percentage of the property value, assumed to be equiva-lent to 50 times income per capita. Only official costs required by law are recorded, including fees, transfer taxes, stamp duties and any other payment to the property registry, notaries, public agencies or lawyers. Other taxes, such as capital gains tax or value added tax, are excluded from the cost measure. Both costs borne by the buyer and those borne by the seller are included. If cost estimates differ among sources, the median reported value is used. The data details on registering property can be found for each economy at http:// www.doingbusiness.org. GETTING CREDIT Doing Business measures the legal rights of borrowers and lenders with re-spect to secured transactions through one set of indicators and the sharing of credit information through another. The first set of indicators measures whether certain features that facilitate lending exist within the applicable col-lateral and bankruptcy laws. The sec-ond set measures the coverage, scope and accessibility of credit information available through credit reporting ser-vice providers such as credit bureaus or credit registries (figure 14.9). The ranking of economies on the ease of getting credit is determined by sorting their distance to frontier scores for getting credit. These scores are the distance to frontier score for the sum of the strength of legal rights index and the depth of credit information index (figure 14.10). Legal rights The data on the legal rights of borrow-ers and lenders are gathered through a questionnaire administered to financial lawyers and verified through analysis of laws and regulations as well as public sources of information on collateral and bankruptcy laws. Questionnaire responses are verified through several rounds of follow-up communication with respondents as well as by contacting third parties and consulting public sources. The ques-tionnaire data are confirmed through teleconference calls or on-site visits in all economies. Figure 14.9 Do lenders have credit information on entrepreneurs seeking credit? Is the law favorable to borrowers and lenders using movable assets as collateral? Movable asset Collateral registry Lender Credit bureaus and registries Potential borrower What types can be used as collateral? Can lenders access credit information on borrowers? Can movable assets be used as collateral? Credit information TABLE 14.6 What do the registering property indicators measure? Procedures to legally transfer title on immovable property (number) Preregistration procedures (for example, checking for liens, notarizing sales agreement, paying property transfer taxes) Registration procedures in the economy’s largest business citya Postregistration procedures (for example, filing title with municipality) Time required to complete each procedure (calendar days) Does not include time spent gathering information Each procedure starts on a separate day— though procedures that can be fully completed online are an exception to this rule Procedure considered completed once final document is received No prior contact with officials Cost required to complete each procedure (% of property value) Official costs only, no bribes No value added or capital gains taxes included a. For 11 economies the data are also collected for the second largest business city.
  • 137.
    126 DOING BUSINESS2015 Rankings are based on distance to frontier scores for the sum of 2 indicators 100% Sum of strength of legal rights index (0–12) and depth of credit information index (0–8) Strength of legal rights index Th strnth of ll rihts indx m- surs th dr to which colltrl nd bnkruptc lws protct th rihts of borrowrs nd lndrs nd thus fcilitt lndin (tbl 14.7). Th indx for th first tim this r includs 12 componnts rthr thn 10. For ch conom it is first ssssd whthr unitr scurd trnsctions sstm xists. Thn 2 cs scnrios, cs A nd cs B, r usd to dtrmin how nonpossssor scurit intrst is crtd, publicid nd nforcd c-cordin to th lw. Spcil mphsis is ivn to how th colltrl ristr oprts (if ristrtion of scurit in-t rsts is possibl). Th cs scnrios involv scurd borrowr, th comp- n ABC, nd scurd lndr, BiBnk. In som conomis th ll frmwork for scurd trnsctions will llow onl cs A or cs B (not both) to ppl. Both css xmin th sm st of ll provisions rltin to th us of movbl colltrl. Svrl ssumptions bout th scurd borrowr (ABC) nd lndr (BiBnk) r usd: ƒ ABC is domstic limitd libilit compn. ƒ ABC hs up to 50 mplos. ƒ ABC hs its hdqurtrs nd onl bs of oprtions in th conom’s lrst businss cit. For 11 cono-mi s th dt r lso collctd for th scond lrst businss cit (s tbl 14A.1). ƒ Both ABC nd BiBnk r 100% domsticll ownd. Th cs scnrios lso involv ssumptions. In cs A, s collt- rl for th lon, ABC rnts BiBnk nonpossssor scurit intrst in on ctor of movbl ssts, for xmpl, its mchinr or its invntor. ABC wnts to kp both possssion nd ownrship of th colltrl. In conomis whr th lw dos not l-low nonpossssor scurit intrsts in movbl proprt, ABC nd BiBnk us fiducir trnsfr-of-titl r-r nmnt (or similr substitut for nonpossssor scurit intrsts). In cs B, ABC rnts BiBnk busi-n ss chr, ntrpris chr, flot-in chr or n chr tht ivs BiBnk scurit intrst ovr ABC’s combind movbl ssts (or s much of ABC’s movbl ssts s possibl). ABC kps ownrship nd possssion of th ssts. Th strnth of ll rihts indx covrs functionl quivlnts to scu-rit ovr movbl ssts (for xmpl, lsin or rsrvtion of titl) onl in its first componnt, to ssss how in-t rtd or unifid th conom’s ll frmwork for scurd trnsctions is. Th strnth of ll rihts indx includs 10 spcts rltd to ll rihts in colltrl lw nd 2 spcts in bnkruptc lw. A scor of 1 is ssind for ch of th followin fturs of th lws: ƒ Th conom hs n intrtd or unifid ll frmwork for scurd trnsctions tht xtnds to th crtion, publicit nd nforcmnt of 4 functionl quivlnts to s- curit intrsts in movbl ssts: fiducir trnsfr of titl; finncil lss; ssinmnt or trnsfr of rcivbls; nd sls with rtn-tion of titl. ƒ Th lw llows businss to rnt nonpossssor scurit riht in sinl ctor of movbl ssts (such s mchinr or invntor), without rquirin spcific dscrip-tion of th colltrl. ƒ Th lw llows businss to rnt nonpossssor scurit riht in substntill ll its movbl ssts, without rquirin spcific dscrip-tion of th colltrl. ƒ A scurit riht cn b ivn ovr futur or ftr-cquird ssts nd xtnds utomticll to th products, procds or rplcmnts of th oriinl ssts. ƒ A nrl dscription of dbts nd oblitions is prmittd in th col-l trl rmnt nd in ristr- tion documnts, ll tps of dbts nd oblitions cn b scurd b- twn th prtis, nd th colltrl rmnt cn includ mximum mount for which th ssts r ncumbrd. ƒ A colltrl ristr or ristrtion institution for scurit intrsts rntd ovr movbl proprt b incorportd nd nonincorportd FIGURE 14.10 Gttin† crdit: colltrl ruls nd crdit informtion Regulations on nonpossessory security interests in movable property Scope, quality and accessibility of credit information through credit bureaus and registries Not: Crdit buru covr nd crdit ristr covr r msurd but do not count for th rnkins. TABLE 14.7 Wht do th †ttin† crdit indictors msur? Str nth of l ­l rihts ind x (0–12) Protction of rihts of borrowrs nd lndrs throuh colltrl lws Protction of scurd crditors’ rihts throuh bnkruptc lws D pth of cr dit inform­tion ind x (0–8) Scop nd ccssibilit of crdit informtion distributd b crdit ristris nd crdit burus Cr dit bur ­u cov r­ (% of ­dults) Numbr of individuls nd firms listd in th lrst crdit buru s prcnt of dult popultion Cr dit r istr‡ cov r­ (% of ­dults) Numbr of individuls nd firms listd in crdit ristr s prcnt of dult popultion
  • 138.
    DATA NOTES 127 ntitis is in oprtion, unifid o- rphicll nd with n lc-tronic dtbs indxd b dbtors’ nms. ƒ Th colltrl ristr is notic- bsd ristr— ristr tht fils onl notic of th xistnc of scurit intrst (not th undrlin documnts) nd dos not prform ll rviw of th trnsction. Th ristr lso publicis functionl quivlnts to scurit intrsts. ƒ Th colltrl ristr hs modrn fturs such s thos tht llow scurd crditors (or thir rprsn-t tivs) to ristr, srch, mnd or cncl scurit intrsts onlin. ƒ Scurd crditors r pid first (for xmpl, bfor tx clims nd m-plo clims) whn dbtor dfults outsid n insolvnc procdur. ƒ Scurd crditors r pid first (for xmpl, bfor tx clims nd mplo clims) whn businss is liquidtd. ƒ Scurd crditors r subjct to n utomtic st on nforcmnt procdurs whn dbtor ntrs court-suprvisd rornition procdur, but th lw protcts scurd crditors’ rihts b provid-in clr rounds for rlif from th utomtic st (for xmpl, if th movbl proprt is in dnr) or sttin tim limit for it. ƒ Th lw llows prtis to r in th colltrl rmnt tht th lndr m nforc its scurit riht out of court; th lw llows public nd privt uctions nd lso prmits th scurd crditor to tk th sst in stisfction of th dbt. As rsult of chns introducd this r, th first componnt of th indx rplcs on rltin to ll limittions on who cn prticipt in scurit rmnt. Two componnts wr ddd, on wht tp of colltrl ristr oprts in th conom nd on how it oprts. Th scorin now pnlis conomis for not hvin n utomtic st on nforcmnt durin rornition procdurs so s to nsur tht vibl businss cn con-tinu to oprt. And th indx tks into ccount nw lmnts rltin to out-of-court nforcmnt procdurs (such s th tps of uctions llowd). Th indx rns from 0 to 12, with hihr scors indictin tht colltrl nd bnkruptc lws r bttr d- sind to xpnd ccss to crdit. Credit information Th dt on th shrin of crdit informtion r built in 2 sts. First, bnkin suprvision uthoritis nd public informtion sourcs r survd to confirm th prsnc of crdit rportin srvic providr, such s crdit buru or crdit ristr. Scond, whn pplicbl, dtild qustionnir on th crdit buru’s or crdit ristr’s structur, lws nd ssocitd ruls is dministrd to th ntit itslf. Qustionnir rsponss r vrifid throuh svrl rounds of follow-up communiction with rspon-d nts s wll s b contctin third prtis nd consultin public sourcs. Th qustionnir dt r confirmd throuh tlconfrnc clls or on-sit visits in ll conomis. Depth of credit information index Th dpth of crdit informtion indx msurs ruls nd prctics ffctin th covr, scop nd ccssibilit of crdit informtion vilbl throuh ithr crdit buru or crdit r- istr. A scor of 1 is ssind for ch of th followin 8 fturs of th crdit buru or crdit ristr (or both): ƒ Dt on both firms nd individuls r distributd. ƒ Both positiv crdit informtion (for xmpl, oriinl lon mounts, outstndin lon mounts nd pttrn of on-tim rpmnts) nd ntiv informtion (for xmpl, lt pmnts nd th numbr nd mount of dfults) r distributd. ƒ Dt from rtilrs nd utilit com-p nis r distributd in ddition to dt from finncil institutions. ƒ At lst 2 rs of historicl dt r distributd. Crdit burus nd ristris tht distribut mor thn 10 rs of ntiv dt or rs dt on dfults s soon s th r rpid obtin scor of 0 for this componnt.5 ƒ Dt on lon mounts blow 1% of incom pr cpit r distributd. ƒ B lw, borrowrs hv th riht to ccss thir dt in th lrst crdit buru or ristr in th conom. Crdit burus nd r- istris tht chr mor thn 1% of incom pr cpit for borrowrs to inspct thir dt obtin scor of 0 for this componnt.6 ƒ Dt usrs cn ccss borrowrs’ crdit informtion onlin (for x- mpl, throuh n onlin pltform, sstm-to-sstm connction or both).7 ƒ Buru or ristr crdit scors r offrd s vlu ddd srvic to hlp dt usrs ssss th crdit-worthin ss of borrowrs.8 Prviousl th dpth of crdit infor-m tion indx covrd onl th first 6 fturs listd bov. Th indx rns from 0 to 8, with hihr vlus indictin th vilbilit of mor crdit informtion, from ithr crdit buru or crdit ristr, to fcilitt lndin dcisions. If th crdit buru or ristr is not oprtionl or covrs lss thn 5% of th dult popultion, th scor on th dpth of crdit informtion indx is 0. In Lithuni, for xmpl, both crdit buru nd crdit ristr oprt. Both distribut dt on firms nd in-dividu ls ( scor of 1). Both distribut positiv nd ntiv informtion ( scor of 1). Althouh th crdit ristr dos not distribut dt from rtil- rs or utilitis, th crdit buru dos ( scor of 1). Both distribut t lst 2 rs of historicl dt ( scor of 1). Althouh th crdit ristr hs
  • 139.
    128 DOING BUSINESS2015 thrshold of 1,000 liti, th crdit buru distributs dt on lons of n vlu ( scor of 1). Borrowrs hv th riht to ccss thir dt in both th crdit buru nd th crdit ristr fr of chr onc r ( scor of 1). Both ntitis provid dt usrs ccss to dtbss throuh n onlin pltform ( scor of 1). Althouh th crdit ristr dos not provid crdit scors, th crdit buru dos ( scor of 1). Addin ths numbrs ivs Lithuni scor of 8 on th dpth of crdit informtion indx. Credit bureau coverage Crdit buru covr rports th numbr of individuls nd firms listd in crdit buru’s dtbs s of Jnur 1, 2014, with informtion on thir borrowin histor from th pst 5 rs. Th numbr is xprssd s prcnt of th dult popultion (th popultion 15 nd bov in 2013 ccordin to th World Bnk’s World Dvlopmnt Indic tors). A crdit buru is dfind s privt firm or nonprofit ornition tht mintins dtbs on th crditworthinss of borrowrs (individuls or firms) in th finncil sstm nd fcilitts th xchn of crdit informtion mon crditors. (Mn crdit burus support bnkin nd ovrll finncil suprvision ctivi-ti s in prctic, thouh this is not thir primr objctiv.) Crdit invstitiv burus nd crdit rportin firms tht do not dirctl fcilitt inform- tion xchn mon bnks nd othr finncil institutions r not considrd. If no crdit buru oprts, th covr- vlu is 0.0%. Credit registry coverage Crdit ristr covr rports th numbr of individuls nd firms listd in crdit ristr’s dtbs s of Jnur 1, 2014, with informtion on thir borrowin histor from th pst 5 rs. Th numbr is xprssd s prcnt of th dult popultion (th popultion 15 nd bov in 2013 ccordin to th World Bnk’s World Dvlopmnt Indic tors). A crdit ristr is dfind s dtbs mnd b th public sctor, usull b th cntrl bnk or th suprintndnt of bnks, tht primril ssists bnkin suprvi-sion whil t th sm tim fcilittin th xchn of crdit informtion mon bnks nd othr rultd finncil institutions. If no ristr opr- ts, th covr vlu is 0.0%. Th d t dt ils on ttin crdit c n b found for ch conom t http://www .doinbusinss.or. Th initi l mthodol-o w s dvlopd b Dj nkov, McLish nd Shlifr (2007) nd is doptd hr with minor ch ns. PROTECTING MINORITY INVESTORS Doin Businss msurs th protction of minorit invstors from conflicts of intrst throuh on st of indictors nd shrholdrs’ rihts in corport ovrnnc throuh nothr (tbl 14.8). Th dt com from qustion-n ir dministrd to corport nd scuritis lwrs nd r bsd on scuritis rultions, compn lws, civil procdur cods nd court ruls of vidnc. Th rnkin of conomis on th strnth of minorit invstor pro-t ctions is dtrmind b sortin thir distnc to frontir scors for protct-in minorit invstors. Ths scors r th simpl vr of th distnc to frontir scors for th xtnt of conflict of intrst rultion indx nd th xtnt of shrholdr ovrnnc indx (fiur 14.11). Protection of shareholders from conflicts of interest Th xtnt of conflict of intrst rul- tion indx msurs th protction of shrholdrs inst dirctors’ misus of corport ssts for prsonl in b distinuishin 3 dimnsions of rul- tion tht ddrss conflicts of intrst: trnsprnc of rltd-prt trnsc-tions (xtnt of disclosur indx), shr- holdrs’ bilit to su nd hold dirctors libl for slf-dlin (xtnt of dirctor libilit indx) nd ccss to vidnc nd lloction of ll xpnss in TABLE 14.8 Wht do th protctin† minorit invstors indictors msur? Ext nt of disclosur ind x (0–10) Ext nt of sh­r hold r rihts ind x (0–10.5) Rviw nd pprovl rquirmnts for rltd-p rt trnsctions Shrholdrs’ rihts nd rol in mjor corport dcisions Intrnl, immdit nd priodic disclosur rquirmnts for rltd-prt trnsctions Ext nt of dir ctor li­bilit‡ ind x (0–10) Str nth of ov rn­nc structur ind x (0–10.5) Minorit shrholdrs’ bilit to su nd hold Govrnnc sfurds protctin shrholdrs intrstd dirctors libl for prjudicil rltd-p from undu bord control nd ntrnchmnt rt trnsctions Avilbl ll rmdis (dms, disormnt of profits, fins, imprisonmnt, rscission of trnsctions) E­s of sh­r hold r suits ind x (0–10) Ext nt of corpor­t tr­nsp­r nc‡ ind x (0–9) Accss to intrnl corport documnts Corport trnsprnc on ownrship stks, compnstion, udits nd finncil prospcts Evidnc obtinbl durin tril Alloction of ll xpnss Ext nt of conflict of int r st r ul­tion ind x (0–10) Ext nt of sh­r hold r ov rn­nc ind x (0–10) Sum of th xtnt of disclosur, xtnt of dirctor libilit nd s of shrholdr suits indics, dividd b 3 Sum of th xtnt of shrholdr rihts, strnth of ovrnnc structur nd xtnt of corport trnsprnc indics, dividd b 3 Str nth of minorit‡ inv stor prot ction ind x (0–10) Simpl vr of th xtnt of conflict of intrst rultion nd xtnt of shrholdr ovrnnc indics
  • 140.
    Data Notes 129 Figure 14.11 Protecting minority investors: shareholders’ rights in conflicts of interest and corporate governance Rankings are based on distance to frontier scores for 2 indicators shareholder litigation (ease of share-holder suits index). To make the data comparable across economies, several assumptions about the business and the transaction are used (figure 14.12). Assumptions about the business The business (Buyer): ƒƒ Is a publicly traded corporation listed on the economy’s most im-portant stock exchange. If the num-ber of publicly traded companies listed on that exchange is less than 10, or if there is no stock exchange in the economy, it is assumed that Buyer is a large private company with multiple shareholders. ƒƒ Has a board of directors and a chief executive officer (CEO) who may legally act on behalf of Buyer where permitted, even if this is not specifi-cally required by law. ƒƒ Has a supervisory board (appli-cable to economies with a 2-tier board system) on which 60% of the shareholder-elected members have been appointed by Mr. James, who is Buyer’s controlling shareholder and a member of Buyer’s board of directors. ƒƒ Is a manufacturing company. ƒƒ Has its own distribution network. Assumptions about the transaction ƒƒMr. James owns 60% of Buyer and elected 2 directors to Buyer’s 5-member board. ƒƒMr. James also owns 90% of Seller, a company that operates a chain of retail hardware stores. Seller recently closed a large number of its stores. ƒƒMr. James proposes that Buyer pur-chase Seller’s unused fleet of trucks to expand Buyer’s distribution of its food products, a proposal to which Buyer agrees. The price is equal to 10% of Buyer’s assets and is higher than the market value. ƒƒ The proposed transaction is part of the company’s ordinary course of business and is not outside the authority of the company. ƒƒ Buyer enters into the transaction. All required approvals are obtained, and all required disclosures made (that is, the transaction is not fraudulent). ƒƒ The transaction causes damages to Buyer. Shareholders sue Mr. James and the other parties that approved the transaction. Extent of disclosure index The extent of disclosure index has 5 components: ƒƒWhich corporate body can provide legally sufficient approval for the transaction. A score of 0 is assigned if it is the CEO or the managing director alone; 1 if the board of directors, the supervisory board or shareholders must vote and Mr. James is permitted to vote; 2 if the board of directors or the supervisory board must vote and Mr. James is not permitted to vote; 3 if shareholders must vote and Mr. James is not permitted to vote. ƒƒWhether immediate disclosure of the transaction to the public, the regula-tor or the shareholders is required. A score of 0 is assigned if no disclosure is required; 1 if disclosure on the terms of the transaction is required but not on Mr. James’s conflict of interest; 2 if disclosure on both the terms and Mr. James’s conflict of interest is required.9 ƒƒWhether disclosure in the annual report is required. A score of 0 is assigned if no disclosure on the transaction is required; 1 if disclo-sure on the terms of the transaction is required but not on Mr. James’s conflict of interest; 2 if disclosure on both the terms and Mr. James’s conflict of interest is required. ƒƒWhether disclosure by Mr. James to the board of directors or the su-pervisory board is required. A score of 0 is assigned if no disclosure is required; 1 if a general disclosure of the existence of a conflict of interest is required without any specifics; 2 if full disclosure of all material facts relating to Mr. James’s interest in the Buyer-Seller transaction is required. ƒƒWhether it is required that an exter-nal body, for example, an external auditor, review the transaction Figure 14.12 How well are minority shareholders protected from conflicts of interest? Extent of disclosure Disclosure and approval requirements Extent of director liability Ability to sue directors for damages Ease of shareholder suits Access by shareholders to documents plus other evidence for trial 90% ownership, sits on board of directors Mr. James 60% ownership, sits on board of directors Company B (seller) Company A (buyer) Transaction involving conflict of interest Lawsuit Minority shareholders 50% Extent of conflict of interest regulation index 50% Extent of shareholder governance index
  • 141.
    130 DOING BUSINESS2015 bfor it tks plc. A scor of 0 is ssind if no; 1 if s. Th indx rns from 0 to 10, with hihr vlus indictin rtr disclo-sur . In Polnd, for xmpl, th bord of dirctors must pprov th trnsction nd Mr. Jms is not llowd to vot ( scor of 2). Bur is rquird to disclos immditl ll informtion ffctin th stock pric, includin th conflict of intrst ( scor of 2). In its nnul r- port Bur must lso disclos th trms of th trnsction nd Mr. Jms’s own- rship in Bur nd Sllr ( scor of 2). Bfor th trnsction Mr. Jms must disclos his conflict of intrst to th othr dirctors, but h is not rquird to provid spcific informtion bout it ( scor of 1). Polnd dos not rquir n xtrnl bod to rviw th trnsction ( scor of 0). Addin ths numbrs ivs Polnd scor of 7 on th xtnt of disclosur indx. Extent of director liability index Th xtnt of dirctor libilit indx hs 7 componnts:10 ƒ Whthr shrholdr plintiff is bl to hold Mr. Jms libl for th dm th Bur-Sllr trnsc-tion cuss to th compn. A scor of 0 is ssind if Mr. Jms cnnot b hld libl or cn b hld libl onl for frud, bd fith or ross nlinc; 1 if Mr. Jms cn b hld libl onl if h influncd th pprovl of th trnsction or ws nlint; 2 if Mr. Jms cn b hld libl whn th trnsction is unfir or prjudicil to th othr shrholdrs. ƒ Whthr shrholdr plintiff is bl to hold th pprovin bod (th CEO, mmbrs of th bord of dirc-tors or mmbrs of th suprvisor bord) libl for th dm th trnsction cuss to th compn. A scor of 0 is ssind if th p-provin bod cnnot b hld libl or cn b hld libl onl for frud, bd fith or ross nlinc; 1 if th pprovin bod cn b hld libl for nlinc; 2 if th pprovin bod cn b hld libl whn th trnsc-tion is unfir or prjudicil to th othr shrholdrs. ƒ Whthr court cn void th trns- ction upon succssful clim b shrholdr plintiff. A scor of 0 is ssind if rscission is unvilbl or is vilbl onl in cs of frud, bd fith or ross nlinc; 1 if r- scission is vilbl whn th trns- ction is opprssiv or prjudicil to th othr shrholdrs; 2 if rscission is vilbl whn th trnsction is unfir or ntils conflict of intrst. ƒ Whthr Mr. Jms ps dms for th hrm cusd to th com-p n upon succssful clim b th shrholdr plintiff. A scor of 0 is ssind if no; 1 if s. ƒ Whthr Mr. Jms rps profits md from th trnsction upon succssful clim b th shrholdr plintiff. A scor of 0 is ssind if no; 1 if s. ƒ Whthr both fins nd imprison-m nt cn b pplid inst Mr. Jms. A scor of 0 is ssind if no; 1 if s. ƒ Whthr shrholdr plintiffs r bl to su dirctl or drivtivl for th dm th trnsction cuss to th compn. A scor of 0 is s-si nd if suits r unvilbl or r vilbl onl for shrholdrs hold-in mor thn 10% of th compn’s shr cpitl; 1 if dirct or drivtiv suits r vilbl for shrholdrs holdin 10% of shr cpitl. Th indx rns from 0 to 10, with hihr vlus indictin rtr libilit of dirctors. Assumin tht th prjudi-ci l trnsction ws dul pprovd nd disclosd, in ordr to hold Mr. Jms li- bl in Pnm, for xmpl, plintiff must prov tht Mr. Jms influncd th pprovin bod or ctd nli- ntl ( scor of 1). To hold th othr dirctors libl, plintiff must prov tht th ctd nlintl ( scor of 1). Th prjudicil trnsction cnnot b voidd ( scor of 0). If Mr. Jms is found libl, h must p dms ( scor of 1) but h is not rquird to disor his profits ( scor of 0). Mr. Jms cnnot b find nd imprisond ( scor of 0). Dirct or drivtiv suits r vilbl for shrholdrs hold-in 10% of shr cpitl ( scor of 1). Addin ths numbrs ivs Pnm scor of 4 on th xtnt of dirctor libilit indx. Ease of shareholder suits index Th s of shrholdr suits indx hs 6 componnts: ƒ Wht rn of documnts is vil- bl to th shrholdr plintiff from th dfndnt nd witnsss durin tril. A scor of 1 is ssind for ch of th followin tps of documnts vilbl: informtion tht th dfndnt hs indictd h intnds to rl on for his d- fns; informtion tht dirctl provs spcific fcts in th plin-tiff’s clim; nd n informtion rlvnt to th subjct mttr of th clim. ƒ Whthr th plintiff cn dirctl xmin th dfndnt nd wit-n sss durin tril. A scor of 0 is ssind if no; 1 if s, with prior p-prov l of th qustions b th jud; 2 if s, without prior pprovl. ƒ Whthr th plintiff cn obtin ct- oris of rlvnt documnts from th dfndnt without idntifin ch documnt spcificll. A scor of 0 is ssind if no; 1 if s. ƒ Whthr shrholdrs ownin 10% of th compn’s shr cpitl hv th riht to inspct th trnsction documnts bfor filin suit or r- qust tht ovrnmnt inspctor invstit th Bur-Sllr trns- ction without filin suit. A scor of 0 is ssind if no; 1 if s.11 ƒ Whthr th stndrd of proof for civil suits is lowr thn tht for criminl cs. A scor of 0 is s-si nd if no; 1 if s. ƒ Whthr shrholdr plintiffs cn rcovr thir ll xpnss
  • 142.
    DATA NOTES 131 from th compn. A scor of 0 is ssind if no; 1 if plintiffs cn rcovr thir ll xpnss from th compn onl upon succss-ful outcom of thir ll ction or if pmnt of thir ttorn fs is continnt on succssful outcom; 2 if plintiffs cn rcovr thir ll xpnss from th com-p n rrdlss of th outcom of thir ll ction.12 Th indx rns from 0 to 10, with hihr vlus indictin rtr pow- rs of shrholdrs to chlln th trnsction. In Croti, for xmpl, th plintiff cn ccss documnts tht th dfndnt intnds to rl on for his dfns ( scor of 1). Th plin-tiff cn xmin th dfndnt nd witnsss durin tril, without prior pprovl of th qustions b th court ( scor of 2). Th plintiff must sp- cificll idntif th documnts bin souht (for xmpl, th Bur-Sllr purchs rmnt of Jul 15, 2006) nd cnnot simpl rqust ctoris (for xmpl, ll documnts rltd to th trnsction) ( scor of 0). A shrholdr holdin 10% of Bur’s shrs cn rqust tht ovrnmnt inspctor rviw suspctd mismn- mnt b Mr. Jms nd th CEO without filin suit in court ( scor of 1). Th stndrd of proof for civil suits is th sm s tht for criminl cs ( scor of 0). Th plintiff cn rcovr ll xpnss from th compn onl upon succssful outcom of th l- l ction ( scor of 1). Addin ths numbrs ivs Croti scor of 5 on th s of shrholdr suits indx. Extent of conflict of interest regulation index Th xtnt of conflict of intrst rultion indx is th sum of th xtnt of disclosur indx, th xtnt of dirctor libilit indx nd th s of shrholdr suits indx. Th indx is dividd b 3 so tht it rns from 0 to 10. Hihr vlus indict stronr rultion of conflicts of intrst. Shareholders’ rights in corporate governance Th xtnt of shrholdr ovrnnc indx msurs shrholdrs’ rihts in corport ovrnnc b distinuish-in 3 dimnsions of ood ovrnnc: shrholdrs’ rihts nd rol in mjor corport dcisions (xtnt of shr- holdr rihts indx), ovrnnc sf- urds protctin shrholdrs from undu bord control nd ntrnchmnt (strnth of ovrnnc structur indx) nd corport trnsprnc on ownrship stks, compnstion, udits nd finncil prospcts (xtnt of corport trnsprnc indx).13 Extent of shareholder rights index For ch componnt of th xtnt of shrholdr rihts indx, scor of 0 is ssind if th nswr is no; 1 if it is s; nd 1.5 if it would lso ppl if Bur wr privtl hld joint stock compn not listd on n stock x-ch n. Th indx hs 7 componnts: ƒ Whthr shrholdrs hv th riht to mnd Bur’s blws or sttuts with simpl mjorit. ƒ Whthr shrholdrs ownin 10% of Bur’s shr cpitl hv th riht to cll for n xtrordinr mtin of shrholdrs. ƒ Whthr shrholdrs hv th riht to rmov mmbrs of Bur’s bord of dirctors bfor th nd of thir trm. ƒ Whthr Bur must obtin its shrholdrs’ pprovl vr tim it issus nw shrs. ƒ Whthr shrholdrs r uto-m ticll rntd prmption or subscription rihts vr tim Bur issus nw shrs. ƒ Whthr shrholdrs r rquird b lw to pprov th lction nd dismissl of th xtrnl uditor. ƒ Whthr shrholdrs hv th riht to frl trd shrs prior to mjor corport ction or mtin of shrholdrs. Strength of governance structure index For ch componnt of th strnth of ovrnnc structur indx, scor of 0 is ssind if th nswr is no; 1 if it is s; nd 1.5 if it would lso p-pl if Bur wr privtl hld joint stock compn not listd on n stock xchn. Th indx hs 7 componnts: ƒ Whthr th CEO is brrd from lso bin chir of th bord of dirctors. ƒ Whthr th bord of dirctors must includ indpndnt bord mmbrs. ƒ Whthr Bur must hv sp- rt udit committ. ƒ Whthr chns to th votin rihts of sris or clss of shrs must b pprovd onl b th hold- rs of th ffctd shrs. ƒ Whthr potntil cquirr must mk tndr offr to ll shrhold- rs upon cquirin 50% of Bur. ƒ Whthr cross-shrholdin b- twn 2 indpndnt compnis is limitd to 10% of outstndin shrs. ƒ Whthr subsidir is brrd from cquirin shrs issud b its pr- nt compn. Extent of corporate transparency index For ch componnt of th xtnt of corport trnsprnc indx, scor of 0 is ssind if th nswr is no; 1 if it is s; nd 1.5 if it would lso ppl if Bur wr privtl hld joint stock compn not listd on n stock x-ch n. Th indx hs 6 componnts: ƒ Whthr Bur must disclos own- rship stks rprsntin 10%. ƒ Whthr Bur must disclos in-form tion bout bord mmbrs’ othr dirctorships s wll s bsic informtion on thir primr mplomnt. ƒ Whthr Bur must disclos th compnstion of individul mnrs. ƒ Whthr Bur must hv its n-nu l finncil sttmnts uditd b n xtrnl uditor.
  • 143.
    132 Doing Business2015 ƒƒWhether financial statements must contain explanatory notes on sig-nificant accounting policies, trends, risks, uncertainties and other fac-tors influencing the reporting. ƒƒWhether audit reports must be disclosed to the public. Extent of shareholder governance index The extent of shareholder governance index is the sum of the extent of shareholder rights index, the strength of governance structure index and the extent of corporate transparency index. The index is divided by 3 so that it ranges from 0 to 10. Higher values indicate stronger rights of shareholders in corporate governance. Strength of minority investor protection index The strength of minority investor protection index is the average of the extent of conflict of interest regulation index and the extent of shareholder governance index. The index ranges from 0 to 10, rounded to the near-est decimal place, with higher values indicating stronger minority investor protections. The data details on protecting minority investors can be found for each economy at http://www.doingbusiness.org. The initial methodology was developed by Djankov, La Porta and others (2008). The extent of shareholder governance index was introduced in Doing Business 2015. PAYING TAXES Doing Business records the taxes and mandatory contributions that a medium-size company must pay in a given year as well as measures of the administrative burden of paying taxes and contributions (figure 14.13). The project was developed and implemented in cooperation with PwC.14 Taxes and contributions measured include the profit or corporate income tax, social Figure 14.13 What are the time, total tax rate and number of payments necessary for a local medium-size company to pay all taxes? Total tax rate Time contributions and labor taxes paid by the employer, property taxes, prop-erty transfer taxes, dividend tax, capital gains tax, financial transactions tax, waste collection taxes, vehicle and road taxes, and any other small taxes or fees. The ranking of economies on the ease of paying taxes is determined by sort-ing their distance to frontier scores for paying taxes. These scores are the simple average of the distance to frontier scores for each of the compo-nent indicators (figure 14.14), with a threshold and a nonlinear transforma-tion applied to one of the component indicators, the total tax rate.15 The threshold is defined as the highest total tax rate among the top 15% of economies in the ranking on the total tax rate. It is calculated and adjusted on a yearly basis. This year’s threshold is 26.1%. All economies with a total tax rate below this threshold receive the same score as the economy at the threshold. The threshold is not based on any economic theory of an “optimal tax rate” that minimizes distortions or maximizes efficiency in an economy’s overall tax system. Instead, it is mainly empirical in nature, set at the lower end of the distribution of tax rates levied on medium-size enterprises in the manufacturing sector as observed through the paying taxes indicators. To prepare, file and pay value added or sales tax, profit tax and labor taxes and contributions Rankings are based on distance to frontier scores for 3 indicators 33.3% Time 33.3% Total tax rate 33.3% Payments This reduces the bias in the total tax rate indicator toward economies that do not need to levy significant taxes on companies like the Doing Business standardized case study company be-cause they raise public revenue in other ways—for example, through taxes on foreign companies, through taxes on sectors other than manufacturing or from natural resources (all of which are outside the scope of the methodology). Doing Business measures all taxes and contributions that are government Number of payments (per year) Hours per year % of profit before all taxes Figure 14.14 Paying taxes: tax compliance for a local manufacturing company Number of hours per year to prepare, file returns and pay taxes Firm tax liability as % of profits before all taxes borne Number of tax payments per year Note: All economies below the threshold receive the same score in the total tax rate component as the economies at the threshold.
  • 144.
    DATA NOTES 133 mndtd (t n lvl—fdrl, stt or locl) nd tht ppl to th stndrd-i d businss nd hv n impct in its finncil sttmnts. In doin so, Doin Businss os bond th trditionl dfinition of tx. As dfind for th purposs of ovrnmnt ntionl c-counts, txs includ onl compulsor, unrquitd pmnts to nrl ov- rnmnt. Doin Businss dprts from this dfinition bcus it msurs imposd chrs tht ffct businss ccounts, not ovrnmnt ccounts. On min diffrnc rlts to lbor contributions. Th Doin Businss m- sur includs ovrnmnt-mndtd contributions pid b th mplor to rquitd privt pnsion fund or workrs’ insurnc fund. It includs, for xmpl, Austrli’s compulsor suprnnution urnt nd work- rs’ compnstion insurnc. For th purpos of clcultin th totl tx rt (dfind blow), onl txs born r includd. For xmpl, vlu ddd txs r nrll xcludd (providd tht th r not irrcovrbl) bcus th do not ffct th ccountin prof-its of th businss—tht is, th r not rflctd in th incom sttmnt. Th r, howvr, includd for th purpos of th complinc msurs (tim nd pmnts), s th dd to th burdn of complin with th tx sstm. Doin Businss uss cs scnrio to msur th txs nd contributions pid b stndrdid businss nd th complxit of n conom’s tx complinc sstm. This cs scnrio uss st of finncil sttmnts nd ssumptions bout trnsctions md ovr th cours of th r. In ch conom tx xprts from numbr of diffrnt firms (in mn conomis ths includ PwC) comput th txs nd mndtor contributions du in thir jurisdiction bsd on th stn-d rdid cs stud fcts. Informtion is lso compild on th frqunc of filin nd pmnts s wll s th tim tkn to compl with tx lws in n conom. To mk th dt comprbl cross conomis, svrl ssumptions bout th businss nd th txs nd contributions r usd. Th mthodolo for th pin txs indictors hs bnfitd from discus-sion with mmbrs of th Intrntionl Tx Dilou nd othr stkholdrs. This hs ld to rfinmnt of th qustions on th tim to p txs, th collction of dditionl dt on th l- bor tx wd for furthr rsrch nd th introduction of thrshold pplid to th totl tx rt for th purpos of clcultin th rnkin on th s of pin txs. Assumptions about the business Th businss: ƒ Is limitd libilit, txbl com-p n. If thr is mor thn on tp of limitd libilit compn in th conom, th limitd libilit form most common mon domstic firms is chosn. Th most common form is rportd b incorportion lwrs or th sttisticl offic. ƒ Strtd oprtions on Jnur 1, 2012. At tht tim th compn purchsd ll th ssts shown in its blnc sht nd hird ll its workrs. ƒ Oprts in th conom’s lrst businss cit. For 11 conomis th dt r lso collctd for th scond lrst businss cit (s tbl 14A.1). ƒ Is 100% domsticll ownd nd hs 5 ownrs, ll of whom r nturl prsons. ƒ At th nd of 2012, hs strt-up cpitl of 102 tims incom pr cpit. ƒ Prforms nrl industril or commrcil ctivitis. Spcificll, it producs crmic flowrpots nd slls thm t rtil. It dos not prticipt in forin trd (no im-port or xport) nd dos not hndl products subjct to spcil tx r- im, for xmpl, liquor or tobcco. ƒ At th binnin of 2013, owns 2 plots of lnd, 1 buildin, mchinr, offic quipmnt, computrs nd 1 truck nd lss 1 truck. ƒ Dos not qulif for invstmnt in-c ntivs or n bnfits prt from thos rltd to th or si of th compn. ƒ Hs 60 mplos—4 mnrs, 8 ssistnts nd 48 workrs. All r ntionls, nd 1 mnr is lso n ownr. Th compn ps for d-dition l mdicl insurnc for m-plo s (not mndtd b n lw) s n dditionl bnfit. In ddition, in som conomis rimbursbl businss trvl nd clint ntr-t inmnt xpnss r considrd frin bnfits. Whn pplicbl, it is ssumd tht th compn ps th frin bnfit tx on this x-p ns or tht th bnfit bcoms txbl incom for th mplo. Th cs stud ssums no d-dition l slr dditions for mls, trnsporttion, duction or othrs. Thrfor, vn whn such bnfits r frqunt, th r not ddd to or rmovd from th txbl ross slris to rriv t th lbor tx or contribution clcultion. ƒ Hs turnovr of 1,050 tims in-com pr cpit. ƒ Mks loss in th first r of oprtion. ƒ Hs ross mrin (prtx) of 20% (tht is, sls r 120% of th cost of oods sold). ƒ Distributs 50% of its nt profits s dividnds to th ownrs t th nd of th scond r. ƒ Slls on of its plots of lnd t profit t th binnin of th scond r. ƒ Is subjct to sris of dtild ssumptions on xpnss nd trnsctions to furthr stndrdi th cs. All finncil sttmnt vribls r proportionl to 2012 incom pr cpit (this is n updt from prvious rs, whn th vribls wr proportionl to 2005 incom pr cpit). For xmpl, th ownr who is lso mnr spnds 10% of incom pr cpit
  • 145.
    134 DOING BUSINESS2015 on trvlin for th compn (20% of this ownr’s xpnss r purl privt, 20% r for ntrtinin customrs, nd 60% r for busi-n ss trvl). Assumptions about the taxes and contributions ƒ All th txs nd contributions rcordd r thos pid in th scond r of oprtion (clndr r 2013). A tx or contribution is considrd distinct if it hs diffrnt nm or is collctd b diffrnt nc. Txs nd contri-butions with th sm nm nd nc, but chrd t diffrnt rts dpndin on th businss, r countd s th sm tx or contribution. ƒ Th numbr of tims th compn ps txs nd contributions in r is th numbr of diffrnt txs or contributions multiplid b th frqunc of pmnt (or withhold-in ) for ch tx. Th frqunc of pmnt includs dvnc p- mnts (or withholdin) s wll s rulr pmnts (or withholdin). Tax payments Th tx pmnts indictor rflcts th totl numbr of txs nd con-tributions pid, th mthod of p- mnt, th frqunc of pmnt, th frqunc of filin nd th numbr of ncis involvd for th stndrd-i d cs stud compn durin th scond r of oprtion (tbl 14.9). It includs txs withhld b th com-p n, such s sls tx, vlu ddd tx nd mplo-born lbor txs. Ths txs r trditionll collctd b th compn from th consumr or mplo on bhlf of th tx ncis. Althouh th do not ffct th incom sttmnts of th compn, th dd to th dministrtiv burdn of com-pl in with th tx sstm nd so r includd in th tx pmnts msur. Th numbr of pmnts tks into ccount lctronic filin. Whr full lctronic filin nd pmnt is llowd nd it is usd b th mjorit of mdi-um- si businsss, th tx is countd s pid onc r vn if filins nd pmnts r mor frqunt. For p- mnts md throuh third prtis, such s tx on intrst pid b finncil institution or ful tx pid b ful dis-tributor, onl on pmnt is includd vn if pmnts r mor frqunt. Whr 2 or mor txs or contributions r fild for nd pid jointl usin th sm form, ch of ths joint p- mnts is countd onc. For xmpl, if mndtor hlth insurnc contribu-tions nd mndtor pnsion contri-butions r fild for nd pid tothr, onl on of ths contributions would b includd in th numbr of pmnts. Time Tim is rcordd in hours pr r. Th indictor msurs th tim tkn to prpr, fil nd p 3 mjor tps of txs nd contributions: th corport incom tx, vlu ddd or sls tx, nd lbor txs, includin proll txs nd socil contributions. Prprtion tim includs th tim to collct ll informtion ncssr to comput th tx pbl nd to clcult th mount pbl. If sprt c-countin books must b kpt for tx purposs—or sprt clcultions md—th tim ssocitd with ths procsss is includd. This xtr tim is includd onl if th rulr ccount-in work is not nouh to fulfill th tx ccountin rquirmnts. Filin tim includs th tim to complt ll ncssr tx rturn forms nd fil th rlvnt rturns t th tx uthor-it . Pmnt tim considrs th hours ndd to mk th pmnt onlin or in prson. Whr txs nd contri-butions r pid in prson, th tim includs dls whil witin. Total tax rate Th totl tx rt msurs th mount of txs nd mndtor con-tributions born b th businss in th scond r of oprtion, xprssd s shr of commrcil profit. Doin Businss 2015 rports th totl tx rt for clndr r 2013. Th totl mount of txs born is th sum of ll th diffrnt txs nd contributions pbl ftr ccountin for llowbl dductions nd xmptions. Th txs withhld (such s prsonl incom tx) or collctd b th compn nd rmit-t d to th tx uthoritis (such s vlu ddd tx, sls tx or oods nd sr-vic tx) but not born b th compn r xcludd. Th txs includd cn b dividd into 5 ctoris: profit or cor-por t incom tx, socil contributions nd lbor txs pid b th mplor (for which ll mndtor contributions r includd, vn if pid to privt ntit such s rquitd pnsion fund), proprt txs, turnovr txs nd othr txs (such s municipl fs nd vhicl txs). Ful txs r no lonr includd in th totl tx rt bcus of th difficult of computin ths txs in consistnt w for ll conomis covrd. Th ful tx mounts r in TABLE 14.9 Wht do th pin† txs indictors msur? T­x p­‡m nts for ­ m­nuf­cturin comp­n‡ in 2013 (numb r p r ‡ ­r ­djust d for l ctronic ­nd joint filin ­nd p­‡m nt) Totl numbr of txs nd contributions pid, includin consumption txs (vlu ddd tx, sls tx or oods nd srvic tx) Mthod nd frqunc of filin nd pmnt Tim r quir d to compl‡ with 3 m­jor t­x s (hours p r ‡ ­r) Collctin informtion nd computin th tx pbl Compltin tx rturn forms, filin with propr ncis Arrnin pmnt or withholdin Prprin sprt mndtor tx ccountin books, if rquird Tot­l t­x r­t (% of profit b for ­ll t­x s) Profit or corport incom tx Socil contributions nd lbor txs pid b th mplor Proprt nd proprt trnsfr txs Dividnd, cpitl ins nd finncil trnsctions txs Wst collction, vhicl, rod nd othr txs
  • 146.
    DATA NOTES 135 most css vr smll, nd msurin ths mounts is oftn complictd bcus th dpnd on ful consump-tion. Ful txs continu to b countd in th numbr of pmnts. Th totl tx rt is dsind to pro-vid comprhnsiv msur of th cost of ll th txs businss brs. It diffrs from th sttutor tx rt, which mrl provids th fctor to b pplid to th tx bs. In computin th totl tx rt, th ctul tx p- bl is dividd b commrcil profit. Dt for Kiribti r providd s n xmpl (tbl 14.10). Commrcil profit is ssntill nt profit bfor ll txs born. It diffrs from th convntionl profit bfor tx, rportd in finncil sttmnts. In computin profit bfor tx, mn of th txs born b firm r dductibl. In computin commrcil profit, ths txs r not dductibl. Commrcil profit thrfor prsnts clr pictur of th ctul profit of businss bfor n of th txs it brs in th cours of th fiscl r. Commrcil profit is computd s sls minus cost of oods sold, minus ross slris, minus dministrtiv xpnss, minus othr xpnss, minus provisions, plus cpitl ins (from th proprt sl) minus intrst xpns, plus intrst incom nd minus com-m rcil dprcition. To comput th commrcil dprcition, striht-lin dprcition mthod is pplid, with th followin rts: 0% for th lnd, 5% for th buildin, 10% for th mchinr, 33% for th computrs, 20% for th offic quipmnt, 20% for th truck nd 10% for businss dvl-opm nt xpnss. Commrcil profit mounts to 59.4 tims incom pr cpit. Th mthodolo for clcultin th totl tx rt is brodl consistnt with th Totl Tx Contribution frm- work dvlopd b PwC nd th clcu-l tion within this frmwork for txs born. But whil th work undrtkn b PwC is usull bsd on dt r- civd from th lrst compnis in th conom, Doin Businss focuss on cs stud for stndrdid mdium-si compn. Th d t dt ils on p in t xs c n b found for ch conom t http://www .doinbusinss.or. This mthodolo w s dvlopd b Dj nkov nd othrs (2010). TRADING ACROSS BORDERS Doin Businss msurs th tim nd cost (xcludin triffs) ssocitd with xportin nd importin stndrd-i d cro of oods b s trnsport. Th tim nd cost ncssr to com-pl t 4 prdfind sts (documnt prprtion; customs clrnc nd inspctions; inlnd trnsport nd hn-dlin ; nd port nd trminl hndlin) for xportin nd importin th oods r rcordd; howvr, th tim nd cost for s trnsport r not includd. All docu-m nts ndd b th trdr to xport or import th oods cross th bordr r lso rcordd. Th procss of xportin oods rns from pckin th oods into th continr t th wrhous to thir dprtur from th port of xit. Th procss of importin oods rns from th vssl’s rrivl t th port of ntr to th cro’s dlivr t th wrhous. For lndlockd conomis, sinc th sport is loctd in th trnsit conom, th tim, cost nd documnts ssocitd with th procsss t th inlnd bordr r lso includd. It is ssumd tht th pmnt is md b lttr of crdit, nd th tim, cost nd documnts rquird for th issunc or dvisin of lttr of crdit r tkn into ccount (fiur 14.15). Th rnkin of conomis on th s of trdin cross bordrs is dtrmind b sortin thir distnc to frontir scors for trdin cross bordrs. Ths scors r th simpl vr of th distnc to frontir scors for ch of th com-pon nt indictors (fiur 14.16). Locl friht forwrdrs, shippin lins, customs brokrs, port officils nd bnks provid informtion on rquird documnts, cost nd tim to xport nd import. To mk th dt comprbl cross conomis, svrl ssumptions bout th businss nd th trdd oods r usd. Assumptions about the traded goods Th trdd product trvls in dr- cro, 20-foot, full continr lod.16 It wihs 10 tons nd is vlud t $20,000. Th product: ƒ Is not hrdous nor dos it includ militr itms. ƒ Dos not rquir rfrirtion or n othr spcil nvironmnt. TABLE 14.10 Computin† th totl tx rt for Kiribti T‡p of t­x (t­x b­s ) St­tutor‡ r­t r (%) St­tutor‡ t­x b­s b ($A) Actu­l t­x p­‡­bl = r × b ($A) Comm rci­l profit* c ($A) Tot­l t­x r­t t = /c (%) Corport incom tx (txbl incom) 20.0–35.0 109,381 33,283 137,156 24.3 Emplor-pid socil scurit contributions (txbl ws) 7.5 154,711 11,603 137,156 8.5 Tot­l 44,886 32.7 * Profit bfor ll txs born. Not: Commrcil profit is ssumd to b 59.4 tims incom pr cpit. $A is Austrlin dollr. Sourc: Doin Businss dtbs.
  • 147.
    136 Doing Business2015 Rankings are based on distance to frontier scores for 3 indicators 33.3% Documents to export and import 33.3% Time to export and import 33.3% Cost to export and import ƒƒ Does not require any special phy-tosanitary or environmental safety standards other than accepted international standards. ƒƒ Is one of the economy’s leading export or import products. Assumptions about the business The business: ƒƒ Is located in the economy’s largest business city. For 11 economies the data are also collected for the sec-ond largest business city (see table 14A.1). ƒƒ Is a private, limited liability company. ƒƒ Does not operate in an export processing zone or an industrial estate with special export or import privileges. ƒƒ Conducts export and import ac-tivities but does not have any special accreditation, such as an authorized economic operator status. ƒƒ Is 100% domestically owned. Documents It is assumed that a new contract is drafted per shipment and that the contract has already been agreed upon and executed by both parties. All documents required by law or common practice by relevant agencies—includ-ing government ministries, customs authorities, port authorities and other control agencies—per export and im-port shipment are taken into account (table 14.11). For landlocked economies, documents required by authorities in the transit economy are also included. Since payment is by letter of credit, all documents required by banks for the issuance or securing of a letter of credit are also taken into account. Documents that are requested at the time of clearance but that are valid for a year or longer or do not require renewal per shipment (for example, an annual tax clearance certificate) are not included. Documents that are required by customs authorities purely for purposes of preferential treatment but are not required for any other purpose by any of the authorities in the process of trading are not included. For example, if a certificate of origin is only presented to qualify for a preferential tariff rate under trade agreements, the document is not counted. It is assumed that the exporter will always obtain a certificate of origin for its trade partner, and the time and cost associated with obtaining this certificate are therefore included in the time and cost of docu-ment preparation to export. Time The time for exporting and importing is recorded in calendar days. The time calculation for each of the 4 predefined stages starts from the moment the stage is initiated and runs until it is completed. Fast-track procedures applying only to firms located in an export processing zone, or only to cer-tain accredited firms under authorized economic operator programs, are not taken into account because they are not available to all trading companies. Sea transport time is not included. It is assumed that neither the exporter nor the importer wastes time and that each commits to completing the process without delay. It is assumed that document preparation, inland transport and handling, customs clear-ance and inspections, and port and terminal handling require a minimum time of 1 day each and cannot take place simultaneously. The waiting time that occurs in practice—for example, in queues to obtain a service or during the moving of the cargo at the seaport—is included in the measure. Cost Cost measures the fees levied on a 20-foot container in U.S. dollars. All fees charged by government agencies and the private sector to a trader in the process of exporting and importing the goods are taken into account. These include but are not limited to costs Figure 14.15 How much time, how many documents and what cost to export and import by sea transport? Full, 20-foot container To export Time Cost Documents Time Cost Documents To import Import Export Port and terminal handling Customs and border agencies Inland transport Figure 14.16 Trading across borders: exporting and importing by sea transport All documents required by customs and other agencies Document preparation, customs clearance and inspections, port and terminal handling, inland transport and handling US$ per 20-foot container, no bribes or tariffs included
  • 148.
    Data Notes 137 for documents, administrative fees for customs clearance and inspections, customs broker fees, port-related charges and inland transport costs. The exporter is responsible for the incurred costs related to exporting the goods until they depart from the exporting economy, and the importer is responsible for the incurred costs related to importing from the moment the goods arrive at the seaport in the importing economy. The cost does not include customs tariffs and duties or costs related to sea transport. Only official costs are recorded. The data details on trading across borders can be found for each economy at http:// www.doingbusiness.org. This methodology was developed by Djankov, Freund and Pham (2010) and is adopted here with minor changes. ENFORCING CONTRACTS Indicators on enforcing contracts measure the efficiency of the judicial system in resolving a commercial dispute. The data are built by following the step-by-step evolution of a com-mercial sale dispute before local courts (figure 14.17). The data are collected through study of the codes of civil procedure and other court regulations as well as questionnaires completed by local litigation lawyers and judges. The ranking of economies on the ease of enforcing contracts is determined by sorting their distance to frontier scores for enforcing contracts. These scores are the simple average of the distance to frontier scores for each of the com-ponent indicators (figure 14.18). The name of the relevant court in each economy—the court in the largest business city with jurisdiction over the standardized commercial dispute described below—is published at http://www.doingbusiness.org/data /exploretopics/enforcing-contracts. For 11 economies for which the data are also collected for the second largest business city, the name of the relevant court in that city is given as well. Assumptions about the case ƒƒ The value of the claim is equal to 200% of the economy’s income per capita or $5,000, whichever is greater.17 ƒƒ The dispute concerns a lawful transaction between 2 businesses (Seller and Buyer), both located in the economy’s largest business city. For 11 economies the data are also collected for the second larg-est business city (see table 14A.1). Pursuant to a contract between the businesses, Seller sells some custom-made furniture to Buyer worth 200% of the economy’s in-come per capita or $5,000, which-ever is greater. After Seller delivers the goods to Buyer, Buyer refuses to pay the contract price, alleging that the goods are not of adequate quality. Because they were custom-made, Seller is unable to sell them to anyone else. ƒƒ Seller (the plaintiff) sues Buyer (the defendant) to recover the amount under the sales agreement. The dispute is brought before the court located in the economy’s largest business city with jurisdiction over commercial cases worth 200% of income per capita or $5,000, whichever is greater. As noted, for 11 economies the data are also Figure 14.17 What are the time, cost and number of procedures to resolve a commercial dispute through the courts? Court Filing service Trial judgment Enforcement Company A (seller plaintiff) Company B (buyer defendant) Time Cost Number of procedures Commercial dispute Figure 14.18 Enforcing contracts: resolving a commercial dispute through the courts Rankings are based on distance to frontier scores for 3 indicators Attorney, court and enforcement costs as % of claim value Days to resolve commercial sale dispute through the courts 33.3% Time 33.3% Cost 33.3% Procedures Steps to file claim, obtain judgment and enforce it TABLE 14.11 What do the trading across borders indicators measure? Documents required to export and import (number) Bank documents Customs clearance documents Port and terminal handling documents Transport documents Time required to export and import (days) Obtaining, filling out and submitting all the documents Inland transport and handling Customs clearance and inspections Port and terminal handling Does not include sea transport time Cost required to export and import (US$ per container) All documentation Inland transport and handling Customs clearance and inspections Port and terminal handling Official costs only, no bribes
  • 149.
    138 DOING BUSINESS2015 collctd for th scond lrst businss cit (s tbl 14A.1). ƒ At th outst of th disput, Sllr dcids to ttch Bur’s movbl ssts (for xmpl, offic quip-m nt nd vhicls) bcus Sllr frs tht Bur m hid its ssts or othrwis bcom insolvnt. ƒ Th clim is disputd on th mrits bcus of Bur’s lltion tht th qulit of th oods ws not dqut. Bcus th court cn-not dcid th cs on th bsis of documntr vidnc or ll titl lon, n xprt opinion is ivn on th qulit of th oods. If it is stn-d rd prctic in th conom for ch prt to cll its own xprt wit-n ss, th prtis ch cll on xprt witnss. If it is stndrd prctic for th jud to ppoint n indpndnt xprt, th jud dos so. In this cs th jud dos not llow opposin xprt tstimon. ƒ Followin th xprt opinion, th jud dcids tht th oods d- livrd b Sllr wr of dqut qulit nd tht Bur must p th contrct pric. Th jud thus rndrs finl judmnt tht is 100% in fvor of Sllr. ƒ Bur dos not ppl th jud- mnt. Sllr dcids to strt nforc-in th judmnt s soon s th tim lloctd b lw for ppl lpss. ƒ Sllr tks ll rquird stps for prompt nforcmnt of th jud- mnt. Th mon is succssfull collctd throuh public sl of Bur’s movbl ssts (for xm-pl , offic quipmnt nd vhicls). Procedures Th list of procdurl stps compild for ch conom trcs th chronol-o of commrcil disput bfor th rlvnt court. A procdur is dfind s n intrction, rquird b lw or com-monl crrid out in prctic, btwn th prtis or btwn thm nd th jud or court officr. Othr procdurl stps, intrnl to th court or btwn th prtis nd thir counsl, m b countd s wll. Procdurl stps includ stps to fil nd srv th cs, stps to ssin th cs to jud, stps for tril nd judmnt nd stps ncssr to nforc th judmnt (tbl 14.12). To indict ovrll fficinc, 1 proc- dur is subtrctd from th totl num-b r for conomis tht hv spcilid commrcil courts or divisions, nd 1 procdur for conomis tht llow lctronic filin of th initil complint. Som procdurl stps tht r prt of othrs r not countd in th totl numbr of procdurs. Time Tim is rcordd in clndr ds, countd from th momnt th plintiff dcids to fil th lwsuit in court until pmnt. This includs both th ds whn ctions tk plc nd th witin priods in btwn. Th vr durtion of 3 diffrnt sts of disput rsolution is rcordd: th compltion of srvic of procss (tim to fil nd srv th cs), th issu- nc of judmnt (tim for tril nd to obtin th judmnt) nd th rcovr of th clim vlu throuh public sl (tim for nforcmnt of th judmnt). Cost Cost is rcordd s prcnt of th clim, ssumd to b quivlnt to 200% of incom pr cpit or $5,000, whichvr is rtr. Thr tps of costs r rcordd: court costs, nforc- mnt costs nd vr ttorn fs. Court costs includ ll costs tht Sllr (plintiff) must dvnc to th court, rrdlss of th finl cost born b Sllr. Enforcmnt costs r ll costs tht Sllr (plintiff) must dvnc to nforc th judmnt throuh public sl of Bur’s movbl ssts, rrd-l ss of th finl cost born b Sllr. Avr ttorn fs r th fs tht Sllr (plintiff) must dvnc to lo-c l ttorn to rprsnt Sllr in th stndrdid cs. Bribs r not tkn into ccount. Th d t dt ils on nforcin contr cts c n b found for ch conom t http://www .doinbusinss.or. This mthodolo w s dvlopd b Dj nkov nd othrs (2003) nd is doptd hr with minor ch ns. RESOLVING INSOLVENCY Doin Businss studis th tim, cost nd outcom of insolvnc procdins involvin domstic ntitis. In ddition, this r it introducs nw msur, th strnth of insolvnc frmwork indx, vlutin th dquc nd intrit of th ll frmwork ppli-c bl to liquidtion nd rornition procdins. Th dt for th rsolvin insolvnc indictors r drivd from qustionnir rsponss b locl insol-v nc prctitionrs nd vrifid throuh stud of lws nd rultions s wll s public informtion on bnkruptc sstms. Th rnkin of conomis on th s of rsolvin insolvnc is dtrmind b sortin thir distnc to frontir scors for rsolvin insolvnc. Ths scors r th simpl vr of th distnc to frontir scors for th rcovr rt nd th strnth of insol-v nc frmwork indx (fiur 14.19). TABLE 14.12 Wht do th nforcin† contrcts indictors msur? Proc dur s to nforc ­ contr­ct throuh th courts (numb r) Stps to fil nd srv th cs Stps for tril nd judmnt Stps to nforc th judmnt Tim r quir d to compl t proc dur s (c­l nd­r d­‡s) Tim to fil nd srv th cs Tim for tril nd to obtin th judmnt Tim to nforc th judmnt Cost r quir d to compl t proc dur s (% of cl­im) Avr ttorn fs Court costs Enforcmnt costs
  • 150.
    DATA NOTES 139 Rankings are based on distance to frontier scores for 2 indicators Debt recovery in insolvency To mk th dt on th tim, cost nd outcom of insolvnc procdins comprbl cross conomis, svrl ssumptions bout th businss nd th cs r usd. Assumptions bout th businss Th businss: ƒ Is limitd libilit compn. ƒ Oprts in th conom’s lrst businss cit. For 11 conomis th dt r lso collctd for th sc-ond lrst businss cit (s tbl 14A.1). ƒ Is 100% domsticll ownd, with th foundr, who is lso chirmn of th suprvisor bord, ownin 51% (no othr shrholdr holds mor thn 5% of shrs). ƒ Hs downtown rl stt, whr it runs hotl, s its mjor sst. ƒ Hs profssionl nrl mnr. ƒ Hs 201 mplos nd 50 suppli- rs, ch of which is owd mon for th lst dlivr. ƒ Hs 10-r lon rmnt with domstic bnk scurd b mort ovr th hotl’s rl s-t t proprt. A univrsl businss chr (n ntrpris chr) is lso ssumd in conomis whr such colltrl is rconid. If th lws of th conom do not spcificll provid for n ntrpris chr but contrcts commonl us som othr provision to tht ffct, this provision is spcifid in th lon rmnt. ƒ Hs obsrvd th pmnt schdul nd ll othr conditions of th lon up to now. ƒ Hs mrkt vlu, oprtin s oin concrn, of 100 tims incom pr cpit or $200,000, whichvr is rtr. Th mrkt vlu of th compn’s ssts, if sold picml, is 70% of th mrkt vlu of th businss. Assumptions bout th cs Th businss is xprincin liquidit problms. Th compn’s loss in 2013 rducd its nt worth to ntiv fiur. It is Jnur 1, 2014. Thr is no csh to p th bnk intrst or prin-cip l in full, du th nxt d, Jnur 2. Th businss will thrfor dfult on its lon. Mnmnt blivs tht losss will b incurrd in 2014 nd 2015 s wll. But it xpcts 2014 csh flow to covr ll oprtin xpnss, includin supplir pmnts, slris, mintnnc costs nd txs, thouh not principl or intrst pmnts to th bnk. Th mount outstndin undr th lon rmnt is xctl qul to th mrkt vlu of th hotl businss nd rprsnts 74% of th compn’s totl dbt. Th othr 26% of its dbt is hld b unscurd crditors (supplirs, mplos, tx uthoritis). Th compn hs too mn crditors to notit n informl out-of-court workout. Th followin options r vilbl: judicil procdur imd t th rhbilittion or rornition of th compn to prmit its continud oprtion; judicil procdur imd t th liquidtion or windin-up of th compn; or dbt nforcmnt procdur (forclosur or rcivrship) inst th compn. Assumptions bout th prtis Th bnk wnts to rcovr s much s possibl of its lon, s quickl nd chpl s possibl. Th unscurd crditors will do vrthin prmittd undr th pplicbl lws to void picml sl of th ssts. Th mjorit shrholdr wnts to kp th compn oprtin nd undr his control. Mnmnt wnts to kp th compn oprtin nd prsrv its mplos’ jobs. All th prtis r locl ntitis or citins; no forin prtis r involvd. Tim Tim for crditors to rcovr thir crdit is rcordd in clndr rs (tbl 14.13). Th priod of tim m- surd b Doin Businss is from th compn’s dfult until th pmnt of som or ll of th mon owd to th bnk. Potntil dl tctics b th FIGURE 14.19 Rsolvin† insolvnc: rcovr rt nd strn†th of insolvnc frmwork 50% Recovery rate 50% Strength of insolvency framework index TABLE 14.13 Wht do th indictors on dbt rcovr in insolvnc msur? Tim r quir d to r cov r d bt (‡ ­rs) Msurd in clndr rs Appls nd rqusts for xtnsion r includd Cost r quir d to r cov r d bt (% of d btor’s st­t ) Msurd s prcnt of stt vlu Court fs Fs of insolvnc dministrtors Lwrs’ fs Assssors’ nd uctionrs’ fs Othr rltd fs Outcom Whthr th businss continus oprtin s oin concrn or whthr its ssts r sold picml R cov r‡ r­t for s cur d cr ditors (c nts on th doll­r) Msurs th cnts on th dollr rcovrd b scurd crditors Prsnt vlu of dbt rcovrd Officil costs of th insolvnc procdins r dductd Dprcition of furnitur is tkn into ccount Outcom for th businss (survivl or not) ffcts th mximum vlu tht cn b rcovrd
  • 151.
    140 DOING BUSINESS2015 Time Cost Outcome prtis, such s th filin of diltor ppls or rqusts for xtnsion, r tkn into considrtion. Cost Th cost of th procdins is r- cordd s prcnt of th vlu of th dbtor’s stt. Th cost is cl-cul td on th bsis of qustionnir rsponss nd includs court fs nd ovrnmnt lvis; fs of insolvnc dministrtors, uctionrs, sss-sors nd lwrs; nd ll othr fs nd costs. Outcome Rcovr b crditors dpnds on whthr th hotl businss mrs from th procdins s oin concrn or th compn’s ssts r sold picml. If th businss kps oprtin, 100% of th hotl vlu is prsrvd. If th ssts r sold pic- ml, th mximum mount tht cn b rcovrd is 70% of th vlu of th hotl. Recovery rate Th rcovr rt is rcordd s cnts on th dollr rcoupd b scurd crditors throuh rornition, liquidtion or dbt nforcmnt (for- closur or rcivrship) procdins (fiur 14.20). Th clcultion tks into ccount th outcom: whthr th businss mrs from th procdins s oin concrn or th ssts r sold picml. Thn th costs of th procdins r dductd (1 cnt for ch prcnt point of th vlu of th dbtor’s stt). Finll, th vlu lost s rsult of th tim th mon rmins tid up in insolvnc procd-in s is tkn into ccount, includin th loss of vlu du to dprcition of th hotl furnitur. Consistnt with intrntionl ccountin prctic, th nnul dprcition rt for furnitur is tkn to b 20%. Th furnitur is s-sum d to ccount for qurtr of th totl vlu of ssts. Th rcovr rt is th prsnt vlu of th rminin procds, bsd on nd-2013 lndin rts from th Intrntionl Montr Fund’s Intrn tion l Fin nci l St tistics, supplmntd with dt from cntrl bnks nd th Economist Intllinc Unit. If n conom hd ro css r ovr th pst 5 rs involvin judi-ci l rornition, judicil liquidtion or dbt nforcmnt procdur (for- closur or rcivrship), th conom rcivs “no prctic” mrk on th tim, cost nd outcom indictors. This mns tht crditors r unlikl to rcovr thir mon throuh forml ll procss. Th rcovr rt for “no prctic” conomis is ro. In ddi-tion, “no prctic” conom rcivs scor of 0 on th strnth of insol-v nc frmwork indx vn if its ll frmwork includs provisions rltd to insolvnc procdins (liquidtion or rornition). Strength of insolvency framework Th strnth of insolvnc frmwork indx is bsd on 4 othr indics: commncmnt of procdins indx, mnmnt of dbtor’s ssts indx, rornition procdins indx nd crditor prticiption indx (fiur 14.21; tbl 14.14). Commencement of proceedings index Th commncmnt of procdins indx hs 3 componnts: ƒ Whthr dbtors cn initit both liquidtion nd rornition pro-c dins. A scor of 1 is ssind if dbtors cn initit both tps of procdins; 0.5 if th cn initi- t onl on of ths tps (ithr liquidtion or rornition); 0 if th cnnot initit insolvnc procdins. ƒ Whthr crditors cn initit both liquidtion nd rornition pro-c dins. A scor of 1 is ssind if crditors cn initit both tps of procdins; 0.5 if th cn initi- t onl on of ths tps (ithr liquidtion or rornition); 0 if th cnnot initit insolvnc procdins. ƒ Wht stndrd is usd for com-m ncmnt of insolvnc procd-in s. A scor of 1 is ssind if liquidit tst (th dbtor is nr- ll unbl to p its dbts s th FIGURE 14.20 Rcovr rt is function of th tim, cost nd outcom of insolvnc procdin†s †inst locl compn Secured creditor with unpaid claim Recovery rate Reorganization, liquidation or foreclosure proceedings FIGURE 14.21 Strn†th of insolvnc frmwork indx msurs th qulit of insolvnc lws tht †ovrn rltions btwn dbtors, crditors nd th court Management of debtor’s assets index Commencement of proceedings index Reorganization proceedings index Creditor participation index Court Creditors Debtor
  • 152.
    DATA NOTES 141 mtur) is usd; 0.5 if th blnc sht tst (th libilitis of th dbtor xcd its ssts) is usd; 1 if both th liquidit nd blnc sht tsts r vilbl but onl on is rquird to initit insolvnc procdins; 0.5 if both tsts r rquird; 0 if diffrnt tst is usd. Th indx rns from 0 to 3, with hihr vlus indictin rtr ccss to insolvnc procdins. In Bulri, for xmpl, dbtors cn initit both liquidtion nd rornition procd-in s ( scor of 1), s cn crditors ( scor of 1). Th stndrd for commnc-in insolvnc procdins is tht th dbtor cnnot p its dbts s th mtur ( scor of 1). Addin ths numbrs ivs Bulri scor of 3 on th commncmnt of procdins indx. Management of debtor’s assets index Th mnmnt of dbtor’s ssts indx hs 6 componnts: ƒ Whthr th dbtor (or n insol-v nc rprsnttiv on its bhlf) cn continu prformin contrcts ssntil to th dbtor’s survivl. A scor of 1 is ssind if s; 0 if continution of contrcts is not possibl or if th lw contins no provisions on this subjct. ƒ Whthr th dbtor (or n insolvn-c rprsnttiv on its bhlf) cn rjct ovrl burdnsom contrcts. A scor of 1 is ssind if s; 0 if r- jction of contrcts is not possibl. ƒ Whthr trnsctions ntrd into bfor commncmnt of insolvn-c procdins tht iv prfrnc to on or svrl crditors cn b voidd ftr procdins r initi- td. A scor of 1 is ssind if s; 0 if voidnc of such trnsctions is not possibl. ƒ Whthr undrvlud trnsctions ntrd into bfor commncmnt of insolvnc procdins cn b voidd ftr procdins r initi- td. A scor of 1 is ssind if s; 0 if voidnc of such trnsctions is not possibl. ƒ Whthr th insolvnc frmwork includs spcific provisions tht llow th dbtor (or n insolvnc rprsn-t tiv on its bhlf), ftr commnc- mnt of insolvnc procdins, to obtin finncin ncssr to func-tion durin th procdins. A scor of 1 is ssind if s; 0 if obtinin post-commncmnt finncin is not possibl or if th lw contins no provisions on this subjct. ƒ Whthr post-commncmnt fi-n ncin rcivs priorit ovr ordinr unscurd crditors durin distribu-tion of ssts. A scor of 1 is ssind if s; 0.5 if post-commncmnt fi-n ncin is rntd suprpriorit ovr ll crditors, scurd nd unscurd; 0 if no priorit is rntd to post-comm ncmnt finncin. Th indx rns from 0 to 6, with hihr vlus indictin mor dvnt- ous trtmnt of th dbtor’s ssts from th prspctiv of th compn’s stkholdrs. In Rwnd, for xmpl, dbtors cn continu ssntil con-tr cts ( scor of 1) nd rjct burdn-som ons ( scor of 1) durin insol-v nc procdins. But th insolvnc frmwork contins no provisions on ithr prfrntil trnsctions ( scor of 0) or undrvlud ons ( scor of 0). Post-commncmnt finncin is vilbl undr th lws of Rwnd ( scor of 1) nd rcivs priorit onl ovr ordinr unscurd crditors ( scor of 1). Addin ths numbrs ivs Rwnd scor of 4 on th mnmnt of dbtor’s ssts indx. Reorganization proceedings index Th rornition procdins indx hs 3 componnts: ƒ Whthr th rornition pln is votd on onl b th crditors whos rihts r modifid or ffctd b th pln. A scor of 1 is ssind if s; 0.5 if ll crditors vot on th pln, rrdlss of its impct on thir intrsts; 0 if crditors do not vot on th pln or if rornition is not vilbl. ƒ Whthr crditors ntitld to vot on th pln r dividd into clsss, ch clss vots sprtl nd th crditors within ch clss r trt- d qull. A scor of 1 is ssind if th votin procdur hs ths 3 fturs; 0 if th votin procdur dos not hv ths 3 fturs or if rornition is not vilbl. ƒ Whthr th insolvnc frmwork rquirs tht dissntin crditors r- civ s much undr th rorni- tion pln s th would hv rcivd in liquidtion. A scor of 1 is ssind if s; 0 if no such provisions xist or if rornition is not vilbl. Th indx rns from 0 to 3, with hihr vlus indictin rtr com-pli nc with intrntionll ccptd TABLE 14.14 Wht do th indictors on th strn†th of th insolvnc frmwork msur? Comm nc m nt of proc dins ind x (0–3) Avilbilit of liquidtion nd rorni‡tion to dbtors nd crditors Stndrds for commncmnt of insolvnc procdins M­n­ m nt of d btor’s ­ss ts ind x (0–6) Continution nd rjction of contrcts durin insolvnc Avoidnc of prfrntil nd undrvlud trnsctions Post-commncmnt crdit R or­ni›­tion proc dins ind x (0–3) Approvl nd contnt of th rorni‡tion pln Cr ditor p­rticip­tion ind x (0–4) Crditors’ prticiption in nd rihts durin liquidtion nd rorni‡tion procdins Str nth of insolv nc‡ fr­m work ind x (0–16) Sum of th commncmnt of procdins, mnmnt of dbtor’s ssts, rorni‡tion procdins nd crditor prticiption indics
  • 153.
    142 DOING BUSINESS2015 prctics. Nicru, for xmpl, hs no judicil rornition procd-in s nd thrfor rcivs scor of 0 on th rornition procdins indx. In Estoni, nothr xmpl, onl crditors whos rihts r ffctd b th rornition pln r llowd to vot ( scor of 1). Th rornition pln divids crditors into clsss, ch clss vots sprtl nd crdi-tors within th sm clss r trtd qull ( scor of 1). But thr r no provisions rquirin tht th rturn to dissntin crditors b qul to wht th would hv rcivd in liquidtion ( scor of 0). Addin ths numbrs ivs Estoni scor of 2 on th ror- nition procdins indx. Creditor participation index Th crditor prticiption indx hs 4 componnts: ƒ Whthr crditors prticipt in th slction of n insolvnc rprsn-t tiv. A scor of 1 is ssind if s; 0 if no. ƒ Whthr crditors r rquird to pprov th sl of substntil s-s ts of th dbtor in th cours of insolvnc procdins. A scor of 1 is ssind if s; 0 if no. ƒ Whthr n individul crditor hs th riht to ccss informtion bout insolvnc procdins, ithr b rqustin it from n insolvnc rprsnttiv or b r- viwin th officil rcords. A scor of 1 is ssind if s; 0 if no. ƒ Whthr n individul crditor cn objct to dcision of th court or of th insolvnc rprsnttiv to pprov or rjct clims inst th dbtor brouht b th crditor itslf nd b othr crditors. A scor of 1 is ssind if s; 0 if no. Th indx rns from 0 to 4, with hihr vlus indictin rtr pr-ticip tion of crditors. In Iclnd, for xmpl, th court ppoints th insol-v nc rprsnttiv, without crditors’ pprovl ( scor of 0). Th insolvnc rprsnttiv dcids uniltrll on th sl of th dbtor’s ssts ( scor of 0). An crditor cn inspct th rcords kpt b th insolvnc rpr- snttiv ( scor of 1). And n crditor is llowd to chlln dcision of th insolvnc rprsnttiv to pprov ll clims if this dcision ffcts th crdi-tor’s rihts ( scor of 1). Addin ths numbrs ivs Iclnd scor of 2 on th crditor prticiption indx. Strength of insolvency framework index Th strnth of insolvnc frmwork indx is th sum of th scors on th commncmnt of procdins indx, mnmnt of dbtor’s ssts indx, rornition procdins indx nd crditor prticiption indx. Th indx rns from 0 to 16, with hihr vlus indictin insolvnc lisltion tht is bttr dsind for rhbilittin vibl firms nd liquidtin nonvibl ons. This mthodolo w s dvlopd b Dj nkov, H rt nd othrs (2008) nd is doptd hr with svr l ch ns. Th strnth of insolvnc fr mwork indx w s introducd in Doin Businss 2015. Th bst pr ctics tstd in this indx wr dvlopd on th b sis of th World B nk’s Principls for Effctiv Insolvnc nd Crditor/ Dbtor Rims nd th Unitd N tions Commission on Intrn tion l Tr d L w’s Lisltiv Guid on Insolvnc Lw. LABOR MARKET REGULATION Doin Businss msurs flxibilit in th rultion of mplomnt, sp- cificll s it ffcts th hirin nd rdundnc of workrs nd th riidit of workin hours (fiur 14.22). This r, for th first tim, th indictors msurin flxibilit in lbor mrkt rultions focus on thos ffctin th food rtil industr, usin stn-d rdid cs stud of cshir in suprmrkt. Also nw is tht Doin Businss collcts dt on rultions pplin to mplos hird throuh tmporr-work ncis s wll s on thos pplin to prmnnt mplos or mplos hird on fixd-t rm contrcts. Th indictors lso covr dditionl rs of lbor mrkt rultion, includin socil protction schms nd bnfits s wll s lbor disputs. Ovr th priod from 2007 to 2011 improvmnts wr md to lin th mthodolo for th lbor mr-k t rultion indictors (formrl th mploin workrs indictors) with th lttr nd spirit of th Intrntionl Lbour Ornition (ILO) convntions. Onl 6 of th 188 ILO convntions covr rs msurd b Doin Businss: mplo trmin- tion, wknd work, holid with FIGURE 14.22 How flxibl r hirin†, work schdulin† nd rdundnc ruls? Work scheduling 2. 1. Hiring 3.Redundancy
  • 154.
    DATA NOTES 143 p, niht work, protction inst unmplomnt nd mdicl cr nd sicknss bnfits. Th Doin Businss mthodolo is full consistnt with ths 6 convntions. Th ILO convn-tions covrin rs rltd to th lbor mrkt rultion indictors do not includ th ILO cor lbor stndrds—8 convntions covrin th riht to collctiv brinin, th limintion of forcd lbor, th boli-tion of child lbor nd quitbl trt-m nt in mplomnt prctics. Btwn 2009 nd 2011 th World Bnk Group workd with consult- tiv roup—includin lbor lwrs, mplor nd mplo rprsnt- tivs, nd xprts from th ILO, th Ornistion for Economic Co-op rtion nd Dvlopmnt (OECD), civil socit nd th privt sctor—to rviw th mthodolo for th lbor mrkt rultion indictors nd x-plor futur rs of rsrch.18 A full rport with th conclusions of th con-sult tiv roup, lon with th mthod-olo it proposd, is vilbl t http:// www.doinbusinss.or/mthodolo /lbor-mrkt-rultion. Doin Businss 2015 prsnts th dt for th lbor mrkt rultion indic- tors in n nnx. Th rport dos not prsnt rnkins of conomis on ths indictors or includ th topic in th rt distnc to frontir scor or rnkin on th s of doin businss. Dtild dt collctd on lbor mrkt rultions r vilbl on th Doin Businss wbsit (http:// www.doinbusinss.or). Th dt on lbor mrkt rultions r bsd on dtild qustionnir on mplo- mnt rultions tht is compltd b locl lwrs nd public officils. Emplomnt lws nd rultions s wll s scondr sourcs r rviwd to nsur ccurc. To mk th dt comprbl cross conomis, svrl ssumptions bout th workr nd th businss r usd. Assumptions about the worker Th workr: ƒ Is cshir in suprmrkt or rocr stor. ƒ Is full-tim mplo. ƒ Is not mmbr of th lbor union, unlss mmbrship is mndtor. Assumptions about the business Th businss: ƒ Is limitd libilit compn (or th quivlnt in th conom). ƒ Oprts suprmrkt or rocr stor in th conom’s lrst busi-n ss cit. For 11 conomis th dt r lso collctd for th scond lrst businss cit (s tbl 14A.1). ƒ Hs 60 mplos. ƒ Is subjct to collctiv brinin rmnts if such rmnts covr mor thn 50% of th food rtil sctor nd th ppl vn to firms tht r not prt to thm. ƒ Abids b vr lw nd rultion but dos not rnt workrs mor bnfits thn thos mndtd b lw, rultion or (if pplicbl) col-l ctiv brinin rmnts. Ri‘idit’ of mplo’mnt Riidit of mplomnt covrs 3 rs: difficult of hirin, riidit of hours nd difficult of rdundnc (tbl 14.15). Difficult of hirin covrs 4 rs: (i) whthr fixd-trm contrcts r prohibitd for prmnnt tsks; (ii) th mximum cumultiv durtion of fixd-trm contrcts; (iii) th minimum w for cshir, 19, with 1 r of work xprinc; nd (iv) th rtio of th minimum w to th vr vlu ddd pr workr.19 Riidit of hours covrs 7 rs: (i) whthr th workwk cn xtnd to 50 hours or mor (includin ovrtim) 2 months in r to rspond to ssonl incrs in worklod; (ii) th mximum numbr of ds llowd in th workwk; (iii) th prmium for TABLE 14.15 Wht do th lbor mrkt r†ultion indictors includ? Riidit‡ of mplo‡m nt Difficult of hirin Whthr fixd-trm contrcts r prohibitd for prmnnt tsks Mximum durtion of fixd-trm contrcts, includin rnwls Minimum w pplicbl to th workr ssumd in th cs stud (US$/month) Rtio of minimum w to vlu ddd pr workr Riidit of hours Whthr 50-hour workwks r prmittd for 2 months in r du to n incrs in worklod Allowd mximum lnth of th workwk in ds nd hours, includin ovrtim Prmium for niht work (% of hourl p) Prmium for work on wkl rst d (% of hourl p) Whthr thr r rstrictions on niht work nd wkl holid work Pid nnul vction ds for workrs with 1 r of tnur, 5 rs of tnur nd 10 rs of tnur Difficult of r dund
  • 155.
    nc Lnth ofth mximum probtionr priod (in months) for prmnnt mplos Whthr rdundnc is llowd s rounds for trmintion Whthr third-prt notifiction is rquird for trmintion of rdundnt workr or roup of workrs Whthr third-prt pprovl is rquird for trmintion of rdundnt workr or roup of workrs Whthr mplor is oblitd to rssin or rtrin nd to follow priorit ruls for rdundnc nd rmplomnt R dund­nc‡ cost (w ks of s­l­r‡) Notic rquirmnts, svrnc pmnts nd pnltis du whn trmintin rdundnt workr, xprssd in wks of slr Soci­l prot ction sch m s ­nd b n fits Whthr n unmplomnt protction schm xists Whthr th lw rquirs mplors to provid hlth insurnc for prmnnt mplos L­bor disput s Avilbilit of courts or court sctions spcili‡in in lbor disputs niht work (s prcnt of hourl p); (iv) th prmium for work on wkl rst d (s prcnt of hourl p); (v) whthr thr r
  • 156.
    144 DOING BUSINESS2015 rstrictions on niht work; (vi) whthr thr r rstrictions on wkl holid work; nd (vii) th vr pid n-nu l lv for workrs with 1 r of tnur, 5 rs of tnur nd 10 rs of tnur. Difficult of rdundnc looks t 9 qustions: (i) wht th lnth is in months of th mximum probtion- r priod; (ii) whthr rdundnc is disllowd s bsis for trmintin workrs; (iii) whthr th mplor nds to notif third prt (such s ovrnmnt nc) to trmint 1 rdundnt workr; (iv) whthr th mplor nds to notif third prt to trmint roup of 9 rdundnt workrs; (v) whthr th mplor nds pprovl from third prt to trmint 1 rdundnt workr; (vi) whthr th mplor nds pprovl from third prt to trmint roup of 9 rdundnt workrs; (vii) whthr th lw rquirs th mplor to rs-si n or rtrin workr bfor mkin th workr rdundnt; (viii) whthr priorit ruls ppl for rdundncis; nd (ix) whthr priorit ruls ppl for rmplomnt. Redundancy cost Rdundnc cost msurs th cost of dvnc notic rquirmnts, sv- rnc pmnts nd pnltis du whn trmintin rdundnt workr, xprssd in wks of slr. Th vr- vlu of notic rquirmnts nd svrnc pmnts pplicbl to workr with 1 r of tnur, workr with 5 rs nd workr with 10 rs is considrd. On month is rcordd s 4 nd 1/3 wks. Social protection schemes and benefits Doin Businss collcts dt on th xistnc of unmplomnt protction schms s wll s dt on whthr mplors r lll rquird to pro-vid hlth insurnc for mplos with prmnnt contrcts. Labor disputes Doin Businss sssss th mch- nisms vilbl to rsolv lbor dis-put s. Mor spcificll, it collcts dt on wht courts would b comptnt to hr lbor disputs nd whthr th comptnt courts r spcilid in rsolvin lbor disputs. Th d t dt ils on l bor m rkt rul - tion c n b found for ch conom t http://www.doinbusinss.or. Th Doin Businss wbsit lso provids historic l d t sts. Th mthodolo w s dvl-op d b Botro nd othrs (2004). Doin Businss 2015 dos not prsnt r nkins of conomis on th l bor m rkt rul - tion indic tors. NOTES 1. Th dt for pin txs rfr to Jnur– Dcmbr 2013. 2. Ths r Bnldsh, Bril, Chin, Indi, Indonsi, Jpn, Mxico, Niri, Pkistn, th Russin Fdrtion nd th Unitd Stts. 3. This corrction rt rflcts chns tht xcd 5% up or down. 4. This ssumption is nw in Doin Businss 2015. 5. This componnt is rvisd in Doin Businss 2015. Th prvious mthodolo ssind point if mor thn 2 rs of historicl dt wr distributd. Similrl, crdit burus nd ristris tht rsd dt on dfults s soon s th wr rpid obtind scor of 0. 6. This componnt is rvisd in Doin Businss 2015. Th prvious mthodolo ssind point if borrowrs hv th riht b lw to ccss thir dt in th lrst crdit buru or ristr in th conom. 7. This componnt is nw in Doin Businss 2015. 8. This componnt is nw in Doin Businss 2015. 9. This qustion is usull rultd b stock xchn or scuritis lws. Points r wrdd onl to conomis with mor thn 10 listd firms in thir most importnt stock xchn. 10. Whn vlutin th rim of libilit for compn dirctors for prjudicil rltd-p rt trnsction, Doin Businss ssums tht th trnsction ws dul disclosd nd pprovd. Doin Businss dos not msur dirctor libilit in th vnt of frud. 11. This componnt is rvisd in Doin Businss 2015; it combins 2 prviousl sprt componnts. 12. This componnt is nw in Doin Businss 2015. 13. This componnt is nw in Doin Businss 2015. 14. PwC rfrs to th ntwork of mmbr firms of PricwtrhousCooprs Intrntionl Limitd (PwCIL) or, s th contxt rquirs, individul mmbr firms of th PwC ntwork. Ech mmbr firm is sprt ll ntit nd dos not ct s nt of PwCIL or n othr mmbr firm. PwCIL dos not provid n srvics to clints. PwCIL is not rsponsibl or libl for th cts or omissions of n of its mmbr firms nor cn it control th xrcis of thir profssionl judmnt or bind thm in n w. No mmbr firm is rsponsibl or libl for th cts or omissions of n othr mmbr firm nor cn it control th xrcis of nothr mmbr firm’s profssionl judmnt or bind nothr mmbr firm or PwCIL in n w. 15. Th nonlinr distnc to frontir for th totl tx rt is qul to th distnc to frontir for th totl tx rt to th powr of 0.8. 16. Whil diffrnt tps of continrs r usd round th world, th 2 most importnt r 20-foot nd 40-foot continrs. Us of 40-foot continrs is rowin, but this r’s rsrch confirms tht 20-foot continrs r still common in th mjorit of conomis. Accordin to rspondnts qustiond in ch of th 189 conomis covrd b Doin Businss, 20-foot nd 40-foot continrs r qull common in 49% of th conomis, 20-foot continrs r mor common in 29%, nd 40-foot continrs r mostl rlid on in onl 10%. For th rminin 12% of conomis no dt on th us of th 2 tps of continrs wr vilbl. Th trdin cross bordrs indictors will continu to b bsd on 20- foot continrs bcus this si rmins th most rlvnt for intrntionl trd cross th lob. 17. This ssumption is rvisd in Doin Businss 2015. 18. For th trms of rfrnc nd composition of th consulttiv roup, s World Bnk, “Doin Businss Emploin Workrs Indictor Consulttiv Group,” http://www .doinbusinss.or. 19. Th vr vlu ddd pr workr is th rtio of n conom’s GNI pr cpit to th workin- popultion s prcnt of th totl popultion.
  • 157.
    DATA NOTES 145 TABLE 14A.1 Citis covrd in ch conom b th Doin Businss rport Econom‡ Cit‡ or citi s Econom‡ Cit‡ or citi s Econom‡ Cit‡ or citi s Afhnistn Kbul Grc Athns Pkistn Krchi, Lhor Albni Tirn Grnd St. Gor’s Plu Koror Alri Alirs Gutml Gutml Cit Pnm Pnm Cit Anol Lund Guin Conkr Ppu Nw Guin Port Morsb Antiu nd Brbud St. John’s Guin-Bissu Bissu Pru Asunción Arntin Bunos Airs Gun Gortown Pru Lim Armni Yrvn Hiti Port-u-Princ Philippins Qu‡on Cit Austrli Sdn Hondurs Tucilp Polnd Wrsw Austri Vinn Hon Kon SAR, Chin Hon Kon SAR Portul Lisbon A‡rbijn Bku Hunr Budpst Purto Rico (U.S.) Sn Jun Bhms, Th Nssu Iclnd Rkjvik Qtr Doh Bhrin Mnm Indi Mumbi, Dlhi Romni Buchrst Bnldsh Dhk, Chitton Indonsi Jkrt, Surb Russin Fdrtion Moscow, St. Ptrsbur Brbdos Bridtown Irn, Islmic Rp. Thrn Rwnd Kili Blrus Minsk Irq Bhdd Smo Api Blium Brussls Irlnd Dublin Sn Mrino Sn Mrino Bli‡ Bli‡ Cit Isrl Tl Aviv Sao Tomé nd Príncip Sao Tomé Bnin Cotonou Itl Rom Sudi Arbi Ridh Bhutn Thimphu Jmic Kinston Snl Dkr Bolivi L P‡ Jpn Toko, Osk Srbi Blrd Bosni nd Hr‡ovin Srjvo Jordn Ammn Schlls Victori Botswn Gboron K‡khstn Almt Sirr Lon Frtown Br‡il Sao Pulo, Rio d Jniro Kn Nirobi Sinpor Sinpor Bruni Drusslm Bndr Sri Bwn Kiribti Trw Slovk Rpublic Brtislv Bulri Sofi Kor, Rp. Soul Slovni Ljubljn Burkin Fso Oudouou Kosovo Pristin Solomon Islnds Honir Burundi Bujumbur Kuwit Kuwit Cit South Afric Johnnsbur Cbo Vrd Pri Kr‡ Rpublic Bishkk South Sudn Jub Cmbodi Phnom Pnh Lo PDR Vintin Spin Mdrid Cmroon Doul Ltvi Ri Sri Lnk Colombo Cnd Toronto Lbnon Birut St. Kitts nd Nvis Bsstrr Cntrl Africn Rpublic Bnui Lsotho Msru St. Luci Cstris Chd N’Djmn Libri Monrovi St. Vincnt nd th Grndins Kinstown Chil Sntio Lib Tripoli Sudn Khrtoum Chin Shnhi, Bijin Lithuni Vilnius Surinm Prmribo Colombi Boota Luxmbour Luxmbour Sw‡ilnd Mbbn Comoros Moroni Mcdoni, FYR Skopj Swdn Stockholm Cono, Dm. Rp. Kinshs Mdscr Antnnrivo Swit‡rlnd Zurich Cono, Rp. Br‡‡vill Mlwi Blntr Srin Arb Rpublic Dmscus Cost Ric Sn José Mlsi Kul Lumpur Tiwn, Chin Tipi Côt d’Ivoir Abidjn Mldivs Mlé Tjikistn Dushnb Croti Zrb Mli Bmko Tn‡ni Dr s Slm Cprus Nicosi Mlt Vlltt Thilnd Bnkok C‡ch Rpublic Pru Mrshll Islnds Mjuro Timor-Lst Dili Dnmrk Copnhn Muritni Noukchott Too Lomé Djibouti Djibouti Vill Muritius Port Louis Ton Nuku’lof Dominic Rosu Mxico Mxico Cit, Montrr Trinidd nd Tobo Port of Spin Dominicn Rpublic Snto Domino Micronsi, Fd. Sts. Islnd of Pohnpi Tunisi Tunis Ecudor Quito Moldov Chisinau T urk Istnbul Ept, Arb Rp. Ciro Monoli Ulnbtr Und Kmpl El Slvdor Sn Slvdor Montnro Podoric Ukrin Kiv Equtoril Guin Mlbo Morocco Csblnc Unitd Arb Emirts Dubi Eritr Asmr Mo‡mbiqu Mputo Unitd Kindom London Estoni Tllinn Mnmr Ynon Unitd Stts Nw York Cit, Los Anls Ethiopi Addis Abb Nmibi Windhok Uruu Montvido Fiji Suv Npl Kthmndu U‡bkistn Tshknt Finlnd Hlsinki Nthrlnds Amstrdm Vnutu Port-Vil Frnc Pris Nw Zlnd Aucklnd Vn‡ul, RB Crcs Gbon Librvill Nicru Mnu Vitnm Ho Chi Minh Cit Gmbi, Th Bnjul Nir Nim Wst Bnk nd G‡ Rmllh Gori Tbilisi Niri Los, Kno Ymn, Rp. Sn’ Grmn Brlin Norw Oslo Zmbi Lusk Ghn Accr Omn Musct Zimbbw Hrr
  • 158.
    Doing Business 2015 Going Beyond Efficiency Distance to frontier and ease of doing business ranking This year’s report presents re-sults for 2 aggregate measures: the distance to frontier score and the ease of doing business rank-ing, which for the first time this year is based on the distance to frontier score. The ease of doing business ranking compares economies with one another; the distance to frontier score benchmarks economies with respect to regulatory best practice, showing the absolute distance to the best performance on each Doing Business in-dicator. When compared across years, the distance to frontier score shows how much the regulatory environment for local entrepreneurs in an economy has changed over time in absolute terms, while the ease of doing business ranking can show only how much the regulatory environment has changed relative to that in other economies. DISTANCE TO FRONTIER The distance to frontier score cap-tures the gap between an economy’s performance and a measure of best practice across the entire sample of 31 indicators for 10 Doing Business topics (the labor market regulation indicators are excluded). For starting a business, for example, Canada and New Zealand have the smallest number of proce-dures required (1), and New Zealand the shortest time to fulfill them (0.5 days). Slovenia has the lowest cost (0.0), and Australia, Colombia and 110 other economies have no paid-in minimum capital requirement (table 15.1). Calculation of the distance to frontier score Calculating the distance to frontier score for each economy involves 2 main steps. First, individual component indicators are normalized to a common unit where each of the 31 component indicators y (except for the total tax rate) is rescaled using the linear trans-formation (worst − y)/(worst − frontier). In this formulation the frontier repre-sents the best performance on the indi-cator across all economies since 2005 or the third year in which data for the indicator were collected. For legal indi-cators such as those on getting credit or protecting minority investors, the frontier is set at the highest possible value. For the total tax rate, consistent with the use of a threshold in calculat-ing the rankings on this indicator, the frontier is defined as the total tax rate at the 15th percentile of the overall distribution for all years included in the analysis. For the time to pay taxes the frontier is defined as the lowest time recorded among all economies that levy the 3 major taxes: profit tax, labor taxes and mandatory contributions, and value added tax (VAT) or sales tax. In addition, the cost to export and cost to import for each year are divided by the GDP deflator, to take the general price level into account when bench-marking these absolute-cost indica-tors across economies with different inflation trends. The base year for the deflator is 2013 for all economies. In the same formulation, to mitigate the effects of extreme outliers in the
  • 159.
    DISTANCE TO FRONTIERAND EASE OF DOING BUSINESS RANKING 147 distributions of the rescaled data for most component indicators (very few economies need 700 days to complete the procedures to start a business, but many need 9 days), the worst perfor-mance is calculated after the removal of outliers. The definition of outliers is based on the distribution for each component indicator. To simplify the process, 2 rules were defined: the 95th percentile is used for the indicators with the most dispersed distributions (including time, cost, minimum capital and number of payments to pay taxes), and the 99th percentile is used for number of procedures and number of documents to trade. No outlier was re-moved for component indicators bound by definition or construction, including legal index scores (such as the depth of credit information index, extent of conflict of interest regulation index and strength of insolvency framework in-dex) and the recovery rate (figure 15.1). Second, for each economy the scores obtained for individual indicators are aggregated through simple averaging into one distance to frontier score, first for each topic and then across all 10 topics: starting a business, dealing with construction permits, getting electric-ity, registering property, getting credit, protecting minority investors, paying taxes, trading across borders, enforc-ing contracts and resolving insolvency. More complex aggregation methods— such as principal components and un-observed components—yield a ranking nearly identical to the simple average used by Doing Business.1 Thus Doing Business uses the simplest method: weighting all topics equally and, within each topic, giving equal weight to each of the topic components.2 An economy’s distance to frontier score is indicated on a scale from 0 to 100, where 0 represents the worst per-formance and 100 the frontier. All dis-tance to frontier calculations are based on a maximum of 5 decimals. However, indicator ranking calculations and the TABLE 15.1 What is the frontier in regulatory practice? Topic and indicator Who sets the frontier Frontier Worst performance Starting a business Procedures (number) Canada; New Zealand 1 18a Time (days) New Zealand 0.5 100b Cost (% of income per capita) Slovenia 0.0 200.0b Minimum capital (% of income per capita) Australia; Colombiac 0.0 400.0b Dealing with construction permits Procedures (number) Hong Kong SAR, China 5 30a Time (days) Singapore 26 373b Cost (% of warehouse value) Qatar 0.0 20.0b Getting electricity Procedures (number) Germany; Korea, Rep.d 3 9a Time (days) Korea, Rep. 18 248b Cost (% of income per capita) Japan 0.0 8,100.0b Registering property Procedures (number) Georgia; Norway; Portugal; Sweden 1 13a Time (days) Georgia; New Zealand; Portugal 1 210b Cost (% of property value) Saudi Arabia 0.0 15.0b Getting credit Strength of legal rights index (0–12) Colombia; Montenegro; New Zealand 12 0e Depth of credit information index (0–8) Ecuador; United Kingdomf 8 0e Protecting minority investors Extent of conflict of interest regulation index (0–10) No economy has attained the frontier yet. 10 0e Extent of shareholder governance index (0–10) No economy has attained the frontier yet. 10 0e Paying taxes Payments (number per year) Hong Kong SAR, China; Saudi Arabia 3 63b Time (hours per year) Singapore 49g 696b Total tax rate (% of profit) Singapore 26.1h 84.0b Trading across borders Documents to export (number) France; Ireland 2 11a Time to export (days) Denmark; Estonia; Singapore 6 54b Cost to export (US$ per container), deflated Timor-Leste 410.0 5,000.0b Documents to import (number) France; Ireland 2 15a Time to import (days) Singapore 4 66b Cost to import (US$ per container), deflated Singapore 368.4 6,000.0b (continued)
  • 160.
    148 DOING BUSINESS2015 ease of doing business ranking calcu-lations are based on 2 decimals. The difference between an economy’s distance to frontier score in any previous year and its score in 2014 illustrates the extent to which the economy has closed the gap to the regulatory frontier over time. And in any given year the score measures how far an economy is from the best performance at that time. Treatment of the total tax rate This year, for the first time, the total tax rate component of the paying taxes indicator set enters the distance to frontier calculation in a different way than any other indicator. The distance to frontier score obtained for the total tax rate is transformed in a nonlinear fashion before it enters the distance to frontier score for paying taxes. As a result of the nonlinear transformation, an increase in the total tax rate has a smaller impact on the distance to frontier score for the total tax rate—and therefore on the distance to frontier score for paying taxes—for economies with a below-average total tax rate than it would have in the calculation done in previ-ous years (line B is smaller than line A in figure 15.2). And for economies with an extreme total tax rate (a rate that is very high relative to the average), an increase has a greater impact on both these distance to frontier scores than before (line D is bigger than line C in figure 15.2). The nonlinear transformation is not based on any economic theory of an “optimal tax rate” that minimizes dis-tortions or maximizes efficiency in an economy’s overall tax system. Instead, it is mainly empirical in nature. The nonlinear transformation along with the threshold reduces the bias in the indicator toward economies that do not need to levy significant taxes on companies like the Doing Business standardized case study company because they raise public revenue in other ways—for example, through taxes on foreign companies, through taxes on sectors other than manufac-turing or from natural resources (all of which are outside the scope of the methodology). In addition, it acknowl-edges the need of economies to collect taxes from firms. Calculation of scores for economies with 2 cities covered For each of the 11 economies for which a second city was added in this year’s report, the distance to frontier score is calculated as the population-weighted average of the distance to frontier scores for the 2 cities covered (table 15.2). This is done for the aggregate score, the score for each topic and the scores for all the component indicators for each topic. TABLE 15.1 What is the frontier in regulatory practice? (continued) Topic and indicator Who sets the frontier Frontier Worst performance Enforcing contracts Procedures (number) Singapore 21 53a Time (days) Singapore 120 1,340b Cost (% of claim) Bhutan 0.1 89.0b Resolving insolvency Recovery rate (cents on the dollar) Japan 92.9 0.0e Strength of insolvency framework index (0–16) No economy has attained the frontier yet. 16 0e a. Worst performance is defined as the 99th percentile among all economies in the Doing Business sample. b. Worst performance is defined as the 95th percentile among all economies in the Doing Business sample. c. One hundred and ten other economies also have a minimum capital requirement of 0.0. d. In 11 other economies it also takes only 3 procedures to get an electricity connection. e. Worst performance refers to the worst value recorded. f. Twenty-two other economies also score 8 on the depth of credit information index. g. Defined as the lowest time recorded among all economies in the Doing Business sample that levy the 3 major taxes: profit tax, labor taxes and mandatory contributions, and VAT or sales tax. h. Defined as the highest total tax rate among the 15% of economies with the lowest total tax rate in the Doing Business sample. Source: Doing Business database. TABLE 15.2 Weights used in calculating the distance to frontier scores for economies with 2 cities covered Economy City Weight (%) Bangladesh Dhaka 78 Chittagong 22 Brazil São Paulo 61 Rio de Janeiro 39 China Shanghai 55 Beijing 45 India Mumbai 47 Delhi 53 Indonesia Jakarta 78 Surabaya 22 Japan Tokyo 65 Osaka 35 Mexico Mexico City 83 Monterrey 17 Nigeria Lagos 77 Kano 23 Pakistan Karachi 65 Lahore 35 Russian Federation Moscow 70 St. Petersburg 30 United States New York 60 Los Angeles 40 Source: United Nations, Department of Economic and Social Affairs, Population Division, World Urbanization Prospects, 2014 Revision, “File 12: Population of Urban Agglomerations with 300,000 Inhabitants or More in 2014, by Country, 1950–2030 (thousands),” http://esa .un.org/unpd/wup/CD-ROM/Default.aspx.
  • 161.
    DISTANCE TO FRONTIERAND EASE OF DOING BUSINESS RANKING 149 Variability of economies’ scores across topics Each indicator set measures a differ-ent aspect of the business regulatory environment. The distance to frontier scores and associated rankings of an economy can vary, sometimes signifi-cantly, across indicator sets. The aver-age correlation coefficient between the 10 indicator sets included in the aggre-gate distance to frontier score is 0.37, and the coefficients between 2 sets of indicators range from 0.19 (between getting electricity and registering property) to 0.60 (between protecting minority investors and resolving insol-vency). These correlations suggest that economies rarely score universally well or universally badly on the indicators (table 15.3). Consider the example of Portugal. Its aggregate distance to frontier score is 76.03. Its score is 96.27 for starting a business and 85.20 for trading across borders. But its score is only 59.17 for protecting minority investors and 45.00 for getting credit. Figure 2.1 in the chapter “About Doing Business” illustrates the degree of vari-ability for each economy’s performance across the different areas of business regulation covered by Doing Business. The figure draws attention to econo-mies with a particularly uneven perfor-mance by showing, for each economy, the distance between the average of its highest 3 distance to frontier scores and the average of its lowest 3 across the 10 topics included in this year’s aggregate distance to frontier score. While a rela-tively small distance between these 2 averages suggests a broadly consistent approach across the areas of business regulation measured by Doing Business, a relatively large distance suggests a more uneven approach, with greater room for improvement in some areas than in others. Variation in performance across the indicator sets is not at all unusual. It FIGURE 15.1 How are distance to frontier scores calculated for indicators? Two examples A time-and-motion topic: dealing with construction permits Distance to frontier score for procedures Best performance (frontier): 10 points Worst performance: 0 points Regulatory frontier Regulatory frontier 0 1 2 3 4 5 6 7 8 9 10 reflects differences in the degree of priority that government authorities give to particular areas of business regulation reform and in the ability of different government agencies to deliver tangible results in their area of responsibility. Worst performance (99th percentile): 30 procedures Best performance (frontier): 5 procedures Economies that improved the most across 3 or more Doing Business topics in 2013/14 Doing Business 2015 uses a simple method to calculate which economies improved the ease of doing business the most. First, it selects the economies 100 80 60 40 20 0 0 5 10 15 20 25 30 35 A legal topic: protecting minority investors 100 80 60 40 20 0 Procedures (number) Distance to frontier score for extent of shareholder governance index Extent of shareholder governance index (0–10) Source: Doing Business database.
  • 162.
    150 DOING BUSINESS2015 that in 2013/14 implemented regulatory reforms making it easier to do business in 3 or more of the 10 topics included in this year’s aggregate distance to frontier score.3 Twenty-one economies meet this criterion: Azerbaijan; Benin; the Democratic Republic of Congo; Côte d’Ivoire; the Czech Republic; Regulatory frontier Greece; India; Ireland; Kazakhstan; Lithuania; the former Yugoslav Republic of Macedonia; Poland; Senegal; the Seychelles; Spain; Switzerland; Taiwan, China; Tajikistan; Togo; Trinidad and Tobago; and the United Arab Emirates. Second, Doing Business sorts these economies on the increase in their distance to frontier score from the pre-vious year using comparable data. Selecting the economies that implemented regulatory reforms in at least 3 topics and had the biggest improvements in their distance to frontier scores is intended to highlight economies with ongoing, broad-based reform programs. The improvement in the distance to frontier score is used to identify the top improvers because this allows a focus on the absolute improvement—in contrast with the rela-tive improvement shown by a change in rankings—that economies have made in their regulatory environment for business. EASE OF DOING BUSINESS RANKING The ease of doing business ranking ranges from 1 to 189. The ranking of economies is determined by sorting the aggregate distance to frontier scores, rounded to 2 decimals. FIGURE 15.2 How the nonlinear transformation affects the distance to frontier score for the total tax rate Total tax rate (%) Distance to frontier score for total tax rate 0 10 20 30 40 50 60 70 80 90 100 100 80 60 40 20 0 A B C D Linear distance to frontier score for total tax rate Nonlinear distance to frontier score for total tax rate Note: The nonlinear distance to frontier score for the total tax rate is equal to the distance to frontier score for the total tax rate to the power of 0.8. Source: Doing Business database. TABLE 15.3 Correlations between economy distance to frontier scores for Doing Business topics Dealing with construction permits Getting electricity Registering property Getting credit Protecting minority investors Paying taxes Trading across borders Enforcing contracts Resolving insolvency Starting a business 0.29 0.28 0.35 0.44 0.48 0.51 0.43 0.43 0.48 Dealing with construction permits 0.33 0.31 0.21 0.23 0.35 0.34 0.27 0.22 Getting electricity 0.19 0.23 0.20 0.41 0.53 0.29 0.31 Registering property 0.42 0.45 0.37 0.20 0.49 0.40 Getting credit 0.51 0.27 0.32 0.38 0.56 Protecting minority investors 0.37 0.35 0.37 0.60 Paying taxes 0.42 0.33 0.35 Trading across borders 0.28 0.49 Enforcing contracts 0.48 Source: Doing Business database.
  • 163.
    DISTANCE TO FRONTIERAND EASE OF DOING BUSINESS RANKING 151 NOTES 1. See Djankov, Manraj and others (2005). Principal components and unobserved components methods yield a ranking nearly identical to that from the simple average method because both these methods assign roughly equal weights to the topics, since the pairwise correlations among indicators do not differ much. An alternative to the simple average method is to give different weights to the topics, depending on which are considered of more or less importance in the context of a specific economy. 2. For getting credit, indicators are weighted proportionally, according to their contribution to the total score, with a weight of 60% assigned to the strength of legal rights index and 40% to the depth of credit information index. Indicators for all other topics are assigned equal weights. 3. Changes making it more difficult to do business are subtracted from the total number of those making it easier to do business.
  • 164.
    Doing Business 2015 Going Beyond Efficiency Summaries of Doing Business reforms in 2013/14 Doing Business reforms affecting all sets of indicators included in this year’s report, implemented from June 2013 to June 2014. Reform making it easier to do busi-ness Change making it more difficult to do business Afghanistan Starting a business Afghanistan made starting a busi-ness more difficult by increasing the publication fees and prolonging the time required for registration. Albania Starting a business Albania made starting a business easier by lowering registration fees. Dealing with construction permits Albania made dealing with construc-tion permits easier by resuming the issuance of construction permits and by consolidating the land permit and construction permit into a single construction development permit. Registering property Albania made transferring property easier by establishing effective time limits and computerizing the records on immovable property. Getting credit Albania weakened its secured trans-actions system through an amend-ment to the Securing Charges Law that does not allow intangible assets to be secured with a nonpossessory pledge. Paying taxes Albania made paying taxes more costly for companies by increasing the corporate income tax rate. Algeria Trading across borders Algeria made trading across borders easier by upgrading infrastructure at the port of Algiers. Argentina Dealing with construction permits Argentina made dealing with con-struction permits more costly by increasing several fees. Armenia Starting a business Armenia made starting a business easier by streamlining postregistra-tion procedures. Austria Starting a business Austria made starting a business easier by reducing the minimum capital requirement, which in turn reduced the paid-in minimum capital Reforms affecting the labor market regulation indicators are included here but do not affect the ranking on the ease of doing business.
  • 165.
    SUMMARIES OF DOINGBUSINESS REFORMS IN 2013/14 153 requirement, and by lowering notary fees. Azerbaijan Starting a business Azerbaijan made starting a business easier by reducing the time to obtain an electronic signature for online tax registration. Registering property Azerbaijan made transferring prop-erty easier by introducing an online procedure for obtaining the nonen-cumbrance certificate. Paying taxes Azerbaijan made paying taxes eas-ier for companies by introducing an electronic system for filing and pay-ing social insurance contributions. Bahamas, The Dealing with construction permits The Bahamas made dealing with construction permits more costly by increasing the building permit fees. Enforcing contracts The Bahamas made enforcing contracts easier by introducing new rules of civil procedure focused on streamlining and simplifying court proceedings and ensuring less costly resolution of disputes. Bahrain Registering property Bahrain made registering property easier by reducing the registration fee. Getting credit Bahrain improved access to credit information by approving the credit bureau’s collection of data on firms. Bangladesh Trading across borders Bangladesh made trading across borders easier by introducing a fully automated, computerized customs data management system, ASYCUDA (Automated System for Customs Data) World. This reform applies to both Chittagong and Dhaka. Belarus Paying taxes Belarus made paying taxes easier for companies by introducing an electronic system for filing and pay-ing contributions for the obligatory insurance for work accidents—and by simplifying the filing require-ments for corporate income tax and value added tax (VAT). On the other hand, it increased the ecological tax rate and made bad debt provisions nondeductible for purposes of the corporate income tax. Belgium Resolving insolvency Belgium made resolving insolvency more difficult by establishing addi-tional requirements for commencing reorganization proceedings, includ-ing the submission of documents verified by external parties. Labor market regulation Belgium increased the notice period for redundancy dismissals. Benin Starting a business Benin made starting a business easier by reducing the minimum capital requirement and the fees to be paid at the one-stop shop. Protecting minority investors Benin strengthened minority in-vestor protections by introducing greater requirements for disclosure of related-party transactions to the board of directors and by making it possible for shareholders to inspect the documents pertaining to related-party transactions and to appoint auditors to conduct an inspection of such transactions. Trading across borders Benin made trading across borders easier by reducing the number of documents needed for imports. Enforcing contracts Benin made enforcing contracts easier by creating a commercial sec-tion within its court of first instance. Bolivia Trading across borders Bolivia made trading across borders more difficult by increasing customs clearance time. Brunei Darussalam Dealing with construction permits Brunei Darussalam made dealing with construction permits easier by consolidating final inspections. Paying taxes Brunei Darussalam made paying taxes easier for companies by al-lowing joint filing and payment of supplemental contributory pen-sion and employee provident fund contributions and by introducing an online system for paying these 2 contributions. Bulgaria Starting a business Bulgaria made starting a business easier by lowering registration fees. Burkina Faso Protecting minority investors Burkina Faso strengthened minority investor protections by introducing greater requirements for disclosure of related-party transactions to the board of directors and by making it possible for shareholders to inspect the documents pertaining to related-party transactions and to appoint auditors to conduct an inspection of such transactions.
  • 166.
    154 DOING BUSINESS2015 Cabo Verde Getting credit Cabo Verde improved its credit infor-mation system by adopting a new law providing for the establishment of credit bureaus. Labor market regulation Cabo Verde introduced a minimum wage. Cameroon Getting credit Cameroon improved its credit information system by passing regulations that provide for the establishment and operation of a credit registry database. Protecting minority investors Cameroon strengthened minority investor protections by introducing greater requirements for disclosure of related-party transactions to the board of directors and by making it possible for shareholders to inspect the documents pertaining to related-party transactions and to appoint auditors to conduct an inspection of such transactions. Central African Republic Protecting minority investors The Central African Republic strengthened minority investor pro-tections by introducing greater re-quirements for disclosure of related-party transactions to the board of directors and by making it possible for shareholders to inspect the docu-ments pertaining to related-party transactions and to appoint auditors to conduct an inspection of such transactions. Trading across borders The Central African Republic made trading across borders more difficult by increasing border checks and security controls at the border post with Cameroon. Chad Protecting minority investors Chad strengthened minority inves-tor protections by introducing greater requirements for disclosure of related-party transactions to the board of directors and by making it possible for shareholders to inspect the documents pertaining to related-party transactions and to appoint auditors to conduct an inspection of such transactions. China Starting a business China made starting a business eas-ier by eliminating both the minimum capital requirement and the require-ment to obtain a capital verification report from an auditing firm. This reform applies to both Beijing and Shanghai. Paying taxes China made paying taxes easier for companies by enhancing the elec-tronic system for filing and paying taxes and adopting new communi-cation channels within its taxpayer service, changes applying to both Beijing and Shanghai. In addition, China made paying taxes less costly for companies in Shanghai by reduc-ing the social security contribution rate. Colombia Registering property Colombia made transferring prop-erty easier by eliminating the need for a provisional registration. Getting credit Colombia improved access to credit by adopting a new secured transac-tions law that establishes a func-tional approach to secured transac-tions and a centralized, notice-based collateral registry. The law broadens the range of assets that can be used as collateral, allows a general description of assets granted as col-lateral, establishes clear priority rules inside bankruptcy for secured credi-tors, sets out grounds for relief from a stay of enforcement actions by secured creditors during reorganiza-tion procedures and allows out-of-court enforcement of collateral. Paying taxes Colombia made paying taxes more complicated for companies by in-troducing a new profit tax (CREE), though it also reduced the corporate income tax rate and payroll taxes. Comoros Protecting minority investors The Comoros strengthened minority investor protections by introducing greater requirements for disclosure of related-party transactions to the board of directors and by making it possible for shareholders to inspect the documents pertaining to related-party transactions and to appoint auditors to conduct an inspection of such transactions. Congo, Dem. Rep. Starting a business The Democratic Republic of Congo made starting a business easier by creating a one-stop shop. Dealing with construction permits The Democratic Republic of Congo made dealing with construction permits more costly by increasing the building permit fee. Getting electricity In the Democratic Republic of Congo the utility in Kinshasa made getting electricity easier by reducing the number of approvals required for new connections and reducing the burden of the security deposit. Getting credit The Democratic Republic of Congo improved access to credit informa-tion by establishing a credit registry.
  • 167.
    SUMMARIES OF DOINGBUSINESS REFORMS IN 2013/14 155 Protecting minority investors The Democratic Republic of Congo strengthened minority investor pro-tections by introducing greater re-quirements for disclosure of related-party transactions to the board of directors and by making it possible for shareholders to inspect the docu-ments pertaining to related-party transactions and to appoint auditors to conduct an inspection of such transactions. Paying taxes The Democratic Republic of Congo made paying taxes easier for com-panies by simplifying corporate income tax returns and abolishing the minimum tax payable depending on a company’s size. On the other hand, it increased the rate for the minimum lump-sum tax applied to annual revenue. Congo, Rep. Protecting minority investors The Republic of Congo strengthened minority investor protections by introducing greater requirements for disclosure of related-party transac-tions to the board of directors and by making it possible for shareholders to inspect the documents pertaining to related-party transactions and to appoint auditors to conduct an inspection of such transactions. Paying taxes The Republic of Congo made paying taxes easier for companies by reduc-ing the corporate income tax rate and by abolishing the tax on the rental value of business premises and the tax on company-owned cars. Costa Rica Getting electricity Costa Rica reduced the time required for getting electricity by improving the coordination between different departments at the utility. Paying taxes Costa Rica made paying taxes easier for companies by implementing an electronic system for filing corporate income tax and VAT. Côte d’Ivoire Starting a business Côte d’Ivoire made starting a busi-ness easier by reducing the mini-mum capital requirement, lowering registration fees and enabling the one-stop shop to publish notices of incorporation. Registering property Côte d’Ivoire made transferring property easier by digitizing its land registry system and lowering the property registration tax. Getting credit Côte d’Ivoire improved its credit information system by introducing regulations that govern the licensing and operation of credit bureaus. Protecting minority investors Côte d’Ivoire strengthened minority investor protections by introducing greater requirements for disclosure of related-party transactions to the board of directors and by making it possible for shareholders to inspect the documents pertaining to related-party transactions and to appoint auditors to conduct an inspection of such transactions. Trading across borders Côte d’Ivoire made trading across borders easier by simplifying the processes for producing the inspec-tion report and by reducing port and terminal handling charges at the port of Abidjan. Croatia Starting a business Croatia made starting a business easier by reducing notary fees. Dealing with construction permits Croatia made dealing with construc-tion permits easier by reducing the requirements and fees for building permits and carrying out the final building inspection more promptly. Paying taxes Croatia made paying taxes more complicated for companies by rais-ing the health insurance contribu-tion rate, increasing the Croatian Chamber of Commerce fees and introducing more detailed filing requirements for VAT. On the other hand, it abolished the contribution to the Croatian Chamber of Commerce. Trading across borders Croatia made trading across borders easier by implementing a new elec-tronic customs system. Labor market regulation Croatia lifted the 3-year limit on the duration of first-time fixed-term contracts. Cyprus Getting credit Cyprus improved its credit informa-tion system by adopting a central bank directive eliminating the mini-mum threshold for loans to be in-cluded in credit bureaus’ databases. Paying taxes Cyprus made paying taxes easier for companies by reducing the number of provisional tax installments for corporate income tax. Czech Republic Starting a business The Czech Republic made starting a business easier by substantially reducing the minimum capital re-quirement and the paid-in minimum capital requirement. Getting credit The Czech Republic improved access to credit by adopting a new legal regime on secured transactions that
  • 168.
    156 DOING BUSINESS2015 allows the registration of receivables at the collateral registry and per-mits out-of-court enforcement of collateral. Enforcing contracts The Czech Republic made enforcing contracts easier by amending its civil procedure code and modifying the monetary jurisdictions of its courts. Denmark Starting a business Denmark made starting a business easier by reducing the paid-in mini-mum capital requirement. Djibouti Dealing with construction permits Djibouti made dealing with construc-tion permits less time-consuming by streamlining the review process for building permits. Dominican Republic Dealing with construction permits The Dominican Republic made deal-ing with construction permits more costly by increasing the building permit fees. Getting credit The Dominican Republic improved its credit information system by enacting a new law regulating the protection of personal data and the operation of credit reporting institutions. Protecting minority investors The Dominican Republic strength-ened minority investor protections by introducing greater shareholder rights and requirements for greater corporate transparency. Trading across borders The Dominican Republic made trad-ing across borders easier by reducing the number of documents required for exports and imports. Ecuador Protecting minority investors Ecuador strengthened minority investor protections by introducing greater requirements for disclosure of related-party transactions as well as a requirement that a potential acquirer make a tender offer to all shareholders upon acquiring voting shares. Trading across borders Ecuador made trading across bor-ders easier by upgrading to a new electronic data interchange system called ECUAPASS. Egypt, Arab Rep. Protecting minority investors The Arab Republic of Egypt strength-ened minority investor protections by introducing additional require-ments for approval of related-party transactions and greater require-ments for disclosure of such trans-actions to the stock exchange. Equatorial Guinea Protecting minority investors Equatorial Guinea strengthened minority investor protections by introducing greater requirements for disclosure of related-party transac-tions to the board of directors and by making it possible for shareholders to inspect the documents pertaining to related-party transactions and to appoint auditors to conduct an inspection of such transactions. Finland Labor market regulation Finland eliminated the requirement to notify a third party before dis-missing a redundant employee or group of redundant employees. France Starting a business France made starting a business easier by reducing the time it takes to register a company at the one-stop shop (Centre de Formalités des Entreprises). Labor market regulation France substantially amended its la-bor market regulations, including the provisions dealing with large-scale collective redundancy processes. Gabon Registering property Gabon made transferring property more costly by increasing the prop-erty registration tax rate. Protecting minority investors Gabon strengthened minority in-vestor protections by introducing greater requirements for disclosure of related-party transactions to the board of directors and by making it possible for shareholders to inspect the documents pertaining to related-party transactions and to appoint auditors to conduct an inspection of such transactions. Paying taxes Gabon made paying taxes easier for companies by introducing an elec-tronic system for filing and paying VAT. Gambia, The Starting a business The Gambia made starting a busi-ness easier by eliminating the re-quirement to pay stamp duty. Protecting minority investors The Gambia strengthened minority investor protections by clarifying the duties of directors and providing new venues and remedies for minority shareholders seeking redress for op-pressive conduct. Georgia Labor market regulation Georgia reduced the maximum duration of fixed-term contracts
  • 169.
    SUMMARIES OF DOINGBUSINESS REFORMS IN 2013/14 157 and introduced a notice period for redundancy dismissals. Germany Starting a business Germany made starting a business more difficult by increasing notary fees. Registering property Germany made transferring prop-erty more costly by increasing the property transfer tax rate. Ghana Dealing with construction permits Ghana made dealing with construc-tion permits less time-consuming by streamlining the process to obtain a building permit. Trading across borders Ghana made trading across borders easier by upgrading infrastructure at the port of Tema. Greece Starting a business Greece made starting a business easier by lowering registration costs. Registering property Greece made transferring prop-erty easier by reducing the property transfer tax rate and eliminating the requirement for a municipal tax clearance certificate. Enforcing contracts Greece made enforcing contracts easier by introducing an electronic filing system for court users. Guatemala Starting a business Guatemala made starting a business easier by eliminating certain registra-tion fees and reducing the time to publish a notice of incorporation. Paying taxes Guatemala made paying taxes eas-ier and less costly for companies by enhancing the electronic system for filing and paying corporate income tax and VAT and by reducing the capital gains and corporate income tax rates. On the other hand, it also made paying taxes more compli-cated by introducing a new form for capital gains tax. Guinea Registering property Guinea made registering property easier by reorganizing the records at the land registry and reducing the notary fees. Protecting minority investors Guinea strengthened minority investor protections by introducing greater requirements for disclosure of related-party transactions to the board of directors and by making it possible for shareholders to inspect the documents pertaining to related-party transactions and to appoint auditors to conduct an inspection of such transactions. Guinea-Bissau Protecting minority investors Guinea-Bissau strengthened minority investor protections by introducing greater requirements for disclosure of related-party transactions to the board of directors and by making it possible for shareholders to inspect the documents pertaining to related-party transactions and to appoint auditors to conduct an inspection of such transactions. Honduras Dealing with construction permits Honduras made dealing with con-struction permits more costly by increasing the building permit fees. Hong Kong SAR, China Starting a business Hong Kong SAR, China, made start-ing a business more difficult by increasing the registration fee. Protecting minority investors Hong Kong SAR, China, strength-ened minority investor protections by introducing requirements for directors to provide more detailed disclosure of conflicts of interest to the other board members. Hungary Starting a business Hungary made starting a business more difficult by increasing the paid-in minimum capital requirement. Getting credit Hungary improved access to credit by adopting a new legal regime on secured transactions that implements a functional approach to secured transactions, extends se-curity interests to the products and proceeds of the original asset and establishes a modern, notice-based collateral registry. Paying taxes Hungary made paying taxes easier and less costly for companies by abolishing the special tax that had been temporarily introduced in 2010 and by reducing the vehicle tax rate. Iceland Starting a business Iceland made starting a business easier by offering faster online procedures. Registering property Iceland made transferring property more costly by increasing the stamp duty rate. India Starting a business India made starting a business easier by considerably reducing the
  • 170.
    158 DOING BUSINESS2015 registration fees, but also made it more difficult by introducing a re-quirement to file a declaration before the commencement of business operations. These changes apply to both Delhi and Mumbai. Getting electricity In India the utility in Mumbai made getting electricity less costly by re-ducing the security deposit for a new connection. Protecting minority investors India strengthened minority inves-tor protections by requiring greater disclosure of conflicts of interest by board members, increasing the remedies available in case of preju-dicial related-party transactions and introducing additional safeguards for shareholders of privately held companies. This reform applies to both Delhi and Mumbai. Indonesia Starting a business Indonesia made starting a business easier by allowing the Ministry of Law and Human Rights to electroni-cally issue the approval letter for the deed of establishment. This reform applies to both Jakarta and Surabaya. Getting electricity In Indonesia the electricity company in Jakarta made getting electric-ity easier by eliminating the need for electrical contractors to obtain multiple certificates guaranteeing the safety of internal installations— though it also increased the cost by introducing a security deposit for new connections. Paying taxes Indonesia made paying taxes less costly for companies by reducing employers’ health insurance contri-bution rate. This reform applies to both Jakarta and Surabaya. Trading across borders In Indonesia trading across borders became more difficult because of insufficient infrastructure at the Tanjung Priok Port Jakarta. This change applies to both Jakarta and Surabaya. Iran, Islamic Rep. Starting a business The Islamic Republic of Iran made starting a business easier by stream-lining the name reservation and company registration procedures. Getting electricity The Islamic Republic of Iran made getting electricity easier by eliminat-ing the need for customers to obtain an excavation permit for electricity connection works. Ireland Registering property Ireland made transferring property easier by enhancing its computer-ized system at the land registry and implementing an online system for the registration of title. Getting credit Ireland improved its credit informa-tion system by passing a new act that provides for the establishment and operation of a credit registry. Enforcing contracts Ireland made enforcing contracts easier by modifying the monetary jurisdictions of its courts. Israel Paying taxes Israel made paying taxes more costly for companies by increasing the profit tax rate. Italy Starting a business Italy made starting a business eas-ier by reducing both the minimum capital requirement and the paid-in minimum capital requirement and by streamlining registration procedures. Labor market regulation Italy relaxed the conditions for using fixed-term contracts but reduced their maximum duration to 36 months. Jamaica Starting a business Jamaica made starting a business easier by consolidating forms, but also made it more time-consuming as a result of delays in the imple-mentation of the electronic interface with different agencies. Getting electricity Jamaica made getting electricity less expensive by reducing the cost of external connection works. Getting credit Jamaica improved access to credit by establishing credit bureaus and by adopting a new secured trans-actions law that implements a functional approach to secured transactions, broadens the range of assets that can be used as col-lateral, allows a general description of assets granted as collateral and establishes a modern, notice-based collateral registry. Paying taxes Jamaica made paying taxes more costly for companies by introducing a new minimum business tax. Jordan Trading across borders Jordan made trading across borders easier by improving infrastructure at the port of Aqaba. Kazakhstan Registering property Kazakhstan made registering property easier by introducing ef-fective time limits and an expedited procedure.
  • 171.
    SUMMARIES OF DOINGBUSINESS REFORMS IN 2013/14 159 Paying taxes Kazakhstan made paying taxes more complicated for companies by introducing a mandatory contribu-tion to the National Chamber of Entrepreneurs and by increasing the vehicle and environmental taxes. Trading across borders Kazakhstan made trading across borders easier by opening a new border station and railway link that helped reduce congestion at the border with China. Enforcing contracts Kazakhstan made enforcing con-tracts easier by introducing an elec-tronic filing system for court users. Resolving insolvency Kazakhstan made resolving insolven-cy easier by clarifying and simplifying provisions on liquidation and reorga-nization, introducing the concept of creditors’ meetings, expanding the rights of creditors during insolvency proceedings, authorizing payment in kind to secured creditors and clarify-ing the process for submitting credi-tors’ claims. Kenya Dealing with construction permits Kenya made dealing with construc-tion permits more costly by increas-ing the building permit fees. Getting credit Kenya improved its credit informa-tion system by passing legislation that allows the sharing of both posi-tive and negative credit information and establishes guidelines for the treatment of historical data. Paying taxes Kenya made paying taxes more costly for companies by increasing employers’ social security contribu-tion rate. Kiribati Paying taxes Kiribati made paying taxes more complicated for companies by intro-ducing VAT. Korea, Rep. Registering property The Republic of Korea made trans-ferring property easier by reducing the time needed to buy housing bonds and to register the property transfer. Protecting minority investors Korea strengthened minority inves-tor protections by increasing the level of transparency expected from companies on managerial compensation. Kosovo Dealing with construction permits Kosovo made dealing with construc-tion permits easier by establishing a new phased inspection scheme and substantially reducing the building permit fee. Registering property Kosovo made transferring property more difficult by increasing the fee for the registration of property transactions. Enforcing contracts Kosovo made enforcing contracts easier by introducing a private bailiff system. Kuwait Starting a business Kuwait made starting a business more difficult by increasing the com-mercial license fee. Lao PDR Getting credit The Lao People’s Democratic Republic improved access to credit by implementing a modern, unified, notice-based collateral registry. Protecting minority investors Lao PDR strengthened minority investor protections by introducing requirements for directors to dis-close in detail their conflicts of inter-est to the other board members and for companies to promptly disclose related-party transactions to the Securities Commission and to in-clude the information in their annual reports. Latvia Starting a business Latvia made starting a business more difficult by increasing registra-tion fees, bank fees and notary fees. Paying taxes Latvia made paying taxes easier for companies by simplifying the VAT return, enhancing the electronic system for filing corporate income tax returns and reducing employers’ social security contribution rate. Lithuania Starting a business Lithuania made starting a business easier by eliminating the need to have a company seal and speeding up the VAT registration at the State Tax Inspectorate. Dealing with construction permits Lithuania made dealing with con-struction permits easier by reducing the time required for processing building permit applications. Enforcing contracts Lithuania made enforcing contracts easier by introducing an electronic filing system for court users. Macedonia, FYR Starting a business The former Yugoslav Republic of Macedonia made starting a business
  • 172.
    160 DOING BUSINESS2015 easier by making online registration free of charge. Protecting minority investors FYR Macedonia strengthened minor-ity investor protections by requiring prior review of related-party trans-actions by an external auditor. Resolving insolvency FYR Macedonia made resolving insolvency easier by establishing a framework for electronic auctions of debtors’ assets, streamlining and tightening the time frames for insol-vency proceedings and the appeals process and establishing a frame-work for out-of-court restructurings. Madagascar Dealing with construction permits Madagascar made dealing with con-struction permits easier by reducing the time needed to obtain a building permit. Malawi Starting a business Malawi made starting a business easier by streamlining company name search and registration and by eliminating the requirement for in-spection of company premises before issuance of a business license. Getting electricity Malawi reduced the time required to get electricity by engaging sub-contractors to carry out external connection works. Mali Dealing with construction permits Mali made dealing with construction permits easier by reducing the time needed to obtain a geotechnical study. Protecting minority investors Mali strengthened minority investor protections by introducing greater requirements for disclosure of related-party transactions to the board of directors and by making it possible for shareholders to inspect the documents pertaining to related-party transactions and to appoint auditors to conduct an inspection of such transactions. Malta Starting a business Malta made starting a business easier by creating an electronic link between the Registrar of Companies and the Inland Revenue Department to facilitate issuance of a tax identi-fication number. Mauritania Starting a business Mauritania made starting a busi-ness easier by creating a one-stop shop and eliminating the publication requirement and the fee to obtain a tax identification number. Getting credit Mauritania improved its credit information system by lowering the minimum threshold for loans to be included in the registry’s database. Mauritius Starting a business Mauritius made starting a business easier by reducing trade license fees. Enforcing contracts Mauritius made enforcing contracts easier by introducing an electronic filing system for court users. Labor market regulation Mauritius reduced the maximum duration of fixed-term contracts. Mexico Getting credit Mexico improved access to credit by amending its insolvency proceedings law and establishing clear grounds for relief from a stay of enforcement actions by secured creditors dur-ing reorganization procedures. This reform applies to both Mexico City and Monterrey. Resolving insolvency Mexico made resolving insolvency easier by clarifying several rules, shortening the time extensions allowed during reorganization, facili-tating the electronic submission of documents and improving the legal rights of creditors and other parties involved in bankruptcy procedures. This reform applies to both Mexico City and Monterrey. Moldova Starting a business Moldova made starting a business easier by abolishing the minimum capital requirement. Paying taxes Moldova made paying taxes easier for companies by introducing an electronic system for filing and pay-ing social security contributions. On the other hand, it increased the minimum salary used for calculat-ing the environmental tax liability. Furthermore, Moldova increased the employers’ health insurance contri-bution rate and introduced new filing requirements for VAT. Mongolia Protecting minority investors Mongolia strengthened minority investor protections by introducing a requirement for public joint stock companies to publicly disclose related-party transactions within 2 business days. Paying taxes Mongolia made paying taxes easier for companies by introducing an electronic system for filing corporate income tax, VAT and social security contributions.
  • 173.
    SUMMARIES OF DOINGBUSINESS REFORMS IN 2013/14 161 Montenegro Dealing with construction permits Montenegro made dealing with construction permits substantially less costly by reducing the fee for the provision of utilities on construc-tion land and eliminating the fee for obtaining urban development and technical requirements from the municipality. Morocco Trading across borders Morocco made trading across bor-ders easier by reducing the number of export documents required. Mozambique Registering property Mozambique made registering property easier by streamlining procedures at the land registry and municipality. Resolving insolvency Mozambique made resolving insol-vency easier by introducing a court-supervised reorganization procedure and a mechanism for prepackaged reorganizations, by clarifying rules on the appointment and qualifica-tions of insolvency administrators and by strengthening creditors’ rights. Myanmar Trading across borders Myanmar made trading across bor-ders easier by reducing the number of documents required for exports and imports. Namibia Paying taxes Namibia made paying taxes more complicated for companies by intro-ducing a new vocational education and training levy. Nepal Dealing with construction permits Nepal made dealing with construc-tion permits easier by implementing a new electronic building permit system. New Zealand Getting credit New Zealand improved access to credit information by beginning to distribute both positive and negative credit information. Nicaragua Starting a business Nicaragua made starting a business easier by combining multiple regis-tration procedures. Getting credit Nicaragua improved access to credit information by starting to provide credit scores to banks and financial institutions. Niger Protecting minority investors Niger strengthened minority inves-tor protections by introducing greater requirements for disclosure of related-party transactions to the board of directors and by making it possible for shareholders to inspect the documents pertaining to related-party transactions and to appoint auditors to conduct an inspection of such transactions. Norway Starting a business Norway made starting a business easier by eliminating the require-ment for limited liability companies to have their balance sheet examined by an external auditor if the capital is paid in cash. Pakistan Trading across borders Pakistan made trading across bor-ders easier by introducing a fully au-tomated, computerized system (the Web-Based One Customs system) for the submission and processing of export and import documents. This reform applies to both Lahore and Karachi. Palau Trading across borders Palau made trading across borders easier by improving the system for calculating customs duties and thereby reducing customs clearance time. Panama Getting credit Panama improved access to credit through a new law broadening the range of assets that can be used as collateral, allowing a general description of assets granted as col-lateral and allowing out-of-court enforcement of collateral. Philippines Trading across borders In the Philippines trading across bor-ders became more difficult because of a new city ordinance restricting truck traffic in Manila. Poland Getting electricity Poland made getting electricity less costly by revising the fee structure for new connections. Registering property Poland made transferring property easier by introducing online proce-dures and reducing notary fees. Trading across borders Poland made trading across borders easier by implementing a new termi-nal operating system at the port of Gdansk.
  • 174.
    162 DOING BUSINESS2015 Portugal Paying taxes Portugal made paying taxes less costly for companies by reducing the corporate income tax rate and intro-ducing a reduced corporate tax rate for a portion of the taxable profits of qualifying small and medium-size enterprises. Enforcing contracts Portugal made enforcing contracts easier by adopting a new code of civil procedure designed to reduce case backlogs, streamline court proce-dures, enhance the role of judges and speed up the resolution of standard civil and commercial disputes. Labor market regulation Portugal reduced the amount of sev-erance pay per year of service and increased the maximum cumulative duration of fixed-term contracts. Puerto Rico (U.S.) Dealing with construction permits Puerto Rico (territory of the United States) made dealing with construc-tion permits easier by introducing the option of hiring authorized pri-vate professionals to carry out the fire safety recommendations and issue the fire safety and environ-mental health certificates. Romania Paying taxes Romania made paying taxes easier for companies, with the majority now using the electronic system for filing and paying taxes. Russian Federation Starting a business The Russian Federation made start-ing a business easier by eliminating the requirement to deposit the charter capital before company registration as well as the requirement to notify tax authorities of the opening of a bank account. This reform applies to both Moscow and St. Petersburg. Registering property Russia made transferring property easier by eliminating the requirement for notarization and introducing tighter time limits for completing the property registration. This reform applies to both Moscow and St. Petersburg. Rwanda Starting a business Rwanda made starting a business more difficult by requiring com-panies to buy an electronic billing machine from a certified supplier, but also made it easier by launching free mandatory online registration. Dealing with construction permits Rwanda made dealing with construc-tion permits easier by eliminating the fee for obtaining a freehold title and by streamlining the process for obtaining an occupancy permit. Getting electricity In Rwanda the electricity company made getting electricity less costly by eliminating several fees. Getting credit Rwanda improved access to credit by establishing clear priority rules outside bankruptcy for secured credi-tors and establishing clear grounds for relief from a stay of enforcement actions by secured creditors during reorganization procedures. Samoa Dealing with construction permits Samoa made dealing with construc-tion permits more costly by increas-ing the building permit fees. San Marino Registering property San Marino made transferring prop-erty easier by lowering the property registration tax rate. São Tomé and Príncipe Starting a business São Tomé and Príncipe made start-ing a business easier by eliminating the minimum capital requirement for business entities with no need to obtain a commercial license. Senegal Starting a business Senegal made starting a business easier by reducing the minimum capital requirement. Dealing with construction permits Senegal made dealing with construc-tion permits less time-consuming by reducing the time for processing building permit applications. Registering property Senegal made transferring property easier by replacing the requirement for authorization from the tax authority with a notification require-ment and by creating a single step for the property transfer at the land registry. Getting credit Senegal improved its credit informa-tion system by introducing regula-tions developed by the West African Economic and Monetary Union that govern the licensing and operation of credit bureaus. Protecting minority investors Senegal strengthened minority investor protections by introducing greater requirements for disclosure of related-party transactions to the board of directors; by making it pos-sible for shareholders to inspect the documents pertaining to related-party transactions and to appoint auditors to conduct an inspection of such transactions; and by making it possible for shareholder plaintiffs to request from the other party, and from witnesses, documents relevant to the subject matter of the claim during the trial.
  • 175.
    SUMMARIES OF DOINGBUSINESS REFORMS IN 2013/14 163 Paying taxes Senegal made paying taxes easier for companies by abolishing the vehicle tax and making it possible to download the declaration forms for VAT online. Serbia Registering property Serbia made transferring property more difficult by eliminating the ex-pedited procedure for registering a property transfer. Seychelles Paying taxes The Seychelles made paying taxes easier for companies by reducing the business tax rate applicable to income above 1 million Seychelles rupees ($77,700) and by introducing a simplified new tax return allowing joint filing and payment of the busi-ness tax, VAT and corporate social responsibility tax. On the other hand, it increased employers’ pension fund contribution rate. Enforcing contracts The Seychelles made enforcing contracts easier by establishing a commercial court, implementing and refining its case management system, introducing court-annexed mediation and addressing schedul-ing conflicts within the courts. Resolving insolvency The Seychelles made resolving insolvency easier by introducing a reorganization procedure, provisions on the avoidance of undervalued transactions and the possibility to request post-commencement fi-nancing during the reorganization. Sierra Leone Getting electricity Sierra Leone made getting electric-ity easier by eliminating the need for customers to submit an applica-tion letter inquiring about a new connection before submitting an application—and made the process faster by improving staffing at the utility. Registering property Sierra Leone made registering prop-erty easier by introducing a fast-track procedure. Getting credit Sierra Leone improved its credit information system by beginning to distribute both positive and negative data and by increasing the system’s coverage rate. Paying taxes Sierra Leone made paying taxes more complicated for companies by introducing a capital gains tax. Singapore Enforcing contracts Singapore made enforcing contracts easier by introducing a new electron-ic litigation system that streamlines litigation proceedings. Slovak Republic Starting a business The Slovak Republic made starting a business easier by reducing the time needed to register with the district court and eliminating the need (and therefore the fee) for the verification of signatures by a notary public. Getting credit The Slovak Republic improved its credit information system by imple-menting a new law on the protection of personal data. Slovenia Resolving insolvency Slovenia made resolving insolvency easier by introducing a simplified reorganization procedure for small companies and a preventive re-structuring procedure for medium-size and large ones, by allowing creditors greater participation in the management of the debtor and by establishing provisions for an increase in share capital through debt-equity swaps. Solomon Islands Getting electricity The Solomon Islands made getting electricity easier by improving pro-curement practices for the materials needed to establish new connections. South Africa Getting credit South Africa made access to credit information more difficult by intro-ducing regulations requiring credit bureaus to remove negative credit information from their databases, such as adverse information on consumer behavior or enforcement action accumulated on a consumer’s record before April 1, 2014. Enforcing contracts South Africa made enforcing contracts easier by amending the monetary jurisdiction of its lower courts and introducing voluntary mediation. Spain Starting a business Spain made starting a business easier by introducing an electronic system linking several public agen-cies and thereby simplifying busi-ness registration. Registering property Spain made transferring prop-erty easier by reducing the property transfer tax rate. Paying taxes Spain made paying taxes less costly for companies by reducing the statu-tory corporate income tax rate. Resolving insolvency Spain made resolving insolvency easier by introducing new rules for out-of-court restructuring, introducing provisions applicable to
  • 176.
    164 DOING BUSINESS2015 prepackaged reorganizations and making insolvency proceedings more public. Sri Lanka Paying taxes Sri Lanka made paying taxes more costly for companies by increas-ing the reduced corporate income tax rate for qualifying small and medium-size enterprises. St. Kitts and Nevis Dealing with construction permits St. Kitts and Nevis made dealing with construction permits more costly by increasing the building permit fees. Paying taxes St. Kitts and Nevis made paying taxes less costly for companies by reducing the corporate income tax rate. St. Lucia Trading across borders St. Lucia made trading across borders easier by implementing the ASYCUDA World electronic system for the submission of export and import documents and by reducing the number of export documents required. Suriname Starting a business Suriname made starting a business easier by introducing an online sys-tem for obtaining trade licenses. Swaziland Starting a business Swaziland made starting a business easier by shortening the notice and objection period for obtaining a new trade license. Paying taxes Swaziland made paying taxes less costly for companies by reducing the corporate income tax rate. Sweden Registering property Sweden made registering prop-erty easier by fully implementing a new online system for property registration. Switzerland Starting a business Switzerland made starting a busi-ness easier by introducing online procedures. Protecting minority investors Switzerland strengthened minority investor protections by increasing the level of transparency required from publicly traded companies. Resolving insolvency Switzerland made resolving in-solvency easier by introducing a moratorium period while the debtor is preparing a composition (reor-ganization) agreement, allowing creditors greater participation in the composition (reorganization) procedure and clarifying claw-back provisions applicable to voidable transactions. Taiwan, China Getting electricity Taiwan, China, made getting elec-tricity easier by eliminating site inspections. Getting credit Taiwan, China, improved access to credit information by beginning to include data from utility companies in credit reports. Paying taxes Taiwan, China, made paying taxes easier for companies by introducing an electronic system for paying the vehicle license tax. Tajikistan Starting a business Tajikistan made starting a business easier by enabling the Statistics Agency to issue the statistics code for the new business at the time of registration. Dealing with construction permits Tajikistan made dealing with con-struction permits less costly by reducing the fee to obtain the archi-tectural planning assignment. Getting credit Tajikistan improved access to credit information by beginning to provide credit scores. Paying taxes Tajikistan made paying taxes easier for companies by introducing an electronic system for filing and pay-ing corporate income tax, VAT and labor taxes. Tanzania Getting credit Tanzania improved access to credit information by creating credit bureaus. Paying taxes Tanzania made paying taxes more complicated for companies by introducing an excise tax on money transfers. On the other hand, it made paying taxes less costly by reducing the rate of the skill and development levy. Trading across borders Tanzania made trading across bor-ders easier by upgrading infrastruc-ture at the port of Dar es Salaam. Thailand Dealing with construction permits Thailand made dealing with con-struction permits less time-consum-ing by introducing a fast-track ap-proval process for building permits for smaller buildings.
  • 177.
    SUMMARIES OF DOINGBUSINESS REFORMS IN 2013/14 165 Timor-Leste Starting a business Timor-Leste made starting a busi-ness easier by creating a one-stop shop. Togo Starting a business Togo made starting a business easier by enabling the one-stop shop to publish notices of incorporation and eliminating the requirement to obtain an economic operator card. Registering property Togo made transferring property easier by lowering the property reg-istration tax rate. Protecting minority investors Togo strengthened minority investor protections by introducing greater requirements for disclosure of related-party transactions to the board of directors and by making it possible for shareholders to inspect the documents pertaining to related-party transactions and to appoint auditors to conduct an inspection of such transactions. Paying taxes Togo made paying taxes less costly for companies by reducing the pay-roll tax rate. Trinidad and Tobago Starting a business Trinidad and Tobago made starting a business easier by introducing online systems for employer registration and tax registration. Getting credit Trinidad and Tobago improved access to credit by adopting the Bankruptcy and Insolvency Act, which establishes clear grounds for relief from a stay of enforcement actions by secured creditors during reorganization procedures as well as a time limit for the stay. Resolving insolvency Trinidad and Tobago made resolving insolvency easier by introducing a formal mechanism for rehabilitation, establishing a public office respon-sible for the general administration of insolvency proceedings and clari-fying the rules on appointment of trustees. Tunisia Paying taxes Tunisia made paying taxes less costly for companies by reducing the corporate income tax rate. Trading across borders In Tunisia trading across borders became more difficult because of a deterioration in port infrastructure (for example, in loading and unload-ing equipment) and inadequate terminal space. Turkey Starting a business Turkey made starting a business more difficult by increasing the no-tary and company registration fees. Paying taxes Turkey made paying taxes more costly for companies by increasing employers’ social security contribu-tion rate. Enforcing contracts Turkey made enforcing contracts easier by introducing an electronic filing system for court users. Uganda Trading across borders Uganda made trading across bor-ders easier by implementing the ASYCUDA World electronic system for the submission of export and import documents. Resolving insolvency Uganda made resolving insolvency easier by consolidating all provisions related to corporate insolvency in one law, establishing provisions on the administration of companies (re-organization), clarifying standards on the professional qualifications of insolvency practitioners and intro-ducing provisions allowing the avoid-ance of undervalued transactions. Ukraine Paying taxes Ukraine made paying taxes easier for companies by introducing an electronic system for filing and pay-ing labor taxes. On the other hand, it increased the environmental tax. United Arab Emirates Registering property The United Arab Emirates made transferring property easier by introducing new service centers and a standard contract for property transactions. Getting credit In the United Arab Emirates the credit bureau improved access to credit information by starting to exchange credit information with a utility. Protecting minority investors The United Arab Emirates strength-ened minority investor protections by introducing additional approval requirements for related-party transactions and greater require-ments for disclosure of such trans-actions to the stock exchange; by introducing a requirement that interested directors be held liable in a related-party transaction that is unfair or constitutes a conflict of interest; and by making it possible for shareholders to inspect the docu-ments pertaining to a related-party transaction, appoint auditors to inspect the transaction and request a rescission of the transaction if it should prove to be unfair.
  • 178.
    166 DOING BUSINESS2015 United Kingdom Starting a business The United Kingdom made starting a business easier by speeding up tax registration. Paying taxes The United Kingdom made paying taxes less costly for companies by reducing the corporate income tax rate. On the other hand, it increased the landfill tax. United States Starting a business In the United States starting a busi-ness became easier in New York City thanks to faster online procedures. Uruguay Trading across borders Uruguay made trading across borders easier by implementing a risk-based inspection system that reduced customs clearance time for both exports and imports. Enforcing contracts Uruguay made enforcing contracts easier by simplifying and speeding up the proceedings for commercial disputes. Uzbekistan Protecting minority investors Uzbekistan strengthened minority investor protections by introducing a requirement for public joint stock companies to disclose information about related-party transactions in their annual report; setting higher standards for disclosure of such transactions to the board of direc-tors; and establishing the right of shareholders to receive all docu-ments related to such transactions. Trading across borders Uzbekistan made trading across borders easier by reducing the number of documents to export and import and by making it possible to submit documents electronically. Vanuatu Registering property Vanuatu made property transfers faster by digitizing its land registry system and hiring and training new staff. Venezuela, RB Starting a business República Bolivariana de Venezuela made starting a business more dif-ficult by increasing incorporation costs. Vietnam Getting credit Vietnam improved its credit infor-mation system by establishing a new credit bureau. Paying taxes Vietnam made paying taxes less costly for companies by reducing the corporate income tax rate. West Bank and Gaza Paying taxes West Bank and Gaza made paying taxes easier for companies by intro-ducing the option to make either 1 or 4 advance payments of corporate income tax. Yemen, Rep. Trading across borders In the Republic of Yemen trading across borders became more dif-ficult as a result of inefficient port operation. Zambia Registering property Zambia made transferring property more difficult by increasing the prop-erty transfer tax rate. Getting credit In Zambia the credit bureau im-proved access to credit information by starting to exchange credit infor-mation with retailers and utilities. Paying taxes Zambia made paying taxes easier for companies by abolishing the medical levy and by introducing an online system for filing corporate income tax, VAT and some labor taxes. At the same time, it also increased the property transfer tax.
  • 179.
    Reform making iteasier to do business Change making it more difficult to do business Country tables AFGHANISTAN South Asia GNI per capita (US$) 700 Ease of doing business rank (1–189) 183 Overall distance to frontier (DTF) score (0–100) 41.16 Population (m) 30.6 Starting a business (rank) 24 Registering property (rank) 183 Trading across borders (rank) 184 DTF score for starting a business (0–100) 93.54 DTF score for registering property (0–100) 33.33 DTF score for trading across borders (0–100) 9.21 Procedures (number) 3 Procedures (number) 9 Documents to export (number) 10 Time (days) 7 Time (days) 250 Time to export (days) 86 Cost (% of income per capita) 15.1 Cost (% of property value) 5.0 Cost to export (US$ per container) 5,045 Minimum capital (% of income per capita) 0.0 Documents to import (number) 10 Getting credit (rank) 89 Time to import (days) 91 Dealing with construction permits (rank) 185 DTF score for getting credit (0–100) 45.00 Cost to import (US$ per container) 5,680 DTF score for dealing with construction permits (0–100) 30.14 Strength of legal rights index (0–12) 9 Procedures (number) 11 Depth of credit information index (0–8) 0 Enforcing contracts (rank) 183 Time (days) 323 Credit bureau coverage (% of adults) 0.0 DTF score for enforcing contracts (0–100) 31.29 Cost (% of warehouse value) 57.4 Credit registry coverage (% of adults) 0.0 Procedures (number) 46 Time (days) 1,642 Getting electricity (rank) 141 Protecting minority investors (rank) 189 Cost (% of claim) 25.0 DTF score for getting electricity (0–100) 61.09 DTF score for protecting minority investors (0–100) 10.00 Procedures (number) 5 Extent of conflict of interest regulation index (0–10) 1.7 Resolving insolvency (rank) 159 Time (days) 114 Extent of shareholder governance index (0–10) 0.3 DTF score for resolving insolvency (0–100) 23.60 Cost (% of income per capita) 3,373.9 Strength of minority investor protection index (0–10) 1.0 Time (years) 2.0 Cost (% of estate) 25 Paying taxes (rank) 79 Recovery rate (cents on the dollar) 26.4 DTF score for paying taxes (0–100) 74.39 Strength of insolvency framework index (0–16) 3 Payments (number per year) 20 Time (hours per year) 275 Total tax rate (% of profit) 35.8 ALBANIA Europe Central Asia GNI per capita (US$) 4,700 Ease of doing business rank (1–189) 68 Overall distance to frontier (DTF) score (0–100) 66.06 Population (m) 2.8 Starting a business (rank) 41 Registering property (rank) 118 Trading across borders (rank) 95 DTF score for starting a business (0–100) 91.86 DTF score for registering property (0–100) 60.67 DTF score for trading across borders (0–100) 72.48 Procedures (number) 5 Procedures (number) 6 Documents to export (number) 7 Time (days) 4.5 Time (days) 22 Time to export (days) 19 Cost (% of income per capita) 10.0 Cost (% of property value) 9.9 Cost to export (US$ per container) 745 Minimum capital (% of income per capita) 0.0 Documents to import (number) 8 Getting credit (rank) 36 Time to import (days) 18 Dealing with construction permits (rank) 157 DTF score for getting credit (0–100) 65.00 Cost to import (US$ per container) 730 DTF score for dealing with construction permits (0–100) 56.50 Strength of legal rights index (0–12) 7 Procedures (number) 19 Depth of credit information index (0–8) 6 Enforcing contracts (rank) 102 Time (days) 228 Credit bureau coverage (% of adults) 0.0 DTF score for enforcing contracts (0–100) 57.14 Cost (% of warehouse value) 3.3 Credit registry coverage (% of adults) 16.7 Procedures (number) 39 Time (days) 525 Getting electricity (rank) 152 Protecting minority investors (rank) 7 Cost (% of claim) 34.9 DTF score for getting electricity (0–100) 58.34 DTF score for protecting minority investors (0–100) 72.50 Procedures (number) 6 Extent of conflict of interest regulation index (0–10) 7.3 Resolving insolvency (rank) 44 Time (days) 177 Extent of shareholder governance index (0–10) 7.2 DTF score for resolving insolvency (0–100) 61.37 Cost (% of income per capita) 472.6 Strength of minority investor protection index (0–10) 7.3 Time (years) 2.0 Cost (% of estate) 10 Paying taxes (rank) 131 Recovery rate (cents on the dollar) 41.5 DTF score for paying taxes (0–100) 64.75 Strength of insolvency framework index (0–16) 12.5 Payments (number per year) 34 Time (hours per year) 357 Total tax rate (% of profit) 30.7 Note: For resolving insolvency, an economy for which “no practice” is recorded for time and cost receives a score of 0 on the strength of insolvency framework index even if its legal framework includes provisions related to insolvency proceedings (liquidation or reorganization). Most indicator sets refer to a case scenario in the largest business city of an economy, except for 11 economies for which the data are a population-weighted average for the 2 largest business cities. See the data notes for more details.
  • 180.
    168 DOING BUSINESS2015 Reform making it easier to do business Change making it more difficult to do business ALGERIA Middle East North Africa GNI per capita (US$) 5,290 Ease of doing business rank (1–189) 154 Overall distance to frontier (DTF) score (0–100) 50.69 Population (m) 39.2 Starting a business (rank) 141 Registering property (rank) 157 Trading across borders (rank) 131 DTF score for starting a business (0–100) 74.07 DTF score for registering property (0–100) 50.67 DTF score for trading across borders (0–100) 64.21 Procedures (number) 13 Procedures (number) 10 Documents to export (number) 8 Time (days) 22 Time (days) 55 Time to export (days) 17 Cost (% of income per capita) 11.0 Cost (% of property value) 7.1 Cost to export (US$ per container) 1,270 Minimum capital (% of income per capita) 24.1 Documents to import (number) 9 Getting credit (rank) 171 Time to import (days) 26 Dealing with construction permits (rank) 127 DTF score for getting credit (0–100) 10.00 Cost to import (US$ per container) 1,330 DTF score for dealing with construction permits (0–100) 65.72 Strength of legal rights index (0–12) 2 Procedures (number) 17 Depth of credit information index (0–8) 0 Enforcing contracts (rank) 120 Time (days) 204 Credit bureau coverage (% of adults) 0.0 DTF score for enforcing contracts (0–100) 52.89 Cost (% of warehouse value) 0.7 Credit registry coverage (% of adults) 2.0 Procedures (number) 45 Time (days) 630 Getting electricity (rank) 147 Protecting minority investors (rank) 132 Cost (% of claim) 21.9 DTF score for getting electricity (0–100) 59.98 DTF score for protecting minority investors (0–100) 45.00 Procedures (number) 5 Extent of conflict of interest regulation index (0–10) 5.0 Resolving insolvency (rank) 97 Time (days) 180 Extent of shareholder governance index (0–10) 4.0 DTF score for resolving insolvency (0–100) 42.74 Cost (% of income per capita) 1,318.5 Strength of minority investor protection index (0–10) 4.5 Time (years) 2.5 Cost (% of estate) 7 Paying taxes (rank) 176 Recovery rate (cents on the dollar) 41.7 DTF score for paying taxes (0–100) 41.63 Strength of insolvency framework index (0–16) 6.5 Payments (number per year) 27 Time (hours per year) 451 Total tax rate (% of profit) 72.7 ANGOLA Sub-Saharan Africa GNI per capita (US$) 5,010 Ease of doing business rank (1–189) 181 Overall distance to frontier (DTF) score (0–100) 41.85 Population (m) 21.5 Starting a business (rank) 174 Registering property (rank) 164 Trading across borders (rank) 167 DTF score for starting a business (0–100) 56.56 DTF score for registering property (0–100) 46.62 DTF score for trading across borders (0–100) 40.96 Procedures (number) 8 Procedures (number) 7 Documents to export (number) 10 Time (days) 66 Time (days) 190 Time to export (days) 40 Cost (% of income per capita) 123.5 Cost (% of property value) 3.0 Cost to export (US$ per container) 2,060 Minimum capital (% of income per capita) 20.0 Documents to import (number) 9 Getting credit (rank) 180 Time to import (days) 43 Dealing with construction permits (rank) 67 DTF score for getting credit (0–100) 5.00 Cost to import (US$ per container) 2,725 DTF score for dealing with construction permits (0–100) 75.47 Strength of legal rights index (0–12) 1 Procedures (number) 10 Depth of credit information index (0–8) 0 Enforcing contracts (rank) 187 Time (days) 203 Credit bureau coverage (% of adults) 0.0 DTF score for enforcing contracts (0–100) 25.22 Cost (% of warehouse value) 0.5 Credit registry coverage (% of adults) 1.8 Procedures (number) 46 Time (days) 1,296 Getting electricity (rank) 157 Protecting minority investors (rank) 94 Cost (% of claim) 44.4 DTF score for getting electricity (0–100) 56.66 DTF score for protecting minority investors (0–100) 51.67 Procedures (number) 7 Extent of conflict of interest regulation index (0–10) 5.3 Resolving insolvency (rank) 189 Time (days) 145 Extent of shareholder governance index (0–10) 5.0 DTF score for resolving insolvency (0–100) 0.00 Cost (% of income per capita) 660.0 Strength of minority investor protection index (0–10) 5.2 Time (years) NO PRACTICE Cost (% of estate) NO PRACTICE Paying taxes (rank) 144 Recovery rate (cents on the dollar) 0.0 DTF score for paying taxes (0–100) 60.40 Strength of insolvency framework index (0–16) 0 Payments (number per year) 30 Time (hours per year) 282 Total tax rate (% of profit) 52.0 ANTIGUA AND BARBUDA Latin America Caribbean GNI per capita (US$) 12,910 Ease of doing business rank (1–189) 89 Overall distance to frontier (DTF) score (0–100) 62.64 Population (m) 0.1 Starting a business (rank) 102 Registering property (rank) 141 Trading across borders (rank) 89 DTF score for starting a business (0–100) 83.28 DTF score for registering property (0–100) 55.44 DTF score for trading across borders (0–100) 73.58 Procedures (number) 8 Procedures (number) 7 Documents to export (number) 5 Time (days) 21 Time (days) 25 Time to export (days) 16 Cost (% of income per capita) 10.2 Cost (% of property value) 10.8 Cost to export (US$ per container) 1,090 Minimum capital (% of income per capita) 0.0 Documents to import (number) 7 Getting credit (rank) 151 Time to import (days) 23 Dealing with construction permits (rank) 30 DTF score for getting credit (0–100) 25.00 Cost to import (US$ per container) 1,520 DTF score for dealing with construction permits (0–100) 82.21 Strength of legal rights index (0–12) 5 Procedures (number) 12 Depth of credit information index (0–8) 0 Enforcing contracts (rank) 76 Time (days) 106 Credit bureau coverage (% of adults) 0.0 DTF score for enforcing contracts (0–100) 61.26 Cost (% of warehouse value) 0.5 Credit registry coverage (% of adults) 0.0 Procedures (number) 44 Time (days) 351 Getting electricity (rank) 17 Protecting minority investors (rank) 35 Cost (% of claim) 22.7 DTF score for getting electricity (0–100) 90.46 DTF score for protecting minority investors (0–100) 62.50 Procedures (number) 4 Extent of conflict of interest regulation index (0–10) 6.7 Resolving insolvency (rank) 114 Time (days) 42 Extent of shareholder governance index (0–10) 5.8 DTF score for resolving insolvency (0–100) 38.19 Cost (% of income per capita) 122.9 Strength of minority investor protection index (0–10) 6.3 Time (years) 3.0 Cost (% of estate) 7 Paying taxes (rank) 159 Recovery rate (cents on the dollar) 36.1 DTF score for paying taxes (0–100) 54.51 Strength of insolvency framework index (0–16) 6 Payments (number per year) 57 Time (hours per year) 207 Total tax rate (% of profit) 41.6 Note: For resolving insolvency, an economy for which “no practice” is recorded for time and cost receives a score of 0 on the strength of insolvency framework index even if its legal framework includes provisions related to insolvency proceedings (liquidation or reorganization). Most indicator sets refer to a case scenario in the largest business city of an economy, except for 11 economies for which the data are a population-weighted average for the 2 largest business cities. See the data notes for more details.
  • 181.
    COUNTRY TABLES 169 Reform making it easier to do business Change making it more difficult to do business ARGENTINA Latin America Caribbean GNI per capita (US$) 11,376 Ease of doing business rank (1–189) 124 Overall distance to frontier (DTF) score (0–100) 57.48 Population (m) 41.4 Starting a business (rank) 146 Registering property (rank) 119 Trading across borders (rank) 128 DTF score for starting a business (0–100) 72.58 DTF score for registering property (0–100) 60.63 DTF score for trading across borders (0–100) 65.11 Procedures (number) 14 Procedures (number) 7 Documents to export (number) 6 Time (days) 25 Time (days) 51.5 Time to export (days) 12 Cost (% of income per capita) 15.2 Cost (% of property value) 6.6 Cost to export (US$ per container) 1,770 Minimum capital (% of income per capita) 4.0 Documents to import (number) 8 Getting credit (rank) 71 Time to import (days) 30 Dealing with construction permits (rank) 181 DTF score for getting credit (0–100) 50.00 Cost to import (US$ per container) 2,320 DTF score for dealing with construction permits (0–100) 42.54 Strength of legal rights index (0–12) 2 Procedures (number) 21 Depth of credit information index (0–8) 8 Enforcing contracts (rank) 63 Time (days) 341 Credit bureau coverage (% of adults) 100.0 DTF score for enforcing contracts (0–100) 63.88 Cost (% of warehouse value) 3.5 Credit registry coverage (% of adults) 41.2 Procedures (number) 36 Time (days) 590 Getting electricity (rank) 104 Protecting minority investors (rank) 62 Cost (% of claim) 20.5 DTF score for getting electricity (0–100) 72.42 DTF score for protecting minority investors (0–100) 57.50 Procedures (number) 6 Extent of conflict of interest regulation index (0–10) 5.0 Resolving insolvency (rank) 83 Time (days) 92 Extent of shareholder governance index (0–10) 6.5 DTF score for resolving insolvency (0–100) 45.10 Cost (% of income per capita) 45.4 Strength of minority investor protection index (0–10) 5.8 Time (years) 2.8 Cost (% of estate) 12 Paying taxes (rank) 170 Recovery rate (cents on the dollar) 28.6 DTF score for paying taxes (0–100) 44.99 Strength of insolvency framework index (0–16) 9.5 Payments (number per year) 9 Time (hours per year) 405 Total tax rate (% of profit) 137.3 ARMENIA Europe Central Asia GNI per capita (US$) 3,790 Ease of doing business rank (1–189) 45 Overall distance to frontier (DTF) score (0–100) 70.60 Population (m) 3.0 Starting a business (rank) 4 Registering property (rank) 7 Trading across borders (rank) 110 DTF score for starting a business (0–100) 97.77 DTF score for registering property (0–100) 93.03 DTF score for trading across borders (0–100) 68.81 Procedures (number) 2 Procedures (number) 3 Documents to export (number) 5 Time (days) 3 Time (days) 7 Time to export (days) 16 Cost (% of income per capita) 1.0 Cost (% of property value) 0.2 Cost to export (US$ per container) 1,885 Minimum capital (% of income per capita) 0.0 Documents to import (number) 8 Getting credit (rank) 36 Time to import (days) 18 Dealing with construction permits (rank) 81 DTF score for getting credit (0–100) 65.00 Cost to import (US$ per container) 2,175 DTF score for dealing with construction permits (0–100) 73.78 Strength of legal rights index (0–12) 5 Procedures (number) 19 Depth of credit information index (0–8) 8 Enforcing contracts (rank) 119 Time (days) 83 Credit bureau coverage (% of adults) 65.8 DTF score for enforcing contracts (0–100) 53.33 Cost (% of warehouse value) 1.2 Credit registry coverage (% of adults) 23.5 Procedures (number) 49 Time (days) 570 Getting electricity (rank) 131 Protecting minority investors (rank) 49 Cost (% of claim) 14.0 DTF score for getting electricity (0–100) 64.02 DTF score for protecting minority investors (0–100) 60.00 Procedures (number) 5 Extent of conflict of interest regulation index (0–10) 6.3 Resolving insolvency (rank) 69 Time (days) 187 Extent of shareholder governance index (0–10) 5.7 DTF score for resolving insolvency (0–100) 48.14 Cost (% of income per capita) 92.6 Strength of minority investor protection index (0–10) 6.0 Time (years) 1.9 Cost (% of estate) 11 Paying taxes (rank) 41 Recovery rate (cents on the dollar) 37.2 DTF score for paying taxes (0–100) 82.10 Strength of insolvency framework index (0–16) 9 Payments (number per year) 10 Time (hours per year) 321 Total tax rate (% of profit) 20.4 AUSTRALIA OECD high income GNI per capita (US$) 65,520 Ease of doing business rank (1–189) 10 Overall distance to frontier (DTF) score (0–100) 80.66 Population (m) 23.1 Starting a business (rank) 7 Registering property (rank) 53 Trading across borders (rank) 49 DTF score for starting a business (0–100) 96.47 DTF score for registering property (0–100) 76.87 DTF score for trading across borders (0–100) 80.53 Procedures (number) 3 Procedures (number) 5 Documents to export (number) 5 Time (days) 2.5 Time (days) 4.5 Time to export (days) 9 Cost (% of income per capita) 0.7 Cost (% of property value) 5.2 Cost to export (US$ per container) 1,200 Minimum capital (% of income per capita) 0.0 Documents to import (number) 7 Getting credit (rank) 4 Time to import (days) 8 Dealing with construction permits (rank) 19 DTF score for getting credit (0–100) 90.00 Cost to import (US$ per container) 1,220 DTF score for dealing with construction permits (0–100) 84.30 Strength of legal rights index (0–12) 11 Procedures (number) 10 Depth of credit information index (0–8) 7 Enforcing contracts (rank) 12 Time (days) 112 Credit bureau coverage (% of adults) 100.0 DTF score for enforcing contracts (0–100) 77.06 Cost (% of warehouse value) 0.5 Credit registry coverage (% of adults) 0.0 Procedures (number) 28 Time (days) 395 Getting electricity (rank) 55 Protecting minority investors (rank) 71 Cost (% of claim) 21.8 DTF score for getting electricity (0–100) 80.59 DTF score for protecting minority investors (0–100) 56.67 Procedures (number) 5 Extent of conflict of interest regulation index (0–10) 6.0 Resolving insolvency (rank) 14 Time (days) 75 Extent of shareholder governance index (0–10) 5.3 DTF score for resolving insolvency (0–100) 81.60 Cost (% of income per capita) 8.6 Strength of minority investor protection index (0–10) 5.7 Time (years) 1.0 Cost (% of estate) 8 Paying taxes (rank) 39 Recovery rate (cents on the dollar) 81.9 DTF score for paying taxes (0–100) 82.48 Strength of insolvency framework index (0–16) 12 Payments (number per year) 11 Time (hours per year) 105 Total tax rate (% of profit) 47.3 Note: For resolving insolvency, an economy for which “no practice” is recorded for time and cost receives a score of 0 on the strength of insolvency framework index even if its legal framework includes provisions related to insolvency proceedings (liquidation or reorganization). Most indicator sets refer to a case scenario in the largest business city of an economy, except for 11 economies for which the data are a population-weighted average for the 2 largest business cities. See the data notes for more details.
  • 182.
    170 DOING BUSINESS2015 Reform making it easier to do business Change making it more difficult to do business AUSTRIA OECD high income GNI per capita (US$) 48,590 Ease of doing business rank (1–189) 21 Overall distance to frontier (DTF) score (0–100) 77.42 Population (m) 8.5 Starting a business (rank) 101 Registering property (rank) 35 Trading across borders (rank) 19 DTF score for starting a business (0–100) 83.42 DTF score for registering property (0–100) 81.07 DTF score for trading across borders (0–100) 87.66 Procedures (number) 8 Procedures (number) 3 Documents to export (number) 3 Time (days) 22 Time (days) 20.5 Time to export (days) 10 Cost (% of income per capita) 0.3 Cost (% of property value) 4.6 Cost to export (US$ per container) 1,150 Minimum capital (% of income per capita) 13.6 Documents to import (number) 4 Getting credit (rank) 52 Time to import (days) 9 Dealing with construction permits (rank) 78 DTF score for getting credit (0–100) 60.00 Cost to import (US$ per container) 1,215 DTF score for dealing with construction permits (0–100) 74.25 Strength of legal rights index (0–12) 5 Procedures (number) 11 Depth of credit information index (0–8) 7 Enforcing contracts (rank) 5 Time (days) 192 Credit bureau coverage (% of adults) 53.2 DTF score for enforcing contracts (0–100) 81.55 Cost (% of warehouse value) 1.1 Credit registry coverage (% of adults) 2.0 Procedures (number) 25 Time (days) 397 Getting electricity (rank) 24 Protecting minority investors (rank) 32 Cost (% of claim) 18.0 DTF score for getting electricity (0–100) 87.75 DTF score for protecting minority investors (0–100) 63.33 Procedures (number) 5 Extent of conflict of interest regulation index (0–10) 5.3 Resolving insolvency (rank) 16 Time (days) 23 Extent of shareholder governance index (0–10) 7.3 DTF score for resolving insolvency (0–100) 78.84 Cost (% of income per capita) 101.6 Strength of minority investor protection index (0–10) 6.3 Time (years) 1.1 Cost (% of estate) 10 Paying taxes (rank) 72 Recovery rate (cents on the dollar) 82.6 DTF score for paying taxes (0–100) 76.36 Strength of insolvency framework index (0–16) 11 Payments (number per year) 12 Time (hours per year) 166 Total tax rate (% of profit) 52.0 AZERBAIJAN Europe Central Asia GNI per capita (US$) 7,350 Ease of doing business rank (1–189) 80 Overall distance to frontier (DTF) score (0–100) 64.08 Population (m) 9.4 Starting a business (rank) 12 Registering property (rank) 10 Trading across borders (rank) 166 DTF score for starting a business (0–100) 95.54 DTF score for registering property (0–100) 92.30 DTF score for trading across borders (0–100) 42.37 Procedures (number) 3 Procedures (number) 3 Documents to export (number) 9 Time (days) 5 Time (days) 8.5 Time to export (days) 27 Cost (% of income per capita) 3.1 Cost (% of property value) 0.4 Cost to export (US$ per container) 3,460 Minimum capital (% of income per capita) 0.0 Documents to import (number) 11 Getting credit (rank) 104 Time to import (days) 25 Dealing with construction permits (rank) 150 DTF score for getting credit (0–100) 40.00 Cost to import (US$ per container) 3,450 DTF score for dealing with construction permits (0–100) 59.89 Strength of legal rights index (0–12) 2 Procedures (number) 21 Depth of credit information index (0–8) 6 Enforcing contracts (rank) 31 Time (days) 151 Credit bureau coverage (% of adults) 0.0 DTF score for enforcing contracts (0–100) 69.02 Cost (% of warehouse value) 4.1 Credit registry coverage (% of adults) 28.7 Procedures (number) 40 Time (days) 277 Getting electricity (rank) 159 Protecting minority investors (rank) 51 Cost (% of claim) 18.5 DTF score for getting electricity (0–100) 55.69 DTF score for protecting minority investors (0–100) 59.17 Procedures (number) 7 Extent of conflict of interest regulation index (0–10) 6.7 Resolving insolvency (rank) 94 Time (days) 164 Extent of shareholder governance index (0–10) 5.2 DTF score for resolving insolvency (0–100) 43.02 Cost (% of income per capita) 226.2 Strength of minority investor protection index (0–10) 5.9 Time (years) 1.5 Cost (% of estate) 12 Paying taxes (rank) 33 Recovery rate (cents on the dollar) 39.3 DTF score for paying taxes (0–100) 83.77 Strength of insolvency framework index (0–16) 7 Payments (number per year) 7 Time (hours per year) 195 Total tax rate (% of profit) 39.8 BAHAMAS, THE Latin America Caribbean GNI per capita (US$) 23,489 Ease of doing business rank (1–189) 97 Overall distance to frontier (DTF) score (0–100) 61.37 Population (m) 0.4 Starting a business (rank) 95 Registering property (rank) 179 Trading across borders (rank) 63 DTF score for starting a business (0–100) 84.12 DTF score for registering property (0–100) 37.22 DTF score for trading across borders (0–100) 77.36 Procedures (number) 7 Procedures (number) 7 Documents to export (number) 5 Time (days) 23.5 Time (days) 122 Time to export (days) 19 Cost (% of income per capita) 10.2 Cost (% of property value) 12.1 Cost to export (US$ per container) 1,005 Minimum capital (% of income per capita) 0.0 Documents to import (number) 5 Getting credit (rank) 131 Time to import (days) 13 Dealing with construction permits (rank) 92 DTF score for getting credit (0–100) 30.00 Cost to import (US$ per container) 1,770 DTF score for dealing with construction permits (0–100) 71.81 Strength of legal rights index (0–12) 6 Procedures (number) 14 Depth of credit information index (0–8) 0 Enforcing contracts (rank) 125 Time (days) 178 Credit bureau coverage (% of adults) 0.0 DTF score for enforcing contracts (0–100) 51.65 Cost (% of warehouse value) 1.0 Credit registry coverage (% of adults) 0.0 Procedures (number) 49 Time (days) 427 Getting electricity (rank) 50 Protecting minority investors (rank) 141 Cost (% of claim) 28.9 DTF score for getting electricity (0–100) 81.24 DTF score for protecting minority investors (0–100) 43.33 Procedures (number) 5 Extent of conflict of interest regulation index (0–10) 5.0 Resolving insolvency (rank) 60 Time (days) 67 Extent of shareholder governance index (0–10) 3.7 DTF score for resolving insolvency (0–100) 52.93 Cost (% of income per capita) 133.2 Strength of minority investor protection index (0–10) 4.3 Time (years) 3.0 Cost (% of estate) 12 Paying taxes (rank) 31 Recovery rate (cents on the dollar) 63.5 DTF score for paying taxes (0–100) 84.07 Strength of insolvency framework index (0–16) 6 Payments (number per year) 18 Time (hours per year) 58 Total tax rate (% of profit) 41.1 Note: For resolving insolvency, an economy for which “no practice” is recorded for time and cost receives a score of 0 on the strength of insolvency framework index even if its legal framework includes provisions related to insolvency proceedings (liquidation or reorganization). Most indicator sets refer to a case scenario in the largest business city of an economy, except for 11 economies for which the data are a population-weighted average for the 2 largest business cities. See the data notes for more details.
  • 183.
    COUNTRY TABLES 171 Reform making it easier to do business Change making it more difficult to do business BAHRAIN Middle East North Africa GNI per capita (US$) 27,435 Ease of doing business rank (1–189) 53 Overall distance to frontier (DTF) score (0–100) 69.00 Population (m) 1.3 Starting a business (rank) 131 Registering property (rank) 17 Trading across borders (rank) 64 DTF score for starting a business (0–100) 76.92 DTF score for registering property (0–100) 88.65 DTF score for trading across borders (0–100) 77.27 Procedures (number) 7 Procedures (number) 2 Documents to export (number) 6 Time (days) 9 Time (days) 31 Time to export (days) 11 Cost (% of income per capita) 0.8 Cost (% of property value) 1.7 Cost to export (US$ per container) 810 Minimum capital (% of income per capita) 192.2 Documents to import (number) 8 Getting credit (rank) 104 Time to import (days) 15 Dealing with construction permits (rank) 7 DTF score for getting credit (0–100) 40.00 Cost to import (US$ per container) 870 DTF score for dealing with construction permits (0–100) 88.48 Strength of legal rights index (0–12) 1 Procedures (number) 11 Depth of credit information index (0–8) 7 Enforcing contracts (rank) 123 Time (days) 60 Credit bureau coverage (% of adults) 48.3 DTF score for enforcing contracts (0–100) 52.33 Cost (% of warehouse value) 0.2 Credit registry coverage (% of adults) 0.0 Procedures (number) 48 Time (days) 635 Getting electricity (rank) 73 Protecting minority investors (rank) 104 Cost (% of claim) 14.7 DTF score for getting electricity (0–100) 78.26 DTF score for protecting minority investors (0–100) 50.00 Procedures (number) 5 Extent of conflict of interest regulation index (0–10) 4.7 Resolving insolvency (rank) 87 Time (days) 90 Extent of shareholder governance index (0–10) 5.3 DTF score for resolving insolvency (0–100) 44.24 Cost (% of income per capita) 47.1 Strength of minority investor protection index (0–10) 5.0 Time (years) 2.5 Cost (% of estate) 10 Paying taxes (rank) 8 Recovery rate (cents on the dollar) 41.6 DTF score for paying taxes (0–100) 93.88 Strength of insolvency framework index (0–16) 7 Payments (number per year) 13 Time (hours per year) 60 Total tax rate (% of profit) 13.5 BANGLADESH South Asia GNI per capita (US$) 900 Ease of doing business rank (1–189) 173 Overall distance to frontier (DTF) score (0–100) 46.84 Population (m) 156.6 Starting a business (rank) 115 Registering property (rank) 184 Trading across borders (rank) 140 DTF score for starting a business (0–100) 81.36 DTF score for registering property (0–100) 31.34 DTF score for trading across borders (0–100) 61.36 Procedures (number) 9 Procedures (number) 8 Documents to export (number) 6 Time (days) 19.5 Time (days) 244 Time to export (days) 28.3 Cost (% of income per capita) 16.8 Cost (% of property value) 7.1 Cost to export (US$ per container) 1,281 Minimum capital (% of income per capita) 0.0 Documents to import (number) 9 Getting credit (rank) 131 Time to import (days) 33.6 Dealing with construction permits (rank) 144 DTF score for getting credit (0–100) 30.00 Cost to import (US$ per container) 1,515 DTF score for dealing with construction permits (0–100) 61.90 Strength of legal rights index (0–12) 6 Procedures (number) 13.4 Depth of credit information index (0–8) 0 Enforcing contracts (rank) 188 Time (days) 269.2 Credit bureau coverage (% of adults) 0.0 DTF score for enforcing contracts (0–100) 20.82 Cost (% of warehouse value) 2.1 Credit registry coverage (% of adults) 0.9 Procedures (number) 41 Time (days) 1,442 Getting electricity (rank) 188 Protecting minority investors (rank) 43 Cost (% of claim) 66.8 DTF score for getting electricity (0–100) 17.32 DTF score for protecting minority investors (0–100) 60.83 Procedures (number) 9 Extent of conflict of interest regulation index (0–10) 6.3 Resolving insolvency (rank) 147 Time (days) 428.9 Extent of shareholder governance index (0–10) 5.8 DTF score for resolving insolvency (0–100) 29.49 Cost (% of income per capita) 3,890.1 Strength of minority investor protection index (0–10) 6.1 Time (years) 4.0 Cost (% of estate) 8 Paying taxes (rank) 83 Recovery rate (cents on the dollar) 25.8 DTF score for paying taxes (0–100) 73.98 Strength of insolvency framework index (0–16) 5 Payments (number per year) 21 Time (hours per year) 302 Total tax rate (% of profit) 32.5 BARBADOS Latin America Caribbean GNI per capita (US$) 15,373 Ease of doing business rank (1–189) 106 Overall distance to frontier (DTF) score (0–100) 60.57 Population (m) 0.3 Starting a business (rank) 94 Registering property (rank) 144 Trading across borders (rank) 38 DTF score for starting a business (0–100) 84.36 DTF score for registering property (0–100) 54.95 DTF score for trading across borders (0–100) 83.34 Procedures (number) 8 Procedures (number) 6 Documents to export (number) 5 Time (days) 18 Time (days) 118 Time to export (days) 9 Cost (% of income per capita) 7.6 Cost (% of property value) 5.6 Cost to export (US$ per container) 810 Minimum capital (% of income per capita) 0.0 Documents to import (number) 5 Getting credit (rank) 116 Time to import (days) 8 Dealing with construction permits (rank) 147 DTF score for getting credit (0–100) 35.00 Cost to import (US$ per container) 1,615 DTF score for dealing with construction permits (0–100) 61.06 Strength of legal rights index (0–12) 7 Procedures (number) 9 Depth of credit information index (0–8) 0 Enforcing contracts (rank) 160 Time (days) 442 Credit bureau coverage (% of adults) 0.0 DTF score for enforcing contracts (0–100) 41.61 Cost (% of warehouse value) 0.2 Credit registry coverage (% of adults) 0.0 Procedures (number) 38 Time (days) 1,340 Getting electricity (rank) 118 Protecting minority investors (rank) 177 Cost (% of claim) 19.7 DTF score for getting electricity (0–100) 67.51 DTF score for protecting minority investors (0–100) 30.83 Procedures (number) 7 Extent of conflict of interest regulation index (0–10) 3.3 Resolving insolvency (rank) 26 Time (days) 87 Extent of shareholder governance index (0–10) 2.8 DTF score for resolving insolvency (0–100) 74.09 Cost (% of income per capita) 64.0 Strength of minority investor protection index (0–10) 3.1 Time (years) 1.8 Cost (% of estate) 15 Paying taxes (rank) 92 Recovery rate (cents on the dollar) 65.1 DTF score for paying taxes (0–100) 72.99 Strength of insolvency framework index (0–16) 12.5 Payments (number per year) 27 Time (hours per year) 237 Total tax rate (% of profit) 34.6 Note: For resolving insolvency, an economy for which “no practice” is recorded for time and cost receives a score of 0 on the strength of insolvency framework index even if its legal framework includes provisions related to insolvency proceedings (liquidation or reorganization). Most indicator sets refer to a case scenario in the largest business city of an economy, except for 11 economies for which the data are a population-weighted average for the 2 largest business cities. See the data notes for more details.
  • 184.
    172 DOING BUSINESS2015 Reform making it easier to do business Change making it more difficult to do business BELARUS Europe Central Asia GNI per capita (US$) 6,720 Ease of doing business rank (1–189) 57 Overall distance to frontier (DTF) score (0–100) 68.26 Population (m) 9.5 Starting a business (rank) 40 Registering property (rank) 3 Trading across borders (rank) 145 DTF score for starting a business (0–100) 91.88 DTF score for registering property (0–100) 96.67 DTF score for trading across borders (0–100) 59.09 Procedures (number) 5 Procedures (number) 2 Documents to export (number) 8 Time (days) 9 Time (days) 4 Time to export (days) 15 Cost (% of income per capita) 0.8 Cost (% of property value) 0.0 Cost to export (US$ per container) 1,460 Minimum capital (% of income per capita) 0.0 Documents to import (number) 10 Getting credit (rank) 104 Time to import (days) 30 Dealing with construction permits (rank) 51 DTF score for getting credit (0–100) 40.00 Cost to import (US$ per container) 2,265 DTF score for dealing with construction permits (0–100) 78.20 Strength of legal rights index (0–12) 2 Procedures (number) 14 Depth of credit information index (0–8) 6 Enforcing contracts (rank) 7 Time (days) 114 Credit bureau coverage (% of adults) 0.0 DTF score for enforcing contracts (0–100) 78.70 Cost (% of warehouse value) 0.8 Credit registry coverage (% of adults) 64.5 Procedures (number) 29 Time (days) 275 Getting electricity (rank) 148 Protecting minority investors (rank) 94 Cost (% of claim) 23.4 DTF score for getting electricity (0–100) 59.90 DTF score for protecting minority investors (0–100) 51.67 Procedures (number) 7 Extent of conflict of interest regulation index (0–10) 5.0 Resolving insolvency (rank) 68 Time (days) 131 Extent of shareholder governance index (0–10) 5.3 DTF score for resolving insolvency (0–100) 48.18 Cost (% of income per capita) 364.1 Strength of minority investor protection index (0–10) 5.2 Time (years) 3.0 Cost (% of estate) 22 Paying taxes (rank) 60 Recovery rate (cents on the dollar) 37.3 DTF score for paying taxes (0–100) 78.29 Strength of insolvency framework index (0–16) 9 Payments (number per year) 7 Time (hours per year) 183 Total tax rate (% of profit) 52.0 BELGIUM OECD high income GNI per capita (US$) 45,210 Ease of doing business rank (1–189) 42 Overall distance to frontier (DTF) score (0–100) 71.11 Population (m) 11.2 Starting a business (rank) 14 Registering property (rank) 171 Trading across borders (rank) 26 DTF score for starting a business (0–100) 94.42 DTF score for registering property (0–100) 42.27 DTF score for trading across borders (0–100) 85.55 Procedures (number) 3 Procedures (number) 8 Documents to export (number) 4 Time (days) 4 Time (days) 64 Time to export (days) 9 Cost (% of income per capita) 5.0 Cost (% of property value) 12.7 Cost to export (US$ per container) 1,240 Minimum capital (% of income per capita) 18.2 Documents to import (number) 4 Getting credit (rank) 89 Time to import (days) 8 Dealing with construction permits (rank) 82 DTF score for getting credit (0–100) 45.00 Cost to import (US$ per container) 1,400 DTF score for dealing with construction permits (0–100) 73.68 Strength of legal rights index (0–12) 4 Procedures (number) 10 Depth of credit information index (0–8) 5 Enforcing contracts (rank) 10 Time (days) 212 Credit bureau coverage (% of adults) 0.0 DTF score for enforcing contracts (0–100) 77.67 Cost (% of warehouse value) 1.1 Credit registry coverage (% of adults) 96.4 Procedures (number) 26 Time (days) 505 Getting electricity (rank) 99 Protecting minority investors (rank) 40 Cost (% of claim) 17.7 DTF score for getting electricity (0–100) 72.81 DTF score for protecting minority investors (0–100) 61.67 Procedures (number) 6 Extent of conflict of interest regulation index (0–10) 7.0 Resolving insolvency (rank) 11 Time (days) 88 Extent of shareholder governance index (0–10) 5.3 DTF score for resolving insolvency (0–100) 83.87 Cost (% of income per capita) 92.3 Strength of minority investor protection index (0–10) 6.2 Time (years) 0.9 Cost (% of estate) 4 Paying taxes (rank) 81 Recovery rate (cents on the dollar) 89.1 DTF score for paying taxes (0–100) 74.18 Strength of insolvency framework index (0–16) 11.5 Payments (number per year) 11 Time (hours per year) 160 Total tax rate (% of profit) 57.8 BELIZE Latin America Caribbean GNI per capita (US$) 4,660 Ease of doing business rank (1–189) 118 Overall distance to frontier (DTF) score (0–100) 58.14 Population (m) 0.3 Starting a business (rank) 148 Registering property (rank) 120 Trading across borders (rank) 91 DTF score for starting a business (0–100) 72.38 DTF score for registering property (0–100) 60.61 DTF score for trading across borders (0–100) 73.17 Procedures (number) 9 Procedures (number) 8 Documents to export (number) 5 Time (days) 43 Time (days) 59 Time to export (days) 17 Cost (% of income per capita) 41.4 Cost (% of property value) 4.8 Cost to export (US$ per container) 1,355 Minimum capital (% of income per capita) 0.0 Documents to import (number) 7 Getting credit (rank) 160 Time to import (days) 19 Dealing with construction permits (rank) 69 DTF score for getting credit (0–100) 20.00 Cost to import (US$ per container) 1,580 DTF score for dealing with construction permits (0–100) 75.35 Strength of legal rights index (0–12) 4 Procedures (number) 15 Depth of credit information index (0–8) 0 Enforcing contracts (rank) 170 Time (days) 110 Credit bureau coverage (% of adults) 0.0 DTF score for enforcing contracts (0–100) 37.38 Cost (% of warehouse value) 1.9 Credit registry coverage (% of adults) 0.0 Procedures (number) 51 Time (days) 892 Getting electricity (rank) 54 Protecting minority investors (rank) 169 Cost (% of claim) 27.5 DTF score for getting electricity (0–100) 80.62 DTF score for protecting minority investors (0–100) 35.83 Procedures (number) 5 Extent of conflict of interest regulation index (0–10) 4.3 Resolving insolvency (rank) 71 Time (days) 66 Extent of shareholder governance index (0–10) 2.8 DTF score for resolving insolvency (0–100) 47.94 Cost (% of income per capita) 319.5 Strength of minority investor protection index (0–10) 3.6 Time (years) 2.0 Cost (% of estate) 23 Paying taxes (rank) 61 Recovery rate (cents on the dollar) 54.2 DTF score for paying taxes (0–100) 78.17 Strength of insolvency framework index (0–16) 6 Payments (number per year) 29 Time (hours per year) 147 Total tax rate (% of profit) 31.1 Note: For resolving insolvency, an economy for which “no practice” is recorded for time and cost receives a score of 0 on the strength of insolvency framework index even if its legal framework includes provisions related to insolvency proceedings (liquidation or reorganization). Most indicator sets refer to a case scenario in the largest business city of an economy, except for 11 economies for which the data are a population-weighted average for the 2 largest business cities. See the data notes for more details.
  • 185.
    COUNTRY TABLES 173 Reform making it easier to do business Change making it more difficult to do business BENIN Sub-Saharan Africa GNI per capita (US$) 790 Ease of doing business rank (1–189) 151 Overall distance to frontier (DTF) score (0–100) 51.10 Population (m) 10.3 Starting a business (rank) 117 Registering property (rank) 165 Trading across borders (rank) 121 DTF score for starting a business (0–100) 80.91 DTF score for registering property (0–100) 46.61 DTF score for trading across borders (0–100) 66.45 Procedures (number) 7 Procedures (number) 4 Documents to export (number) 7 Time (days) 12 Time (days) 120 Time to export (days) 25 Cost (% of income per capita) 55.8 Cost (% of property value) 11.7 Cost to export (US$ per container) 1,052 Minimum capital (% of income per capita) 6.3 Documents to import (number) 7 Getting credit (rank) 116 Time to import (days) 25 Dealing with construction permits (rank) 64 DTF score for getting credit (0–100) 35.00 Cost to import (US$ per container) 1,487 DTF score for dealing with construction permits (0–100) 75.87 Strength of legal rights index (0–12) 6 Procedures (number) 13 Depth of credit information index (0–8) 1 Enforcing contracts (rank) 167 Time (days) 111 Credit bureau coverage (% of adults) 0.0 DTF score for enforcing contracts (0–100) 37.73 Cost (% of warehouse value) 3.2 Credit registry coverage (% of adults) 10.0 Procedures (number) 41 Time (days) 750 Getting electricity (rank) 173 Protecting minority investors (rank) 135 Cost (% of claim) 64.7 DTF score for getting electricity (0–100) 45.12 DTF score for protecting minority investors (0–100) 44.17 Procedures (number) 5 Extent of conflict of interest regulation index (0–10) 4.3 Resolving insolvency (rank) 115 Time (days) 90 Extent of shareholder governance index (0–10) 4.5 DTF score for resolving insolvency (0–100) 38.08 Cost (% of income per capita) 14,654.9 Strength of minority investor protection index (0–10) 4.4 Time (years) 4.0 Cost (% of estate) 22 Paying taxes (rank) 178 Recovery rate (cents on the dollar) 18.5 DTF score for paying taxes (0–100) 41.02 Strength of insolvency framework index (0–16) 9 Payments (number per year) 55 Time (hours per year) 270 Total tax rate (% of profit) 63.3 BHUTAN South Asia GNI per capita (US$) 2,460 Ease of doing business rank (1–189) 125 Overall distance to frontier (DTF) score (0–100) 57.47 Population (m) 0.8 Starting a business (rank) 92 Registering property (rank) 86 Trading across borders (rank) 165 DTF score for starting a business (0–100) 85.01 DTF score for registering property (0–100) 68.82 DTF score for trading across borders (0–100) 43.10 Procedures (number) 8 Procedures (number) 3 Documents to export (number) 9 Time (days) 17 Time (days) 92 Time to export (days) 38 Cost (% of income per capita) 4.4 Cost (% of property value) 5.0 Cost to export (US$ per container) 2,230 Minimum capital (% of income per capita) 0.0 Documents to import (number) 11 Getting credit (rank) 71 Time to import (days) 37 Dealing with construction permits (rank) 131 DTF score for getting credit (0–100) 50.00 Cost to import (US$ per container) 2,330 DTF score for dealing with construction permits (0–100) 64.51 Strength of legal rights index (0–12) 4 Procedures (number) 21 Depth of credit information index (0–8) 6 Enforcing contracts (rank) 74 Time (days) 150 Credit bureau coverage (% of adults) 18.0 DTF score for enforcing contracts (0–100) 61.42 Cost (% of warehouse value) 1.3 Credit registry coverage (% of adults) 0.0 Procedures (number) 47 Time (days) 225 Getting electricity (rank) 72 Protecting minority investors (rank) 104 Cost (% of claim) 23.1 DTF score for getting electricity (0–100) 78.28 DTF score for protecting minority investors (0–100) 50.00 Procedures (number) 5 Extent of conflict of interest regulation index (0–10) 4.0 Resolving insolvency (rank) 189 Time (days) 74 Extent of shareholder governance index (0–10) 6.0 DTF score for resolving insolvency (0–100) 0.00 Cost (% of income per capita) 606.5 Strength of minority investor protection index (0–10) 5.0 Time (years) NO PRACTICE Cost (% of estate) NO PRACTICE Paying taxes (rank) 86 Recovery rate (cents on the dollar) 0.0 DTF score for paying taxes (0–100) 73.55 Strength of insolvency framework index (0–16) 0 Payments (number per year) 19 Time (hours per year) 274 Total tax rate (% of profit) 38.7 BOLIVIA Latin America Caribbean GNI per capita (US$) 2,550 Ease of doing business rank (1–189) 157 Overall distance to frontier (DTF) score (0–100) 49.95 Population (m) 10.7 Starting a business (rank) 171 Registering property (rank) 130 Trading across borders (rank) 125 DTF score for starting a business (0–100) 59.07 DTF score for registering property (0–100) 58.55 DTF score for trading across borders (0–100) 65.79 Procedures (number) 15 Procedures (number) 7 Documents to export (number) 7 Time (days) 49 Time (days) 91 Time to export (days) 22 Cost (% of income per capita) 64.4 Cost (% of property value) 4.7 Cost to export (US$ per container) 1,440 Minimum capital (% of income per capita) 1.6 Documents to import (number) 6 Getting credit (rank) 116 Time to import (days) 28 Dealing with construction permits (rank) 129 DTF score for getting credit (0–100) 35.00 Cost to import (US$ per container) 1,745 DTF score for dealing with construction permits (0–100) 64.97 Strength of legal rights index (0–12) 0 Procedures (number) 12 Depth of credit information index (0–8) 7 Enforcing contracts (rank) 111 Time (days) 275 Credit bureau coverage (% of adults) 39.0 DTF score for enforcing contracts (0–100) 54.93 Cost (% of warehouse value) 1.1 Credit registry coverage (% of adults) 15.1 Procedures (number) 40 Time (days) 591 Getting electricity (rank) 127 Protecting minority investors (rank) 160 Cost (% of claim) 33.2 DTF score for getting electricity (0–100) 65.33 DTF score for protecting minority investors (0–100) 40.83 Procedures (number) 8 Extent of conflict of interest regulation index (0–10) 4.0 Resolving insolvency (rank) 96 Time (days) 42 Extent of shareholder governance index (0–10) 4.2 DTF score for resolving insolvency (0–100) 42.82 Cost (% of income per capita) 829.3 Strength of minority investor protection index (0–10) 4.1 Time (years) 1.8 Cost (% of estate) 15 Paying taxes (rank) 189 Recovery rate (cents on the dollar) 38.9 DTF score for paying taxes (0–100) 12.18 Strength of insolvency framework index (0–16) 7 Payments (number per year) 42 Time (hours per year) 1,025 Total tax rate (% of profit) 83.7 Note: For resolving insolvency, an economy for which “no practice” is recorded for time and cost receives a score of 0 on the strength of insolvency framework index even if its legal framework includes provisions related to insolvency proceedings (liquidation or reorganization). Most indicator sets refer to a case scenario in the largest business city of an economy, except for 11 economies for which the data are a population-weighted average for the 2 largest business cities. See the data notes for more details.
  • 186.
    174 DOING BUSINESS2015 Reform making it easier to do business Change making it more difficult to do business BOSNIA AND HERZEGOVINA Europe Central Asia GNI per capita (US$) 4,740 Ease of doing business rank (1–189) 107 Overall distance to frontier (DTF) score (0–100) 60.55 Population (m) 3.8 Starting a business (rank) 147 Registering property (rank) 88 Trading across borders (rank) 104 DTF score for starting a business (0–100) 72.51 DTF score for registering property (0–100) 68.12 DTF score for trading across borders (0–100) 69.76 Procedures (number) 11 Procedures (number) 7 Documents to export (number) 8 Time (days) 37 Time (days) 24 Time to export (days) 16 Cost (% of income per capita) 14.6 Cost (% of property value) 5.2 Cost to export (US$ per container) 1,260 Minimum capital (% of income per capita) 28.6 Documents to import (number) 8 Getting credit (rank) 36 Time to import (days) 13 Dealing with construction permits (rank) 182 DTF score for getting credit (0–100) 65.00 Cost to import (US$ per container) 1,200 DTF score for dealing with construction permits (0–100) 39.10 Strength of legal rights index (0–12) 7 Procedures (number) 15 Depth of credit information index (0–8) 6 Enforcing contracts (rank) 95 Time (days) 179 Credit bureau coverage (% of adults) 8.1 DTF score for enforcing contracts (0–100) 57.64 Cost (% of warehouse value) 19.7 Credit registry coverage (% of adults) 39.7 Procedures (number) 37 Time (days) 595 Getting electricity (rank) 163 Protecting minority investors (rank) 83 Cost (% of claim) 34.0 DTF score for getting electricity (0–100) 54.72 DTF score for protecting minority investors (0–100) 54.17 Procedures (number) 8 Extent of conflict of interest regulation index (0–10) 4.7 Resolving insolvency (rank) 34 Time (days) 125 Extent of shareholder governance index (0–10) 6.2 DTF score for resolving insolvency (0–100) 66.21 Cost (% of income per capita) 484.4 Strength of minority investor protection index (0–10) 5.4 Time (years) 3.3 Cost (% of estate) 9 Paying taxes (rank) 151 Recovery rate (cents on the dollar) 35.9 DTF score for paying taxes (0–100) 58.22 Strength of insolvency framework index (0–16) 15 Payments (number per year) 45 Time (hours per year) 407 Total tax rate (% of profit) 23.3 BOTSWANA Sub-Saharan Africa GNI per capita (US$) 7,730 Ease of doing business rank (1–189) 74 Overall distance to frontier (DTF) score (0–100) 64.87 Population (m) 2.0 Starting a business (rank) 149 Registering property (rank) 51 Trading across borders (rank) 157 DTF score for starting a business (0–100) 71.68 DTF score for registering property (0–100) 78.13 DTF score for trading across borders (0–100) 52.02 Procedures (number) 10 Procedures (number) 4 Documents to export (number) 6 Time (days) 60 Time (days) 15 Time to export (days) 27 Cost (% of income per capita) 1.0 Cost (% of property value) 5.1 Cost to export (US$ per container) 3,145 Minimum capital (% of income per capita) 0.0 Documents to import (number) 6 Getting credit (rank) 61 Time to import (days) 35 Dealing with construction permits (rank) 93 DTF score for getting credit (0–100) 55.00 Cost to import (US$ per container) 3,710 DTF score for dealing with construction permits (0–100) 71.43 Strength of legal rights index (0–12) 5 Procedures (number) 20 Depth of credit information index (0–8) 6 Enforcing contracts (rank) 61 Time (days) 110 Credit bureau coverage (% of adults) 51.7 DTF score for enforcing contracts (0–100) 64.02 Cost (% of warehouse value) 0.3 Credit registry coverage (% of adults) 0.0 Procedures (number) 28 Time (days) 625 Getting electricity (rank) 103 Protecting minority investors (rank) 106 Cost (% of claim) 39.8 DTF score for getting electricity (0–100) 72.56 DTF score for protecting minority investors (0–100) 49.17 Procedures (number) 5 Extent of conflict of interest regulation index (0–10) 6.0 Resolving insolvency (rank) 49 Time (days) 121 Extent of shareholder governance index (0–10) 3.8 DTF score for resolving insolvency (0–100) 57.17 Cost (% of income per capita) 340.4 Strength of minority investor protection index (0–10) 4.9 Time (years) 1.7 Cost (% of estate) 18 Paying taxes (rank) 67 Recovery rate (cents on the dollar) 62.7 DTF score for paying taxes (0–100) 77.47 Strength of insolvency framework index (0–16) 7.5 Payments (number per year) 34 Time (hours per year) 152 Total tax rate (% of profit) 25.3 BRAZIL Latin America Caribbean GNI per capita (US$) 11,690 Ease of doing business rank (1–189) 120 Overall distance to frontier (DTF) score (0–100) 58.01 Population (m) 200.4 Starting a business (rank) 167 Registering property (rank) 138 Trading across borders (rank) 123 DTF score for starting a business (0–100) 63.37 DTF score for registering property (0–100) 56.18 DTF score for trading across borders (0–100) 66.11 Procedures (number) 11.6 Procedures (number) 13.6 Documents to export (number) 6 Time (days) 83.6 Time (days) 31.7 Time to export (days) 13.4 Cost (% of income per capita) 4.3 Cost (% of property value) 2.5 Cost to export (US$ per container) 2,323 Minimum capital (% of income per capita) 0.0 Documents to import (number) 8 Getting credit (rank) 89 Time to import (days) 17 Dealing with construction permits (rank) 174 DTF score for getting credit (0–100) 45.00 Cost to import (US$ per container) 2,323 DTF score for dealing with construction permits (0–100) 48.31 Strength of legal rights index (0–12) 2 Procedures (number) 18.2 Depth of credit information index (0–8) 7 Enforcing contracts (rank) 118 Time (days) 426.1 Credit bureau coverage (% of adults) 63.6 DTF score for enforcing contracts (0–100) 53.60 Cost (% of warehouse value) 0.4 Credit registry coverage (% of adults) 52.5 Procedures (number) 43.6 Time (days) 731 Getting electricity (rank) 19 Protecting minority investors (rank) 35 Cost (% of claim) 16.5 DTF score for getting electricity (0–100) 89.20 DTF score for protecting minority investors (0–100) 62.50 Procedures (number) 4 Extent of conflict of interest regulation index (0–10) 5.7 Resolving insolvency (rank) 55 Time (days) 53.3 Extent of shareholder governance index (0–10) 6.8 DTF score for resolving insolvency (0–100) 54.52 Cost (% of income per capita) 31.6 Strength of minority investor protection index (0–10) 6.3 Time (years) 4.0 Cost (% of estate) 12 Paying taxes (rank) 177 Recovery rate (cents on the dollar) 25.8 DTF score for paying taxes (0–100) 41.31 Strength of insolvency framework index (0–16) 13 Payments (number per year) 9 Time (hours per year) 2,600 Total tax rate (% of profit) 69.0 Note: For resolving insolvency, an economy for which “no practice” is recorded for time and cost receives a score of 0 on the strength of insolvency framework index even if its legal framework includes provisions related to insolvency proceedings (liquidation or reorganization). Most indicator sets refer to a case scenario in the largest business city of an economy, except for 11 economies for which the data are a population-weighted average for the 2 largest business cities. See the data notes for more details.
  • 187.
    COUNTRY TABLES 175 Reform making it easier to do business Change making it more difficult to do business BRUNEI DARUSSALAM East Asia Pacific GNI per capita (US$) 39,943 Ease of doing business rank (1–189) 101 Overall distance to frontier (DTF) score (0–100) 61.26 Population (m) 0.4 Starting a business (rank) 179 Registering property (rank) 162 Trading across borders (rank) 46 DTF score for starting a business (0–100) 53.12 DTF score for registering property (0–100) 48.65 DTF score for trading across borders (0–100) 80.87 Procedures (number) 15 Procedures (number) 7 Documents to export (number) 5 Time (days) 101 Time (days) 298 Time to export (days) 19 Cost (% of income per capita) 10.4 Cost (% of property value) 0.6 Cost to export (US$ per container) 705 Minimum capital (% of income per capita) 0.0 Documents to import (number) 5 Getting credit (rank) 89 Time to import (days) 15 Dealing with construction permits (rank) 53 DTF score for getting credit (0–100) 45.00 Cost to import (US$ per container) 770 DTF score for dealing with construction permits (0–100) 77.93 Strength of legal rights index (0–12) 4 Procedures (number) 17 Depth of credit information index (0–8) 5 Enforcing contracts (rank) 139 Time (days) 88 Credit bureau coverage (% of adults) 0.0 DTF score for enforcing contracts (0–100) 47.76 Cost (% of warehouse value) 0.1 Credit registry coverage (% of adults) 56.6 Procedures (number) 47 Time (days) 540 Getting electricity (rank) 42 Protecting minority investors (rank) 110 Cost (% of claim) 36.6 DTF score for getting electricity (0–100) 83.22 DTF score for protecting minority investors (0–100) 47.50 Procedures (number) 5 Extent of conflict of interest regulation index (0–10) 4.7 Resolving insolvency (rank) 88 Time (days) 56 Extent of shareholder governance index (0–10) 4.8 DTF score for resolving insolvency (0–100) 44.17 Cost (% of income per capita) 38.6 Strength of minority investor protection index (0–10) 4.8 Time (years) 2.5 Cost (% of estate) 4 Paying taxes (rank) 30 Recovery rate (cents on the dollar) 47.2 DTF score for paying taxes (0–100) 84.40 Strength of insolvency framework index (0–16) 6 Payments (number per year) 27 Time (hours per year) 93 Total tax rate (% of profit) 15.8 BULGARIA Europe Central Asia GNI per capita (US$) 7,030 Ease of doing business rank (1–189) 38 Overall distance to frontier (DTF) score (0–100) 71.80 Population (m) 7.3 Starting a business (rank) 49 Registering property (rank) 57 Trading across borders (rank) 57 DTF score for starting a business (0–100) 91.09 DTF score for registering property (0–100) 75.36 DTF score for trading across borders (0–100) 78.34 Procedures (number) 4 Procedures (number) 7 Documents to export (number) 4 Time (days) 18 Time (days) 10 Time to export (days) 18 Cost (% of income per capita) 0.8 Cost (% of property value) 2.9 Cost to export (US$ per container) 1,375 Minimum capital (% of income per capita) 0.0 Documents to import (number) 5 Getting credit (rank) 23 Time to import (days) 17 Dealing with construction permits (rank) 101 DTF score for getting credit (0–100) 70.00 Cost to import (US$ per container) 1,365 DTF score for dealing with construction permits (0–100) 69.85 Strength of legal rights index (0–12) 9 Procedures (number) 16 Depth of credit information index (0–8) 5 Enforcing contracts (rank) 75 Time (days) 110 Credit bureau coverage (% of adults) 0.0 DTF score for enforcing contracts (0–100) 61.27 Cost (% of warehouse value) 4.5 Credit registry coverage (% of adults) 62.9 Procedures (number) 38 Time (days) 564 Getting electricity (rank) 125 Protecting minority investors (rank) 14 Cost (% of claim) 23.8 DTF score for getting electricity (0–100) 65.78 DTF score for protecting minority investors (0–100) 68.33 Procedures (number) 6 Extent of conflict of interest regulation index (0–10) 6.3 Resolving insolvency (rank) 38 Time (days) 130 Extent of shareholder governance index (0–10) 7.3 DTF score for resolving insolvency (0–100) 64.75 Cost (% of income per capita) 320.4 Strength of minority investor protection index (0–10) 6.8 Time (years) 3.3 Cost (% of estate) 9 Paying taxes (rank) 89 Recovery rate (cents on the dollar) 33.2 DTF score for paying taxes (0–100) 73.18 Strength of insolvency framework index (0–16) 15 Payments (number per year) 13 Time (hours per year) 454 Total tax rate (% of profit) 27.0 BURKINA FASO Sub-Saharan Africa GNI per capita (US$) 670 Ease of doing business rank (1–189) 167 Overall distance to frontier (DTF) score (0–100) 48.36 Population (m) 16.9 Starting a business (rank) 153 Registering property (rank) 147 Trading across borders (rank) 174 DTF score for starting a business (0–100) 69.06 DTF score for registering property (0–100) 53.79 DTF score for trading across borders (0–100) 29.51 Procedures (number) 3 Procedures (number) 4 Documents to export (number) 10 Time (days) 13 Time (days) 67 Time to export (days) 41 Cost (% of income per capita) 44.7 Cost (% of property value) 12.3 Cost to export (US$ per container) 2,305 Minimum capital (% of income per capita) 308.5 Documents to import (number) 12 Getting credit (rank) 131 Time to import (days) 49 Dealing with construction permits (rank) 75 DTF score for getting credit (0–100) 30.00 Cost to import (US$ per container) 4,330 DTF score for dealing with construction permits (0–100) 74.55 Strength of legal rights index (0–12) 6 Procedures (number) 11 Depth of credit information index (0–8) 0 Enforcing contracts (rank) 153 Time (days) 112 Credit bureau coverage (% of adults) 0.0 DTF score for enforcing contracts (0–100) 43.83 Cost (% of warehouse value) 5.5 Credit registry coverage (% of adults) 2.0 Procedures (number) 37 Time (days) 446 Getting electricity (rank) 177 Protecting minority investors (rank) 122 Cost (% of claim) 81.7 DTF score for getting electricity (0–100) 40.82 DTF score for protecting minority investors (0–100) 45.83 Procedures (number) 4 Extent of conflict of interest regulation index (0–10) 4.7 Resolving insolvency (rank) 115 Time (days) 158 Extent of shareholder governance index (0–10) 4.5 DTF score for resolving insolvency (0–100) 38.08 Cost (% of income per capita) 11,057.1 Strength of minority investor protection index (0–10) 4.6 Time (years) 4.0 Cost (% of estate) 21 Paying taxes (rank) 152 Recovery rate (cents on the dollar) 18.5 DTF score for paying taxes (0–100) 58.08 Strength of insolvency framework index (0–16) 9 Payments (number per year) 45 Time (hours per year) 270 Total tax rate (% of profit) 41.3 Note: For resolving insolvency, an economy for which “no practice” is recorded for time and cost receives a score of 0 on the strength of insolvency framework index even if its legal framework includes provisions related to insolvency proceedings (liquidation or reorganization). Most indicator sets refer to a case scenario in the largest business city of an economy, except for 11 economies for which the data are a population-weighted average for the 2 largest business cities. See the data notes for more details.
  • 188.
    176 DOING BUSINESS2015 Reform making it easier to do business Change making it more difficult to do business BURUNDI Sub-Saharan Africa GNI per capita (US$) 280 Ease of doing business rank (1–189) 152 Overall distance to frontier (DTF) score (0–100) 51.07 Population (m) 10.2 Starting a business (rank) 18 Registering property (rank) 48 Trading across borders (rank) 169 DTF score for starting a business (0–100) 94.25 DTF score for registering property (0–100) 78.38 DTF score for trading across borders (0–100) 37.50 Procedures (number) 3 Procedures (number) 5 Documents to export (number) 9 Time (days) 5 Time (days) 23 Time to export (days) 32 Cost (% of income per capita) 13.4 Cost (% of property value) 3.2 Cost to export (US$ per container) 2,905 Minimum capital (% of income per capita) 0.0 Documents to import (number) 9 Getting credit (rank) 171 Time to import (days) 43 Dealing with construction permits (rank) 133 DTF score for getting credit (0–100) 10.00 Cost to import (US$ per container) 4,420 DTF score for dealing with construction permits (0–100) 64.16 Strength of legal rights index (0–12) 2 Procedures (number) 14 Depth of credit information index (0–8) 0 Enforcing contracts (rank) 158 Time (days) 99 Credit bureau coverage (% of adults) 0.0 DTF score for enforcing contracts (0–100) 42.15 Cost (% of warehouse value) 10.1 Credit registry coverage (% of adults) 3.9 Procedures (number) 44 Time (days) 832 Getting electricity (rank) 182 Protecting minority investors (rank) 94 Cost (% of claim) 38.6 DTF score for getting electricity (0–100) 35.27 DTF score for protecting minority investors (0–100) 51.67 Procedures (number) 5 Extent of conflict of interest regulation index (0–10) 6.3 Resolving insolvency (rank) 144 Time (days) 158 Extent of shareholder governance index (0–10) 4.0 DTF score for resolving insolvency (0–100) 30.55 Cost (% of income per capita) 16,367.3 Strength of minority investor protection index (0–10) 5.2 Time (years) 5.0 Cost (% of estate) 30 Paying taxes (rank) 124 Recovery rate (cents on the dollar) 7.4 DTF score for paying taxes (0–100) 66.78 Strength of insolvency framework index (0–16) 8.5 Payments (number per year) 25 Time (hours per year) 274 Total tax rate (% of profit) 45.7 CABO VERDE Sub-Saharan Africa GNI per capita (US$) 3,630 Ease of doing business rank (1–189) 122 Overall distance to frontier (DTF) score (0–100) 57.94 Population (m) 0.5 Starting a business (rank) 78 Registering property (rank) 62 Trading across borders (rank) 101 DTF score for starting a business (0–100) 87.00 DTF score for registering property (0–100) 74.50 DTF score for trading across borders (0–100) 70.92 Procedures (number) 7 Procedures (number) 6 Documents to export (number) 7 Time (days) 10 Time (days) 22 Time to export (days) 20 Cost (% of income per capita) 14.3 Cost (% of property value) 3.7 Cost to export (US$ per container) 1,125 Minimum capital (% of income per capita) 0.0 Documents to import (number) 7 Getting credit (rank) 104 Time to import (days) 20 Dealing with construction permits (rank) 114 DTF score for getting credit (0–100) 40.00 Cost to import (US$ per container) 925 DTF score for dealing with construction permits (0–100) 67.53 Strength of legal rights index (0–12) 2 Procedures (number) 16 Depth of credit information index (0–8) 6 Enforcing contracts (rank) 39 Time (days) 140 Credit bureau coverage (% of adults) 0.0 DTF score for enforcing contracts (0–100) 67.61 Cost (% of warehouse value) 4.1 Credit registry coverage (% of adults) 16.7 Procedures (number) 37 Time (days) 425 Getting electricity (rank) 133 Protecting minority investors (rank) 170 Cost (% of claim) 19.8 DTF score for getting electricity (0–100) 63.80 DTF score for protecting minority investors (0–100) 35.00 Procedures (number) 7 Extent of conflict of interest regulation index (0–10) 4.0 Resolving insolvency (rank) 189 Time (days) 88 Extent of shareholder governance index (0–10) 3.0 DTF score for resolving insolvency (0–100) 0.00 Cost (% of income per capita) 932.2 Strength of minority investor protection index (0–10) 3.5 Time (years) NO PRACTICE Cost (% of estate) NO PRACTICE Paying taxes (rank) 91 Recovery rate (cents on the dollar) 0.0 DTF score for paying taxes (0–100) 73.05 Strength of insolvency framework index (0–16) 0 Payments (number per year) 30 Time (hours per year) 186 Total tax rate (% of profit) 36.5 CAMBODIA East Asia Pacific GNI per capita (US$) 950 Ease of doing business rank (1–189) 135 Overall distance to frontier (DTF) score (0–100) 55.33 Population (m) 15.1 Starting a business (rank) 184 Registering property (rank) 100 Trading across borders (rank) 124 DTF score for starting a business (0–100) 41.23 DTF score for registering property (0–100) 64.83 DTF score for trading across borders (0–100) 65.92 Procedures (number) 11 Procedures (number) 7 Documents to export (number) 8 Time (days) 101 Time (days) 56 Time to export (days) 22 Cost (% of income per capita) 139.5 Cost (% of property value) 4.4 Cost to export (US$ per container) 795 Minimum capital (% of income per capita) 26.1 Documents to import (number) 9 Getting credit (rank) 12 Time to import (days) 24 Dealing with construction permits (rank) 183 DTF score for getting credit (0–100) 80.00 Cost to import (US$ per container) 930 DTF score for dealing with construction permits (0–100) 35.54 Strength of legal rights index (0–12) 11 Procedures (number) 20 Depth of credit information index (0–8) 5 Enforcing contracts (rank) 178 Time (days) 652 Credit bureau coverage (% of adults) 29.3 DTF score for enforcing contracts (0–100) 32.79 Cost (% of warehouse value) 6.7 Credit registry coverage (% of adults) 0.0 Procedures (number) 44 Time (days) 483 Getting electricity (rank) 139 Protecting minority investors (rank) 92 Cost (% of claim) 103.4 DTF score for getting electricity (0–100) 62.44 DTF score for protecting minority investors (0–100) 52.50 Procedures (number) 4 Extent of conflict of interest regulation index (0–10) 5.7 Resolving insolvency (rank) 84 Time (days) 168 Extent of shareholder governance index (0–10) 4.8 DTF score for resolving insolvency (0–100) 45.02 Cost (% of income per capita) 2,495.4 Strength of minority investor protection index (0–10) 5.3 Time (years) 6.0 Cost (% of estate) 28 Paying taxes (rank) 90 Recovery rate (cents on the dollar) 8.2 DTF score for paying taxes (0–100) 73.06 Strength of insolvency framework index (0–16) 13 Payments (number per year) 40 Time (hours per year) 173 Total tax rate (% of profit) 21.0 Note: For resolving insolvency, an economy for which “no practice” is recorded for time and cost receives a score of 0 on the strength of insolvency framework index even if its legal framework includes provisions related to insolvency proceedings (liquidation or reorganization). Most indicator sets refer to a case scenario in the largest business city of an economy, except for 11 economies for which the data are a population-weighted average for the 2 largest business cities. See the data notes for more details.
  • 189.
    COUNTRY TABLES 177 Reform making it easier to do business Change making it more difficult to do business CAMEROON Sub-Saharan Africa GNI per capita (US$) 1,270 Ease of doing business rank (1–189) 158 Overall distance to frontier (DTF) score (0–100) 49.85 Population (m) 22.3 Starting a business (rank) 133 Registering property (rank) 172 Trading across borders (rank) 160 DTF score for starting a business (0–100) 76.41 DTF score for registering property (0–100) 42.00 DTF score for trading across borders (0–100) 49.83 Procedures (number) 5 Procedures (number) 5 Documents to export (number) 11 Time (days) 15 Time (days) 86 Time to export (days) 23 Cost (% of income per capita) 34.3 Cost (% of property value) 19.0 Cost to export (US$ per container) 1,379 Minimum capital (% of income per capita) 156.4 Documents to import (number) 12 Getting credit (rank) 116 Time to import (days) 25 Dealing with construction permits (rank) 166 DTF score for getting credit (0–100) 35.00 Cost to import (US$ per container) 2,267 DTF score for dealing with construction permits (0–100) 52.87 Strength of legal rights index (0–12) 6 Procedures (number) 15 Depth of credit information index (0–8) 1 Enforcing contracts (rank) 159 Time (days) 136 Credit bureau coverage (% of adults) 0.0 DTF score for enforcing contracts (0–100) 42.11 Cost (% of warehouse value) 13.9 Credit registry coverage (% of adults) 5.4 Procedures (number) 42 Time (days) 800 Getting electricity (rank) 52 Protecting minority investors (rank) 117 Cost (% of claim) 46.6 DTF score for getting electricity (0–100) 80.84 DTF score for protecting minority investors (0–100) 46.67 Procedures (number) 4 Extent of conflict of interest regulation index (0–10) 5.0 Resolving insolvency (rank) 123 Time (days) 64 Extent of shareholder governance index (0–10) 4.3 DTF score for resolving insolvency (0–100) 36.42 Cost (% of income per capita) 1,686.3 Strength of minority investor protection index (0–10) 4.7 Time (years) 2.8 Cost (% of estate) 34 Paying taxes (rank) 181 Recovery rate (cents on the dollar) 15.4 DTF score for paying taxes (0–100) 36.34 Strength of insolvency framework index (0–16) 9 Payments (number per year) 44 Time (hours per year) 630 Total tax rate (% of profit) 48.8 CANADA OECD high income GNI per capita (US$) 52,200 Ease of doing business rank (1–189) 16 Overall distance to frontier (DTF) score (0–100) 79.09 Population (m) 35.2 Starting a business (rank) 2 Registering property (rank) 55 Trading across borders (rank) 23 DTF score for starting a business (0–100) 98.82 DTF score for registering property (0–100) 76.20 DTF score for trading across borders (0–100) 86.07 Procedures (number) 1 Procedures (number) 6 Documents to export (number) 3 Time (days) 5 Time (days) 16.5 Time to export (days) 8 Cost (% of income per capita) 0.4 Cost (% of property value) 3.3 Cost to export (US$ per container) 1,680 Minimum capital (% of income per capita) 0.0 Documents to import (number) 3 Getting credit (rank) 7 Time to import (days) 10 Dealing with construction permits (rank) 118 DTF score for getting credit (0–100) 85.00 Cost to import (US$ per container) 1,680 DTF score for dealing with construction permits (0–100) 67.12 Strength of legal rights index (0–12) 9 Procedures (number) 12 Depth of credit information index (0–8) 8 Enforcing contracts (rank) 65 Time (days) 249 Credit bureau coverage (% of adults) 100.0 DTF score for enforcing contracts (0–100) 63.76 Cost (% of warehouse value) 1.3 Credit registry coverage (% of adults) 0.0 Procedures (number) 36 Time (days) 570 Getting electricity (rank) 150 Protecting minority investors (rank) 7 Cost (% of claim) 22.3 DTF score for getting electricity (0–100) 59.27 DTF score for protecting minority investors (0–100) 72.50 Procedures (number) 7 Extent of conflict of interest regulation index (0–10) 8.7 Resolving insolvency (rank) 6 Time (days) 142 Extent of shareholder governance index (0–10) 5.8 DTF score for resolving insolvency (0–100) 89.17 Cost (% of income per capita) 131.0 Strength of minority investor protection index (0–10) 7.3 Time (years) 0.8 Cost (% of estate) 7 Paying taxes (rank) 9 Recovery rate (cents on the dollar) 87.3 DTF score for paying taxes (0–100) 93.00 Strength of insolvency framework index (0–16) 13.5 Payments (number per year) 8 Time (hours per year) 131 Total tax rate (% of profit) 21.0 CENTRAL AFRICAN REPUBLIC Sub-Saharan Africa GNI per capita (US$) 320 Ease of doing business rank (1–189) 187 Overall distance to frontier (DTF) score (0–100) 34.47 Population (m) 4.6 Starting a business (rank) 187 Registering property (rank) 150 Trading across borders (rank) 186 DTF score for starting a business (0–100) 34.30 DTF score for registering property (0–100) 52.46 DTF score for trading across borders (0–100) 6.48 Procedures (number) 8 Procedures (number) 5 Documents to export (number) 9 Time (days) 22 Time (days) 75 Time to export (days) 46 Cost (% of income per capita) 226.0 Cost (% of property value) 11.1 Cost to export (US$ per container) 5,490 Minimum capital (% of income per capita) 607.3 Documents to import (number) 17 Getting credit (rank) 131 Time to import (days) 68 Dealing with construction permits (rank) 145 DTF score for getting credit (0–100) 30.00 Cost to import (US$ per container) 6,335 DTF score for dealing with construction permits (0–100) 61.83 Strength of legal rights index (0–12) 6 Procedures (number) 15 Depth of credit information index (0–8) 0 Enforcing contracts (rank) 182 Time (days) 200 Credit bureau coverage (% of adults) 0.0 DTF score for enforcing contracts (0–100) 31.62 Cost (% of warehouse value) 4.9 Credit registry coverage (% of adults) 2.6 Procedures (number) 43 Time (days) 660 Getting electricity (rank) 186 Protecting minority investors (rank) 135 Cost (% of claim) 82.0 DTF score for getting electricity (0–100) 32.27 DTF score for protecting minority investors (0–100) 44.17 Procedures (number) 7 Extent of conflict of interest regulation index (0–10) 4.3 Resolving insolvency (rank) 152 Time (days) 102 Extent of shareholder governance index (0–10) 4.5 DTF score for resolving insolvency (0–100) 28.13 Cost (% of income per capita) 17,232.4 Strength of minority investor protection index (0–10) 4.4 Time (years) 4.8 Cost (% of estate) 76 Paying taxes (rank) 185 Recovery rate (cents on the dollar) 0.0 DTF score for paying taxes (0–100) 23.47 Strength of insolvency framework index (0–16) 9 Payments (number per year) 56 Time (hours per year) 483 Total tax rate (% of profit) 73.3 Note: For resolving insolvency, an economy for which “no practice” is recorded for time and cost receives a score of 0 on the strength of insolvency framework index even if its legal framework includes provisions related to insolvency proceedings (liquidation or reorganization). Most indicator sets refer to a case scenario in the largest business city of an economy, except for 11 economies for which the data are a population-weighted average for the 2 largest business cities. See the data notes for more details.
  • 190.
    178 DOING BUSINESS2015 Reform making it easier to do business Change making it more difficult to do business CHAD Sub-Saharan Africa GNI per capita (US$) 1,020 Ease of doing business rank (1–189) 185 Overall distance to frontier (DTF) score (0–100) 37.25 Population (m) 12.8 Starting a business (rank) 185 Registering property (rank) 166 Trading across borders (rank) 182 DTF score for starting a business (0–100) 39.98 DTF score for registering property (0–100) 45.92 DTF score for trading across borders (0–100) 10.68 Procedures (number) 9 Procedures (number) 6 Documents to export (number) 8 Time (days) 60 Time (days) 44 Time to export (days) 70 Cost (% of income per capita) 165.6 Cost (% of property value) 15.2 Cost to export (US$ per container) 6,615 Minimum capital (% of income per capita) 201.7 Documents to import (number) 11 Getting credit (rank) 131 Time to import (days) 90 Dealing with construction permits (rank) 123 DTF score for getting credit (0–100) 30.00 Cost to import (US$ per container) 9,025 DTF score for dealing with construction permits (0–100) 66.09 Strength of legal rights index (0–12) 6 Procedures (number) 10 Depth of credit information index (0–8) 0 Enforcing contracts (rank) 149 Time (days) 207 Credit bureau coverage (% of adults) 0.0 DTF score for enforcing contracts (0–100) 45.05 Cost (% of warehouse value) 5.9 Credit registry coverage (% of adults) 2.1 Procedures (number) 41 Time (days) 743 Getting electricity (rank) 174 Protecting minority investors (rank) 146 Cost (% of claim) 45.7 DTF score for getting electricity (0–100) 44.64 DTF score for protecting minority investors (0–100) 42.50 Procedures (number) 6 Extent of conflict of interest regulation index (0–10) 4.0 Resolving insolvency (rank) 152 Time (days) 67 Extent of shareholder governance index (0–10) 4.5 DTF score for resolving insolvency (0–100) 28.13 Cost (% of income per capita) 7,677.5 Strength of minority investor protection index (0–10) 4.3 Time (years) 4.0 Cost (% of estate) 60 Paying taxes (rank) 186 Recovery rate (cents on the dollar) 0.0 DTF score for paying taxes (0–100) 19.54 Strength of insolvency framework index (0–16) 9 Payments (number per year) 54 Time (hours per year) 732 Total tax rate (% of profit) 63.5 CHILE OECD high income GNI per capita (US$) 15,230 Ease of doing business rank (1–189) 41 Overall distance to frontier (DTF) score (0–100) 71.24 Population (m) 17.6 Starting a business (rank) 59 Registering property (rank) 45 Trading across borders (rank) 40 DTF score for starting a business (0–100) 89.83 DTF score for registering property (0–100) 78.96 DTF score for trading across borders (0–100) 82.05 Procedures (number) 7 Procedures (number) 6 Documents to export (number) 5 Time (days) 5.5 Time (days) 28.5 Time to export (days) 15 Cost (% of income per capita) 0.7 Cost (% of property value) 1.2 Cost to export (US$ per container) 910 Minimum capital (% of income per capita) 0.0 Documents to import (number) 5 Getting credit (rank) 71 Time to import (days) 12 Dealing with construction permits (rank) 62 DTF score for getting credit (0–100) 50.00 Cost to import (US$ per container) 860 DTF score for dealing with construction permits (0–100) 76.13 Strength of legal rights index (0–12) 4 Procedures (number) 13 Depth of credit information index (0–8) 6 Enforcing contracts (rank) 64 Time (days) 152 Credit bureau coverage (% of adults) 8.8 DTF score for enforcing contracts (0–100) 63.85 Cost (% of warehouse value) 0.7 Credit registry coverage (% of adults) 44.7 Procedures (number) 36 Time (days) 480 Getting electricity (rank) 49 Protecting minority investors (rank) 56 Cost (% of claim) 28.6 DTF score for getting electricity (0–100) 81.34 DTF score for protecting minority investors (0–100) 58.33 Procedures (number) 6 Extent of conflict of interest regulation index (0–10) 6.7 Resolving insolvency (rank) 73 Time (days) 30 Extent of shareholder governance index (0–10) 5.0 DTF score for resolving insolvency (0–100) 47.38 Cost (% of income per capita) 62.1 Strength of minority investor protection index (0–10) 5.8 Time (years) 3.2 Cost (% of estate) 15 Paying taxes (rank) 29 Recovery rate (cents on the dollar) 30.0 DTF score for paying taxes (0–100) 84.50 Strength of insolvency framework index (0–16) 10 Payments (number per year) 7 Time (hours per year) 291 Total tax rate (% of profit) 27.9 CHINA East Asia Pacific GNI per capita (US$) 6,560 Ease of doing business rank (1–189) 90 Overall distance to frontier (DTF) score (0–100) 62.58 Population (m) 1,357.4 Starting a business (rank) 128 Registering property (rank) 37 Trading across borders (rank) 98 DTF score for starting a business (0–100) 77.43 DTF score for registering property (0–100) 80.67 DTF score for trading across borders (0–100) 71.68 Procedures (number) 11 Procedures (number) 4 Documents to export (number) 8 Time (days) 31.4 Time (days) 19.5 Time to export (days) 21 Cost (% of income per capita) 0.9 Cost (% of property value) 3.6 Cost to export (US$ per container) 823 Minimum capital (% of income per capita) 0.0 Documents to import (number) 5 Getting credit (rank) 71 Time to import (days) 24 Dealing with construction permits (rank) 179 DTF score for getting credit (0–100) 50.00 Cost to import (US$ per container) 800 DTF score for dealing with construction permits (0–100) 43.75 Strength of legal rights index (0–12) 4 Procedures (number) 22 Depth of credit information index (0–8) 6 Enforcing contracts (rank) 35 Time (days) 244.3 Credit bureau coverage (% of adults) 0.0 DTF score for enforcing contracts (0–100) 68.21 Cost (% of warehouse value) 7.6 Credit registry coverage (% of adults) 33.2 Procedures (number) 37 Time (days) 452.8 Getting electricity (rank) 124 Protecting minority investors (rank) 132 Cost (% of claim) 16.2 DTF score for getting electricity (0–100) 66.35 DTF score for protecting minority investors (0–100) 45.00 Procedures (number) 5.5 Extent of conflict of interest regulation index (0–10) 5.0 Resolving insolvency (rank) 53 Time (days) 143.2 Extent of shareholder governance index (0–10) 4.0 DTF score for resolving insolvency (0–100) 55.31 Cost (% of income per capita) 459.4 Strength of minority investor protection index (0–10) 4.5 Time (years) 1.7 Cost (% of estate) 22 Paying taxes (rank) 120 Recovery rate (cents on the dollar) 36.0 DTF score for paying taxes (0–100) 67.44 Strength of insolvency framework index (0–16) 11.5 Payments (number per year) 7 Time (hours per year) 261 Total tax rate (% of profit) 64.6 Note: For resolving insolvency, an economy for which “no practice” is recorded for time and cost receives a score of 0 on the strength of insolvency framework index even if its legal framework includes provisions related to insolvency proceedings (liquidation or reorganization). Most indicator sets refer to a case scenario in the largest business city of an economy, except for 11 economies for which the data are a population-weighted average for the 2 largest business cities. See the data notes for more details.
  • 191.
    COUNTRY TABLES 179 Reform making it easier to do business Change making it more difficult to do business COLOMBIA Latin America Caribbean GNI per capita (US$) 7,560 Ease of doing business rank (1–189) 34 Overall distance to frontier (DTF) score (0–100) 72.29 Population (m) 48.3 Starting a business (rank) 84 Registering property (rank) 42 Trading across borders (rank) 93 DTF score for starting a business (0–100) 86.13 DTF score for registering property (0–100) 79.33 DTF score for trading across borders (0–100) 72.69 Procedures (number) 8 Procedures (number) 6 Documents to export (number) 4 Time (days) 11 Time (days) 16 Time to export (days) 14 Cost (% of income per capita) 7.5 Cost (% of property value) 2.0 Cost to export (US$ per container) 2,355 Minimum capital (% of income per capita) 0.0 Documents to import (number) 6 Getting credit (rank) 2 Time to import (days) 13 Dealing with construction permits (rank) 61 DTF score for getting credit (0–100) 95.00 Cost to import (US$ per container) 2,470 DTF score for dealing with construction permits (0–100) 76.45 Strength of legal rights index (0–12) 12 Procedures (number) 10 Depth of credit information index (0–8) 7 Enforcing contracts (rank) 168 Time (days) 73 Credit bureau coverage (% of adults) 87.0 DTF score for enforcing contracts (0–100) 37.66 Cost (% of warehouse value) 7.4 Credit registry coverage (% of adults) 0.0 Procedures (number) 33 Time (days) 1,288 Getting electricity (rank) 92 Protecting minority investors (rank) 10 Cost (% of claim) 47.9 DTF score for getting electricity (0–100) 74.20 DTF score for protecting minority investors (0–100) 71.67 Procedures (number) 5 Extent of conflict of interest regulation index (0–10) 8.0 Resolving insolvency (rank) 30 Time (days) 105 Extent of shareholder governance index (0–10) 6.3 DTF score for resolving insolvency (0–100) 70.00 Cost (% of income per capita) 504.4 Strength of minority investor protection index (0–10) 7.2 Time (years) 1.7 Cost (% of estate) 6 Paying taxes (rank) 146 Recovery rate (cents on the dollar) 72.0 DTF score for paying taxes (0–100) 59.71 Strength of insolvency framework index (0–16) 10 Payments (number per year) 11 Time (hours per year) 239 Total tax rate (% of profit) 75.4 COMOROS Sub-Saharan Africa GNI per capita (US$) 880 Ease of doing business rank (1–189) 159 Overall distance to frontier (DTF) score (0–100) 49.56 Population (m) 0.7 Starting a business (rank) 173 Registering property (rank) 105 Trading across borders (rank) 144 DTF score for starting a business (0–100) 57.65 DTF score for registering property (0–100) 63.83 DTF score for trading across borders (0–100) 59.33 Procedures (number) 8 Procedures (number) 4 Documents to export (number) 9 Time (days) 15 Time (days) 30 Time to export (days) 31 Cost (% of income per capita) 114.0 Cost (% of property value) 10.4 Cost to export (US$ per container) 1,295 Minimum capital (% of income per capita) 226.7 Documents to import (number) 8 Getting credit (rank) 131 Time to import (days) 24 Dealing with construction permits (rank) 31 DTF score for getting credit (0–100) 30.00 Cost to import (US$ per container) 1,295 DTF score for dealing with construction permits (0–100) 81.92 Strength of legal rights index (0–12) 6 Procedures (number) 11 Depth of credit information index (0–8) 0 Enforcing contracts (rank) 177 Time (days) 113 Credit bureau coverage (% of adults) 0.0 DTF score for enforcing contracts (0–100) 33.20 Cost (% of warehouse value) 1.0 Credit registry coverage (% of adults) 0.0 Procedures (number) 43 Time (days) 506 Getting electricity (rank) 81 Protecting minority investors (rank) 122 Cost (% of claim) 89.4 DTF score for getting electricity (0–100) 76.46 DTF score for protecting minority investors (0–100) 45.83 Procedures (number) 3 Extent of conflict of interest regulation index (0–10) 4.7 Resolving insolvency (rank) 189 Time (days) 120 Extent of shareholder governance index (0–10) 4.5 DTF score for resolving insolvency (0–100) 0.00 Cost (% of income per capita) 2,127.9 Strength of minority investor protection index (0–10) 4.6 Time (years) NO PRACTICE Cost (% of estate) NO PRACTICE Paying taxes (rank) 167 Recovery rate (cents on the dollar) 0.0 DTF score for paying taxes (0–100) 47.37 Strength of insolvency framework index (0–16) 0 Payments (number per year) 33 Time (hours per year) 100 Total tax rate (% of profit) 216.5 CONGO, DEM. REP. Sub-Saharan Africa GNI per capita (US$) 400 Ease of doing business rank (1–189) 184 Overall distance to frontier (DTF) score (0–100) 40.60 Population (m) 67.5 Starting a business (rank) 172 Registering property (rank) 142 Trading across borders (rank) 175 DTF score for starting a business (0–100) 58.53 DTF score for registering property (0–100) 55.39 DTF score for trading across borders (0–100) 29.09 Procedures (number) 7 Procedures (number) 7 Documents to export (number) 7 Time (days) 16 Time (days) 44 Time to export (days) 44 Cost (% of income per capita) 30.0 Cost (% of property value) 9.5 Cost to export (US$ per container) 3,365 Minimum capital (% of income per capita) 500.0 Documents to import (number) 10 Getting credit (rank) 131 Time to import (days) 63 Dealing with construction permits (rank) 111 DTF score for getting credit (0–100) 30.00 Cost to import (US$ per container) 4,290 DTF score for dealing with construction permits (0–100) 67.72 Strength of legal rights index (0–12) 6 Procedures (number) 8 Depth of credit information index (0–8) 0 Enforcing contracts (rank) 176 Time (days) 119 Credit bureau coverage (% of adults) 0.0 DTF score for enforcing contracts (0–100) 33.51 Cost (% of warehouse value) 11.6 Credit registry coverage (% of adults) 0.2 Procedures (number) 43 Time (days) 610 Getting electricity (rank) 175 Protecting minority investors (rank) 146 Cost (% of claim) 80.6 DTF score for getting electricity (0–100) 43.19 DTF score for protecting minority investors (0–100) 42.50 Procedures (number) 6 Extent of conflict of interest regulation index (0–10) 4.0 Resolving insolvency (rank) 189 Time (days) 65 Extent of shareholder governance index (0–10) 4.5 DTF score for resolving insolvency (0–100) 0.00 Cost (% of income per capita) 16,191.7 Strength of minority investor protection index (0–10) 4.3 Time (years) NO PRACTICE Cost (% of estate) NO PRACTICE Paying taxes (rank) 168 Recovery rate (cents on the dollar) 0.0 DTF score for paying taxes (0–100) 46.11 Strength of insolvency framework index (0–16) 0 Payments (number per year) 50 Time (hours per year) 316 Total tax rate (% of profit) 54.7 Note: For resolving insolvency, an economy for which “no practice” is recorded for time and cost receives a score of 0 on the strength of insolvency framework index even if its legal framework includes provisions related to insolvency proceedings (liquidation or reorganization). Most indicator sets refer to a case scenario in the largest business city of an economy, except for 11 economies for which the data are a population-weighted average for the 2 largest business cities. See the data notes for more details.
  • 192.
    180 DOING BUSINESS2015 Reform making it easier to do business Change making it more difficult to do business CONGO, REP. Sub-Saharan Africa GNI per capita (US$) 2,660 Ease of doing business rank (1–189) 178 Overall distance to frontier (DTF) score (0–100) 43.29 Population (m) 4.4 Starting a business (rank) 170 Registering property (rank) 168 Trading across borders (rank) 181 DTF score for starting a business (0–100) 60.56 DTF score for registering property (0–100) 44.17 DTF score for trading across borders (0–100) 15.40 Procedures (number) 11 Procedures (number) 6 Documents to export (number) 11 Time (days) 53 Time (days) 55 Time to export (days) 50 Cost (% of income per capita) 52.7 Cost (% of property value) 20.4 Cost to export (US$ per container) 3,795 Minimum capital (% of income per capita) 79.3 Documents to import (number) 10 Getting credit (rank) 104 Time to import (days) 54 Dealing with construction permits (rank) 102 DTF score for getting credit (0–100) 40.00 Cost to import (US$ per container) 7,590 DTF score for dealing with construction permits (0–100) 69.76 Strength of legal rights index (0–12) 6 Procedures (number) 11 Depth of credit information index (0–8) 2 Enforcing contracts (rank) 151 Time (days) 168 Credit bureau coverage (% of adults) 0.0 DTF score for enforcing contracts (0–100) 44.11 Cost (% of warehouse value) 5.2 Credit registry coverage (% of adults) 9.4 Procedures (number) 44 Time (days) 560 Getting electricity (rank) 170 Protecting minority investors (rank) 146 Cost (% of claim) 53.2 DTF score for getting electricity (0–100) 47.01 DTF score for protecting minority investors (0–100) 42.50 Procedures (number) 6 Extent of conflict of interest regulation index (0–10) 4.0 Resolving insolvency (rank) 117 Time (days) 135 Extent of shareholder governance index (0–10) 4.5 DTF score for resolving insolvency (0–100) 37.75 Cost (% of income per capita) 4,705.2 Strength of minority investor protection index (0–10) 4.3 Time (years) 3.3 Cost (% of estate) 25 Paying taxes (rank) 182 Recovery rate (cents on the dollar) 17.9 DTF score for paying taxes (0–100) 31.67 Strength of insolvency framework index (0–16) 9 Payments (number per year) 49 Time (hours per year) 602 Total tax rate (% of profit) 55.2 COSTA RICA Latin America Caribbean GNI per capita (US$) 9,550 Ease of doing business rank (1–189) 83 Overall distance to frontier (DTF) score (0–100) 63.67 Population (m) 4.9 Starting a business (rank) 118 Registering property (rank) 47 Trading across borders (rank) 47 DTF score for starting a business (0–100) 80.90 DTF score for registering property (0–100) 78.40 DTF score for trading across borders (0–100) 80.84 Procedures (number) 9 Procedures (number) 5 Documents to export (number) 5 Time (days) 24 Time (days) 19 Time to export (days) 14 Cost (% of income per capita) 11.5 Cost (% of property value) 3.4 Cost to export (US$ per container) 1,020 Minimum capital (% of income per capita) 0.0 Documents to import (number) 5 Getting credit (rank) 89 Time to import (days) 14 Dealing with construction permits (rank) 52 DTF score for getting credit (0–100) 45.00 Cost to import (US$ per container) 1,070 DTF score for dealing with construction permits (0–100) 78.14 Strength of legal rights index (0–12) 2 Procedures (number) 13 Depth of credit information index (0–8) 7 Enforcing contracts (rank) 129 Time (days) 113 Credit bureau coverage (% of adults) 100.0 DTF score for enforcing contracts (0–100) 51.13 Cost (% of warehouse value) 1.7 Credit registry coverage (% of adults) 27.4 Procedures (number) 40 Time (days) 852 Getting electricity (rank) 46 Protecting minority investors (rank) 181 Cost (% of claim) 24.3 DTF score for getting electricity (0–100) 82.72 DTF score for protecting minority investors (0–100) 28.33 Procedures (number) 5 Extent of conflict of interest regulation index (0–10) 3.3 Resolving insolvency (rank) 89 Time (days) 55 Extent of shareholder governance index (0–10) 2.3 DTF score for resolving insolvency (0–100) 43.95 Cost (% of income per capita) 196.2 Strength of minority investor protection index (0–10) 2.8 Time (years) 3.0 Cost (% of estate) 15 Paying taxes (rank) 121 Recovery rate (cents on the dollar) 26.5 DTF score for paying taxes (0–100) 67.27 Strength of insolvency framework index (0–16) 9.5 Payments (number per year) 23 Time (hours per year) 163 Total tax rate (% of profit) 58.0 CÔTE D’IVOIRE Sub-Saharan Africa GNI per capita (US$) 1,380 Ease of doing business rank (1–189) 147 Overall distance to frontier (DTF) score (0–100) 52.26 Population (m) 20.3 Starting a business (rank) 44 Registering property (rank) 124 Trading across borders (rank) 158 DTF score for starting a business (0–100) 91.24 DTF score for registering property (0–100) 60.05 DTF score for trading across borders (0–100) 50.54 Procedures (number) 4 Procedures (number) 6 Documents to export (number) 9 Time (days) 7 Time (days) 30 Time to export (days) 25 Cost (% of income per capita) 20.0 Cost (% of property value) 9.6 Cost to export (US$ per container) 1,390 Minimum capital (% of income per capita) 3.4 Documents to import (number) 13 Getting credit (rank) 131 Time to import (days) 32 Dealing with construction permits (rank) 180 DTF score for getting credit (0–100) 30.00 Cost to import (US$ per container) 1,960 DTF score for dealing with construction permits (0–100) 43.50 Strength of legal rights index (0–12) 6 Procedures (number) 23 Depth of credit information index (0–8) 0 Enforcing contracts (rank) 72 Time (days) 347 Credit bureau coverage (% of adults) 0.0 DTF score for enforcing contracts (0–100) 61.88 Cost (% of warehouse value) 1.0 Credit registry coverage (% of adults) 3.2 Procedures (number) 32 Time (days) 525 Getting electricity (rank) 161 Protecting minority investors (rank) 146 Cost (% of claim) 41.7 DTF score for getting electricity (0–100) 55.24 DTF score for protecting minority investors (0–100) 42.50 Procedures (number) 8 Extent of conflict of interest regulation index (0–10) 4.0 Resolving insolvency (rank) 85 Time (days) 55 Extent of shareholder governance index (0–10) 4.5 DTF score for resolving insolvency (0–100) 44.97 Cost (% of income per capita) 2,824.4 Strength of minority investor protection index (0–10) 4.3 Time (years) 2.2 Cost (% of estate) 18 Paying taxes (rank) 175 Recovery rate (cents on the dollar) 31.3 DTF score for paying taxes (0–100) 42.73 Strength of insolvency framework index (0–16) 9 Payments (number per year) 63 Time (hours per year) 270 Total tax rate (% of profit) 51.9 Note: For resolving insolvency, an economy for which “no practice” is recorded for time and cost receives a score of 0 on the strength of insolvency framework index even if its legal framework includes provisions related to insolvency proceedings (liquidation or reorganization). Most indicator sets refer to a case scenario in the largest business city of an economy, except for 11 economies for which the data are a population-weighted average for the 2 largest business cities. See the data notes for more details.
  • 193.
    COUNTRY TABLES 181 Reform making it easier to do business Change making it more difficult to do business CROATIA Europe Central Asia GNI per capita (US$) 13,330 Ease of doing business rank (1–189) 65 Overall distance to frontier (DTF) score (0–100) 66.53 Population (m) 4.3 Starting a business (rank) 88 Registering property (rank) 92 Trading across borders (rank) 86 DTF score for starting a business (0–100) 85.43 DTF score for registering property (0–100) 66.44 DTF score for trading across borders (0–100) 74.25 Procedures (number) 7 Procedures (number) 5 Documents to export (number) 6 Time (days) 15 Time (days) 72 Time to export (days) 16 Cost (% of income per capita) 3.5 Cost (% of property value) 5.0 Cost to export (US$ per container) 1,335 Minimum capital (% of income per capita) 26.6 Documents to import (number) 7 Getting credit (rank) 61 Time to import (days) 14 Dealing with construction permits (rank) 178 DTF score for getting credit (0–100) 55.00 Cost to import (US$ per container) 1,185 DTF score for dealing with construction permits (0–100) 44.97 Strength of legal rights index (0–12) 5 Procedures (number) 21 Depth of credit information index (0–8) 6 Enforcing contracts (rank) 54 Time (days) 188 Credit bureau coverage (% of adults) 100.0 DTF score for enforcing contracts (0–100) 64.81 Cost (% of warehouse value) 10.9 Credit registry coverage (% of adults) 0.0 Procedures (number) 38 Time (days) 572 Getting electricity (rank) 59 Protecting minority investors (rank) 62 Cost (% of claim) 13.8 DTF score for getting electricity (0–100) 80.05 DTF score for protecting minority investors (0–100) 57.50 Procedures (number) 5 Extent of conflict of interest regulation index (0–10) 5.0 Resolving insolvency (rank) 56 Time (days) 70 Extent of shareholder governance index (0–10) 6.5 DTF score for resolving insolvency (0–100) 53.92 Cost (% of income per capita) 316.7 Strength of minority investor protection index (0–10) 5.8 Time (years) 3.1 Cost (% of estate) 15 Paying taxes (rank) 36 Recovery rate (cents on the dollar) 30.5 DTF score for paying taxes (0–100) 82.92 Strength of insolvency framework index (0–16) 12 Payments (number per year) 19 Time (hours per year) 208 Total tax rate (% of profit) 18.8 CYPRUS Europe Central Asia GNI per capita (US$) 25,190 Ease of doing business rank (1–189) 64 Overall distance to frontier (DTF) score (0–100) 66.55 Population (m) 1.1 Starting a business (rank) 64 Registering property (rank) 112 Trading across borders (rank) 34 DTF score for starting a business (0–100) 89.18 DTF score for registering property (0–100) 61.83 DTF score for trading across borders (0–100) 83.87 Procedures (number) 6 Procedures (number) 6 Documents to export (number) 5 Time (days) 8 Time (days) 8 Time to export (days) 7 Cost (% of income per capita) 12.6 Cost (% of property value) 10.4 Cost to export (US$ per container) 865 Minimum capital (% of income per capita) 0.0 Documents to import (number) 7 Getting credit (rank) 61 Time to import (days) 5 Dealing with construction permits (rank) 148 DTF score for getting credit (0–100) 55.00 Cost to import (US$ per container) 1,010 DTF score for dealing with construction permits (0–100) 60.68 Strength of legal rights index (0–12) 7 Procedures (number) 8 Depth of credit information index (0–8) 4 Enforcing contracts (rank) 113 Time (days) 677 Credit bureau coverage (% of adults) 6.8 DTF score for enforcing contracts (0–100) 54.17 Cost (% of warehouse value) 1.2 Credit registry coverage (% of adults) 0.0 Procedures (number) 43 Time (days) 735 Getting electricity (rank) 160 Protecting minority investors (rank) 14 Cost (% of claim) 16.4 DTF score for getting electricity (0–100) 55.28 DTF score for protecting minority investors (0–100) 68.33 Procedures (number) 5 Extent of conflict of interest regulation index (0–10) 6.7 Resolving insolvency (rank) 51 Time (days) 247 Extent of shareholder governance index (0–10) 7.0 DTF score for resolving insolvency (0–100) 56.68 Cost (% of income per capita) 102.1 Strength of minority investor protection index (0–10) 6.8 Time (years) 1.5 Cost (% of estate) 15 Paying taxes (rank) 50 Recovery rate (cents on the dollar) 70.5 DTF score for paying taxes (0–100) 80.53 Strength of insolvency framework index (0–16) 6 Payments (number per year) 29 Time (hours per year) 146.5 Total tax rate (% of profit) 23.2 CZECH REPUBLIC OECD high income GNI per capita (US$) 18,060 Ease of doing business rank (1–189) 44 Overall distance to frontier (DTF) score (0–100) 70.95 Population (m) 10.5 Starting a business (rank) 110 Registering property (rank) 31 Trading across borders (rank) 58 DTF score for starting a business (0–100) 82.58 DTF score for registering property (0–100) 81.87 DTF score for trading across borders (0–100) 78.33 Procedures (number) 9 Procedures (number) 3 Documents to export (number) 4 Time (days) 19 Time (days) 24 Time to export (days) 17 Cost (% of income per capita) 8.0 Cost (% of property value) 4.0 Cost to export (US$ per container) 1,240 Minimum capital (% of income per capita) 0.0 Documents to import (number) 6 Getting credit (rank) 23 Time to import (days) 17 Dealing with construction permits (rank) 139 DTF score for getting credit (0–100) 70.00 Cost to import (US$ per container) 1,215 DTF score for dealing with construction permits (0–100) 62.91 Strength of legal rights index (0–12) 7 Procedures (number) 24 Depth of credit information index (0–8) 7 Enforcing contracts (rank) 37 Time (days) 143 Credit bureau coverage (% of adults) 76.6 DTF score for enforcing contracts (0–100) 68.00 Cost (% of warehouse value) 0.3 Credit registry coverage (% of adults) 6.4 Procedures (number) 27 Time (days) 611 Getting electricity (rank) 123 Protecting minority investors (rank) 83 Cost (% of claim) 33.0 DTF score for getting electricity (0–100) 66.52 DTF score for protecting minority investors (0–100) 54.17 Procedures (number) 6 Extent of conflict of interest regulation index (0–10) 5.3 Resolving insolvency (rank) 20 Time (days) 129 Extent of shareholder governance index (0–10) 5.5 DTF score for resolving insolvency (0–100) 77.50 Cost (% of income per capita) 175.8 Strength of minority investor protection index (0–10) 5.4 Time (years) 2.1 Cost (% of estate) 17 Paying taxes (rank) 119 Recovery rate (cents on the dollar) 65.6 DTF score for paying taxes (0–100) 67.66 Strength of insolvency framework index (0–16) 13.5 Payments (number per year) 8 Time (hours per year) 413 Total tax rate (% of profit) 48.5 Note: For resolving insolvency, an economy for which “no practice” is recorded for time and cost receives a score of 0 on the strength of insolvency framework index even if its legal framework includes provisions related to insolvency proceedings (liquidation or reorganization). Most indicator sets refer to a case scenario in the largest business city of an economy, except for 11 economies for which the data are a population-weighted average for the 2 largest business cities. See the data notes for more details.
  • 194.
    182 DOING BUSINESS2015 Reform making it easier to do business Change making it more difficult to do business DENMARK OECD high income GNI per capita (US$) 61,110 Ease of doing business rank (1–189) 4 Overall distance to frontier (DTF) score (0–100) 84.20 Population (m) 5.6 Starting a business (rank) 25 Registering property (rank) 8 Trading across borders (rank) 7 DTF score for starting a business (0–100) 93.40 DTF score for registering property (0–100) 92.61 DTF score for trading across borders (0–100) 92.23 Procedures (number) 4 Procedures (number) 3 Documents to export (number) 4 Time (days) 5.5 Time (days) 4 Time to export (days) 6 Cost (% of income per capita) 0.2 Cost (% of property value) 0.6 Cost to export (US$ per container) 795 Minimum capital (% of income per capita) 14.5 Documents to import (number) 3 Getting credit (rank) 23 Time to import (days) 5 Dealing with construction permits (rank) 5 DTF score for getting credit (0–100) 70.00 Cost to import (US$ per container) 745 DTF score for dealing with construction permits (0–100) 89.84 Strength of legal rights index (0–12) 8 Procedures (number) 7 Depth of credit information index (0–8) 6 Enforcing contracts (rank) 34 Time (days) 64 Credit bureau coverage (% of adults) 7.8 DTF score for enforcing contracts (0–100) 68.79 Cost (% of warehouse value) 2.3 Credit registry coverage (% of adults) 0.0 Procedures (number) 35 Time (days) 410 Getting electricity (rank) 14 Protecting minority investors (rank) 17 Cost (% of claim) 23.3 DTF score for getting electricity (0–100) 91.07 DTF score for protecting minority investors (0–100) 67.50 Procedures (number) 4 Extent of conflict of interest regulation index (0–10) 6.7 Resolving insolvency (rank) 9 Time (days) 38 Extent of shareholder governance index (0–10) 6.8 DTF score for resolving insolvency (0–100) 84.59 Cost (% of income per capita) 114.9 Strength of minority investor protection index (0–10) 6.8 Time (years) 1.0 Cost (% of estate) 4 Paying taxes (rank) 12 Recovery rate (cents on the dollar) 87.5 DTF score for paying taxes (0–100) 91.94 Strength of insolvency framework index (0–16) 12 Payments (number per year) 10 Time (hours per year) 130 Total tax rate (% of profit) 26.0 DJIBOUTI Middle East North Africa GNI per capita (US$) 1,595 Ease of doing business rank (1–189) 155 Overall distance to frontier (DTF) score (0–100) 50.48 Population (m) 0.9 Starting a business (rank) 163 Registering property (rank) 154 Trading across borders (rank) 56 DTF score for starting a business (0–100) 65.89 DTF score for registering property (0–100) 51.63 DTF score for trading across borders (0–100) 78.65 Procedures (number) 7 Procedures (number) 6 Documents to export (number) 5 Time (days) 14 Time (days) 39 Time to export (days) 20 Cost (% of income per capita) 175.2 Cost (% of property value) 12.8 Cost to export (US$ per container) 885 Minimum capital (% of income per capita) 0.0 Documents to import (number) 5 Getting credit (rank) 180 Time to import (days) 18 Dealing with construction permits (rank) 146 DTF score for getting credit (0–100) 5.00 Cost to import (US$ per container) 910 DTF score for dealing with construction permits (0–100) 61.63 Strength of legal rights index (0–12) 1 Procedures (number) 18 Depth of credit information index (0–8) 0 Enforcing contracts (rank) 171 Time (days) 117 Credit bureau coverage (% of adults) 0.0 DTF score for enforcing contracts (0–100) 37.31 Cost (% of warehouse value) 7.4 Credit registry coverage (% of adults) 0.3 Procedures (number) 40 Time (days) 1,225 Getting electricity (rank) 176 Protecting minority investors (rank) 162 Cost (% of claim) 34.0 DTF score for getting electricity (0–100) 42.21 DTF score for protecting minority investors (0–100) 39.17 Procedures (number) 4 Extent of conflict of interest regulation index (0–10) 2.3 Resolving insolvency (rank) 70 Time (days) 180 Extent of shareholder governance index (0–10) 5.5 DTF score for resolving insolvency (0–100) 48.04 Cost (% of income per capita) 6,988.8 Strength of minority investor protection index (0–10) 3.9 Time (years) 2.3 Cost (% of estate) 11 Paying taxes (rank) 75 Recovery rate (cents on the dollar) 37.0 DTF score for paying taxes (0–100) 75.26 Strength of insolvency framework index (0–16) 9 Payments (number per year) 35 Time (hours per year) 82 Total tax rate (% of profit) 37.3 DOMINICA Latin America Caribbean GNI per capita (US$) 6,760 Ease of doing business rank (1–189) 97 Overall distance to frontier (DTF) score (0–100) 61.37 Population (m) 0.1 Starting a business (rank) 63 Registering property (rank) 149 Trading across borders (rank) 88 DTF score for starting a business (0–100) 89.27 DTF score for registering property (0–100) 52.86 DTF score for trading across borders (0–100) 74.03 Procedures (number) 5 Procedures (number) 5 Documents to export (number) 6 Time (days) 12 Time (days) 42 Time to export (days) 13 Cost (% of income per capita) 15.7 Cost (% of property value) 13.3 Cost to export (US$ per container) 990 Minimum capital (% of income per capita) 0.0 Documents to import (number) 8 Getting credit (rank) 131 Time to import (days) 14 Dealing with construction permits (rank) 43 DTF score for getting credit (0–100) 30.00 Cost to import (US$ per container) 1,600 DTF score for dealing with construction permits (0–100) 78.79 Strength of legal rights index (0–12) 6 Procedures (number) 10 Depth of credit information index (0–8) 0 Enforcing contracts (rank) 148 Time (days) 175 Credit bureau coverage (% of adults) 0.0 DTF score for enforcing contracts (0–100) 45.17 Cost (% of warehouse value) 0.1 Credit registry coverage (% of adults) 0.0 Procedures (number) 46 Time (days) 681 Getting electricity (rank) 53 Protecting minority investors (rank) 87 Cost (% of claim) 36.0 DTF score for getting electricity (0–100) 80.67 DTF score for protecting minority investors (0–100) 53.33 Procedures (number) 5 Extent of conflict of interest regulation index (0–10) 6.7 Resolving insolvency (rank) 121 Time (days) 61 Extent of shareholder governance index (0–10) 4.0 DTF score for resolving insolvency (0–100) 37.09 Cost (% of income per capita) 483.0 Strength of minority investor protection index (0–10) 5.3 Time (years) 4.0 Cost (% of estate) 10 Paying taxes (rank) 94 Recovery rate (cents on the dollar) 28.3 DTF score for paying taxes (0–100) 72.49 Strength of insolvency framework index (0–16) 7 Payments (number per year) 37 Time (hours per year) 117 Total tax rate (% of profit) 37.0 Note: For resolving insolvency, an economy for which “no practice” is recorded for time and cost receives a score of 0 on the strength of insolvency framework index even if its legal framework includes provisions related to insolvency proceedings (liquidation or reorganization). Most indicator sets refer to a case scenario in the largest business city of an economy, except for 11 economies for which the data are a population-weighted average for the 2 largest business cities. See the data notes for more details.
  • 195.
    COUNTRY TABLES 183 Reform making it easier to do business Change making it more difficult to do business DOMINICAN REPUBLIC Latin America Caribbean GNI per capita (US$) 5,620 Ease of doing business rank (1–189) 84 Overall distance to frontier (DTF) score (0–100) 63.43 Population (m) 10.4 Starting a business (rank) 113 Registering property (rank) 82 Trading across borders (rank) 24 DTF score for starting a business (0–100) 81.60 DTF score for registering property (0–100) 69.90 DTF score for trading across borders (0–100) 85.56 Procedures (number) 7 Procedures (number) 6 Documents to export (number) 4 Time (days) 19.5 Time (days) 51 Time to export (days) 8 Cost (% of income per capita) 16.9 Cost (% of property value) 3.7 Cost to export (US$ per container) 1,040 Minimum capital (% of income per capita) 43.0 Documents to import (number) 5 Getting credit (rank) 89 Time to import (days) 10 Dealing with construction permits (rank) 96 DTF score for getting credit (0–100) 45.00 Cost to import (US$ per container) 1,145 DTF score for dealing with construction permits (0–100) 70.88 Strength of legal rights index (0–12) 1 Procedures (number) 13 Depth of credit information index (0–8) 8 Enforcing contracts (rank) 73 Time (days) 184 Credit bureau coverage (% of adults) 63.1 DTF score for enforcing contracts (0–100) 61.87 Cost (% of warehouse value) 2.0 Credit registry coverage (% of adults) 38.1 Procedures (number) 34 Time (days) 460 Getting electricity (rank) 119 Protecting minority investors (rank) 83 Cost (% of claim) 40.9 DTF score for getting electricity (0–100) 67.36 DTF score for protecting minority investors (0–100) 54.17 Procedures (number) 7 Extent of conflict of interest regulation index (0–10) 5.3 Resolving insolvency (rank) 158 Time (days) 82 Extent of shareholder governance index (0–10) 5.5 DTF score for resolving insolvency (0–100) 23.75 Cost (% of income per capita) 276.9 Strength of minority investor protection index (0–10) 5.4 Time (years) 3.5 Cost (% of estate) 38 Paying taxes (rank) 80 Recovery rate (cents on the dollar) 9.3 DTF score for paying taxes (0–100) 74.24 Strength of insolvency framework index (0–16) 6 Payments (number per year) 9 Time (hours per year) 324 Total tax rate (% of profit) 43.4 ECUADOR Latin America Caribbean GNI per capita (US$) 5,510 Ease of doing business rank (1–189) 115 Overall distance to frontier (DTF) score (0–100) 58.88 Population (m) 15.7 Starting a business (rank) 165 Registering property (rank) 80 Trading across borders (rank) 114 DTF score for starting a business (0–100) 65.31 DTF score for registering property (0–100) 70.21 DTF score for trading across borders (0–100) 68.23 Procedures (number) 13 Procedures (number) 8 Documents to export (number) 7 Time (days) 55.5 Time (days) 39 Time to export (days) 19 Cost (% of income per capita) 24.0 Cost (% of property value) 1.9 Cost to export (US$ per container) 1,535 Minimum capital (% of income per capita) 3.5 Documents to import (number) 6 Getting credit (rank) 89 Time to import (days) 24 Dealing with construction permits (rank) 59 DTF score for getting credit (0–100) 45.00 Cost to import (US$ per container) 1,520 DTF score for dealing with construction permits (0–100) 76.86 Strength of legal rights index (0–12) 1 Procedures (number) 15 Depth of credit information index (0–8) 8 Enforcing contracts (rank) 88 Time (days) 114 Credit bureau coverage (% of adults) 73.0 DTF score for enforcing contracts (0–100) 58.30 Cost (% of warehouse value) 0.8 Credit registry coverage (% of adults) 0.0 Procedures (number) 39 Time (days) 588 Getting electricity (rank) 120 Protecting minority investors (rank) 117 Cost (% of claim) 27.2 DTF score for getting electricity (0–100) 67.03 DTF score for protecting minority investors (0–100) 46.67 Procedures (number) 7 Extent of conflict of interest regulation index (0–10) 4.3 Resolving insolvency (rank) 151 Time (days) 74 Extent of shareholder governance index (0–10) 5.0 DTF score for resolving insolvency (0–100) 28.36 Cost (% of income per capita) 638.5 Strength of minority investor protection index (0–10) 4.7 Time (years) 5.3 Cost (% of estate) 18 Paying taxes (rank) 138 Recovery rate (cents on the dollar) 17.9 DTF score for paying taxes (0–100) 62.84 Strength of insolvency framework index (0–16) 6 Payments (number per year) 8 Time (hours per year) 654 Total tax rate (% of profit) 33.0 EGYPT, ARAB REP. Middle East North Africa GNI per capita (US$) 3,160 Ease of doing business rank (1–189) 112 Overall distance to frontier (DTF) score (0–100) 59.54 Population (m) 82.1 Starting a business (rank) 73 Registering property (rank) 84 Trading across borders (rank) 99 DTF score for starting a business (0–100) 88.14 DTF score for registering property (0–100) 69.13 DTF score for trading across borders (0–100) 71.56 Procedures (number) 7 Procedures (number) 8 Documents to export (number) 8 Time (days) 8 Time (days) 63 Time to export (days) 12 Cost (% of income per capita) 9.2 Cost (% of property value) 0.7 Cost to export (US$ per container) 625 Minimum capital (% of income per capita) 0.0 Documents to import (number) 10 Getting credit (rank) 71 Time to import (days) 15 Dealing with construction permits (rank) 142 DTF score for getting credit (0–100) 50.00 Cost to import (US$ per container) 790 DTF score for dealing with construction permits (0–100) 62.06 Strength of legal rights index (0–12) 2 Procedures (number) 20 Depth of credit information index (0–8) 8 Enforcing contracts (rank) 152 Time (days) 179 Credit bureau coverage (% of adults) 21.8 DTF score for enforcing contracts (0–100) 44.02 Cost (% of warehouse value) 1.9 Credit registry coverage (% of adults) 5.8 Procedures (number) 42 Time (days) 1,010 Getting electricity (rank) 106 Protecting minority investors (rank) 135 Cost (% of claim) 26.2 DTF score for getting electricity (0–100) 71.31 DTF score for protecting minority investors (0–100) 44.17 Procedures (number) 7 Extent of conflict of interest regulation index (0–10) 4.7 Resolving insolvency (rank) 126 Time (days) 54 Extent of shareholder governance index (0–10) 4.2 DTF score for resolving insolvency (0–100) 36.17 Cost (% of income per capita) 304.6 Strength of minority investor protection index (0–10) 4.4 Time (years) 2.5 Cost (% of estate) 22 Paying taxes (rank) 149 Recovery rate (cents on the dollar) 26.6 DTF score for paying taxes (0–100) 58.84 Strength of insolvency framework index (0–16) 7 Payments (number per year) 29 Time (hours per year) 392 Total tax rate (% of profit) 45.0 Note: For resolving insolvency, an economy for which “no practice” is recorded for time and cost receives a score of 0 on the strength of insolvency framework index even if its legal framework includes provisions related to insolvency proceedings (liquidation or reorganization). Most indicator sets refer to a case scenario in the largest business city of an economy, except for 11 economies for which the data are a population-weighted average for the 2 largest business cities. See the data notes for more details.
  • 196.
    184 DOING BUSINESS2015 Reform making it easier to do business Change making it more difficult to do business EL SALVADOR Latin America Caribbean GNI per capita (US$) 3,720 Ease of doing business rank (1–189) 109 Overall distance to frontier (DTF) score (0–100) 59.93 Population (m) 6.3 Starting a business (rank) 121 Registering property (rank) 56 Trading across borders (rank) 73 DTF score for starting a business (0–100) 79.87 DTF score for registering property (0–100) 75.65 DTF score for trading across borders (0–100) 76.01 Procedures (number) 8 Procedures (number) 5 Documents to export (number) 7 Time (days) 16.5 Time (days) 31 Time to export (days) 13 Cost (% of income per capita) 45.2 Cost (% of property value) 3.8 Cost to export (US$ per container) 1,045 Minimum capital (% of income per capita) 2.7 Documents to import (number) 7 Getting credit (rank) 71 Time to import (days) 10 Dealing with construction permits (rank) 155 DTF score for getting credit (0–100) 50.00 Cost to import (US$ per container) 1,035 DTF score for dealing with construction permits (0–100) 57.19 Strength of legal rights index (0–12) 3 Procedures (number) 25 Depth of credit information index (0–8) 7 Enforcing contracts (rank) 82 Time (days) 115 Credit bureau coverage (% of adults) 32.0 DTF score for enforcing contracts (0–100) 60.06 Cost (% of warehouse value) 4.6 Credit registry coverage (% of adults) 28.2 Procedures (number) 35 Time (days) 786 Getting electricity (rank) 144 Protecting minority investors (rank) 154 Cost (% of claim) 19.2 DTF score for getting electricity (0–100) 60.56 DTF score for protecting minority investors (0–100) 41.67 Procedures (number) 8 Extent of conflict of interest regulation index (0–10) 3.3 Resolving insolvency (rank) 79 Time (days) 83 Extent of shareholder governance index (0–10) 5.0 DTF score for resolving insolvency (0–100) 46.02 Cost (% of income per capita) 543.8 Strength of minority investor protection index (0–10) 4.2 Time (years) 3.5 Cost (% of estate) 12 Paying taxes (rank) 161 Recovery rate (cents on the dollar) 33.2 DTF score for paying taxes (0–100) 52.31 Strength of insolvency framework index (0–16) 9 Payments (number per year) 53 Time (hours per year) 320 Total tax rate (% of profit) 38.7 EQUATORIAL GUINEA Sub-Saharan Africa GNI per capita (US$) 14,320 Ease of doing business rank (1–189) 165 Overall distance to frontier (DTF) score (0–100) 49.01 Population (m) 0.8 Starting a business (rank) 186 Registering property (rank) 145 Trading across borders (rank) 143 DTF score for starting a business (0–100) 36.74 DTF score for registering property (0–100) 54.82 DTF score for trading across borders (0–100) 59.67 Procedures (number) 18 Procedures (number) 6 Documents to export (number) 7 Time (days) 135 Time (days) 23 Time to export (days) 29 Cost (% of income per capita) 99.0 Cost (% of property value) 12.5 Cost to export (US$ per container) 1,390 Minimum capital (% of income per capita) 14.3 Documents to import (number) 6 Getting credit (rank) 104 Time to import (days) 44 Dealing with construction permits (rank) 94 DTF score for getting credit (0–100) 40.00 Cost to import (US$ per container) 1,600 DTF score for dealing with construction permits (0–100) 71.20 Strength of legal rights index (0–12) 6 Procedures (number) 13 Depth of credit information index (0–8) 2 Enforcing contracts (rank) 67 Time (days) 144 Credit bureau coverage (% of adults) 0.0 DTF score for enforcing contracts (0–100) 63.23 Cost (% of warehouse value) 4.1 Credit registry coverage (% of adults) 5.1 Procedures (number) 40 Time (days) 475 Getting electricity (rank) 95 Protecting minority investors (rank) 122 Cost (% of claim) 19.5 DTF score for getting electricity (0–100) 73.84 DTF score for protecting minority investors (0–100) 45.83 Procedures (number) 5 Extent of conflict of interest regulation index (0–10) 4.7 Resolving insolvency (rank) 189 Time (days) 106 Extent of shareholder governance index (0–10) 4.5 DTF score for resolving insolvency (0–100) 0.00 Cost (% of income per capita) 557.6 Strength of minority investor protection index (0–10) 4.6 Time (years) NO PRACTICE Cost (% of estate) NO PRACTICE Paying taxes (rank) 171 Recovery rate (cents on the dollar) 0.0 DTF score for paying taxes (0–100) 44.73 Strength of insolvency framework index (0–16) 0 Payments (number per year) 46 Time (hours per year) 492 Total tax rate (% of profit) 44.0 ERITREA Sub-Saharan Africa GNI per capita (US$) 490 Ease of doing business rank (1–189) 189 Overall distance to frontier (DTF) score (0–100) 33.16 Population (m) 6.3 Starting a business (rank) 183 Registering property (rank) 176 Trading across borders (rank) 172 DTF score for starting a business (0–100) 44.81 DTF score for registering property (0–100) 39.78 DTF score for trading across borders (0–100) 32.24 Procedures (number) 13 Procedures (number) 11 Documents to export (number) 10 Time (days) 84 Time (days) 78 Time to export (days) 50 Cost (% of income per capita) 41.5 Cost (% of property value) 9.1 Cost to export (US$ per container) 1,850 Minimum capital (% of income per capita) 182.1 Documents to import (number) 12 Getting credit (rank) 185 Time to import (days) 59 Dealing with construction permits (rank) 189 DTF score for getting credit (0–100) 0.00 Cost to import (US$ per container) 2,000 DTF score for dealing with construction permits (0–100) 0.00 Strength of legal rights index (0–12) 0 Procedures (number) NO PRACTICE Depth of credit information index (0–8) 0 Enforcing contracts (rank) 68 Time (days) NO PRACTICE Credit bureau coverage (% of adults) 0.0 DTF score for enforcing contracts (0–100) 62.70 Cost (% of warehouse value) NO PRACTICE Credit registry coverage (% of adults) 0.0 Procedures (number) 39 Time (days) 490 Getting electricity (rank) 113 Protecting minority investors (rank) 166 Cost (% of claim) 22.6 DTF score for getting electricity (0–100) 70.28 DTF score for protecting minority investors (0–100) 38.33 Procedures (number) 5 Extent of conflict of interest regulation index (0–10) 4.7 Resolving insolvency (rank) 189 Time (days) 59 Extent of shareholder governance index (0–10) 3.0 DTF score for resolving insolvency (0–100) 0.00 Cost (% of income per capita) 3,078.5 Strength of minority investor protection index (0–10) 3.8 Time (years) NO PRACTICE Cost (% of estate) NO PRACTICE Paying taxes (rank) 174 Recovery rate (cents on the dollar) 0.0 DTF score for paying taxes (0–100) 43.49 Strength of insolvency framework index (0–16) 0 Payments (number per year) 30 Time (hours per year) 216 Total tax rate (% of profit) 83.7 Note: For resolving insolvency, an economy for which “no practice” is recorded for time and cost receives a score of 0 on the strength of insolvency framework index even if its legal framework includes provisions related to insolvency proceedings (liquidation or reorganization). Most indicator sets refer to a case scenario in the largest business city of an economy, except for 11 economies for which the data are a population-weighted average for the 2 largest business cities. See the data notes for more details.
  • 197.
    COUNTRY TABLES 185 Reform making it easier to do business Change making it more difficult to do business ESTONIA OECD high income GNI per capita (US$) 17,370 Ease of doing business rank (1–189) 17 Overall distance to frontier (DTF) score (0–100) 78.84 Population (m) 1.3 Starting a business (rank) 26 Registering property (rank) 13 Trading across borders (rank) 6 DTF score for starting a business (0–100) 93.25 DTF score for registering property (0–100) 90.88 DTF score for trading across borders (0–100) 92.76 Procedures (number) 4 Procedures (number) 3 Documents to export (number) 3 Time (days) 4.5 Time (days) 17.5 Time to export (days) 6 Cost (% of income per capita) 1.4 Cost (% of property value) 0.4 Cost to export (US$ per container) 765 Minimum capital (% of income per capita) 18.6 Documents to import (number) 4 Getting credit (rank) 23 Time to import (days) 5 Dealing with construction permits (rank) 20 DTF score for getting credit (0–100) 70.00 Cost to import (US$ per container) 795 DTF score for dealing with construction permits (0–100) 84.18 Strength of legal rights index (0–12) 7 Procedures (number) 11 Depth of credit information index (0–8) 7 Enforcing contracts (rank) 32 Time (days) 103 Credit bureau coverage (% of adults) 34.2 DTF score for enforcing contracts (0–100) 68.91 Cost (% of warehouse value) 0.3 Credit registry coverage (% of adults) 0.0 Procedures (number) 35 Time (days) 425 Getting electricity (rank) 56 Protecting minority investors (rank) 56 Cost (% of claim) 21.9 DTF score for getting electricity (0–100) 80.27 DTF score for protecting minority investors (0–100) 58.33 Procedures (number) 4 Extent of conflict of interest regulation index (0–10) 5.7 Resolving insolvency (rank) 37 Time (days) 111 Extent of shareholder governance index (0–10) 6.0 DTF score for resolving insolvency (0–100) 64.92 Cost (% of income per capita) 169.2 Strength of minority investor protection index (0–10) 5.8 Time (years) 3.0 Cost (% of estate) 9 Paying taxes (rank) 28 Recovery rate (cents on the dollar) 39.3 DTF score for paying taxes (0–100) 84.93 Strength of insolvency framework index (0–16) 14 Payments (number per year) 7 Time (hours per year) 81 Total tax rate (% of profit) 49.3 ETHIOPIA Sub-Saharan Africa GNI per capita (US$) 470 Ease of doing business rank (1–189) 132 Overall distance to frontier (DTF) score (0–100) 56.31 Population (m) 94.1 Starting a business (rank) 168 Registering property (rank) 104 Trading across borders (rank) 168 DTF score for starting a business (0–100) 63.15 DTF score for registering property (0–100) 64.05 DTF score for trading across borders (0–100) 38.58 Procedures (number) 9 Procedures (number) 10 Documents to export (number) 8 Time (days) 15 Time (days) 41 Time to export (days) 44 Cost (% of income per capita) 89.3 Cost (% of property value) 2.1 Cost to export (US$ per container) 2,380 Minimum capital (% of income per capita) 164.4 Documents to import (number) 11 Getting credit (rank) 165 Time to import (days) 44 Dealing with construction permits (rank) 28 DTF score for getting credit (0–100) 15.00 Cost to import (US$ per container) 2,960 DTF score for dealing with construction permits (0–100) 82.49 Strength of legal rights index (0–12) 3 Procedures (number) 7 Depth of credit information index (0–8) 0 Enforcing contracts (rank) 50 Time (days) 125 Credit bureau coverage (% of adults) 0.0 DTF score for enforcing contracts (0–100) 65.43 Cost (% of warehouse value) 3.2 Credit registry coverage (% of adults) 0.2 Procedures (number) 38 Time (days) 530 Getting electricity (rank) 82 Protecting minority investors (rank) 154 Cost (% of claim) 15.2 DTF score for getting electricity (0–100) 76.39 DTF score for protecting minority investors (0–100) 41.67 Procedures (number) 4 Extent of conflict of interest regulation index (0–10) 2.3 Resolving insolvency (rank) 74 Time (days) 95 Extent of shareholder governance index (0–10) 6.0 DTF score for resolving insolvency (0–100) 47.20 Cost (% of income per capita) 1,676.6 Strength of minority investor protection index (0–10) 4.2 Time (years) 1.8 Cost (% of estate) 15 Paying taxes (rank) 112 Recovery rate (cents on the dollar) 38.3 DTF score for paying taxes (0–100) 69.11 Strength of insolvency framework index (0–16) 8.5 Payments (number per year) 30 Time (hours per year) 306 Total tax rate (% of profit) 31.8 FIJI East Asia Pacific GNI per capita (US$) 4,430 Ease of doing business rank (1–189) 81 Overall distance to frontier (DTF) score (0–100) 63.90 Population (m) 0.9 Starting a business (rank) 160 Registering property (rank) 64 Trading across borders (rank) 116 DTF score for starting a business (0–100) 67.79 DTF score for registering property (0–100) 74.15 DTF score for trading across borders (0–100) 68.04 Procedures (number) 11 Procedures (number) 4 Documents to export (number) 8 Time (days) 59 Time (days) 69 Time to export (days) 19 Cost (% of income per capita) 22.5 Cost (% of property value) 3.0 Cost to export (US$ per container) 790 Minimum capital (% of income per capita) 0.0 Documents to import (number) 9 Getting credit (rank) 71 Time to import (days) 22 Dealing with construction permits (rank) 73 DTF score for getting credit (0–100) 50.00 Cost to import (US$ per container) 753 DTF score for dealing with construction permits (0–100) 74.89 Strength of legal rights index (0–12) 5 Procedures (number) 15 Depth of credit information index (0–8) 5 Enforcing contracts (rank) 59 Time (days) 141 Credit bureau coverage (% of adults) 78.9 DTF score for enforcing contracts (0–100) 64.34 Cost (% of warehouse value) 0.4 Credit registry coverage (% of adults) 0.0 Procedures (number) 34 Time (days) 397 Getting electricity (rank) 75 Protecting minority investors (rank) 110 Cost (% of claim) 38.9 DTF score for getting electricity (0–100) 77.97 DTF score for protecting minority investors (0–100) 47.50 Procedures (number) 4 Extent of conflict of interest regulation index (0–10) 5.7 Resolving insolvency (rank) 91 Time (days) 81 Extent of shareholder governance index (0–10) 3.8 DTF score for resolving insolvency (0–100) 43.62 Cost (% of income per capita) 1,784.9 Strength of minority investor protection index (0–10) 4.8 Time (years) 1.8 Cost (% of estate) 10 Paying taxes (rank) 107 Recovery rate (cents on the dollar) 46.2 DTF score for paying taxes (0–100) 70.73 Strength of insolvency framework index (0–16) 6 Payments (number per year) 38 Time (hours per year) 195 Total tax rate (% of profit) 31.1 Note: For resolving insolvency, an economy for which “no practice” is recorded for time and cost receives a score of 0 on the strength of insolvency framework index even if its legal framework includes provisions related to insolvency proceedings (liquidation or reorganization). Most indicator sets refer to a case scenario in the largest business city of an economy, except for 11 economies for which the data are a population-weighted average for the 2 largest business cities. See the data notes for more details.
  • 198.
    186 DOING BUSINESS2015 Reform making it easier to do business Change making it more difficult to do business FINLAND OECD high income GNI per capita (US$) 47,110 Ease of doing business rank (1–189) 9 Overall distance to frontier (DTF) score (0–100) 80.83 Population (m) 5.4 Starting a business (rank) 27 Registering property (rank) 38 Trading across borders (rank) 14 DTF score for starting a business (0–100) 93.10 DTF score for registering property (0–100) 80.58 DTF score for trading across borders (0–100) 89.10 Procedures (number) 3 Procedures (number) 3 Documents to export (number) 4 Time (days) 14 Time (days) 32 Time to export (days) 9 Cost (% of income per capita) 1.1 Cost (% of property value) 4.0 Cost to export (US$ per container) 615 Minimum capital (% of income per capita) 7.0 Documents to import (number) 5 Getting credit (rank) 36 Time to import (days) 7 Dealing with construction permits (rank) 33 DTF score for getting credit (0–100) 65.00 Cost to import (US$ per container) 625 DTF score for dealing with construction permits (0–100) 81.61 Strength of legal rights index (0–12) 7 Procedures (number) 15 Depth of credit information index (0–8) 6 Enforcing contracts (rank) 17 Time (days) 64 Credit bureau coverage (% of adults) 19.6 DTF score for enforcing contracts (0–100) 75.58 Cost (% of warehouse value) 0.8 Credit registry coverage (% of adults) 0.0 Procedures (number) 33 Time (days) 375 Getting electricity (rank) 33 Protecting minority investors (rank) 76 Cost (% of claim) 13.3 DTF score for getting electricity (0–100) 85.29 DTF score for protecting minority investors (0–100) 55.83 Procedures (number) 5 Extent of conflict of interest regulation index (0–10) 6.0 Resolving insolvency (rank) 1 Time (days) 42 Extent of shareholder governance index (0–10) 5.2 DTF score for resolving insolvency (0–100) 93.85 Cost (% of income per capita) 29.7 Strength of minority investor protection index (0–10) 5.6 Time (years) 0.9 Cost (% of estate) 4 Paying taxes (rank) 21 Recovery rate (cents on the dollar) 90.2 DTF score for paying taxes (0–100) 88.36 Strength of insolvency framework index (0–16) 14.5 Payments (number per year) 8 Time (hours per year) 93 Total tax rate (% of profit) 40.0 FRANCE OECD high income GNI per capita (US$) 42,250 Ease of doing business rank (1–189) 31 Overall distance to frontier (DTF) score (0–100) 73.88 Population (m) 66.0 Starting a business (rank) 28 Registering property (rank) 126 Trading across borders (rank) 10 DTF score for starting a business (0–100) 93.00 DTF score for registering property (0–100) 59.36 DTF score for trading across borders (0–100) 90.18 Procedures (number) 5 Procedures (number) 8 Documents to export (number) 2 Time (days) 4.5 Time (days) 49 Time to export (days) 10 Cost (% of income per capita) 0.9 Cost (% of property value) 6.1 Cost to export (US$ per container) 1,335 Minimum capital (% of income per capita) 0.0 Documents to import (number) 2 Getting credit (rank) 71 Time to import (days) 11 Dealing with construction permits (rank) 86 DTF score for getting credit (0–100) 50.00 Cost to import (US$ per container) 1,445 DTF score for dealing with construction permits (0–100) 73.14 Strength of legal rights index (0–12) 4 Procedures (number) 8 Depth of credit information index (0–8) 6 Enforcing contracts (rank) 10 Time (days) 183 Credit bureau coverage (% of adults) 0.0 DTF score for enforcing contracts (0–100) 77.67 Cost (% of warehouse value) 4.7 Credit registry coverage (% of adults) 44.5 Procedures (number) 29 Time (days) 395 Getting electricity (rank) 60 Protecting minority investors (rank) 17 Cost (% of claim) 17.4 DTF score for getting electricity (0–100) 79.87 DTF score for protecting minority investors (0–100) 67.50 Procedures (number) 5 Extent of conflict of interest regulation index (0–10) 5.7 Resolving insolvency (rank) 22 Time (days) 79 Extent of shareholder governance index (0–10) 7.8 DTF score for resolving insolvency (0–100) 75.94 Cost (% of income per capita) 42.9 Strength of minority investor protection index (0–10) 6.8 Time (years) 1.9 Cost (% of estate) 9 Paying taxes (rank) 95 Recovery rate (cents on the dollar) 77.2 DTF score for paying taxes (0–100) 72.12 Strength of insolvency framework index (0–16) 11 Payments (number per year) 8 Time (hours per year) 137 Total tax rate (% of profit) 66.6 GABON Sub-Saharan Africa GNI per capita (US$) 10,650 Ease of doing business rank (1–189) 144 Overall distance to frontier (DTF) score (0–100) 53.43 Population (m) 1.7 Starting a business (rank) 135 Registering property (rank) 181 Trading across borders (rank) 135 DTF score for starting a business (0–100) 75.90 DTF score for registering property (0–100) 36.51 DTF score for trading across borders (0–100) 63.26 Procedures (number) 7 Procedures (number) 6 Documents to export (number) 6 Time (days) 50 Time (days) 103 Time to export (days) 20 Cost (% of income per capita) 12.9 Cost (% of property value) 17.5 Cost to export (US$ per container) 2,145 Minimum capital (% of income per capita) 19.6 Documents to import (number) 8 Getting credit (rank) 104 Time to import (days) 22 Dealing with construction permits (rank) 76 DTF score for getting credit (0–100) 40.00 Cost to import (US$ per container) 2,275 DTF score for dealing with construction permits (0–100) 74.36 Strength of legal rights index (0–12) 6 Procedures (number) 11 Depth of credit information index (0–8) 2 Enforcing contracts (rank) 156 Time (days) 194 Credit bureau coverage (% of adults) 0.0 DTF score for enforcing contracts (0–100) 43.51 Cost (% of warehouse value) 0.9 Credit registry coverage (% of adults) 50.8 Procedures (number) 38 Time (days) 1,070 Getting electricity (rank) 129 Protecting minority investors (rank) 146 Cost (% of claim) 34.3 DTF score for getting electricity (0–100) 64.23 DTF score for protecting minority investors (0–100) 42.50 Procedures (number) 6 Extent of conflict of interest regulation index (0–10) 4.0 Resolving insolvency (rank) 125 Time (days) 141 Extent of shareholder governance index (0–10) 4.5 DTF score for resolving insolvency (0–100) 36.29 Cost (% of income per capita) 311.1 Strength of minority investor protection index (0–10) 4.3 Time (years) 5.0 Cost (% of estate) 15 Paying taxes (rank) 154 Recovery rate (cents on the dollar) 15.2 DTF score for paying taxes (0–100) 57.75 Strength of insolvency framework index (0–16) 9 Payments (number per year) 26 Time (hours per year) 488 Total tax rate (% of profit) 40.6 Note: For resolving insolvency, an economy for which “no practice” is recorded for time and cost receives a score of 0 on the strength of insolvency framework index even if its legal framework includes provisions related to insolvency proceedings (liquidation or reorganization). Most indicator sets refer to a case scenario in the largest business city of an economy, except for 11 economies for which the data are a population-weighted average for the 2 largest business cities. See the data notes for more details.
  • 199.
    COUNTRY TABLES 187 Reform making it easier to do business Change making it more difficult to do business GAMBIA, THE Sub-Saharan Africa GNI per capita (US$) 510 Ease of doing business rank (1–189) 138 Overall distance to frontier (DTF) score (0–100) 54.81 Population (m) 1.8 Starting a business (rank) 159 Registering property (rank) 113 Trading across borders (rank) 77 DTF score for starting a business (0–100) 68.37 DTF score for registering property (0–100) 61.54 DTF score for trading across borders (0–100) 75.52 Procedures (number) 7 Procedures (number) 5 Documents to export (number) 6 Time (days) 26 Time (days) 66 Time to export (days) 19 Cost (% of income per capita) 131.2 Cost (% of property value) 7.6 Cost to export (US$ per container) 1,040 Minimum capital (% of income per capita) 0.0 Documents to import (number) 6 Getting credit (rank) 160 Time to import (days) 19 Dealing with construction permits (rank) 71 DTF score for getting credit (0–100) 20.00 Cost to import (US$ per container) 745 DTF score for dealing with construction permits (0–100) 75.14 Strength of legal rights index (0–12) 4 Procedures (number) 12 Depth of credit information index (0–8) 0 Enforcing contracts (rank) 49 Time (days) 144 Credit bureau coverage (% of adults) 0.0 DTF score for enforcing contracts (0–100) 65.49 Cost (% of warehouse value) 2.5 Credit registry coverage (% of adults) 0.0 Procedures (number) 33 Time (days) 407 Getting electricity (rank) 138 Protecting minority investors (rank) 162 Cost (% of claim) 37.9 DTF score for getting electricity (0–100) 63.05 DTF score for protecting minority investors (0–100) 39.17 Procedures (number) 5 Extent of conflict of interest regulation index (0–10) 4.0 Resolving insolvency (rank) 102 Time (days) 78 Extent of shareholder governance index (0–10) 3.8 DTF score for resolving insolvency (0–100) 41.51 Cost (% of income per capita) 4,166.1 Strength of minority investor protection index (0–10) 3.9 Time (years) 2.0 Cost (% of estate) 15 Paying taxes (rank) 180 Recovery rate (cents on the dollar) 27.8 DTF score for paying taxes (0–100) 38.36 Strength of insolvency framework index (0–16) 8.5 Payments (number per year) 50 Time (hours per year) 376 Total tax rate (% of profit) 63.3 GEORGIA Europe Central Asia GNI per capita (US$) 3,570 Ease of doing business rank (1–189) 15 Overall distance to frontier (DTF) score (0–100) 79.46 Population (m) 4.5 Starting a business (rank) 5 Registering property (rank) 1 Trading across borders (rank) 33 DTF score for starting a business (0–100) 97.73 DTF score for registering property (0–100) 99.88 DTF score for trading across borders (0–100) 84.02 Procedures (number) 2 Procedures (number) 1 Documents to export (number) 4 Time (days) 2 Time (days) 1 Time to export (days) 9 Cost (% of income per capita) 3.4 Cost (% of property value) 0.1 Cost to export (US$ per container) 1,355 Minimum capital (% of income per capita) 0.0 Documents to import (number) 4 Getting credit (rank) 7 Time to import (days) 10 Dealing with construction permits (rank) 3 DTF score for getting credit (0–100) 85.00 Cost to import (US$ per container) 1,595 DTF score for dealing with construction permits (0–100) 91.44 Strength of legal rights index (0–12) 9 Procedures (number) 8 Depth of credit information index (0–8) 8 Enforcing contracts (rank) 23 Time (days) 68.5 Credit bureau coverage (% of adults) 56.8 DTF score for enforcing contracts (0–100) 71.82 Cost (% of warehouse value) 0.3 Credit registry coverage (% of adults) 0.0 Procedures (number) 33 Time (days) 285 Getting electricity (rank) 37 Protecting minority investors (rank) 43 Cost (% of claim) 29.9 DTF score for getting electricity (0–100) 84.69 DTF score for protecting minority investors (0–100) 60.83 Procedures (number) 4 Extent of conflict of interest regulation index (0–10) 7.3 Resolving insolvency (rank) 122 Time (days) 71 Extent of shareholder governance index (0–10) 4.8 DTF score for resolving insolvency (0–100) 36.48 Cost (% of income per capita) 503.8 Strength of minority investor protection index (0–10) 6.1 Time (years) 2.0 Cost (% of estate) 10 Paying taxes (rank) 38 Recovery rate (cents on the dollar) 38.7 DTF score for paying taxes (0–100) 82.76 Strength of insolvency framework index (0–16) 5 Payments (number per year) 5 Time (hours per year) 362 Total tax rate (% of profit) 16.4 GERMANY OECD high income GNI per capita (US$) 46,100 Ease of doing business rank (1–189) 14 Overall distance to frontier (DTF) score (0–100) 79.73 Population (m) 80.6 Starting a business (rank) 114 Registering property (rank) 89 Trading across borders (rank) 18 DTF score for starting a business (0–100) 81.38 DTF score for registering property (0–100) 67.78 DTF score for trading across borders (0–100) 87.67 Procedures (number) 9 Procedures (number) 5 Documents to export (number) 4 Time (days) 14.5 Time (days) 40 Time to export (days) 9 Cost (% of income per capita) 8.8 Cost (% of property value) 6.7 Cost to export (US$ per container) 1,015 Minimum capital (% of income per capita) 35.8 Documents to import (number) 4 Getting credit (rank) 23 Time to import (days) 7 Dealing with construction permits (rank) 8 DTF score for getting credit (0–100) 70.00 Cost to import (US$ per container) 1,050 DTF score for dealing with construction permits (0–100) 87.42 Strength of legal rights index (0–12) 6 Procedures (number) 8 Depth of credit information index (0–8) 8 Enforcing contracts (rank) 13 Time (days) 96 Credit bureau coverage (% of adults) 100.0 DTF score for enforcing contracts (0–100) 76.74 Cost (% of warehouse value) 1.1 Credit registry coverage (% of adults) 1.3 Procedures (number) 31 Time (days) 394 Getting electricity (rank) 3 Protecting minority investors (rank) 51 Cost (% of claim) 14.4 DTF score for getting electricity (0–100) 98.37 DTF score for protecting minority investors (0–100) 59.17 Procedures (number) 3 Extent of conflict of interest regulation index (0–10) 5.0 Resolving insolvency (rank) 3 Time (days) 28 Extent of shareholder governance index (0–10) 6.8 DTF score for resolving insolvency (0–100) 91.78 Cost (% of income per capita) 44.4 Strength of minority investor protection index (0–10) 5.9 Time (years) 1.2 Cost (% of estate) 8 Paying taxes (rank) 68 Recovery rate (cents on the dollar) 83.4 DTF score for paying taxes (0–100) 77.02 Strength of insolvency framework index (0–16) 15 Payments (number per year) 9 Time (hours per year) 218 Total tax rate (% of profit) 48.8 Note: For resolving insolvency, an economy for which “no practice” is recorded for time and cost receives a score of 0 on the strength of insolvency framework index even if its legal framework includes provisions related to insolvency proceedings (liquidation or reorganization). Most indicator sets refer to a case scenario in the largest business city of an economy, except for 11 economies for which the data are a population-weighted average for the 2 largest business cities. See the data notes for more details.
  • 200.
    188 DOING BUSINESS2015 Reform making it easier to do business Change making it more difficult to do business GHANA Sub-Saharan Africa GNI per capita (US$) 1,760 Ease of doing business rank (1–189) 70 Overall distance to frontier (DTF) score (0–100) 65.24 Population (m) 25.9 Starting a business (rank) 96 Registering property (rank) 43 Trading across borders (rank) 120 DTF score for starting a business (0–100) 83.73 DTF score for registering property (0–100) 79.23 DTF score for trading across borders (0–100) 67.10 Procedures (number) 8 Procedures (number) 5 Documents to export (number) 6 Time (days) 14 Time (days) 46 Time to export (days) 19 Cost (% of income per capita) 19.2 Cost (% of property value) 1.1 Cost to export (US$ per container) 875 Minimum capital (% of income per capita) 2.8 Documents to import (number) 7 Getting credit (rank) 36 Time to import (days) 41 Dealing with construction permits (rank) 106 DTF score for getting credit (0–100) 65.00 Cost to import (US$ per container) 1,360 DTF score for dealing with construction permits (0–100) 69.14 Strength of legal rights index (0–12) 7 Procedures (number) 13 Depth of credit information index (0–8) 6 Enforcing contracts (rank) 96 Time (days) 201 Credit bureau coverage (% of adults) 14.1 DTF score for enforcing contracts (0–100) 57.59 Cost (% of warehouse value) 2.0 Credit registry coverage (% of adults) 0.0 Procedures (number) 38 Time (days) 710 Getting electricity (rank) 71 Protecting minority investors (rank) 56 Cost (% of claim) 23.0 DTF score for getting electricity (0–100) 78.29 DTF score for protecting minority investors (0–100) 58.33 Procedures (number) 4 Extent of conflict of interest regulation index (0–10) 6.7 Resolving insolvency (rank) 161 Time (days) 79 Extent of shareholder governance index (0–10) 5.0 DTF score for resolving insolvency (0–100) 22.45 Cost (% of income per capita) 1,778.0 Strength of minority investor protection index (0–10) 5.8 Time (years) 1.9 Cost (% of estate) 22 Paying taxes (rank) 101 Recovery rate (cents on the dollar) 24.3 DTF score for paying taxes (0–100) 71.53 Strength of insolvency framework index (0–16) 3 Payments (number per year) 32 Time (hours per year) 224 Total tax rate (% of profit) 33.3 GREECE OECD high income GNI per capita (US$) 22,530 Ease of doing business rank (1–189) 61 Overall distance to frontier (DTF) score (0–100) 66.70 Population (m) 11.0 Starting a business (rank) 52 Registering property (rank) 116 Trading across borders (rank) 48 DTF score for starting a business (0–100) 90.71 DTF score for registering property (0–100) 61.16 DTF score for trading across borders (0–100) 80.80 Procedures (number) 5 Procedures (number) 10 Documents to export (number) 4 Time (days) 13 Time (days) 20 Time to export (days) 15 Cost (% of income per capita) 2.2 Cost (% of property value) 4.9 Cost to export (US$ per container) 1,040 Minimum capital (% of income per capita) 0.0 Documents to import (number) 6 Getting credit (rank) 71 Time to import (days) 14 Dealing with construction permits (rank) 88 DTF score for getting credit (0–100) 50.00 Cost to import (US$ per container) 1,135 DTF score for dealing with construction permits (0–100) 72.31 Strength of legal rights index (0–12) 3 Procedures (number) 18 Depth of credit information index (0–8) 7 Enforcing contracts (rank) 155 Time (days) 124 Credit bureau coverage (% of adults) 82.5 DTF score for enforcing contracts (0–100) 43.60 Cost (% of warehouse value) 0.6 Credit registry coverage (% of adults) 0.0 Procedures (number) 38 Time (days) 1,580 Getting electricity (rank) 80 Protecting minority investors (rank) 62 Cost (% of claim) 14.4 DTF score for getting electricity (0–100) 76.67 DTF score for protecting minority investors (0–100) 57.50 Procedures (number) 6 Extent of conflict of interest regulation index (0–10) 5.3 Resolving insolvency (rank) 52 Time (days) 62 Extent of shareholder governance index (0–10) 6.2 DTF score for resolving insolvency (0–100) 55.98 Cost (% of income per capita) 69.7 Strength of minority investor protection index (0–10) 5.8 Time (years) 3.5 Cost (% of estate) 9 Paying taxes (rank) 59 Recovery rate (cents on the dollar) 34.3 DTF score for paying taxes (0–100) 78.30 Strength of insolvency framework index (0–16) 12 Payments (number per year) 8 Time (hours per year) 193 Total tax rate (% of profit) 49.9 GRENADA Latin America Caribbean GNI per capita (US$) 7,460 Ease of doing business rank (1–189) 126 Overall distance to frontier (DTF) score (0–100) 57.35 Population (m) 0.1 Starting a business (rank) 80 Registering property (rank) 128 Trading across borders (rank) 51 DTF score for starting a business (0–100) 86.70 DTF score for registering property (0–100) 59.12 DTF score for trading across borders (0–100) 80.22 Procedures (number) 6 Procedures (number) 8 Documents to export (number) 4 Time (days) 15 Time (days) 32 Time to export (days) 9 Cost (% of income per capita) 18.4 Cost (% of property value) 7.4 Cost to export (US$ per container) 1,300 Minimum capital (% of income per capita) 0.0 Documents to import (number) 6 Getting credit (rank) 131 Time to import (days) 9 Dealing with construction permits (rank) 40 DTF score for getting credit (0–100) 30.00 Cost to import (US$ per container) 2,170 DTF score for dealing with construction permits (0–100) 79.00 Strength of legal rights index (0–12) 6 Procedures (number) 13 Depth of credit information index (0–8) 0 Enforcing contracts (rank) 144 Time (days) 128 Credit bureau coverage (% of adults) 0.0 DTF score for enforcing contracts (0–100) 46.25 Cost (% of warehouse value) 0.3 Credit registry coverage (% of adults) 0.0 Procedures (number) 46 Time (days) 688 Getting electricity (rank) 77 Protecting minority investors (rank) 141 Cost (% of claim) 32.6 DTF score for getting electricity (0–100) 77.78 DTF score for protecting minority investors (0–100) 43.33 Procedures (number) 6 Extent of conflict of interest regulation index (0–10) 6.7 Resolving insolvency (rank) 189 Time (days) 49 Extent of shareholder governance index (0–10) 2.0 DTF score for resolving insolvency (0–100) 0.00 Cost (% of income per capita) 257.9 Strength of minority investor protection index (0–10) 4.3 Time (years) NO PRACTICE Cost (% of estate) NO PRACTICE Paying taxes (rank) 106 Recovery rate (cents on the dollar) 0.0 DTF score for paying taxes (0–100) 71.12 Strength of insolvency framework index (0–16) 0 Payments (number per year) 30 Time (hours per year) 140 Total tax rate (% of profit) 45.3 Note: For resolving insolvency, an economy for which “no practice” is recorded for time and cost receives a score of 0 on the strength of insolvency framework index even if its legal framework includes provisions related to insolvency proceedings (liquidation or reorganization). Most indicator sets refer to a case scenario in the largest business city of an economy, except for 11 economies for which the data are a population-weighted average for the 2 largest business cities. See the data notes for more details.
  • 201.
    COUNTRY TABLES 189 Reform making it easier to do business Change making it more difficult to do business GUATEMALA Latin America Caribbean GNI per capita (US$) 3,340 Ease of doing business rank (1–189) 73 Overall distance to frontier (DTF) score (0–100) 64.88 Population (m) 15.5 Starting a business (rank) 98 Registering property (rank) 65 Trading across borders (rank) 102 DTF score for starting a business (0–100) 83.72 DTF score for registering property (0–100) 74.07 DTF score for trading across borders (0–100) 70.10 Procedures (number) 6 Procedures (number) 6 Documents to export (number) 8 Time (days) 18.5 Time (days) 24 Time to export (days) 17 Cost (% of income per capita) 25.8 Cost (% of property value) 3.8 Cost to export (US$ per container) 1,355 Minimum capital (% of income per capita) 18.7 Documents to import (number) 6 Getting credit (rank) 12 Time to import (days) 16 Dealing with construction permits (rank) 122 DTF score for getting credit (0–100) 80.00 Cost to import (US$ per container) 1,445 DTF score for dealing with construction permits (0–100) 66.18 Strength of legal rights index (0–12) 9 Procedures (number) 11 Depth of credit information index (0–8) 7 Enforcing contracts (rank) 143 Time (days) 158 Credit bureau coverage (% of adults) 8.7 DTF score for enforcing contracts (0–100) 46.35 Cost (% of warehouse value) 7.9 Credit registry coverage (% of adults) 19.2 Procedures (number) 31 Time (days) 1,402 Getting electricity (rank) 18 Protecting minority investors (rank) 174 Cost (% of claim) 26.5 DTF score for getting electricity (0–100) 89.28 DTF score for protecting minority investors (0–100) 31.67 Procedures (number) 4 Extent of conflict of interest regulation index (0–10) 3.3 Resolving insolvency (rank) 155 Time (days) 39 Extent of shareholder governance index (0–10) 3.0 DTF score for resolving insolvency (0–100) 27.37 Cost (% of income per capita) 514.6 Strength of minority investor protection index (0–10) 3.2 Time (years) 3.0 Cost (% of estate) 15 Paying taxes (rank) 54 Recovery rate (cents on the dollar) 27.6 DTF score for paying taxes (0–100) 80.04 Strength of insolvency framework index (0–16) 4 Payments (number per year) 8 Time (hours per year) 256 Total tax rate (% of profit) 39.9 GUINEA Sub-Saharan Africa GNI per capita (US$) 460 Ease of doing business rank (1–189) 169 Overall distance to frontier (DTF) score (0–100) 47.42 Population (m) 11.7 Starting a business (rank) 175 Registering property (rank) 122 Trading across borders (rank) 141 DTF score for starting a business (0–100) 55.44 DTF score for registering property (0–100) 60.14 DTF score for trading across borders (0–100) 60.25 Procedures (number) 6 Procedures (number) 6 Documents to export (number) 7 Time (days) 8 Time (days) 44 Time to export (days) 36 Cost (% of income per capita) 82.6 Cost (% of property value) 8.6 Cost to export (US$ per container) 915 Minimum capital (% of income per capita) 416.0 Documents to import (number) 8 Getting credit (rank) 131 Time to import (days) 31 Dealing with construction permits (rank) 159 DTF score for getting credit (0–100) 30.00 Cost to import (US$ per container) 1,480 DTF score for dealing with construction permits (0–100) 55.92 Strength of legal rights index (0–12) 6 Procedures (number) 26 Depth of credit information index (0–8) 0 Enforcing contracts (rank) 133 Time (days) 166 Credit bureau coverage (% of adults) 0.0 DTF score for enforcing contracts (0–100) 49.74 Cost (% of warehouse value) 1.6 Credit registry coverage (% of adults) 0.0 Procedures (number) 49 Time (days) 276 Getting electricity (rank) 154 Protecting minority investors (rank) 162 Cost (% of claim) 45.0 DTF score for getting electricity (0–100) 57.61 DTF score for protecting minority investors (0–100) 39.17 Procedures (number) 4 Extent of conflict of interest regulation index (0–10) 3.3 Resolving insolvency (rank) 119 Time (days) 69 Extent of shareholder governance index (0–10) 4.5 DTF score for resolving insolvency (0–100) 37.62 Cost (% of income per capita) 7,155.6 Strength of minority investor protection index (0–10) 3.9 Time (years) 3.8 Cost (% of estate) 8 Paying taxes (rank) 184 Recovery rate (cents on the dollar) 17.6 DTF score for paying taxes (0–100) 28.27 Strength of insolvency framework index (0–16) 9 Payments (number per year) 57 Time (hours per year) 440 Total tax rate (% of profit) 68.3 GUINEA-BISSAU Sub-Saharan Africa GNI per capita (US$) 520 Ease of doing business rank (1–189) 179 Overall distance to frontier (DTF) score (0–100) 43.21 Population (m) 1.7 Starting a business (rank) 176 Registering property (rank) 160 Trading across borders (rank) 119 DTF score for starting a business (0–100) 54.83 DTF score for registering property (0–100) 48.92 DTF score for trading across borders (0–100) 67.41 Procedures (number) 9 Procedures (number) 8 Documents to export (number) 6 Time (days) 9 Time (days) 51 Time to export (days) 25 Cost (% of income per capita) 50.1 Cost (% of property value) 10.6 Cost to export (US$ per container) 1,448 Minimum capital (% of income per capita) 401.3 Documents to import (number) 6 Getting credit (rank) 131 Time to import (days) 22 Dealing with construction permits (rank) 165 DTF score for getting credit (0–100) 30.00 Cost to import (US$ per container) 2,006 DTF score for dealing with construction permits (0–100) 52.95 Strength of legal rights index (0–12) 6 Procedures (number) 11 Depth of credit information index (0–8) 0 Enforcing contracts (rank) 169 Time (days) 116 Credit bureau coverage (% of adults) 0.0 DTF score for enforcing contracts (0–100) 37.54 Cost (% of warehouse value) 18.2 Credit registry coverage (% of adults) 1.0 Procedures (number) 40 Time (days) 1,715 Getting electricity (rank) 180 Protecting minority investors (rank) 122 Cost (% of claim) 25.0 DTF score for getting electricity (0–100) 35.96 DTF score for protecting minority investors (0–100) 45.83 Procedures (number) 7 Extent of conflict of interest regulation index (0–10) 4.7 Resolving insolvency (rank) 189 Time (days) 455 Extent of shareholder governance index (0–10) 4.5 DTF score for resolving insolvency (0–100) 0.00 Cost (% of income per capita) 2,062.2 Strength of minority investor protection index (0–10) 4.6 Time (years) NO PRACTICE Cost (% of estate) NO PRACTICE Paying taxes (rank) 150 Recovery rate (cents on the dollar) 0.0 DTF score for paying taxes (0–100) 58.65 Strength of insolvency framework index (0–16) 0 Payments (number per year) 46 Time (hours per year) 208 Total tax rate (% of profit) 45.5 Note: For resolving insolvency, an economy for which “no practice” is recorded for time and cost receives a score of 0 on the strength of insolvency framework index even if its legal framework includes provisions related to insolvency proceedings (liquidation or reorganization). Most indicator sets refer to a case scenario in the largest business city of an economy, except for 11 economies for which the data are a population-weighted average for the 2 largest business cities. See the data notes for more details.
  • 202.
    190 DOING BUSINESS2015 Reform making it easier to do business Change making it more difficult to do business GUYANA Latin America Caribbean GNI per capita (US$) 3,750 Ease of doing business rank (1–189) 123 Overall distance to frontier (DTF) score (0–100) 57.83 Population (m) 0.8 Starting a business (rank) 99 Registering property (rank) 103 Trading across borders (rank) 82 DTF score for starting a business (0–100) 83.62 DTF score for registering property (0–100) 64.08 DTF score for trading across borders (0–100) 74.63 Procedures (number) 8 Procedures (number) 6 Documents to export (number) 6 Time (days) 19 Time (days) 75 Time to export (days) 19 Cost (% of income per capita) 11.5 Cost (% of property value) 4.6 Cost to export (US$ per container) 730 Minimum capital (% of income per capita) 0.0 Documents to import (number) 7 Getting credit (rank) 165 Time to import (days) 22 Dealing with construction permits (rank) 38 DTF score for getting credit (0–100) 15.00 Cost to import (US$ per container) 720 DTF score for dealing with construction permits (0–100) 80.06 Strength of legal rights index (0–12) 3 Procedures (number) 7 Depth of credit information index (0–8) 0 Enforcing contracts (rank) 71 Time (days) 195 Credit bureau coverage (% of adults) 0.0 DTF score for enforcing contracts (0–100) 62.37 Cost (% of warehouse value) 0.6 Credit registry coverage (% of adults) 0.0 Procedures (number) 36 Time (days) 581 Getting electricity (rank) 155 Protecting minority investors (rank) 135 Cost (% of claim) 25.2 DTF score for getting electricity (0–100) 57.21 DTF score for protecting minority investors (0–100) 44.17 Procedures (number) 8 Extent of conflict of interest regulation index (0–10) 5.3 Resolving insolvency (rank) 150 Time (days) 109 Extent of shareholder governance index (0–10) 3.5 DTF score for resolving insolvency (0–100) 28.50 Cost (% of income per capita) 442.9 Strength of minority investor protection index (0–10) 4.4 Time (years) 3.0 Cost (% of estate) 29 Paying taxes (rank) 115 Recovery rate (cents on the dollar) 18.1 DTF score for paying taxes (0–100) 68.69 Strength of insolvency framework index (0–16) 6 Payments (number per year) 35 Time (hours per year) 256 Total tax rate (% of profit) 32.3 HAITI Latin America Caribbean GNI per capita (US$) 810 Ease of doing business rank (1–189) 180 Overall distance to frontier (DTF) score (0–100) 42.18 Population (m) 10.3 Starting a business (rank) 188 Registering property (rank) 175 Trading across borders (rank) 142 DTF score for starting a business (0–100) 33.48 DTF score for registering property (0–100) 39.79 DTF score for trading across borders (0–100) 59.98 Procedures (number) 12 Procedures (number) 5 Documents to export (number) 8 Time (days) 97 Time (days) 312 Time to export (days) 28 Cost (% of income per capita) 246.7 Cost (% of property value) 7.1 Cost to export (US$ per container) 1,200 Minimum capital (% of income per capita) 17.6 Documents to import (number) 9 Getting credit (rank) 171 Time to import (days) 26 Dealing with construction permits (rank) 132 DTF score for getting credit (0–100) 10.00 Cost to import (US$ per container) 1,555 DTF score for dealing with construction permits (0–100) 64.42 Strength of legal rights index (0–12) 2 Procedures (number) 8 Depth of credit information index (0–8) 0 Enforcing contracts (rank) 89 Time (days) 71 Credit bureau coverage (% of adults) 0.0 DTF score for enforcing contracts (0–100) 58.28 Cost (% of warehouse value) 16.4 Credit registry coverage (% of adults) 1.1 Procedures (number) 35 Time (days) 530 Getting electricity (rank) 94 Protecting minority investors (rank) 187 Cost (% of claim) 42.6 DTF score for getting electricity (0–100) 73.97 DTF score for protecting minority investors (0–100) 20.00 Procedures (number) 4 Extent of conflict of interest regulation index (0–10) 3.0 Resolving insolvency (rank) 189 Time (days) 60 Extent of shareholder governance index (0–10) 1.0 DTF score for resolving insolvency (0–100) 0.00 Cost (% of income per capita) 3,495.8 Strength of minority investor protection index (0–10) 2.0 Time (years) NO PRACTICE Cost (% of estate) NO PRACTICE Paying taxes (rank) 142 Recovery rate (cents on the dollar) 0.0 DTF score for paying taxes (0–100) 61.87 Strength of insolvency framework index (0–16) 0 Payments (number per year) 47 Time (hours per year) 184 Total tax rate (% of profit) 40.3 HONDURAS Latin America Caribbean GNI per capita (US$) 2,180 Ease of doing business rank (1–189) 104 Overall distance to frontier (DTF) score (0–100) 60.61 Population (m) 8.1 Starting a business (rank) 138 Registering property (rank) 81 Trading across borders (rank) 70 DTF score for starting a business (0–100) 74.84 DTF score for registering property (0–100) 70.09 DTF score for trading across borders (0–100) 76.50 Procedures (number) 12 Procedures (number) 6 Documents to export (number) 5 Time (days) 14 Time (days) 22 Time to export (days) 12 Cost (% of income per capita) 39.0 Cost (% of property value) 5.7 Cost to export (US$ per container) 1,450 Minimum capital (% of income per capita) 11.5 Documents to import (number) 6 Getting credit (rank) 7 Time to import (days) 16 Dealing with construction permits (rank) 103 DTF score for getting credit (0–100) 85.00 Cost to import (US$ per container) 1,630 DTF score for dealing with construction permits (0–100) 69.37 Strength of legal rights index (0–12) 9 Procedures (number) 15 Depth of credit information index (0–8) 8 Enforcing contracts (rank) 166 Time (days) 82 Credit bureau coverage (% of adults) 36.1 DTF score for enforcing contracts (0–100) 37.90 Cost (% of warehouse value) 7.2 Credit registry coverage (% of adults) 21.8 Procedures (number) 47 Time (days) 920 Getting electricity (rank) 110 Protecting minority investors (rank) 174 Cost (% of claim) 35.2 DTF score for getting electricity (0–100) 70.96 DTF score for protecting minority investors (0–100) 31.67 Procedures (number) 7 Extent of conflict of interest regulation index (0–10) 3.3 Resolving insolvency (rank) 140 Time (days) 39 Extent of shareholder governance index (0–10) 3.0 DTF score for resolving insolvency (0–100) 31.83 Cost (% of income per capita) 918.0 Strength of minority investor protection index (0–10) 3.2 Time (years) 3.8 Cost (% of estate) 15 Paying taxes (rank) 153 Recovery rate (cents on the dollar) 18.5 DTF score for paying taxes (0–100) 57.92 Strength of insolvency framework index (0–16) 7 Payments (number per year) 48 Time (hours per year) 224 Total tax rate (% of profit) 43.0 Note: For resolving insolvency, an economy for which “no practice” is recorded for time and cost receives a score of 0 on the strength of insolvency framework index even if its legal framework includes provisions related to insolvency proceedings (liquidation or reorganization). Most indicator sets refer to a case scenario in the largest business city of an economy, except for 11 economies for which the data are a population-weighted average for the 2 largest business cities. See the data notes for more details.
  • 203.
    COUNTRY TABLES 191 Reform making it easier to do business Change making it more difficult to do business HONG KONG SAR, CHINA East Asia Pacific GNI per capita (US$) 38,420 Ease of doing business rank (1–189) 3 Overall distance to frontier (DTF) score (0–100) 84.97 Population (m) 7.2 Starting a business (rank) 8 Registering property (rank) 96 Trading across borders (rank) 2 DTF score for starting a business (0–100) 96.38 DTF score for registering property (0–100) 66.19 DTF score for trading across borders (0–100) 95.36 Procedures (number) 3 Procedures (number) 5 Documents to export (number) 3 Time (days) 2.5 Time (days) 35.5 Time to export (days) 6 Cost (% of income per capita) 1.4 Cost (% of property value) 7.7 Cost to export (US$ per container) 590 Minimum capital (% of income per capita) 0.0 Documents to import (number) 3 Getting credit (rank) 23 Time to import (days) 5 Dealing with construction permits (rank) 1 DTF score for getting credit (0–100) 70.00 Cost to import (US$ per container) 565 DTF score for dealing with construction permits (0–100) 95.53 Strength of legal rights index (0–12) 7 Procedures (number) 5 Depth of credit information index (0–8) 7 Enforcing contracts (rank) 6 Time (days) 66 Credit bureau coverage (% of adults) 96.1 DTF score for enforcing contracts (0–100) 80.32 Cost (% of warehouse value) 0.4 Credit registry coverage (% of adults) 0.0 Procedures (number) 26 Time (days) 360 Getting electricity (rank) 13 Protecting minority investors (rank) 2 Cost (% of claim) 21.2 DTF score for getting electricity (0–100) 91.54 DTF score for protecting minority investors (0–100) 80.83 Procedures (number) 4 Extent of conflict of interest regulation index (0–10) 9.0 Resolving insolvency (rank) 25 Time (days) 38 Extent of shareholder governance index (0–10) 7.2 DTF score for resolving insolvency (0–100) 75.06 Cost (% of income per capita) 1.4 Strength of minority investor protection index (0–10) 8.1 Time (years) 0.8 Cost (% of estate) 5 Paying taxes (rank) 4 Recovery rate (cents on the dollar) 87.2 DTF score for paying taxes (0–100) 98.51 Strength of insolvency framework index (0–16) 9 Payments (number per year) 3 Time (hours per year) 78 Total tax rate (% of profit) 22.8 HUNGARY Europe Central Asia GNI per capita (US$) 12,410 Ease of doing business rank (1–189) 54 Overall distance to frontier (DTF) score (0–100) 68.80 Population (m) 9.9 Starting a business (rank) 57 Registering property (rank) 52 Trading across borders (rank) 72 DTF score for starting a business (0–100) 90.04 DTF score for registering property (0–100) 78.04 DTF score for trading across borders (0–100) 76.48 Procedures (number) 4 Procedures (number) 4 Documents to export (number) 6 Time (days) 5 Time (days) 16.5 Time to export (days) 17 Cost (% of income per capita) 8.3 Cost (% of property value) 5.0 Cost to export (US$ per container) 885 Minimum capital (% of income per capita) 54.0 Documents to import (number) 6 Getting credit (rank) 17 Time to import (days) 19 Dealing with construction permits (rank) 103 DTF score for getting credit (0–100) 75.00 Cost to import (US$ per container) 845 DTF score for dealing with construction permits (0–100) 69.37 Strength of legal rights index (0–12) 10 Procedures (number) 23 Depth of credit information index (0–8) 5 Enforcing contracts (rank) 20 Time (days) 91 Credit bureau coverage (% of adults) 74.6 DTF score for enforcing contracts (0–100) 73.36 Cost (% of warehouse value) 0.2 Credit registry coverage (% of adults) 0.0 Procedures (number) 34 Time (days) 395 Getting electricity (rank) 162 Protecting minority investors (rank) 110 Cost (% of claim) 15.0 DTF score for getting electricity (0–100) 55.10 DTF score for protecting minority investors (0–100) 47.50 Procedures (number) 5 Extent of conflict of interest regulation index (0–10) 4.0 Resolving insolvency (rank) 64 Time (days) 252 Extent of shareholder governance index (0–10) 5.5 DTF score for resolving insolvency (0–100) 49.78 Cost (% of income per capita) 111.5 Strength of minority investor protection index (0–10) 4.8 Time (years) 2.0 Cost (% of estate) 15 Paying taxes (rank) 88 Recovery rate (cents on the dollar) 40.2 DTF score for paying taxes (0–100) 73.27 Strength of insolvency framework index (0–16) 9 Payments (number per year) 11 Time (hours per year) 277 Total tax rate (% of profit) 48.0 ICELAND OECD high income GNI per capita (US$) 43,930 Ease of doing business rank (1–189) 12 Overall distance to frontier (DTF) score (0–100) 80.27 Population (m) 0.3 Starting a business (rank) 31 Registering property (rank) 23 Trading across borders (rank) 39 DTF score for starting a business (0–100) 92.35 DTF score for registering property (0–100) 86.03 DTF score for trading across borders (0–100) 83.23 Procedures (number) 5 Procedures (number) 3 Documents to export (number) 4 Time (days) 4 Time (days) 3.5 Time to export (days) 10 Cost (% of income per capita) 2.4 Cost (% of property value) 3.6 Cost to export (US$ per container) 1,530 Minimum capital (% of income per capita) 9.3 Documents to import (number) 4 Getting credit (rank) 52 Time to import (days) 9 Dealing with construction permits (rank) 56 DTF score for getting credit (0–100) 60.00 Cost to import (US$ per container) 1,620 DTF score for dealing with construction permits (0–100) 77.60 Strength of legal rights index (0–12) 5 Procedures (number) 17 Depth of credit information index (0–8) 7 Enforcing contracts (rank) 3 Time (days) 84 Credit bureau coverage (% of adults) 100.0 DTF score for enforcing contracts (0–100) 82.30 Cost (% of warehouse value) 0.5 Credit registry coverage (% of adults) 0.0 Procedures (number) 27 Time (days) 417 Getting electricity (rank) 9 Protecting minority investors (rank) 28 Cost (% of claim) 9.0 DTF score for getting electricity (0–100) 93.81 DTF score for protecting minority investors (0–100) 65.00 Procedures (number) 4 Extent of conflict of interest regulation index (0–10) 6.7 Resolving insolvency (rank) 15 Time (days) 22 Extent of shareholder governance index (0–10) 6.3 DTF score for resolving insolvency (0–100) 81.47 Cost (% of income per capita) 12.7 Strength of minority investor protection index (0–10) 6.5 Time (years) 1.0 Cost (% of estate) 4 Paying taxes (rank) 46 Recovery rate (cents on the dollar) 84.6 DTF score for paying taxes (0–100) 80.86 Strength of insolvency framework index (0–16) 11.5 Payments (number per year) 26 Time (hours per year) 140 Total tax rate (% of profit) 29.7 Note: For resolving insolvency, an economy for which “no practice” is recorded for time and cost receives a score of 0 on the strength of insolvency framework index even if its legal framework includes provisions related to insolvency proceedings (liquidation or reorganization). Most indicator sets refer to a case scenario in the largest business city of an economy, except for 11 economies for which the data are a population-weighted average for the 2 largest business cities. See the data notes for more details.
  • 204.
    192 DOING BUSINESS2015 Reform making it easier to do business Change making it more difficult to do business INDIA South Asia GNI per capita (US$) 1,570 Ease of doing business rank (1–189) 142 Overall distance to frontier (DTF) score (0–100) 53.97 Population (m) 1,252.1 Starting a business (rank) 158 Registering property (rank) 121 Trading across borders (rank) 126 DTF score for starting a business (0–100) 68.42 DTF score for registering property (0–100) 60.40 DTF score for trading across borders (0–100) 65.47 Procedures (number) 11.9 Procedures (number) 7 Documents to export (number) 7 Time (days) 28.4 Time (days) 47 Time to export (days) 17.1 Cost (% of income per capita) 12.2 Cost (% of property value) 7.0 Cost to export (US$ per container) 1,332 Minimum capital (% of income per capita) 111.2 Documents to import (number) 10 Getting credit (rank) 36 Time to import (days) 21.1 Dealing with construction permits (rank) 184 DTF score for getting credit (0–100) 65.00 Cost to import (US$ per container) 1,462 DTF score for dealing with construction permits (0–100) 30.89 Strength of legal rights index (0–12) 6 Procedures (number) 25.4 Depth of credit information index (0–8) 7 Enforcing contracts (rank) 186 Time (days) 185.9 Credit bureau coverage (% of adults) 22.4 DTF score for enforcing contracts (0–100) 25.81 Cost (% of warehouse value) 28.2 Credit registry coverage (% of adults) 0.0 Procedures (number) 46 Time (days) 1,420 Getting electricity (rank) 137 Protecting minority investors (rank) 7 Cost (% of claim) 39.6 DTF score for getting electricity (0–100) 63.06 DTF score for protecting minority investors (0–100) 72.50 Procedures (number) 7 Extent of conflict of interest regulation index (0–10) 6.7 Resolving insolvency (rank) 137 Time (days) 105.7 Extent of shareholder governance index (0–10) 7.8 DTF score for resolving insolvency (0–100) 32.60 Cost (% of income per capita) 487.7 Strength of minority investor protection index (0–10) 7.3 Time (years) 4.3 Cost (% of estate) 9 Paying taxes (rank) 156 Recovery rate (cents on the dollar) 25.7 DTF score for paying taxes (0–100) 55.53 Strength of insolvency framework index (0–16) 6 Payments (number per year) 33 Time (hours per year) 243 Total tax rate (% of profit) 61.7 INDONESIA East Asia Pacific GNI per capita (US$) 3,580 Ease of doing business rank (1–189) 114 Overall distance to frontier (DTF) score (0–100) 59.15 Population (m) 249.9 Starting a business (rank) 155 Registering property (rank) 117 Trading across borders (rank) 62 DTF score for starting a business (0–100) 68.84 DTF score for registering property (0–100) 60.74 DTF score for trading across borders (0–100) 77.46 Procedures (number) 10 Procedures (number) 5 Documents to export (number) 4 Time (days) 52.5 Time (days) 27.4 Time to export (days) 17 Cost (% of income per capita) 21.1 Cost (% of property value) 10.8 Cost to export (US$ per container) 572 Minimum capital (% of income per capita) 35.5 Documents to import (number) 8 Getting credit (rank) 71 Time to import (days) 26 Dealing with construction permits (rank) 153 DTF score for getting credit (0–100) 50.00 Cost to import (US$ per container) 647 DTF score for dealing with construction permits (0–100) 59.03 Strength of legal rights index (0–12) 4 Procedures (number) 17 Depth of credit information index (0–8) 6 Enforcing contracts (rank) 172 Time (days) 211 Credit bureau coverage (% of adults) 0.0 DTF score for enforcing contracts (0–100) 37.28 Cost (% of warehouse value) 4.3 Credit registry coverage (% of adults) 46.4 Procedures (number) 40 Time (days) 471 Getting electricity (rank) 78 Protecting minority investors (rank) 43 Cost (% of claim) 115.7 DTF score for getting electricity (0–100) 76.90 DTF score for protecting minority investors (0–100) 60.83 Procedures (number) 5 Extent of conflict of interest regulation index (0–10) 6.0 Resolving insolvency (rank) 75 Time (days) 90.7 Extent of shareholder governance index (0–10) 6.2 DTF score for resolving insolvency (0–100) 46.75 Cost (% of income per capita) 353.6 Strength of minority investor protection index (0–10) 6.1 Time (years) 1.9 Cost (% of estate) 22 Paying taxes (rank) 160 Recovery rate (cents on the dollar) 31.7 DTF score for paying taxes (0–100) 53.66 Strength of insolvency framework index (0–16) 9.5 Payments (number per year) 65 Time (hours per year) 253.5 Total tax rate (% of profit) 31.4 IRAN, ISLAMIC REP. Middle East North Africa GNI per capita (US$) 5,780 Ease of doing business rank (1–189) 130 Overall distance to frontier (DTF) score (0–100) 56.51 Population (m) 77.4 Starting a business (rank) 62 Registering property (rank) 161 Trading across borders (rank) 148 DTF score for starting a business (0–100) 89.37 DTF score for registering property (0–100) 48.78 DTF score for trading across borders (0–100) 56.81 Procedures (number) 6 Procedures (number) 9 Documents to export (number) 7 Time (days) 12 Time (days) 35 Time to export (days) 25 Cost (% of income per capita) 3.1 Cost (% of property value) 10.6 Cost to export (US$ per container) 1,350 Minimum capital (% of income per capita) 0.0 Documents to import (number) 11 Getting credit (rank) 89 Time to import (days) 37 Dealing with construction permits (rank) 172 DTF score for getting credit (0–100) 45.00 Cost to import (US$ per container) 1,555 DTF score for dealing with construction permits (0–100) 49.72 Strength of legal rights index (0–12) 2 Procedures (number) 15 Depth of credit information index (0–8) 7 Enforcing contracts (rank) 66 Time (days) 318.5 Credit bureau coverage (% of adults) 33.8 DTF score for enforcing contracts (0–100) 63.35 Cost (% of warehouse value) 5.3 Credit registry coverage (% of adults) 45.0 Procedures (number) 40 Time (days) 505 Getting electricity (rank) 107 Protecting minority investors (rank) 154 Cost (% of claim) 17.0 DTF score for getting electricity (0–100) 71.22 DTF score for protecting minority investors (0–100) 41.67 Procedures (number) 6 Extent of conflict of interest regulation index (0–10) 4.0 Resolving insolvency (rank) 138 Time (days) 77 Extent of shareholder governance index (0–10) 4.3 DTF score for resolving insolvency (0–100) 32.38 Cost (% of income per capita) 865.6 Strength of minority investor protection index (0–10) 4.2 Time (years) 4.5 Cost (% of estate) 15 Paying taxes (rank) 124 Recovery rate (cents on the dollar) 19.5 DTF score for paying taxes (0–100) 66.78 Strength of insolvency framework index (0–16) 7 Payments (number per year) 20 Time (hours per year) 344 Total tax rate (% of profit) 44.1 Note: For resolving insolvency, an economy for which “no practice” is recorded for time and cost receives a score of 0 on the strength of insolvency framework index even if its legal framework includes provisions related to insolvency proceedings (liquidation or reorganization). Most indicator sets refer to a case scenario in the largest business city of an economy, except for 11 economies for which the data are a population-weighted average for the 2 largest business cities. See the data notes for more details.
  • 205.
    COUNTRY TABLES 193 Reform making it easier to do business Change making it more difficult to do business IRAQ Middle East North Africa GNI per capita (US$) 6,710 Ease of doing business rank (1–189) 156 Overall distance to frontier (DTF) score (0–100) 50.36 Population (m) 33.4 Starting a business (rank) 142 Registering property (rank) 109 Trading across borders (rank) 178 DTF score for starting a business (0–100) 74.03 DTF score for registering property (0–100) 62.62 DTF score for trading across borders (0–100) 20.48 Procedures (number) 10 Procedures (number) 5 Documents to export (number) 10 Time (days) 29 Time (days) 51 Time to export (days) 80 Cost (% of income per capita) 38.2 Cost (% of property value) 8.2 Cost to export (US$ per container) 3,550 Minimum capital (% of income per capita) 12.8 Documents to import (number) 10 Getting credit (rank) 180 Time to import (days) 82 Dealing with construction permits (rank) 9 DTF score for getting credit (0–100) 5.00 Cost to import (US$ per container) 3,650 DTF score for dealing with construction permits (0–100) 86.65 Strength of legal rights index (0–12) 1 Procedures (number) 8 Depth of credit information index (0–8) 0 Enforcing contracts (rank) 141 Time (days) 119 Credit bureau coverage (% of adults) 0.0 DTF score for enforcing contracts (0–100) 47.32 Cost (% of warehouse value) 0.3 Credit registry coverage (% of adults) 0.0 Procedures (number) 51 Time (days) 520 Getting electricity (rank) 36 Protecting minority investors (rank) 146 Cost (% of claim) 28.1 DTF score for getting electricity (0–100) 84.95 DTF score for protecting minority investors (0–100) 42.50 Procedures (number) 4 Extent of conflict of interest regulation index (0–10) 4.7 Resolving insolvency (rank) 189 Time (days) 77 Extent of shareholder governance index (0–10) 3.8 DTF score for resolving insolvency (0–100) 0.00 Cost (% of income per capita) 228.9 Strength of minority investor protection index (0–10) 4.3 Time (years) NO PRACTICE Cost (% of estate) NO PRACTICE Paying taxes (rank) 52 Recovery rate (cents on the dollar) 0.0 DTF score for paying taxes (0–100) 80.09 Strength of insolvency framework index (0–16) 0 Payments (number per year) 13 Time (hours per year) 312 Total tax rate (% of profit) 27.8 IRELAND OECD high income GNI per capita (US$) 39,110 Ease of doing business rank (1–189) 13 Overall distance to frontier (DTF) score (0–100) 80.07 Population (m) 4.6 Starting a business (rank) 19 Registering property (rank) 50 Trading across borders (rank) 5 DTF score for starting a business (0–100) 94.17 DTF score for registering property (0–100) 78.34 DTF score for trading across borders (0–100) 93.01 Procedures (number) 4 Procedures (number) 5 Documents to export (number) 2 Time (days) 6 Time (days) 31.5 Time to export (days) 8 Cost (% of income per capita) 0.3 Cost (% of property value) 2.6 Cost to export (US$ per container) 1,160 Minimum capital (% of income per capita) 0.0 Documents to import (number) 2 Getting credit (rank) 23 Time to import (days) 9 Dealing with construction permits (rank) 128 DTF score for getting credit (0–100) 70.00 Cost to import (US$ per container) 1,121 DTF score for dealing with construction permits (0–100) 65.61 Strength of legal rights index (0–12) 7 Procedures (number) 10 Depth of credit information index (0–8) 7 Enforcing contracts (rank) 18 Time (days) 150 Credit bureau coverage (% of adults) 100.0 DTF score for enforcing contracts (0–100) 75.47 Cost (% of warehouse value) 9.5 Credit registry coverage (% of adults) 0.0 Procedures (number) 21 Time (days) 650 Getting electricity (rank) 67 Protecting minority investors (rank) 6 Cost (% of claim) 26.9 DTF score for getting electricity (0–100) 78.84 DTF score for protecting minority investors (0–100) 73.33 Procedures (number) 5 Extent of conflict of interest regulation index (0–10) 8.3 Resolving insolvency (rank) 21 Time (days) 85 Extent of shareholder governance index (0–10) 6.3 DTF score for resolving insolvency (0–100) 76.90 Cost (% of income per capita) 83.3 Strength of minority investor protection index (0–10) 7.3 Time (years) 0.4 Cost (% of estate) 9 Paying taxes (rank) 6 Recovery rate (cents on the dollar) 87.7 DTF score for paying taxes (0–100) 95.07 Strength of insolvency framework index (0–16) 9.5 Payments (number per year) 9 Time (hours per year) 80 Total tax rate (% of profit) 25.9 ISRAEL OECD high income GNI per capita (US$) 34,120 Ease of doing business rank (1–189) 40 Overall distance to frontier (DTF) score (0–100) 71.25 Population (m) 8.1 Starting a business (rank) 53 Registering property (rank) 135 Trading across borders (rank) 12 DTF score for starting a business (0–100) 90.54 DTF score for registering property (0–100) 57.12 DTF score for trading across borders (0–100) 89.39 Procedures (number) 5 Procedures (number) 6 Documents to export (number) 4 Time (days) 13 Time (days) 81 Time to export (days) 10 Cost (% of income per capita) 3.5 Cost (% of property value) 7.3 Cost to export (US$ per container) 620 Minimum capital (% of income per capita) 0.0 Documents to import (number) 4 Getting credit (rank) 36 Time to import (days) 10 Dealing with construction permits (rank) 121 DTF score for getting credit (0–100) 65.00 Cost to import (US$ per container) 565 DTF score for dealing with construction permits (0–100) 66.45 Strength of legal rights index (0–12) 6 Procedures (number) 15 Depth of credit information index (0–8) 7 Enforcing contracts (rank) 111 Time (days) 209 Credit bureau coverage (% of adults) 100.0 DTF score for enforcing contracts (0–100) 54.93 Cost (% of warehouse value) 1.6 Credit registry coverage (% of adults) 0.0 Procedures (number) 35 Time (days) 890 Getting electricity (rank) 109 Protecting minority investors (rank) 11 Cost (% of claim) 25.3 DTF score for getting electricity (0–100) 71.11 DTF score for protecting minority investors (0–100) 70.83 Procedures (number) 6 Extent of conflict of interest regulation index (0–10) 8.3 Resolving insolvency (rank) 24 Time (days) 102 Extent of shareholder governance index (0–10) 5.8 DTF score for resolving insolvency (0–100) 75.21 Cost (% of income per capita) 11.8 Strength of minority investor protection index (0–10) 7.1 Time (years) 2.0 Cost (% of estate) 23 Paying taxes (rank) 97 Recovery rate (cents on the dollar) 61.4 DTF score for paying taxes (0–100) 71.88 Strength of insolvency framework index (0–16) 13.5 Payments (number per year) 33 Time (hours per year) 235 Total tax rate (% of profit) 30.1 Note: For resolving insolvency, an economy for which “no practice” is recorded for time and cost receives a score of 0 on the strength of insolvency framework index even if its legal framework includes provisions related to insolvency proceedings (liquidation or reorganization). Most indicator sets refer to a case scenario in the largest business city of an economy, except for 11 economies for which the data are a population-weighted average for the 2 largest business cities. See the data notes for more details.
  • 206.
    194 DOING BUSINESS2015 Reform making it easier to do business Change making it more difficult to do business ITALY OECD high income GNI per capita (US$) 34,400 Ease of doing business rank (1–189) 56 Overall distance to frontier (DTF) score (0–100) 68.48 Population (m) 59.8 Starting a business (rank) 46 Registering property (rank) 41 Trading across borders (rank) 37 DTF score for starting a business (0–100) 91.22 DTF score for registering property (0–100) 79.44 DTF score for trading across borders (0–100) 83.44 Procedures (number) 5 Procedures (number) 4 Documents to export (number) 3 Time (days) 5 Time (days) 16 Time to export (days) 19 Cost (% of income per capita) 14.1 Cost (% of property value) 4.4 Cost to export (US$ per container) 1,195 Minimum capital (% of income per capita) 0.0 Documents to import (number) 3 Getting credit (rank) 89 Time to import (days) 18 Dealing with construction permits (rank) 116 DTF score for getting credit (0–100) 45.00 Cost to import (US$ per container) 1,145 DTF score for dealing with construction permits (0–100) 67.35 Strength of legal rights index (0–12) 2 Procedures (number) 10 Depth of credit information index (0–8) 7 Enforcing contracts (rank) 147 Time (days) 233 Credit bureau coverage (% of adults) 100.0 DTF score for enforcing contracts (0–100) 45.61 Cost (% of warehouse value) 3.7 Credit registry coverage (% of adults) 24.6 Procedures (number) 37 Time (days) 1,185 Getting electricity (rank) 102 Protecting minority investors (rank) 21 Cost (% of claim) 23.1 DTF score for getting electricity (0–100) 72.65 DTF score for protecting minority investors (0–100) 66.67 Procedures (number) 5 Extent of conflict of interest regulation index (0–10) 6.0 Resolving insolvency (rank) 29 Time (days) 124 Extent of shareholder governance index (0–10) 7.3 DTF score for resolving insolvency (0–100) 71.29 Cost (% of income per capita) 212.6 Strength of minority investor protection index (0–10) 6.7 Time (years) 1.8 Cost (% of estate) 22 Paying taxes (rank) 141 Recovery rate (cents on the dollar) 62.8 DTF score for paying taxes (0–100) 62.13 Strength of insolvency framework index (0–16) 12 Payments (number per year) 15 Time (hours per year) 269 Total tax rate (% of profit) 65.4 JAMAICA Latin America Caribbean GNI per capita (US$) 5,220 Ease of doing business rank (1–189) 58 Overall distance to frontier (DTF) score (0–100) 67.79 Population (m) 2.7 Starting a business (rank) 20 Registering property (rank) 126 Trading across borders (rank) 115 DTF score for starting a business (0–100) 94.13 DTF score for registering property (0–100) 59.36 DTF score for trading across borders (0–100) 68.22 Procedures (number) 2 Procedures (number) 6 Documents to export (number) 6 Time (days) 15 Time (days) 36 Time to export (days) 20 Cost (% of income per capita) 6.0 Cost (% of property value) 9.5 Cost to export (US$ per container) 1,580 Minimum capital (% of income per capita) 0.0 Documents to import (number) 7 Getting credit (rank) 12 Time to import (days) 17 Dealing with construction permits (rank) 26 DTF score for getting credit (0–100) 80.00 Cost to import (US$ per container) 2,180 DTF score for dealing with construction permits (0–100) 83.17 Strength of legal rights index (0–12) 10 Procedures (number) 7 Depth of credit information index (0–8) 6 Enforcing contracts (rank) 117 Time (days) 135 Credit bureau coverage (% of adults) 10.1 DTF score for enforcing contracts (0–100) 53.74 Cost (% of warehouse value) 2.2 Credit registry coverage (% of adults) 0.0 Procedures (number) 35 Time (days) 655 Getting electricity (rank) 111 Protecting minority investors (rank) 71 Cost (% of claim) 45.6 DTF score for getting electricity (0–100) 70.36 DTF score for protecting minority investors (0–100) 56.67 Procedures (number) 6 Extent of conflict of interest regulation index (0–10) 5.7 Resolving insolvency (rank) 59 Time (days) 96 Extent of shareholder governance index (0–10) 5.7 DTF score for resolving insolvency (0–100) 53.29 Cost (% of income per capita) 406.3 Strength of minority investor protection index (0–10) 5.7 Time (years) 1.1 Cost (% of estate) 18 Paying taxes (rank) 147 Recovery rate (cents on the dollar) 64.2 DTF score for paying taxes (0–100) 59.01 Strength of insolvency framework index (0–16) 6 Payments (number per year) 36 Time (hours per year) 368 Total tax rate (% of profit) 39.3 JAPAN OECD high income GNI per capita (US$) 46,140 Ease of doing business rank (1–189) 29 Overall distance to frontier (DTF) score (0–100) 74.80 Population (m) 127.3 Starting a business (rank) 83 Registering property (rank) 73 Trading across borders (rank) 20 DTF score for starting a business (0–100) 86.21 DTF score for registering property (0–100) 71.33 DTF score for trading across borders (0–100) 87.23 Procedures (number) 8 Procedures (number) 6 Documents to export (number) 3 Time (days) 10.7 Time (days) 13 Time to export (days) 11 Cost (% of income per capita) 7.5 Cost (% of property value) 5.8 Cost to export (US$ per container) 829 Minimum capital (% of income per capita) 0.0 Documents to import (number) 5 Getting credit (rank) 71 Time to import (days) 11 Dealing with construction permits (rank) 83 DTF score for getting credit (0–100) 50.00 Cost to import (US$ per container) 1,021 DTF score for dealing with construction permits (0–100) 73.30 Strength of legal rights index (0–12) 4 Procedures (number) 12 Depth of credit information index (0–8) 6 Enforcing contracts (rank) 26 Time (days) 197 Credit bureau coverage (% of adults) 100.0 DTF score for enforcing contracts (0–100) 69.95 Cost (% of warehouse value) 0.6 Credit registry coverage (% of adults) 0.0 Procedures (number) 32 Time (days) 360 Getting electricity (rank) 28 Protecting minority investors (rank) 35 Cost (% of claim) 32.2 DTF score for getting electricity (0–100) 86.51 DTF score for protecting minority investors (0–100) 62.50 Procedures (number) 3.4 Extent of conflict of interest regulation index (0–10) 7.0 Resolving insolvency (rank) 2 Time (days) 97.7 Extent of shareholder governance index (0–10) 5.5 DTF score for resolving insolvency (0–100) 93.74 Cost (% of income per capita) 0.0 Strength of minority investor protection index (0–10) 6.3 Time (years) 0.6 Cost (% of estate) 4 Paying taxes (rank) 122 Recovery rate (cents on the dollar) 92.9 DTF score for paying taxes (0–100) 67.19 Strength of insolvency framework index (0–16) 14 Payments (number per year) 14 Time (hours per year) 330 Total tax rate (% of profit) 51.3 Note: For resolving insolvency, an economy for which “no practice” is recorded for time and cost receives a score of 0 on the strength of insolvency framework index even if its legal framework includes provisions related to insolvency proceedings (liquidation or reorganization). Most indicator sets refer to a case scenario in the largest business city of an economy, except for 11 economies for which the data are a population-weighted average for the 2 largest business cities. See the data notes for more details.
  • 207.
    COUNTRY TABLES 195 Reform making it easier to do business Change making it more difficult to do business JORDAN Middle East North Africa GNI per capita (US$) 4,950 Ease of doing business rank (1–189) 117 Overall distance to frontier (DTF) score (0–100) 58.40 Population (m) 6.5 Starting a business (rank) 86 Registering property (rank) 107 Trading across borders (rank) 54 DTF score for starting a business (0–100) 85.61 DTF score for registering property (0–100) 63.45 DTF score for trading across borders (0–100) 78.92 Procedures (number) 7 Procedures (number) 7 Documents to export (number) 5 Time (days) 12 Time (days) 21 Time to export (days) 12 Cost (% of income per capita) 21.4 Cost (% of property value) 7.5 Cost to export (US$ per container) 825 Minimum capital (% of income per capita) 0.0 Documents to import (number) 7 Getting credit (rank) 185 Time to import (days) 15 Dealing with construction permits (rank) 126 DTF score for getting credit (0–100) 0.00 Cost to import (US$ per container) 1,235 DTF score for dealing with construction permits (0–100) 66.02 Strength of legal rights index (0–12) 0 Procedures (number) 16 Depth of credit information index (0–8) 0 Enforcing contracts (rank) 114 Time (days) 63 Credit bureau coverage (% of adults) 0.0 DTF score for enforcing contracts (0–100) 54.04 Cost (% of warehouse value) 9.5 Credit registry coverage (% of adults) 2.2 Procedures (number) 39 Time (days) 689 Getting electricity (rank) 44 Protecting minority investors (rank) 154 Cost (% of claim) 31.2 DTF score for getting electricity (0–100) 82.95 DTF score for protecting minority investors (0–100) 41.67 Procedures (number) 5 Extent of conflict of interest regulation index (0–10) 3.3 Resolving insolvency (rank) 145 Time (days) 50 Extent of shareholder governance index (0–10) 5.0 DTF score for resolving insolvency (0–100) 30.17 Cost (% of income per capita) 315.9 Strength of minority investor protection index (0–10) 4.2 Time (years) 3.0 Cost (% of estate) 20 Paying taxes (rank) 45 Recovery rate (cents on the dollar) 27.0 DTF score for paying taxes (0–100) 81.19 Strength of insolvency framework index (0–16) 5 Payments (number per year) 25 Time (hours per year) 151 Total tax rate (% of profit) 29.0 KAZAKHSTAN Europe Central Asia GNI per capita (US$) 11,380 Ease of doing business rank (1–189) 77 Overall distance to frontier (DTF) score (0–100) 64.59 Population (m) 17.0 Starting a business (rank) 55 Registering property (rank) 14 Trading across borders (rank) 185 DTF score for starting a business (0–100) 90.19 DTF score for registering property (0–100) 89.83 DTF score for trading across borders (0–100) 7.87 Procedures (number) 6 Procedures (number) 4 Documents to export (number) 10 Time (days) 10 Time (days) 11 Time to export (days) 79 Cost (% of income per capita) 0.5 Cost (% of property value) 0.1 Cost to export (US$ per container) 5,285 Minimum capital (% of income per capita) 0.0 Documents to import (number) 12 Getting credit (rank) 71 Time to import (days) 67 Dealing with construction permits (rank) 154 DTF score for getting credit (0–100) 50.00 Cost to import (US$ per container) 5,265 DTF score for dealing with construction permits (0–100) 58.39 Strength of legal rights index (0–12) 3 Procedures (number) 25 Depth of credit information index (0–8) 7 Enforcing contracts (rank) 30 Time (days) 156 Credit bureau coverage (% of adults) 51.7 DTF score for enforcing contracts (0–100) 69.33 Cost (% of warehouse value) 1.5 Credit registry coverage (% of adults) 0.0 Procedures (number) 36 Time (days) 370 Getting electricity (rank) 97 Protecting minority investors (rank) 25 Cost (% of claim) 22.0 DTF score for getting electricity (0–100) 72.96 DTF score for protecting minority investors (0–100) 65.83 Procedures (number) 6 Extent of conflict of interest regulation index (0–10) 6.7 Resolving insolvency (rank) 63 Time (days) 88 Extent of shareholder governance index (0–10) 6.5 DTF score for resolving insolvency (0–100) 51.45 Cost (% of income per capita) 56.6 Strength of minority investor protection index (0–10) 6.6 Time (years) 1.5 Cost (% of estate) 15 Paying taxes (rank) 17 Recovery rate (cents on the dollar) 43.3 DTF score for paying taxes (0–100) 90.04 Strength of insolvency framework index (0–16) 9 Payments (number per year) 6 Time (hours per year) 188 Total tax rate (% of profit) 28.6 KENYA Sub-Saharan Africa GNI per capita (US$) 930 Ease of doing business rank (1–189) 136 Overall distance to frontier (DTF) score (0–100) 54.98 Population (m) 44.4 Starting a business (rank) 143 Registering property (rank) 136 Trading across borders (rank) 153 DTF score for starting a business (0–100) 74.02 DTF score for registering property (0–100) 56.88 DTF score for trading across borders (0–100) 54.49 Procedures (number) 10 Procedures (number) 9 Documents to export (number) 8 Time (days) 30 Time (days) 72 Time to export (days) 26 Cost (% of income per capita) 42.7 Cost (% of property value) 4.3 Cost to export (US$ per container) 2,255 Minimum capital (% of income per capita) 0.0 Documents to import (number) 9 Getting credit (rank) 116 Time to import (days) 26 Dealing with construction permits (rank) 95 DTF score for getting credit (0–100) 35.00 Cost to import (US$ per container) 2,350 DTF score for dealing with construction permits (0–100) 71.02 Strength of legal rights index (0–12) 7 Procedures (number) 8 Depth of credit information index (0–8) 0 Enforcing contracts (rank) 137 Time (days) 125 Credit bureau coverage (% of adults) 4.9 DTF score for enforcing contracts (0–100) 48.96 Cost (% of warehouse value) 9.3 Credit registry coverage (% of adults) 0.0 Procedures (number) 44 Time (days) 465 Getting electricity (rank) 151 Protecting minority investors (rank) 122 Cost (% of claim) 47.2 DTF score for getting electricity (0–100) 58.85 DTF score for protecting minority investors (0–100) 45.83 Procedures (number) 6 Extent of conflict of interest regulation index (0–10) 4.7 Resolving insolvency (rank) 134 Time (days) 158 Extent of shareholder governance index (0–10) 4.5 DTF score for resolving insolvency (0–100) 33.31 Cost (% of income per capita) 1,020.2 Strength of minority investor protection index (0–10) 4.6 Time (years) 4.5 Cost (% of estate) 22 Paying taxes (rank) 102 Recovery rate (cents on the dollar) 27.1 DTF score for paying taxes (0–100) 71.49 Strength of insolvency framework index (0–16) 6 Payments (number per year) 30 Time (hours per year) 201.5 Total tax rate (% of profit) 38.1 Note: For resolving insolvency, an economy for which “no practice” is recorded for time and cost receives a score of 0 on the strength of insolvency framework index even if its legal framework includes provisions related to insolvency proceedings (liquidation or reorganization). Most indicator sets refer to a case scenario in the largest business city of an economy, except for 11 economies for which the data are a population-weighted average for the 2 largest business cities. See the data notes for more details.
  • 208.
    196 DOING BUSINESS2015 Reform making it easier to do business Change making it more difficult to do business KIRIBATI East Asia Pacific GNI per capita (US$) 2,620 Ease of doing business rank (1–189) 134 Overall distance to frontier (DTF) score (0–100) 55.48 Population (m) 0.1 Starting a business (rank) 122 Registering property (rank) 139 Trading across borders (rank) 81 DTF score for starting a business (0–100) 79.74 DTF score for registering property (0–100) 55.48 DTF score for trading across borders (0–100) 74.76 Procedures (number) 7 Procedures (number) 5 Documents to export (number) 6 Time (days) 31 Time (days) 513 Time to export (days) 20 Cost (% of income per capita) 20.5 Cost (% of property value) 0.0 Cost to export (US$ per container) 870 Minimum capital (% of income per capita) 19.5 Documents to import (number) 6 Getting credit (rank) 160 Time to import (days) 21 Dealing with construction permits (rank) 65 DTF score for getting credit (0–100) 20.00 Cost to import (US$ per container) 910 DTF score for dealing with construction permits (0–100) 75.71 Strength of legal rights index (0–12) 4 Procedures (number) 14 Depth of credit information index (0–8) 0 Enforcing contracts (rank) 60 Time (days) 149 Credit bureau coverage (% of adults) 0.0 DTF score for enforcing contracts (0–100) 64.15 Cost (% of warehouse value) 0.3 Credit registry coverage (% of adults) 0.0 Procedures (number) 32 Time (days) 660 Getting electricity (rank) 167 Protecting minority investors (rank) 154 Cost (% of claim) 25.8 DTF score for getting electricity (0–100) 52.26 DTF score for protecting minority investors (0–100) 41.67 Procedures (number) 6 Extent of conflict of interest regulation index (0–10) 6.3 Resolving insolvency (rank) 189 Time (days) 97 Extent of shareholder governance index (0–10) 2.0 DTF score for resolving insolvency (0–100) 0.00 Cost (% of income per capita) 4,768.9 Strength of minority investor protection index (0–10) 4.2 Time (years) NO PRACTICE Cost (% of estate) NO PRACTICE Paying taxes (rank) 14 Recovery rate (cents on the dollar) 0.0 DTF score for paying taxes (0–100) 91.03 Strength of insolvency framework index (0–16) 0 Payments (number per year) 7 Time (hours per year) 120 Total tax rate (% of profit) 32.7 KOREA, REP. OECD high income GNI per capita (US$) 25,920 Ease of doing business rank (1–189) 5 Overall distance to frontier (DTF) score (0–100) 83.40 Population (m) 50.2 Starting a business (rank) 17 Registering property (rank) 79 Trading across borders (rank) 3 DTF score for starting a business (0–100) 94.36 DTF score for registering property (0–100) 70.99 DTF score for trading across borders (0–100) 93.45 Procedures (number) 3 Procedures (number) 7 Documents to export (number) 3 Time (days) 4 Time (days) 7 Time to export (days) 8 Cost (% of income per capita) 14.5 Cost (% of property value) 5.1 Cost to export (US$ per container) 670 Minimum capital (% of income per capita) 0.0 Documents to import (number) 3 Getting credit (rank) 36 Time to import (days) 7 Dealing with construction permits (rank) 12 DTF score for getting credit (0–100) 65.00 Cost to import (US$ per container) 695 DTF score for dealing with construction permits (0–100) 85.89 Strength of legal rights index (0–12) 5 Procedures (number) 10 Depth of credit information index (0–8) 8 Enforcing contracts (rank) 4 Time (days) 29 Credit bureau coverage (% of adults) 100.0 DTF score for enforcing contracts (0–100) 81.71 Cost (% of warehouse value) 4.3 Credit registry coverage (% of adults) 0.0 Procedures (number) 32 Time (days) 230 Getting electricity (rank) 1 Protecting minority investors (rank) 21 Cost (% of claim) 10.3 DTF score for getting electricity (0–100) 99.83 DTF score for protecting minority investors (0–100) 66.67 Procedures (number) 3 Extent of conflict of interest regulation index (0–10) 7.0 Resolving insolvency (rank) 5 Time (days) 18 Extent of shareholder governance index (0–10) 6.3 DTF score for resolving insolvency (0–100) 90.06 Cost (% of income per capita) 41.1 Strength of minority investor protection index (0–10) 6.7 Time (years) 1.5 Cost (% of estate) 4 Paying taxes (rank) 25 Recovery rate (cents on the dollar) 83.1 DTF score for paying taxes (0–100) 86.09 Strength of insolvency framework index (0–16) 14.5 Payments (number per year) 10 Time (hours per year) 187 Total tax rate (% of profit) 32.4 KOSOVO Europe Central Asia GNI per capita (US$) 3,890 Ease of doing business rank (1–189) 75 Overall distance to frontier (DTF) score (0–100) 64.76 Population (m) 1.8 Starting a business (rank) 42 Registering property (rank) 34 Trading across borders (rank) 118 DTF score for starting a business (0–100) 91.33 DTF score for registering property (0–100) 81.32 DTF score for trading across borders (0–100) 67.70 Procedures (number) 5 Procedures (number) 6 Documents to export (number) 8 Time (days) 11 Time (days) 27 Time to export (days) 15 Cost (% of income per capita) 1.2 Cost (% of property value) 0.3 Cost to export (US$ per container) 1,695 Minimum capital (% of income per capita) 0.0 Documents to import (number) 7 Getting credit (rank) 23 Time to import (days) 15 Dealing with construction permits (rank) 135 DTF score for getting credit (0–100) 70.00 Cost to import (US$ per container) 1,730 DTF score for dealing with construction permits (0–100) 63.36 Strength of legal rights index (0–12) 8 Procedures (number) 15 Depth of credit information index (0–8) 6 Enforcing contracts (rank) 138 Time (days) 152 Credit bureau coverage (% of adults) 0.0 DTF score for enforcing contracts (0–100) 48.59 Cost (% of warehouse value) 6.7 Credit registry coverage (% of adults) 22.8 Procedures (number) 53 Time (days) 330 Getting electricity (rank) 112 Protecting minority investors (rank) 62 Cost (% of claim) 33.0 DTF score for getting electricity (0–100) 70.34 DTF score for protecting minority investors (0–100) 57.50 Procedures (number) 7 Extent of conflict of interest regulation index (0–10) 5.3 Resolving insolvency (rank) 164 Time (days) 46 Extent of shareholder governance index (0–10) 6.2 DTF score for resolving insolvency (0–100) 19.63 Cost (% of income per capita) 822.5 Strength of minority investor protection index (0–10) 5.8 Time (years) 2.0 Cost (% of estate) 15 Paying taxes (rank) 63 Recovery rate (cents on the dollar) 36.5 DTF score for paying taxes (0–100) 77.87 Strength of insolvency framework index (0–16) 0 Payments (number per year) 33 Time (hours per year) 155 Total tax rate (% of profit) 15.3 Note: For resolving insolvency, an economy for which “no practice” is recorded for time and cost receives a score of 0 on the strength of insolvency framework index even if its legal framework includes provisions related to insolvency proceedings (liquidation or reorganization). Most indicator sets refer to a case scenario in the largest business city of an economy, except for 11 economies for which the data are a population-weighted average for the 2 largest business cities. See the data notes for more details.
  • 209.
    COUNTRY TABLES 197 Reform making it easier to do business Change making it more difficult to do business KUWAIT Middle East North Africa GNI per capita (US$) 47,639 Ease of doing business rank (1–189) 86 Overall distance to frontier (DTF) score (0–100) 63.11 Population (m) 3.4 Starting a business (rank) 150 Registering property (rank) 69 Trading across borders (rank) 117 DTF score for starting a business (0–100) 71.30 DTF score for registering property (0–100) 72.10 DTF score for trading across borders (0–100) 68.00 Procedures (number) 12 Procedures (number) 8 Documents to export (number) 7 Time (days) 31 Time (days) 47 Time to export (days) 15 Cost (% of income per capita) 1.9 Cost (% of property value) 0.5 Cost to export (US$ per container) 1,085 Minimum capital (% of income per capita) 74.0 Documents to import (number) 10 Getting credit (rank) 116 Time to import (days) 20 Dealing with construction permits (rank) 98 DTF score for getting credit (0–100) 35.00 Cost to import (US$ per container) 1,250 DTF score for dealing with construction permits (0–100) 70.60 Strength of legal rights index (0–12) 2 Procedures (number) 20 Depth of credit information index (0–8) 5 Enforcing contracts (rank) 131 Time (days) 96 Credit bureau coverage (% of adults) 32.0 DTF score for enforcing contracts (0–100) 50.59 Cost (% of warehouse value) 1.6 Credit registry coverage (% of adults) 0.0 Procedures (number) 50 Time (days) 566 Getting electricity (rank) 93 Protecting minority investors (rank) 43 Cost (% of claim) 18.8 DTF score for getting electricity (0–100) 74.13 DTF score for protecting minority investors (0–100) 60.83 Procedures (number) 7 Extent of conflict of interest regulation index (0–10) 5.7 Resolving insolvency (rank) 127 Time (days) 42 Extent of shareholder governance index (0–10) 6.5 DTF score for resolving insolvency (0–100) 36.02 Cost (% of income per capita) 42.3 Strength of minority investor protection index (0–10) 6.1 Time (years) 4.2 Cost (% of estate) 10 Paying taxes (rank) 11 Recovery rate (cents on the dollar) 32.1 DTF score for paying taxes (0–100) 92.48 Strength of insolvency framework index (0–16) 6 Payments (number per year) 12 Time (hours per year) 98 Total tax rate (% of profit) 12.8 KYRGYZ REPUBLIC Europe Central Asia GNI per capita (US$) 1,200 Ease of doing business rank (1–189) 102 Overall distance to frontier (DTF) score (0–100) 60.74 Population (m) 5.7 Starting a business (rank) 9 Registering property (rank) 6 Trading across borders (rank) 183 DTF score for starting a business (0–100) 96.35 DTF score for registering property (0–100) 93.25 DTF score for trading across borders (0–100) 9.70 Procedures (number) 2 Procedures (number) 3 Documents to export (number) 9 Time (days) 8 Time (days) 5 Time to export (days) 63 Cost (% of income per capita) 2.4 Cost (% of property value) 0.3 Cost to export (US$ per container) 4,760 Minimum capital (% of income per capita) 0.0 Documents to import (number) 11 Getting credit (rank) 36 Time to import (days) 73 Dealing with construction permits (rank) 42 DTF score for getting credit (0–100) 65.00 Cost to import (US$ per container) 6,000 DTF score for dealing with construction permits (0–100) 78.80 Strength of legal rights index (0–12) 8 Procedures (number) 10 Depth of credit information index (0–8) 5 Enforcing contracts (rank) 56 Time (days) 141 Credit bureau coverage (% of adults) 38.2 DTF score for enforcing contracts (0–100) 64.63 Cost (% of warehouse value) 2.1 Credit registry coverage (% of adults) 0.0 Procedures (number) 38 Time (days) 260 Getting electricity (rank) 168 Protecting minority investors (rank) 35 Cost (% of claim) 37.0 DTF score for getting electricity (0–100) 49.64 DTF score for protecting minority investors (0–100) 62.50 Procedures (number) 7 Extent of conflict of interest regulation index (0–10) 6.7 Resolving insolvency (rank) 157 Time (days) 159 Extent of shareholder governance index (0–10) 5.8 DTF score for resolving insolvency (0–100) 24.38 Cost (% of income per capita) 1,872.2 Strength of minority investor protection index (0–10) 6.3 Time (years) 4.0 Cost (% of estate) 15 Paying taxes (rank) 136 Recovery rate (cents on the dollar) 19.2 DTF score for paying taxes (0–100) 63.15 Strength of insolvency framework index (0–16) 4.5 Payments (number per year) 52 Time (hours per year) 210 Total tax rate (% of profit) 29.0 LAO PDR East Asia Pacific GNI per capita (US$) 1,460 Ease of doing business rank (1–189) 148 Overall distance to frontier (DTF) score (0–100) 51.45 Population (m) 6.8 Starting a business (rank) 154 Registering property (rank) 77 Trading across borders (rank) 156 DTF score for starting a business (0–100) 68.95 DTF score for registering property (0–100) 71.06 DTF score for trading across borders (0–100) 52.96 Procedures (number) 6 Procedures (number) 5 Documents to export (number) 10 Time (days) 92 Time (days) 98 Time to export (days) 23 Cost (% of income per capita) 5.7 Cost (% of property value) 1.1 Cost to export (US$ per container) 1,950 Minimum capital (% of income per capita) 0.0 Documents to import (number) 10 Getting credit (rank) 116 Time to import (days) 26 Dealing with construction permits (rank) 107 DTF score for getting credit (0–100) 35.00 Cost to import (US$ per container) 1,910 DTF score for dealing with construction permits (0–100) 68.50 Strength of legal rights index (0–12) 7 Procedures (number) 22 Depth of credit information index (0–8) 0 Enforcing contracts (rank) 99 Time (days) 107 Credit bureau coverage (% of adults) 0.0 DTF score for enforcing contracts (0–100) 57.49 Cost (% of warehouse value) 0.6 Credit registry coverage (% of adults) 3.5 Procedures (number) 42 Time (days) 443 Getting electricity (rank) 128 Protecting minority investors (rank) 178 Cost (% of claim) 31.6 DTF score for getting electricity (0–100) 65.29 DTF score for protecting minority investors (0–100) 29.17 Procedures (number) 5 Extent of conflict of interest regulation index (0–10) 3.3 Resolving insolvency (rank) 189 Time (days) 134 Extent of shareholder governance index (0–10) 2.5 DTF score for resolving insolvency (0–100) 0.00 Cost (% of income per capita) 1,650.4 Strength of minority investor protection index (0–10) 2.9 Time (years) NO PRACTICE Cost (% of estate) NO PRACTICE Paying taxes (rank) 129 Recovery rate (cents on the dollar) 0.0 DTF score for paying taxes (0–100) 66.10 Strength of insolvency framework index (0–16) 0 Payments (number per year) 35 Time (hours per year) 362 Total tax rate (% of profit) 25.8 Note: For resolving insolvency, an economy for which “no practice” is recorded for time and cost receives a score of 0 on the strength of insolvency framework index even if its legal framework includes provisions related to insolvency proceedings (liquidation or reorganization). Most indicator sets refer to a case scenario in the largest business city of an economy, except for 11 economies for which the data are a population-weighted average for the 2 largest business cities. See the data notes for more details.
  • 210.
    198 DOING BUSINESS2015 Reform making it easier to do business Change making it more difficult to do business LATVIA Europe Central Asia GNI per capita (US$) 15,280 Ease of doing business rank (1–189) 23 Overall distance to frontier (DTF) score (0–100) 76.73 Population (m) 2.0 Starting a business (rank) 36 Registering property (rank) 32 Trading across borders (rank) 28 DTF score for starting a business (0–100) 92.12 DTF score for registering property (0–100) 81.69 DTF score for trading across borders (0–100) 85.36 Procedures (number) 4 Procedures (number) 5 Documents to export (number) 5 Time (days) 12.5 Time (days) 18 Time to export (days) 10 Cost (% of income per capita) 3.6 Cost (% of property value) 2.0 Cost to export (US$ per container) 600 Minimum capital (% of income per capita) 0.0 Documents to import (number) 5 Getting credit (rank) 23 Time to import (days) 11 Dealing with construction permits (rank) 47 DTF score for getting credit (0–100) 70.00 Cost to import (US$ per container) 801 DTF score for dealing with construction permits (0–100) 78.38 Strength of legal rights index (0–12) 9 Procedures (number) 12 Depth of credit information index (0–8) 5 Enforcing contracts (rank) 16 Time (days) 149 Credit bureau coverage (% of adults) 0.0 DTF score for enforcing contracts (0–100) 75.59 Cost (% of warehouse value) 0.3 Credit registry coverage (% of adults) 76.8 Procedures (number) 27 Time (days) 469 Getting electricity (rank) 89 Protecting minority investors (rank) 49 Cost (% of claim) 23.1 DTF score for getting electricity (0–100) 74.58 DTF score for protecting minority investors (0–100) 60.00 Procedures (number) 5 Extent of conflict of interest regulation index (0–10) 5.7 Resolving insolvency (rank) 40 Time (days) 108 Extent of shareholder governance index (0–10) 6.3 DTF score for resolving insolvency (0–100) 63.42 Cost (% of income per capita) 308.2 Strength of minority investor protection index (0–10) 6.0 Time (years) 1.5 Cost (% of estate) 10 Paying taxes (rank) 24 Recovery rate (cents on the dollar) 48.2 DTF score for paying taxes (0–100) 86.19 Strength of insolvency framework index (0–16) 12 Payments (number per year) 7 Time (hours per year) 193 Total tax rate (% of profit) 35.0 LEBANON Middle East North Africa GNI per capita (US$) 9,870 Ease of doing business rank (1–189) 104 Overall distance to frontier (DTF) score (0–100) 60.61 Population (m) 4.5 Starting a business (rank) 119 Registering property (rank) 106 Trading across borders (rank) 97 DTF score for starting a business (0–100) 80.80 DTF score for registering property (0–100) 63.69 DTF score for trading across borders (0–100) 71.96 Procedures (number) 5 Procedures (number) 8 Documents to export (number) 4 Time (days) 9 Time (days) 25 Time to export (days) 22 Cost (% of income per capita) 73.0 Cost (% of property value) 5.9 Cost to export (US$ per container) 1,080 Minimum capital (% of income per capita) 33.0 Documents to import (number) 7 Getting credit (rank) 116 Time to import (days) 30 Dealing with construction permits (rank) 164 DTF score for getting credit (0–100) 35.00 Cost to import (US$ per container) 1,365 DTF score for dealing with construction permits (0–100) 54.38 Strength of legal rights index (0–12) 2 Procedures (number) 18 Depth of credit information index (0–8) 5 Enforcing contracts (rank) 110 Time (days) 244 Credit bureau coverage (% of adults) 0.0 DTF score for enforcing contracts (0–100) 55.40 Cost (% of warehouse value) 4.4 Credit registry coverage (% of adults) 20.3 Procedures (number) 37 Time (days) 721 Getting electricity (rank) 57 Protecting minority investors (rank) 106 Cost (% of claim) 30.8 DTF score for getting electricity (0–100) 80.24 DTF score for protecting minority investors (0–100) 49.17 Procedures (number) 5 Extent of conflict of interest regulation index (0–10) 5.0 Resolving insolvency (rank) 136 Time (days) 75 Extent of shareholder governance index (0–10) 4.8 DTF score for resolving insolvency (0–100) 33.03 Cost (% of income per capita) 93.2 Strength of minority investor protection index (0–10) 4.9 Time (years) 3.0 Cost (% of estate) 15 Paying taxes (rank) 40 Recovery rate (cents on the dollar) 32.3 DTF score for paying taxes (0–100) 82.44 Strength of insolvency framework index (0–16) 5 Payments (number per year) 19 Time (hours per year) 183 Total tax rate (% of profit) 29.9 LESOTHO Sub-Saharan Africa GNI per capita (US$) 1,550 Ease of doing business rank (1–189) 128 Overall distance to frontier (DTF) score (0–100) 56.64 Population (m) 2.1 Starting a business (rank) 108 Registering property (rank) 93 Trading across borders (rank) 147 DTF score for starting a business (0–100) 82.84 DTF score for registering property (0–100) 66.36 DTF score for trading across borders (0–100) 57.86 Procedures (number) 7 Procedures (number) 4 Documents to export (number) 7 Time (days) 29 Time (days) 43 Time to export (days) 31 Cost (% of income per capita) 9.4 Cost (% of property value) 8.4 Cost to export (US$ per container) 1,795 Minimum capital (% of income per capita) 0.0 Documents to import (number) 7 Getting credit (rank) 151 Time to import (days) 33 Dealing with construction permits (rank) 161 DTF score for getting credit (0–100) 25.00 Cost to import (US$ per container) 2,045 DTF score for dealing with construction permits (0–100) 55.79 Strength of legal rights index (0–12) 5 Procedures (number) 10 Depth of credit information index (0–8) 0 Enforcing contracts (rank) 115 Time (days) 179 Credit bureau coverage (% of adults) 0.0 DTF score for enforcing contracts (0–100) 53.94 Cost (% of warehouse value) 13.7 Credit registry coverage (% of adults) 0.0 Procedures (number) 41 Time (days) 615 Getting electricity (rank) 117 Protecting minority investors (rank) 106 Cost (% of claim) 31.3 DTF score for getting electricity (0–100) 68.20 DTF score for protecting minority investors (0–100) 49.17 Procedures (number) 5 Extent of conflict of interest regulation index (0–10) 5.3 Resolving insolvency (rank) 120 Time (days) 114 Extent of shareholder governance index (0–10) 4.5 DTF score for resolving insolvency (0–100) 37.51 Cost (% of income per capita) 1,647.5 Strength of minority investor protection index (0–10) 4.9 Time (years) 2.6 Cost (% of estate) 20 Paying taxes (rank) 109 Recovery rate (cents on the dollar) 29.0 DTF score for paying taxes (0–100) 69.72 Strength of insolvency framework index (0–16) 7 Payments (number per year) 32 Time (hours per year) 324 Total tax rate (% of profit) 13.6 Note: For resolving insolvency, an economy for which “no practice” is recorded for time and cost receives a score of 0 on the strength of insolvency framework index even if its legal framework includes provisions related to insolvency proceedings (liquidation or reorganization). Most indicator sets refer to a case scenario in the largest business city of an economy, except for 11 economies for which the data are a population-weighted average for the 2 largest business cities. See the data notes for more details.
  • 211.
    COUNTRY TABLES 199 Reform making it easier to do business Change making it more difficult to do business LIBERIA Sub-Saharan Africa GNI per capita (US$) 410 Ease of doing business rank (1–189) 174 Overall distance to frontier (DTF) score (0–100) 46.61 Population (m) 4.3 Starting a business (rank) 30 Registering property (rank) 177 Trading across borders (rank) 149 DTF score for starting a business (0–100) 92.41 DTF score for registering property (0–100) 39.57 DTF score for trading across borders (0–100) 56.40 Procedures (number) 4 Procedures (number) 10 Documents to export (number) 10 Time (days) 4.5 Time (days) 44 Time to export (days) 15 Cost (% of income per capita) 17.4 Cost (% of property value) 12.9 Cost to export (US$ per container) 1,320 Minimum capital (% of income per capita) 0.0 Documents to import (number) 12 Getting credit (rank) 160 Time to import (days) 29 Dealing with construction permits (rank) 143 DTF score for getting credit (0–100) 20.00 Cost to import (US$ per container) 1,320 DTF score for dealing with construction permits (0–100) 62.00 Strength of legal rights index (0–12) 4 Procedures (number) 22 Depth of credit information index (0–8) 0 Enforcing contracts (rank) 174 Time (days) 74 Credit bureau coverage (% of adults) 0.0 DTF score for enforcing contracts (0–100) 35.43 Cost (% of warehouse value) 6.4 Credit registry coverage (% of adults) 1.7 Procedures (number) 40 Time (days) 1,280 Getting electricity (rank) 166 Protecting minority investors (rank) 181 Cost (% of claim) 35.0 DTF score for getting electricity (0–100) 52.61 DTF score for protecting minority investors (0–100) 28.33 Procedures (number) 4 Extent of conflict of interest regulation index (0–10) 3.7 Resolving insolvency (rank) 169 Time (days) 465 Extent of shareholder governance index (0–10) 2.0 DTF score for resolving insolvency (0–100) 4.60 Cost (% of income per capita) 2,065.4 Strength of minority investor protection index (0–10) 2.8 Time (years) 3.0 Cost (% of estate) 43 Paying taxes (rank) 77 Recovery rate (cents on the dollar) 8.6 DTF score for paying taxes (0–100) 74.75 Strength of insolvency framework index (0–16) 0 Payments (number per year) 33 Time (hours per year) 150.5 Total tax rate (% of profit) 33.3 LIBYA Middle East North Africa GNI per capita (US$) 11,046 Ease of doing business rank (1–189) 188 Overall distance to frontier (DTF) score (0–100) 33.35 Population (m) 6.2 Starting a business (rank) 144 Registering property (rank) 189 Trading across borders (rank) 139 DTF score for starting a business (0–100) 73.50 DTF score for registering property (0–100) 0.00 DTF score for trading across borders (0–100) 61.72 Procedures (number) 10 Procedures (number) NO PRACTICE Documents to export (number) 7 Time (days) 35 Time (days) NO PRACTICE Time to export (days) 23 Cost (% of income per capita) 19.9 Cost (% of property value) NO PRACTICE Cost to export (US$ per container) 1,140 Minimum capital (% of income per capita) 33.8 Documents to import (number) 9 Getting credit (rank) 185 Time to import (days) 37 Dealing with construction permits (rank) 189 DTF score for getting credit (0–100) 0.00 Cost to import (US$ per container) 1,255 DTF score for dealing with construction permits (0–100) 0.00 Strength of legal rights index (0–12) 0 Procedures (number) NO PRACTICE Depth of credit information index (0–8) 0 Enforcing contracts (rank) 126 Time (days) NO PRACTICE Credit bureau coverage (% of adults) 0.0 DTF score for enforcing contracts (0–100) 51.42 Cost (% of warehouse value) NO PRACTICE Credit registry coverage (% of adults) 0.5 Procedures (number) 43 Time (days) 690 Getting electricity (rank) 65 Protecting minority investors (rank) 188 Cost (% of claim) 27.0 DTF score for getting electricity (0–100) 79.10 DTF score for protecting minority investors (0–100) 12.50 Procedures (number) 4 Extent of conflict of interest regulation index (0–10) 2.0 Resolving insolvency (rank) 189 Time (days) 118 Extent of shareholder governance index (0–10) 0.5 DTF score for resolving insolvency (0–100) 0.00 Cost (% of income per capita) 206.2 Strength of minority investor protection index (0–10) 1.3 Time (years) NO PRACTICE Cost (% of estate) NO PRACTICE Paying taxes (rank) 157 Recovery rate (cents on the dollar) 0.0 DTF score for paying taxes (0–100) 55.25 Strength of insolvency framework index (0–16) 0 Payments (number per year) 19 Time (hours per year) 889 Total tax rate (% of profit) 31.5 LITHUANIA Europe Central Asia GNI per capita (US$) 14,900 Ease of doing business rank (1–189) 24 Overall distance to frontier (DTF) score (0–100) 76.31 Population (m) 3.0 Starting a business (rank) 11 Registering property (rank) 9 Trading across borders (rank) 21 DTF score for starting a business (0–100) 96.22 DTF score for registering property (0–100) 92.39 DTF score for trading across borders (0–100) 87.21 Procedures (number) 3 Procedures (number) 3 Documents to export (number) 4 Time (days) 3.5 Time (days) 2.5 Time to export (days) 10 Cost (% of income per capita) 0.7 Cost (% of property value) 0.8 Cost to export (US$ per container) 750 Minimum capital (% of income per capita) 0.0 Documents to import (number) 5 Getting credit (rank) 23 Time to import (days) 9 Dealing with construction permits (rank) 15 DTF score for getting credit (0–100) 70.00 Cost to import (US$ per container) 800 DTF score for dealing with construction permits (0–100) 85.27 Strength of legal rights index (0–12) 6 Procedures (number) 11 Depth of credit information index (0–8) 8 Enforcing contracts (rank) 14 Time (days) 91 Credit bureau coverage (% of adults) 97.7 DTF score for enforcing contracts (0–100) 75.85 Cost (% of warehouse value) 0.3 Credit registry coverage (% of adults) 28.8 Procedures (number) 31 Time (days) 300 Getting electricity (rank) 105 Protecting minority investors (rank) 78 Cost (% of claim) 23.6 DTF score for getting electricity (0–100) 71.46 DTF score for protecting minority investors (0–100) 55.00 Procedures (number) 5 Extent of conflict of interest regulation index (0–10) 6.0 Resolving insolvency (rank) 67 Time (days) 137 Extent of shareholder governance index (0–10) 5.0 DTF score for resolving insolvency (0–100) 48.47 Cost (% of income per capita) 45.5 Strength of minority investor protection index (0–10) 5.5 Time (years) 2.3 Cost (% of estate) 10 Paying taxes (rank) 44 Recovery rate (cents on the dollar) 43.6 DTF score for paying taxes (0–100) 81.24 Strength of insolvency framework index (0–16) 8 Payments (number per year) 11 Time (hours per year) 175 Total tax rate (% of profit) 42.6 Note: For resolving insolvency, an economy for which “no practice” is recorded for time and cost receives a score of 0 on the strength of insolvency framework index even if its legal framework includes provisions related to insolvency proceedings (liquidation or reorganization). Most indicator sets refer to a case scenario in the largest business city of an economy, except for 11 economies for which the data are a population-weighted average for the 2 largest business cities. See the data notes for more details.
  • 212.
    200 DOING BUSINESS2015 Reform making it easier to do business Change making it more difficult to do business LUXEMBOURG OECD high income GNI per capita (US$) 71,810 Ease of doing business rank (1–189) 59 Overall distance to frontier (DTF) score (0–100) 67.60 Population (m) 0.5 Starting a business (rank) 82 Registering property (rank) 137 Trading across borders (rank) 35 DTF score for starting a business (0–100) 86.47 DTF score for registering property (0–100) 56.75 DTF score for trading across borders (0–100) 83.58 Procedures (number) 6 Procedures (number) 7 Documents to export (number) 5 Time (days) 18.5 Time (days) 26.5 Time to export (days) 8 Cost (% of income per capita) 2.0 Cost (% of property value) 10.1 Cost to export (US$ per container) 1,425 Minimum capital (% of income per capita) 22.5 Documents to import (number) 4 Getting credit (rank) 165 Time to import (days) 7 Dealing with construction permits (rank) 50 DTF score for getting credit (0–100) 15.00 Cost to import (US$ per container) 1,420 DTF score for dealing with construction permits (0–100) 78.22 Strength of legal rights index (0–12) 3 Procedures (number) 11 Depth of credit information index (0–8) 0 Enforcing contracts (rank) 2 Time (days) 157 Credit bureau coverage (% of adults) 0.0 DTF score for enforcing contracts (0–100) 85.70 Cost (% of warehouse value) 0.7 Credit registry coverage (% of adults) 0.0 Procedures (number) 26 Time (days) 321 Getting electricity (rank) 42 Protecting minority investors (rank) 117 Cost (% of claim) 9.7 DTF score for getting electricity (0–100) 83.22 DTF score for protecting minority investors (0–100) 46.67 Procedures (number) 5 Extent of conflict of interest regulation index (0–10) 4.3 Resolving insolvency (rank) 62 Time (days) 56 Extent of shareholder governance index (0–10) 5.0 DTF score for resolving insolvency (0–100) 51.83 Cost (% of income per capita) 40.1 Strength of minority investor protection index (0–10) 4.7 Time (years) 2.0 Cost (% of estate) 15 Paying taxes (rank) 20 Recovery rate (cents on the dollar) 44.0 DTF score for paying taxes (0–100) 88.58 Strength of insolvency framework index (0–16) 9 Payments (number per year) 23 Time (hours per year) 55 Total tax rate (% of profit) 20.2 MACEDONIA, FYR Europe Central Asia GNI per capita (US$) 4,800 Ease of doing business rank (1–189) 30 Overall distance to frontier (DTF) score (0–100) 74.11 Population (m) 2.1 Starting a business (rank) 3 Registering property (rank) 74 Trading across borders (rank) 85 DTF score for starting a business (0–100) 98.08 DTF score for registering property (0–100) 71.27 DTF score for trading across borders (0–100) 74.43 Procedures (number) 2 Procedures (number) 7 Documents to export (number) 6 Time (days) 2 Time (days) 31 Time to export (days) 12 Cost (% of income per capita) 0.6 Cost (% of property value) 3.3 Cost to export (US$ per container) 1,376 Minimum capital (% of income per capita) 0.0 Documents to import (number) 8 Getting credit (rank) 36 Time to import (days) 11 Dealing with construction permits (rank) 89 DTF score for getting credit (0–100) 65.00 Cost to import (US$ per container) 1,380 DTF score for dealing with construction permits (0–100) 72.30 Strength of legal rights index (0–12) 6 Procedures (number) 11 Depth of credit information index (0–8) 7 Enforcing contracts (rank) 87 Time (days) 89 Credit bureau coverage (% of adults) 83.7 DTF score for enforcing contracts (0–100) 58.31 Cost (% of warehouse value) 8.2 Credit registry coverage (% of adults) 36.4 Procedures (number) 38 Time (days) 604 Getting electricity (rank) 88 Protecting minority investors (rank) 21 Cost (% of claim) 28.8 DTF score for getting electricity (0–100) 74.94 DTF score for protecting minority investors (0–100) 66.67 Procedures (number) 5 Extent of conflict of interest regulation index (0–10) 6.7 Resolving insolvency (rank) 35 Time (days) 107 Extent of shareholder governance index (0–10) 6.7 DTF score for resolving insolvency (0–100) 65.93 Cost (% of income per capita) 255.3 Strength of minority investor protection index (0–10) 6.7 Time (years) 1.8 Cost (% of estate) 10 Paying taxes (rank) 7 Recovery rate (cents on the dollar) 44.1 DTF score for paying taxes (0–100) 94.17 Strength of insolvency framework index (0–16) 13.5 Payments (number per year) 7 Time (hours per year) 119 Total tax rate (% of profit) 7.4 MADAGASCAR Sub-Saharan Africa GNI per capita (US$) 440 Ease of doing business rank (1–189) 163 Overall distance to frontier (DTF) score (0–100) 49.25 Population (m) 22.9 Starting a business (rank) 37 Registering property (rank) 153 Trading across borders (rank) 109 DTF score for starting a business (0–100) 92.02 DTF score for registering property (0–100) 51.72 DTF score for trading across borders (0–100) 68.98 Procedures (number) 4 Procedures (number) 6 Documents to export (number) 5 Time (days) 8 Time (days) 74 Time to export (days) 22 Cost (% of income per capita) 13.5 Cost (% of property value) 10.2 Cost to export (US$ per container) 1,195 Minimum capital (% of income per capita) 0.0 Documents to import (number) 9 Getting credit (rank) 180 Time to import (days) 21 Dealing with construction permits (rank) 177 DTF score for getting credit (0–100) 5.00 Cost to import (US$ per container) 1,555 DTF score for dealing with construction permits (0–100) 46.68 Strength of legal rights index (0–12) 1 Procedures (number) 13 Depth of credit information index (0–8) 0 Enforcing contracts (rank) 146 Time (days) 123 Credit bureau coverage (% of adults) 0.0 DTF score for enforcing contracts (0–100) 45.91 Cost (% of warehouse value) 20.8 Credit registry coverage (% of adults) 0.2 Procedures (number) 38 Time (days) 871 Getting electricity (rank) 189 Protecting minority investors (rank) 87 Cost (% of claim) 42.4 DTF score for getting electricity (0–100) 16.67 DTF score for protecting minority investors (0–100) 53.33 Procedures (number) 6 Extent of conflict of interest regulation index (0–10) 5.7 Resolving insolvency (rank) 129 Time (days) 450 Extent of shareholder governance index (0–10) 5.0 DTF score for resolving insolvency (0–100) 34.43 Cost (% of income per capita) 8,583.3 Strength of minority investor protection index (0–10) 5.3 Time (years) 2.0 Cost (% of estate) 30 Paying taxes (rank) 65 Recovery rate (cents on the dollar) 11.7 DTF score for paying taxes (0–100) 77.78 Strength of insolvency framework index (0–16) 9 Payments (number per year) 23 Time (hours per year) 183 Total tax rate (% of profit) 35.1 Note: For resolving insolvency, an economy for which “no practice” is recorded for time and cost receives a score of 0 on the strength of insolvency framework index even if its legal framework includes provisions related to insolvency proceedings (liquidation or reorganization). Most indicator sets refer to a case scenario in the largest business city of an economy, except for 11 economies for which the data are a population-weighted average for the 2 largest business cities. See the data notes for more details.
  • 213.
    COUNTRY TABLES 201 Reform making it easier to do business Change making it more difficult to do business MALAWI Sub-Saharan Africa GNI per capita (US$) 270 Ease of doing business rank (1–189) 164 Overall distance to frontier (DTF) score (0–100) 49.20 Population (m) 16.4 Starting a business (rank) 157 Registering property (rank) 76 Trading across borders (rank) 170 DTF score for starting a business (0–100) 68.53 DTF score for registering property (0–100) 71.07 DTF score for trading across borders (0–100) 37.40 Procedures (number) 8 Procedures (number) 6 Documents to export (number) 11 Time (days) 38 Time (days) 69 Time to export (days) 34 Cost (% of income per capita) 94.1 Cost (% of property value) 1.9 Cost to export (US$ per container) 2,200 Minimum capital (% of income per capita) 0.0 Documents to import (number) 12 Getting credit (rank) 151 Time to import (days) 39 Dealing with construction permits (rank) 72 DTF score for getting credit (0–100) 25.00 Cost to import (US$ per container) 2,895 DTF score for dealing with construction permits (0–100) 75.09 Strength of legal rights index (0–12) 5 Procedures (number) 13 Depth of credit information index (0–8) 0 Enforcing contracts (rank) 154 Time (days) 153 Credit bureau coverage (% of adults) 0.0 DTF score for enforcing contracts (0–100) 43.73 Cost (% of warehouse value) 1.2 Credit registry coverage (% of adults) 0.0 Procedures (number) 42 Time (days) 432 Getting electricity (rank) 181 Protecting minority investors (rank) 132 Cost (% of claim) 69.1 DTF score for getting electricity (0–100) 35.78 DTF score for protecting minority investors (0–100) 45.00 Procedures (number) 6 Extent of conflict of interest regulation index (0–10) 5.7 Resolving insolvency (rank) 166 Time (days) 172 Extent of shareholder governance index (0–10) 3.3 DTF score for resolving insolvency (0–100) 18.99 Cost (% of income per capita) 6,131.5 Strength of minority investor protection index (0–10) 4.5 Time (years) 2.6 Cost (% of estate) 25 Paying taxes (rank) 103 Recovery rate (cents on the dollar) 12.1 DTF score for paying taxes (0–100) 71.37 Strength of insolvency framework index (0–16) 4 Payments (number per year) 35 Time (hours per year) 174.5 Total tax rate (% of profit) 35.5 MALAYSIA East Asia Pacific GNI per capita (US$) 10,400 Ease of doing business rank (1–189) 18 Overall distance to frontier (DTF) score (0–100) 78.83 Population (m) 29.7 Starting a business (rank) 13 Registering property (rank) 75 Trading across borders (rank) 11 DTF score for starting a business (0–100) 94.90 DTF score for registering property (0–100) 71.16 DTF score for trading across borders (0–100) 89.94 Procedures (number) 3 Procedures (number) 8 Documents to export (number) 4 Time (days) 5.5 Time (days) 13.5 Time to export (days) 11 Cost (% of income per capita) 7.2 Cost (% of property value) 3.3 Cost to export (US$ per container) 525 Minimum capital (% of income per capita) 0.0 Documents to import (number) 4 Getting credit (rank) 23 Time to import (days) 8 Dealing with construction permits (rank) 28 DTF score for getting credit (0–100) 70.00 Cost to import (US$ per container) 560 DTF score for dealing with construction permits (0–100) 82.49 Strength of legal rights index (0–12) 7 Procedures (number) 13 Depth of credit information index (0–8) 7 Enforcing contracts (rank) 29 Time (days) 74 Credit bureau coverage (% of adults) 78.6 DTF score for enforcing contracts (0–100) 69.39 Cost (% of warehouse value) 1.3 Credit registry coverage (% of adults) 56.2 Procedures (number) 29 Time (days) 425 Getting electricity (rank) 27 Protecting minority investors (rank) 5 Cost (% of claim) 37.3 DTF score for getting electricity (0–100) 86.67 DTF score for protecting minority investors (0–100) 74.17 Procedures (number) 5 Extent of conflict of interest regulation index (0–10) 8.7 Resolving insolvency (rank) 36 Time (days) 32 Extent of shareholder governance index (0–10) 6.2 DTF score for resolving insolvency (0–100) 65.61 Cost (% of income per capita) 46.3 Strength of minority investor protection index (0–10) 7.4 Time (years) 1.0 Cost (% of estate) 10 Paying taxes (rank) 32 Recovery rate (cents on the dollar) 81.3 DTF score for paying taxes (0–100) 83.95 Strength of insolvency framework index (0–16) 7 Payments (number per year) 13 Time (hours per year) 133 Total tax rate (% of profit) 39.2 MALDIVES South Asia GNI per capita (US$) 5,600 Ease of doing business rank (1–189) 116 Overall distance to frontier (DTF) score (0–100) 58.73 Population (m) 0.3 Starting a business (rank) 50 Registering property (rank) 169 Trading across borders (rank) 132 DTF score for starting a business (0–100) 91.07 DTF score for registering property (0–100) 43.85 DTF score for trading across borders (0–100) 63.63 Procedures (number) 5 Procedures (number) 6 Documents to export (number) 7 Time (days) 9 Time (days) 57 Time to export (days) 21 Cost (% of income per capita) 6.2 Cost (% of property value) 16.2 Cost to export (US$ per container) 1,625 Minimum capital (% of income per capita) 2.3 Documents to import (number) 9 Getting credit (rank) 116 Time to import (days) 22 Dealing with construction permits (rank) 24 DTF score for getting credit (0–100) 35.00 Cost to import (US$ per container) 1,610 DTF score for dealing with construction permits (0–100) 83.45 Strength of legal rights index (0–12) 2 Procedures (number) 9 Depth of credit information index (0–8) 5 Enforcing contracts (rank) 91 Time (days) 140 Credit bureau coverage (% of adults) 0.0 DTF score for enforcing contracts (0–100) 58.13 Cost (% of warehouse value) 0.2 Credit registry coverage (% of adults) 17.3 Procedures (number) 41 Time (days) 665 Getting electricity (rank) 108 Protecting minority investors (rank) 135 Cost (% of claim) 16.5 DTF score for getting electricity (0–100) 71.14 DTF score for protecting minority investors (0–100) 44.17 Procedures (number) 6 Extent of conflict of interest regulation index (0–10) 5.3 Resolving insolvency (rank) 135 Time (days) 91 Extent of shareholder governance index (0–10) 3.5 DTF score for resolving insolvency (0–100) 33.12 Cost (% of income per capita) 391.5 Strength of minority investor protection index (0–10) 4.4 Time (years) 1.5 Cost (% of estate) 4 Paying taxes (rank) 134 Recovery rate (cents on the dollar) 49.9 DTF score for paying taxes (0–100) 63.76 Strength of insolvency framework index (0–16) 2 Payments (number per year) 30 Time (hours per year) 413 Total tax rate (% of profit) 31.5 Note: For resolving insolvency, an economy for which “no practice” is recorded for time and cost receives a score of 0 on the strength of insolvency framework index even if its legal framework includes provisions related to insolvency proceedings (liquidation or reorganization). Most indicator sets refer to a case scenario in the largest business city of an economy, except for 11 economies for which the data are a population-weighted average for the 2 largest business cities. See the data notes for more details.
  • 214.
    202 DOING BUSINESS2015 Reform making it easier to do business Change making it more difficult to do business MALI Sub-Saharan Africa GNI per capita (US$) 670 Ease of doing business rank (1–189) 146 Overall distance to frontier (DTF) score (0–100) 52.59 Population (m) 15.3 Starting a business (rank) 169 Registering property (rank) 133 Trading across borders (rank) 163 DTF score for starting a business (0–100) 62.92 DTF score for registering property (0–100) 57.63 DTF score for trading across borders (0–100) 46.33 Procedures (number) 5 Procedures (number) 5 Documents to export (number) 6 Time (days) 11 Time (days) 29 Time to export (days) 26 Cost (% of income per capita) 78.1 Cost (% of property value) 12.1 Cost to export (US$ per container) 2,440 Minimum capital (% of income per capita) 300.7 Documents to import (number) 11 Getting credit (rank) 131 Time to import (days) 34 Dealing with construction permits (rank) 97 DTF score for getting credit (0–100) 30.00 Cost to import (US$ per container) 4,540 DTF score for dealing with construction permits (0–100) 70.84 Strength of legal rights index (0–12) 6 Procedures (number) 10 Depth of credit information index (0–8) 0 Enforcing contracts (rank) 128 Time (days) 119 Credit bureau coverage (% of adults) 0.0 DTF score for enforcing contracts (0–100) 51.25 Cost (% of warehouse value) 8.1 Credit registry coverage (% of adults) 3.6 Procedures (number) 36 Time (days) 620 Getting electricity (rank) 132 Protecting minority investors (rank) 146 Cost (% of claim) 52.0 DTF score for getting electricity (0–100) 63.88 DTF score for protecting minority investors (0–100) 42.50 Procedures (number) 4 Extent of conflict of interest regulation index (0–10) 4.0 Resolving insolvency (rank) 108 Time (days) 120 Extent of shareholder governance index (0–10) 4.5 DTF score for resolving insolvency (0–100) 40.35 Cost (% of income per capita) 3,833.8 Strength of minority investor protection index (0–10) 4.3 Time (years) 3.6 Cost (% of estate) 18 Paying taxes (rank) 145 Recovery rate (cents on the dollar) 22.7 DTF score for paying taxes (0–100) 60.16 Strength of insolvency framework index (0–16) 9 Payments (number per year) 35 Time (hours per year) 270 Total tax rate (% of profit) 48.3 MALTA Middle East North Africa GNI per capita (US$) 20,980 Ease of doing business rank (1–189) 94 Overall distance to frontier (DTF) score (0–100) 62.11 Population (m) 0.4 Starting a business (rank) 136 Registering property (rank) 83 Trading across borders (rank) 43 DTF score for starting a business (0–100) 75.29 DTF score for registering property (0–100) 69.86 DTF score for trading across borders (0–100) 81.56 Procedures (number) 11 Procedures (number) 7 Documents to export (number) 5 Time (days) 34.5 Time (days) 15 Time to export (days) 11 Cost (% of income per capita) 11.0 Cost (% of property value) 5.1 Cost to export (US$ per container) 855 Minimum capital (% of income per capita) 1.5 Documents to import (number) 7 Getting credit (rank) 171 Time to import (days) 9 Dealing with construction permits (rank) 109 DTF score for getting credit (0–100) 10.00 Cost to import (US$ per container) 970 DTF score for dealing with construction permits (0–100) 68.39 Strength of legal rights index (0–12) 2 Procedures (number) 15 Depth of credit information index (0–8) 0 Enforcing contracts (rank) 107 Time (days) 167 Credit bureau coverage (% of adults) 0.0 DTF score for enforcing contracts (0–100) 56.27 Cost (% of warehouse value) 2.8 Credit registry coverage (% of adults) 0.0 Procedures (number) 40 Time (days) 505 Getting electricity (rank) 114 Protecting minority investors (rank) 51 Cost (% of claim) 35.9 DTF score for getting electricity (0–100) 69.98 DTF score for protecting minority investors (0–100) 59.17 Procedures (number) 5 Extent of conflict of interest regulation index (0–10) 5.7 Resolving insolvency (rank) 86 Time (days) 136 Extent of shareholder governance index (0–10) 6.2 DTF score for resolving insolvency (0–100) 44.78 Cost (% of income per capita) 440.2 Strength of minority investor protection index (0–10) 5.9 Time (years) 3.0 Cost (% of estate) 10 Paying taxes (rank) 26 Recovery rate (cents on the dollar) 39.6 DTF score for paying taxes (0–100) 85.81 Strength of insolvency framework index (0–16) 7.5 Payments (number per year) 7 Time (hours per year) 139 Total tax rate (% of profit) 41.6 MARSHALL ISLANDS East Asia Pacific GNI per capita (US$) 4,200 Ease of doing business rank (1–189) 139 Overall distance to frontier (DTF) score (0–100) 54.72 Population (m) 0.1 Starting a business (rank) 70 Registering property (rank) 189 Trading across borders (rank) 68 DTF score for starting a business (0–100) 88.37 DTF score for registering property (0–100) 0.00 DTF score for trading across borders (0–100) 76.97 Procedures (number) 5 Procedures (number) NO PRACTICE Documents to export (number) 5 Time (days) 17 Time (days) NO PRACTICE Time to export (days) 23 Cost (% of income per capita) 12.8 Cost (% of property value) NO PRACTICE Cost to export (US$ per container) 695 Minimum capital (% of income per capita) 0.0 Documents to import (number) 5 Getting credit (rank) 71 Time to import (days) 25 Dealing with construction permits (rank) 10 DTF score for getting credit (0–100) 50.00 Cost to import (US$ per container) 720 DTF score for dealing with construction permits (0–100) 86.33 Strength of legal rights index (0–12) 10 Procedures (number) 11 Depth of credit information index (0–8) 0 Enforcing contracts (rank) 58 Time (days) 42 Credit bureau coverage (% of adults) 0.0 DTF score for enforcing contracts (0–100) 64.41 Cost (% of warehouse value) 2.5 Credit registry coverage (% of adults) 0.0 Procedures (number) 36 Time (days) 476 Getting electricity (rank) 68 Protecting minority investors (rank) 183 Cost (% of claim) 27.4 DTF score for getting electricity (0–100) 78.83 DTF score for protecting minority investors (0–100) 26.67 Procedures (number) 5 Extent of conflict of interest regulation index (0–10) 3.3 Resolving insolvency (rank) 168 Time (days) 67 Extent of shareholder governance index (0–10) 2.0 DTF score for resolving insolvency (0–100) 9.19 Cost (% of income per capita) 719.0 Strength of minority investor protection index (0–10) 2.7 Time (years) 2.0 Cost (% of estate) 38 Paying taxes (rank) 128 Recovery rate (cents on the dollar) 17.1 DTF score for paying taxes (0–100) 66.38 Strength of insolvency framework index (0–16) 0 Payments (number per year) 21 Time (hours per year) 128 Total tax rate (% of profit) 64.8 Note: For resolving insolvency, an economy for which “no practice” is recorded for time and cost receives a score of 0 on the strength of insolvency framework index even if its legal framework includes provisions related to insolvency proceedings (liquidation or reorganization). Most indicator sets refer to a case scenario in the largest business city of an economy, except for 11 economies for which the data are a population-weighted average for the 2 largest business cities. See the data notes for more details.
  • 215.
    COUNTRY TABLES 203 Reform making it easier to do business Change making it more difficult to do business MAURITANIA Sub-Saharan Africa GNI per capita (US$) 1,060 Ease of doing business rank (1–189) 176 Overall distance to frontier (DTF) score (0–100) 44.21 Population (m) 3.9 Starting a business (rank) 164 Registering property (rank) 66 Trading across borders (rank) 151 DTF score for starting a business (0–100) 65.83 DTF score for registering property (0–100) 73.57 DTF score for trading across borders (0–100) 55.49 Procedures (number) 7 Procedures (number) 4 Documents to export (number) 8 Time (days) 9 Time (days) 49 Time to export (days) 31 Cost (% of income per capita) 19.8 Cost (% of property value) 4.7 Cost to export (US$ per container) 1,640 Minimum capital (% of income per capita) 331.8 Documents to import (number) 8 Getting credit (rank) 171 Time to import (days) 38 Dealing with construction permits (rank) 77 DTF score for getting credit (0–100) 10.00 Cost to import (US$ per container) 1,523 DTF score for dealing with construction permits (0–100) 74.30 Strength of legal rights index (0–12) 2 Procedures (number) 13 Depth of credit information index (0–8) 0 Enforcing contracts (rank) 86 Time (days) 104 Credit bureau coverage (% of adults) 0.0 DTF score for enforcing contracts (0–100) 58.47 Cost (% of warehouse value) 4.5 Credit registry coverage (% of adults) 4.6 Procedures (number) 46 Time (days) 370 Getting electricity (rank) 169 Protecting minority investors (rank) 166 Cost (% of claim) 23.2 DTF score for getting electricity (0–100) 48.39 DTF score for protecting minority investors (0–100) 38.33 Procedures (number) 5 Extent of conflict of interest regulation index (0–10) 3.7 Resolving insolvency (rank) 189 Time (days) 75 Extent of shareholder governance index (0–10) 4.0 DTF score for resolving insolvency (0–100) 0.00 Cost (% of income per capita) 7,833.4 Strength of minority investor protection index (0–10) 3.8 Time (years) NO PRACTICE Cost (% of estate) NO PRACTICE Paying taxes (rank) 187 Recovery rate (cents on the dollar) 0.0 DTF score for paying taxes (0–100) 17.71 Strength of insolvency framework index (0–16) 0 Payments (number per year) 49 Time (hours per year) 734 Total tax rate (% of profit) 71.3 MAURITIUS Sub-Saharan Africa GNI per capita (US$) 9,300 Ease of doing business rank (1–189) 28 Overall distance to frontier (DTF) score (0–100) 74.81 Population (m) 1.3 Starting a business (rank) 29 Registering property (rank) 98 Trading across borders (rank) 17 DTF score for starting a business (0–100) 92.47 DTF score for registering property (0–100) 66.00 DTF score for trading across borders (0–100) 87.74 Procedures (number) 5 Procedures (number) 4 Documents to export (number) 4 Time (days) 6 Time (days) 14 Time to export (days) 10 Cost (% of income per capita) 2.1 Cost (% of property value) 10.6 Cost to export (US$ per container) 675 Minimum capital (% of income per capita) 0.0 Documents to import (number) 5 Getting credit (rank) 36 Time to import (days) 9 Dealing with construction permits (rank) 117 DTF score for getting credit (0–100) 65.00 Cost to import (US$ per container) 710 DTF score for dealing with construction permits (0–100) 67.17 Strength of legal rights index (0–12) 6 Procedures (number) 13 Depth of credit information index (0–8) 7 Enforcing contracts (rank) 44 Time (days) 245 Credit bureau coverage (% of adults) 0.0 DTF score for enforcing contracts (0–100) 66.22 Cost (% of warehouse value) 0.7 Credit registry coverage (% of adults) 71.9 Procedures (number) 34 Time (days) 519 Getting electricity (rank) 41 Protecting minority investors (rank) 28 Cost (% of claim) 25.0 DTF score for getting electricity (0–100) 83.74 DTF score for protecting minority investors (0–100) 65.00 Procedures (number) 4 Extent of conflict of interest regulation index (0–10) 7.3 Resolving insolvency (rank) 43 Time (days) 84 Extent of shareholder governance index (0–10) 5.7 DTF score for resolving insolvency (0–100) 62.81 Cost (% of income per capita) 277.0 Strength of minority investor protection index (0–10) 6.5 Time (years) 1.7 Cost (% of estate) 15 Paying taxes (rank) 13 Recovery rate (cents on the dollar) 67.4 DTF score for paying taxes (0–100) 91.92 Strength of insolvency framework index (0–16) 8.5 Payments (number per year) 8 Time (hours per year) 152 Total tax rate (% of profit) 24.5 MEXICO Latin America Caribbean GNI per capita (US$) 9,940 Ease of doing business rank (1–189) 39 Overall distance to frontier (DTF) score (0–100) 71.53 Population (m) 122.3 Starting a business (rank) 67 Registering property (rank) 110 Trading across borders (rank) 44 DTF score for starting a business (0–100) 88.85 DTF score for registering property (0–100) 62.45 DTF score for trading across borders (0–100) 81.26 Procedures (number) 6 Procedures (number) 6.8 Documents to export (number) 4 Time (days) 6.3 Time (days) 63.7 Time to export (days) 12 Cost (% of income per capita) 18.6 Cost (% of property value) 5.1 Cost to export (US$ per container) 1,499 Minimum capital (% of income per capita) 0.0 Documents to import (number) 4 Getting credit (rank) 12 Time to import (days) 11.2 Dealing with construction permits (rank) 108 DTF score for getting credit (0–100) 80.00 Cost to import (US$ per container) 1,888 DTF score for dealing with construction permits (0–100) 68.43 Strength of legal rights index (0–12) 8 Procedures (number) 11.3 Depth of credit information index (0–8) 8 Enforcing contracts (rank) 57 Time (days) 87.6 Credit bureau coverage (% of adults) 100.0 DTF score for enforcing contracts (0–100) 64.61 Cost (% of warehouse value) 10.3 Credit registry coverage (% of adults) 0.0 Procedures (number) 36.8 Time (days) 389 Getting electricity (rank) 116 Protecting minority investors (rank) 62 Cost (% of claim) 30.9 DTF score for getting electricity (0–100) 68.47 DTF score for protecting minority investors (0–100) 57.50 Procedures (number) 6.8 Extent of conflict of interest regulation index (0–10) 6.0 Resolving insolvency (rank) 27 Time (days) 78.9 Extent of shareholder governance index (0–10) 5.5 DTF score for resolving insolvency (0–100) 72.59 Cost (% of income per capita) 346.1 Strength of minority investor protection index (0–10) 5.8 Time (years) 1.8 Cost (% of estate) 18 Paying taxes (rank) 105 Recovery rate (cents on the dollar) 68.1 DTF score for paying taxes (0–100) 71.17 Strength of insolvency framework index (0–16) 11.5 Payments (number per year) 6 Time (hours per year) 334 Total tax rate (% of profit) 51.8 Note: For resolving insolvency, an economy for which “no practice” is recorded for time and cost receives a score of 0 on the strength of insolvency framework index even if its legal framework includes provisions related to insolvency proceedings (liquidation or reorganization). Most indicator sets refer to a case scenario in the largest business city of an economy, except for 11 economies for which the data are a population-weighted average for the 2 largest business cities. See the data notes for more details.
  • 216.
    204 DOING BUSINESS2015 Reform making it easier to do business Change making it more difficult to do business MICRONESIA, FED. STS. East Asia Pacific GNI per capita (US$) 3,430 Ease of doing business rank (1–189) 145 Overall distance to frontier (DTF) score (0–100) 53.07 Population (m) 0.1 Starting a business (rank) 151 Registering property (rank) 189 Trading across borders (rank) 106 DTF score for starting a business (0–100) 69.63 DTF score for registering property (0–100) 0.00 DTF score for trading across borders (0–100) 69.42 Procedures (number) 7 Procedures (number) NO PRACTICE Documents to export (number) 5 Time (days) 16 Time (days) NO PRACTICE Time to export (days) 30 Cost (% of income per capita) 141.2 Cost (% of property value) NO PRACTICE Cost to export (US$ per container) 1,045 Minimum capital (% of income per capita) 0.0 Documents to import (number) 6 Getting credit (rank) 61 Time to import (days) 31 Dealing with construction permits (rank) 37 DTF score for getting credit (0–100) 55.00 Cost to import (US$ per container) 1,045 DTF score for dealing with construction permits (0–100) 80.10 Strength of legal rights index (0–12) 11 Procedures (number) 14 Depth of credit information index (0–8) 0 Enforcing contracts (rank) 162 Time (days) 99 Credit bureau coverage (% of adults) 0.0 DTF score for enforcing contracts (0–100) 40.85 Cost (% of warehouse value) 0.5 Credit registry coverage (% of adults) 0.0 Procedures (number) 34 Time (days) 885 Getting electricity (rank) 30 Protecting minority investors (rank) 186 Cost (% of claim) 66.0 DTF score for getting electricity (0–100) 85.89 DTF score for protecting minority investors (0–100) 23.33 Procedures (number) 3 Extent of conflict of interest regulation index (0–10) 2.7 Resolving insolvency (rank) 118 Time (days) 105 Extent of shareholder governance index (0–10) 2.0 DTF score for resolving insolvency (0–100) 37.74 Cost (% of income per capita) 363.8 Strength of minority investor protection index (0–10) 2.3 Time (years) 5.3 Cost (% of estate) 38 Paying taxes (rank) 114 Recovery rate (cents on the dollar) 3.3 DTF score for paying taxes (0–100) 68.78 Strength of insolvency framework index (0–16) 11.5 Payments (number per year) 21 Time (hours per year) 128 Total tax rate (% of profit) 60.5 MOLDOVA Europe Central Asia GNI per capita (US$) 2,460 Ease of doing business rank (1–189) 63 Overall distance to frontier (DTF) score (0–100) 66.60 Population (m) 3.6 Starting a business (rank) 35 Registering property (rank) 22 Trading across borders (rank) 152 DTF score for starting a business (0–100) 92.16 DTF score for registering property (0–100) 86.10 DTF score for trading across borders (0–100) 54.97 Procedures (number) 5 Procedures (number) 5 Documents to export (number) 9 Time (days) 6 Time (days) 5.5 Time to export (days) 23 Cost (% of income per capita) 4.6 Cost (% of property value) 0.9 Cost to export (US$ per container) 1,510 Minimum capital (% of income per capita) 0.0 Documents to import (number) 11 Getting credit (rank) 23 Time to import (days) 27 Dealing with construction permits (rank) 175 DTF score for getting credit (0–100) 70.00 Cost to import (US$ per container) 1,870 DTF score for dealing with construction permits (0–100) 48.11 Strength of legal rights index (0–12) 8 Procedures (number) 27 Depth of credit information index (0–8) 6 Enforcing contracts (rank) 42 Time (days) 247 Credit bureau coverage (% of adults) 8.8 DTF score for enforcing contracts (0–100) 66.68 Cost (% of warehouse value) 0.8 Credit registry coverage (% of adults) 0.0 Procedures (number) 31 Time (days) 567 Getting electricity (rank) 149 Protecting minority investors (rank) 56 Cost (% of claim) 28.6 DTF score for getting electricity (0–100) 59.73 DTF score for protecting minority investors (0–100) 58.33 Procedures (number) 7 Extent of conflict of interest regulation index (0–10) 6.3 Resolving insolvency (rank) 58 Time (days) 118 Extent of shareholder governance index (0–10) 5.3 DTF score for resolving insolvency (0–100) 53.32 Cost (% of income per capita) 865.1 Strength of minority investor protection index (0–10) 5.8 Time (years) 2.8 Cost (% of estate) 15 Paying taxes (rank) 70 Recovery rate (cents on the dollar) 29.4 DTF score for paying taxes (0–100) 76.57 Strength of insolvency framework index (0–16) 12 Payments (number per year) 21 Time (hours per year) 185 Total tax rate (% of profit) 39.7 MONGOLIA East Asia Pacific GNI per capita (US$) 3,770 Ease of doing business rank (1–189) 72 Overall distance to frontier (DTF) score (0–100) 65.02 Population (m) 2.8 Starting a business (rank) 42 Registering property (rank) 30 Trading across borders (rank) 173 DTF score for starting a business (0–100) 91.33 DTF score for registering property (0–100) 82.76 DTF score for trading across borders (0–100) 30.18 Procedures (number) 5 Procedures (number) 5 Documents to export (number) 11 Time (days) 11 Time (days) 10.5 Time to export (days) 44 Cost (% of income per capita) 1.2 Cost (% of property value) 2.1 Cost to export (US$ per container) 2,745 Minimum capital (% of income per capita) 0.0 Documents to import (number) 12 Getting credit (rank) 61 Time to import (days) 45 Dealing with construction permits (rank) 74 DTF score for getting credit (0–100) 55.00 Cost to import (US$ per container) 2,950 DTF score for dealing with construction permits (0–100) 74.62 Strength of legal rights index (0–12) 5 Procedures (number) 16 Depth of credit information index (0–8) 6 Enforcing contracts (rank) 24 Time (days) 137 Credit bureau coverage (% of adults) 0.0 DTF score for enforcing contracts (0–100) 70.17 Cost (% of warehouse value) 0.0 Credit registry coverage (% of adults) 32.7 Procedures (number) 32 Time (days) 374 Getting electricity (rank) 142 Protecting minority investors (rank) 17 Cost (% of claim) 30.6 DTF score for getting electricity (0–100) 60.91 DTF score for protecting minority investors (0–100) 67.50 Procedures (number) 8 Extent of conflict of interest regulation index (0–10) 7.0 Resolving insolvency (rank) 90 Time (days) 79 Extent of shareholder governance index (0–10) 6.5 DTF score for resolving insolvency (0–100) 43.93 Cost (% of income per capita) 600.6 Strength of minority investor protection index (0–10) 6.8 Time (years) 4.0 Cost (% of estate) 15 Paying taxes (rank) 84 Recovery rate (cents on the dollar) 17.8 DTF score for paying taxes (0–100) 73.79 Strength of insolvency framework index (0–16) 11 Payments (number per year) 41 Time (hours per year) 148 Total tax rate (% of profit) 24.4 Note: For resolving insolvency, an economy for which “no practice” is recorded for time and cost receives a score of 0 on the strength of insolvency framework index even if its legal framework includes provisions related to insolvency