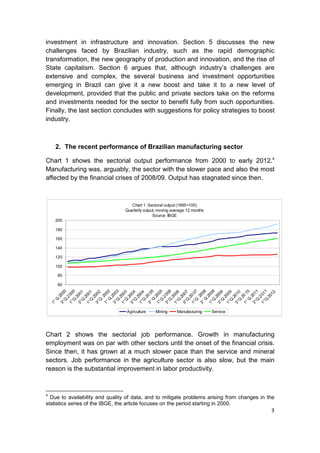
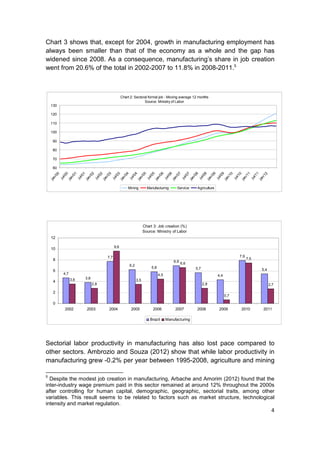
SlideShare a Scribd company logo
Is Brazilian Manufacturing Losing its Drive?


                                       Jorge Arbache1


                                             Abstract

Brazil has built over the decades, with great effort and sacrifice, a dynamic, integrated
manufacturing sector that has helped the country grow and become one of the world’s largest
economies. Recently, though, basic indicators, such as the performance of output and
employment, have suggested that manufacturing is growing slower than other sectors and its
share in total output is on the wane. The problem with this type of analysis is that it may lead to
misleading conclusions due to the substantial transformations which industrial activity has
undergone, such as the vertical specialization that decentralizes and fragments production with
gains in efficiency and innovation, and the more than proportional increase in consumption of
services in economies that have urbanized and modernized. For this reason, a careful
examination of the evolution of the drive of the Brazilian manufacturing sector requires broader,
comparative analyses, combined with the usual analysis of performance indicators at the
domestic level. This article employs the industry-space method (Arbache 2012), a simple but
useful tool for comparative analysis of industrial development, to assess the case of Brazil. We
find evidence that the Brazilian manufacturing sector is indeed losing its drive both at national
and international levels. The article discusses the origins of the slowdown, and the new
challenges faced by Brazilian industry. The article argues that, although challenges are
extensive and complex, several business and investment opportunities emerging in Brazil can
give a new boost to the manufacturing sector and take it to a new level of development,
provided that the public and private sectors undertake the reforms and actions needed for
industry to benefit fully from such opportunities. The article closes by discussing policy
strategies that can boost the industrial sector.


                                         October 2012


Keywords: Manufacturing sector, competitiveness, productivity, international
trade, innovation, industrial policies, Brazil

JEL Codes: F14, L60, O14, 025


1
  Professor of Economics at the University of Brasilia and Advisor to the President of the
Brazilian Development Bank (BNDES). This article does not necessarily represent the opinions
and views of the BNDES and its Board of Directors. I would like to thank Andrea Goldstein,
Ernesto Lozardo, Philip Schellekens, Victor Burns, Gianna Sagazio, and Fabiano Bastos for
their useful comments and suggestions on an earlier version of this article. Contact:
Jarbache@gmail.com.
                                                                                                 1
1. Introduction

With great effort and sacrifice, Brazil has built a dynamic, integrated
manufacturing that has helped the country grow and become one of the world’s
largest economies.2 Recently, though, basic indicators, such as the
performance of output and employment, have suggested that the manufacturing
sector is growing slower than other sectors and its share of the economy is on
the wane. These transformations, which are not particular to Brazil, but rather to
emerging economies that integrate the world economy, have led many to claim
an across-the-board reduction in manufacturing’s share in GDP.

The problem with this type of analysis is that it may lead to misleading
conclusions. This is because of (i) the substantial transformations which
industrial activity has undergone, such as the vertical specialization that
decentralizes and fragments production with gains in efficiency and innovation;3
(ii) the more than proportional increase in consumption of services in economies
that have been urbanized and modernized (Rowthorn and Ramaswamy 1997);
and (iii) the methodological difficulties in calculating the sectorial share of
manufacturing in GDP associated with the increasingly complex relationship
between this and the service sector. Besides these factors, there are others
specifically related to Brazil, such as the “overindustrialization” in the 1970s
associated with the import substitution industrialization era (Bonelli and Pessoa
2010), problems with relative prices and deflators of output and investment
(Ferreira et al 2008), changes in national statistics, among others.

For these reasons, an examination of the drive in Brazilian manufacturing
requires broader and comparative analyses, combined with the usual analysis
of performance indicators at the domestic level. In order to do so, this article
employs the industry-space method (Arbache 2012), a simple but useful tool for
comparative analysis of industrial development over time. We find evidence that
Brazilian industry is indeed losing its drive at the international level. This result
confirms and strengthens previous findings using domestic level data.

This article is organized as follows. Section 2 examines basic industry
performance indicators at the domestic level. Section 3 undertakes a
comparative analysis of industrial development at the international level.
Section 4 discusses the origins of the slowdown in the drive of the Brazilian
manufacturing, highlighting issues such as low labor productivity and low

2
  There is a rich empirical literature suggesting that economic development and long term
growth are associated with a modern, diversified and integrated industrial sector (e.g. United
Nations 2007).
3
  Cross-border investment, offshore trade, outsourcing and value chains brought substantial
changes to trade pattern and industrial production. The existing international trade statistics are
still based on traditional trade, which is difficult to accurately reflect the entire process of global
production chain and unable to consider changes in international trade and production.
                                                                                                     2
investment in infrastructure and innovation. Section 5 discusses the new
challenges faced by Brazilian industry, such as the rapid demographic
transformation, the new geography of production and innovation, and the rise of
State capitalism. Section 6 argues that, although industry’s challenges are
extensive and complex, the several business and investment opportunities
emerging in Brazil can give it a new boost and take it to a new level of
development, provided that the public and private sectors take on the reforms
and investments needed for the sector to benefit fully from such opportunities.
Finally, the last section concludes with suggestions for policy strategies to boost
industry.


    2. The recent performance of Brazilian manufacturing sector

Chart 1 shows the sectorial output performance from 2000 to early 2012.4
Manufacturing was, arguably, the sector with the slower pace and also the most
affected by the financial crises of 2008/09. Output has stagnated since then.


                                    Chart 1: Sectoral output (1995=100)
                                 Quarterly output, moving average 12 months
                                                Source: IBGE
    200

    180

    160

    140

    120

    100

     80

     60
       Q 0

       Q 0


       Q 2
       Q 3


       Q 5
       Q 5

       Q 6


       Q 7

       Q 8
       Q 8


       Q 0
       Q 1

       Q 1
       Q 1

       Q 1

       Q 2


       Q 3

       Q 4

       Q 4


       Q 6

       Q 7


       Q 9

       Q 9

       Q 0


              2
    3° 200

    1° 00


    1° 200

    3° 200


    3° 0 0

    1° 200

    3° 00


    1° 0 0

    3° 200

    1° 200


    1° 0 1

    3° 201

    1° 01
    3° 00

    1° 00

    3° 00


    1° 00

    3° 00

    1° 00


    1° 00

    3° 00


    3° 00

    1° 00

    3° 01


           01
        .2

        .2

        .2

        .2


        .2

        .2

        .2

        .2


        .2

        .2

        .2

        .2


        .2

        .2

        .2

        .2


        .2

        .2
         .


         .


         .


         .


         .
        .


        .
       Q
    1°


                                 Agriculture     Mining     Manufacturing     Service


Chart 2 shows the sectorial job performance. Growth in manufacturing
employment was on par with other sectors until the onset of the financial crisis.
Since then, it has grown at a much slower pace than the service and mineral
sectors. Job performance in the agriculture sector is also slow, but the main
reason is the substantial improvement in labor productivity.


4
  Due to availability and quality of data, and to mitigate problems arising from changes in the
statistics series of the IBGE, the article focuses on the period starting in 2000.
                                                                                             3
Chart 3 shows that, except for 2004, growth in manufacturing employment has
always been smaller than that of the economy as a whole and the gap has
widened since 2008. As a consequence, manufacturing’s share in job creation
went from 20.6% of the total in 2002-2007 to 11.8% in 2008-2011.5


                                                           Chart 2: Sectoral formal job - Moving average 12 months
                                                                          Source: Ministry of Labor
    130

    120

    110

    100

     90

     80

     70

     60
      00

              0
                     01

                             1

                                    02

                                                 2
                                               03

                                                 3
                                               04

                                                 4

                                               05

                                                 5

                                               06

                                                 6
                                               07

                                                 7
                                               08

                                                 8

                                               09

                                                 9
                                               10

                                                 0
                                               11

                                                 1

                                               12
             l/0


                            l/0


                                             l/0


                                             l/0


                                             l/0


                                             l/0


                                             l/0


                                             l/0


                                             l/0


                                             l/0


                                             l/1


                                             l/1
      n/


                     n/


                                    n/


                                            n/


                                            n/


                                            n/


                                            n/


                                            n/


                                            n/


                                            n/


                                            n/


                                            n/


                                            n/
           ju


                          ju


                                           ju


                                           ju


                                           ju


                                           ju


                                           ju


                                           ju


                                           ju


                                           ju


                                           ju


                                           ju
    ja


                   ja


                                  ja


                                          ja


                                          ja


                                          ja


                                          ja


                                          ja


                                          ja


                                          ja


                                          ja


                                          ja


                                          ja
                                                               Mining         Manufacturing        Service    Agriculture


                                                                            Chart 3: Job creation (%)
                                                                            Source: Ministry of Labor
    12

                                                     9,6
    10

                                               7,7                                                                                      7,9
     8                                                                                                                                        7,5
                                                                                                 6,9 6,6
                                                                6,2
                                                                                 5,8                         5,7
     6                                                                                                                                              5,4
             4,7                                                                       4,5                                  4,4
                    3,6           3,8
     4                                                                3,5
                                         2,8                                                                       2,8                                    2,7

     2
                                                                                                                                  0,7

     0
               2002                2003        2004              2005             2006            2007       2008           2009         2010       2011

                                                                                Brazil       Manufacturing


Sectorial labor productivity in manufacturing has also lost pace compared to
other sectors. Ambrozio and Souza (2012) show that while labor productivity in
manufacturing grew -0.2% per year between 1995-2008, agriculture and mining

5
  Despite the modest job creation in manufacturing, Arbache and Amorim (2012) found that the
inter-industry wage premium paid in this sector remained at around 12% throughout the 2000s
after controlling for human capital, demographic, geographic, sectorial traits, among other
variables. This result seems to be related to factors such as market structure, technological
intensity and market regulation.
                                                                                                                                                           4
grew 6.7% and 4.4%, respectively. Using a different set of data, IPEA (2012)
finds that labor productivity in manufacturing grew -0.9% per year between
2000-2009, while it grew 4.3%, 1.8% and 0.5% in the agriculture, mining and
service sectors, respectively.

Chart 4 shows that manufacturing goods represented 54.7% of total exports in
the beginning of the decade, but by 2011 their participation fell to 36%. Primary
products, in their turn, increased from 28% to 47.8%, becoming the defining
sector for the insertion of the Brazilian economy in the global trade arena.6

There were also significant changes in export coefficients and import
penetration, as shown in chart 5. Import penetration increased rapidly in several
sectors, including those which were traditionally occupied by domestic
companies, such as consumer goods. In the beginning of 2012, some 23.7% of
apparent consumption in the textile sector was being imported against 8.1% in
2000; clothes, 10.6% against 1.2%; leather artifacts, 46.1% against 6.6%;
chemicals, 25.7% against 15.3%; and rubber, 25.6% from 11.1%. Puga and
Nascimento (2010) show that import penetration increased more rapidly in the
labor and scale-intensive sectors.

Manufacturing trade, which was in surplus for several years, fell rapidly from
2006 and became a deficit by end of the decade – in 2011 the trade balance of
manufactured products was minus US$ 43.2 billion. If we exclude for a moment
the surplus in the low technological products group, which includes foodstuff,
lumber and pulp sectors, the manufacturing trade deficit would jump to US$
86.1 billion, almost three times the total trade surplus in that year. The Brazilian
trade balance is still in surplus thanks to primary products. Sarquis (2011)
identified a falling trend in the Brazilian intra-industry trade, while Baumann
(2012) found that Brazilian industrial exports are increasingly out of synch with
trends in the worldwide demand for manufactured products. Such evidence is a
strong sign that Brazilian industry is being left by the wayside in relation to
global manufacturing.


6
    Part of this fall is related to the high prices of primary products in the 2000s.
                                                                                        5
Chart 4: Exports by sector - % of total
                                                                    Source: Ministry of Trade and Development
 65
 60
 55
 50
 45
 40
 35
 30
 25
 20
 15
 10
  5
  0
      2000          2001           2002            2003             2004                 2005             2006           2007          2008       2009        2010         2011          2012 Jan-
                                                                                                                                                                                            Apr
                                                               Basic products                     Semi-basic products                    Manufacturing


                                                      Chart 5: Export coefficient and import penetration (%)
                                                           Source: Confederation of National Industry
 25


                                                                                                                                                                                                   20,7
                                                                                                                                                                                  19,1
                                                                                                18,7


                                                                                                                 18,5

 20

                                                                                                                                18,0
                                                                           17,3


                                                                                                                                                      17,3
                                                                                                                                               16,8
                                                      15,7


                                                                                                                                                                    15,4
                                                                                                                                       15,3


                                                                                                                                                             15,0


                                                                                                                                                                                            15,0
                                                                                                                                                                           14,6
                                                                                                                        13,5
                                     13,4


 15
                     12,3
                            11,8


                                                                                                       11,9
             11,6
      11,4


                                                                                  11,1
                                            10,5


                                                             10,3


 10


  5


  0
      2000           2001           2002              2003             2004                     2005             2006           2007           2008          2009          2010             2011

                                                                       Export coefficient                        Import penetration


Chart 6 shows a falling trend in the manufacturing share in GDP. In 2011, the
manufacturing share was 14.6%, less than half of the figures recorded in the
early 1980s. The falling trend in manufacturing together with previous
indicators, suggest that the Brazilian manufacturing sector is losing its drive at
the domestic level.


                                                                                                                                                                                                   6
Chart 6: Manufacturing share on GDP (%)
                                               Source: WDI - World Bank
 20

                                                   19,2
 19


 18                                      18,0                18,1

           17,2      17,1
 17                            16,9
                                                                                           16,6      16,7
                                                                       16,4                                    16,2
 16
                                                                                 15,4
 15
                                                                                                                         14,6
 14
        2000      2001      2002      2003      2004      2005      2006      2007      2008      2009      2010      2011


      3. International comparison

To further analyze whether Brazilian industry is truly losing its drive, it is
necessary to go beyond the usual analysis of performance indicators, as
previously discussed, and assess it from the international perspective. To do so,
we make use of the industry-space analysis (Arbache 2012). Industry-space is
the locus where two simple, but revealing variables for analyzing industrial
development over time meet. The first variable is the manufacturing share in
GDP. The second is industrial density, which is manufacturing’s value added
per-capita. Industrial density captures the capacity, and perhaps the willingness,
of a society to build infrastructure, invest in physical and human capital and in
R&D, and to reform institutions and manage such resources so as to foster
industrial development (Arbache 2012). As this variable is strongly affected by
the size of the population and the demographic development, the focus of
analysis of this variable should go to the rate of growth rather than to its level
only.

As put forward by Arbache (2012), the relationship between the manufacturing
share in GDP and industrial density is complex and in fact it is difficult to predict
whether it will be positive or negative. The positive relationship is more likely to
occur in emerging economies that are still building and developing industrial
infrastructure. The weak or negative relationship is more likely to occur in
advanced economies whose industries are already mature and have
specialized in high-end manufactured products with lots of technological
services embodied, such as the iPad. Arbache (2012) finds empirical evidence
of a positive relationship up to a point; afterwards the manufacturing share
stagnates or even retreats, while industrial density keeps rising.

Brazilian industrial development from the international perspective

                                                                                                                        7
Charts 7 and 8 present the averages of the manufacturing share in Brazil’s
output and industrial density and in a sample of countries from 2000 to 2011.7
The average share of Brazilian manufacturing was 16.9%, comparable to that in
developed countries such as the United States, Canada, France and the
Netherlands, but quite below that in East Asian countries, such as South Korea,
China, Thailand, and Malaysia. Chart 7 shows that Brazil’s industrial density,
with an average of US$ 590, was closer to that in emerging economies such as
China, South Africa and Latin American countries, but substantially smaller than
that in developed economies. Therefore, comparing the share of manufacturing
in GDP in countries at very different stages of industrial development may be
misleading.


                                               Chart 7: Manufacturing share on GDP (%) average 2000-2011
                                                               Source: WDI - World Bank


                                                                                                                                                                                    34,5
        40


                                                                                                                                                                             32,0
        35


                                                                                                                                                                      28,6
                                                                                                                                                               27,5
                                                                                                                                                        26,1
                                                                                                                                                 24,2
        30


                                                                                                                                          22,5
                                                                                                                            20,9

                                                                                                                                   20,9
                                                                                                                     19,8
                                                                                                              19,6
        25
                                                                                                       18,6
                                                                                                18,2
                                                                                         17,7
                                                                                  17,2
                                                                           16,9
                                                                    16,6
                                                             15,8
                                                      15,4
                                               15,1
                                 14,0

                                        14,1


        20
                          13,5
                   10,0


        15
             9,8


        10
         5
         0


                                         nd
                     Un Fr y


                             Th ina
                                           a


                            co ada


                               un n


                                           e
                                           s


                              ng y
                            G tin a


                                          ia
                               No ia


                                         ce


                    e r ut h la
                           co ca
                              ne zil


                            M rea
                                         ey
                                         es
                                         ile
                               er s


                               M s


                           Ar r ies
                                       ic o


                                       sia
                          Si an
                                         a


                           In or
                                      pa
                                        di
                                      nd
                                       te


                                        e


                         ou es
                                    ab


                                        e
                                   rw


                          Ve a
                         ite a n


                                    la
                                    rk
                                  Ch


                                    t ri


                                    f ri

                                   t ri
                                   In


                                 Ch
                Am So zu
                        Ne St a


                                 ap
                                  ex


                                  ay
                                 Ko
                                 Br
                       m Ca n


                                 Ja


                                  m
                                  la


                                   n
                                   t


                        S on


                                 ai
                                Ar


                       ica A
                                un


                               Tu
                               un


                               ge

                               er


                               al
                              d
                             th
                           co
        i


                             d
                            th
      ud


                         e


                         e
    Sa


                       m
                    co


                   co
                 in


                 in
             gh


               e
           tin


            dl
          Hi


         id
       La


       M


7
  All the data pertaining to the industry-space analysis is from the World Development
Indicators, World Bank. Industry value added is in constant dollars of 2000. The sample of
countries is highly diversified in terms of geography, income per capita and economic
characteristics.
                                                                                                                                                                                    8
Chart 8: Industrial density (constant US$) - average 2000-2011


                                                                                                                                                                       8249
  9000
  8000


                                                                                                                                                                6761
  7000


                                                                                                                                                         5406
                                                                                                                                                  4998
  6000


                                                                                                                                           4478
                                                                                                                                    3826
  5000


                                                                                                                      3719

                                                                                                                             3731
                                                                                                               3431
                                                                                                        3125
  4000
  3000


                                                                                                 1454
                                                                                          1336
                                                                                   1026
                                                                            1003
  2000


                                                                      966
                                                                954
                                                    829

                                                          843
                                              729
                                        590
                            558

                                  562
                      369
                259


  1000
           88


     0


                           ne d


                           Ca a y
                                        a
                co Ind dia


                 co th da
                         co esia


                            Fr a


                                        e

                                        n
                           No s


                            St y
                                        a


                           M ia


                         th nce
                            un l


                                        a


                         co rea
                           iA y


                         G ies
                                      ile
                          Th ies


                          ng e s
                                      es


                         M ico

                        Ar ysia
                        co z i


                                   an
                                     in


                                    or

                                   pa
                       Ve lan


                                  nd
                        ud r ke


                                    in
                                    el
                                  ric


                                    b


                                rw
                      n Bra


                      ou na
                               Ch
                                 tr i


                                 at
                                In


                              Ch


                                ra


                                 tr
                               zu


                                nt


                              ap
                              ex
                                 tr


                             Ko


                               m


                             Ja
                               la
                    Ne a
                              Af
                   m on


                             ai


                               a
                    S a Tu


                            un
                            un


                           ge


                            er


                           er
                            al
                           h


                          d
                        ut


                       Si
                      ite
                    So


                      e
                      e


                   Un
                    S

                    m
                  ica
               er


              in
              in


            Am


           gh
       e
    dl


        tin


        Hi
  id


     La
 M


Charts 9 and 10 present the industry-space in 2000 and 2011. It is worth noting
the significant increase in industrial density in Korea, Singapore and China, as
well as the drop in the manufacturing share in total output in France, Argentina
and Chile. Brazil’s manufacturing share also fell, as discussed before, while
industrial density increased slightly in the period. The gap between Brazil’s
manufacturing share and the sample’s average remained almost the same in
2000 and in 2011, at around 17% below the sample’s average. The same
persistence applied to industrial density, which remained at around 76% below
the sample’s average. More important than this persistence is the deterioration
of Brazil’s relative position compared to industrial competitors such as China,
Korea and Singapore, and even in relation to rising industrial powerhouses such
as Malaysia and Thailand.

The industry-space analysis suggests that Brazilian manufacturing is losing its
drive at the international level as well, while the economy is increasingly relying
on primary products. Among the expected implications of this impoverished
insertion of Brazil internationally are the exposure to sudden changes in terms
of trade, reduced capacity for technological and innovation development, and
lower and more volatile long-term economic growth. Indeed, stylized facts show
that commodity prices are extremely volatile, and the experience in the last
decades indicates that such prices are highly subjected to public and even
private interventions. Empirical evidence also reveals that countries that depend
on commodity exports present economic growth that is slower than that in
countries with a more diverse export portfolio, which is related to its higher
exposure to shocks and to the negative impacts of volatility in investment
decisions, fiscal revenue, export revenue and productivity (Loayza, Servén and
Ventura 2007). Lederman and Maloney (2007, 2008) show that this is not due
to the export of primary goods per se, but rather to the low diversification of
exports associated to low growth. Cavalcanti, Mohaddes and Raissi (2011)

                                                                                                                                                                       9
present empirical evidence that rising commodity prices might bring some
benefits, but they also reveal that these benefits tend to be dominated by the
downside of commodity price volatility, which would explain the long-term low
growth tendency in countries that depend more on primary goods. Arbache and
Page (2007) show that countries that depend more on commodity exports grow
little, not because of a lack of the capacity to grow, but because they experience
stronger growth accelerations and stronger growth collapses, which make
average growth low in the long term. The authors also show that shocks in the
terms of trade are among the main causes of growth accelerations and
collapses in these countries. Cardoso and Teles (2010) show that fluctuations in
Brazilian output around the potential output between 1900 and 2008 are
strongly associated with shocks in the terms of trade.

                                             Chart 9: Industry-space 2000

                            10000

                             9000

                             8000                                         JPN


                             7000
 Industrial density (US$)


                             6000                                                     SGP

                                                             USA
                             5000                                               GER
                                                              HIC
                                                                    CAN
                             4000
                                                 NRW         NTL
                                                              FRC
                             3000                                                       KOR

                             2000
                                                          ARG
                                                                   MEX                           MAL
                             1000            SAU                    VNZ
                                                              LAC CHL     TUR
                                                           BRA                                        THA
                                                       IND      SAR     MIC                        CHN
                                                                                       IDN
                                0
                                    0   5   10          15          20           25         30         35   40
                                                          Man. share on GDP (% )


                                                                                                             10
Chart 10: Industry-space 2011

                               10000

                                9000                                     JPN
                                                                            CIN

                                8000

                                7000
    Industrial density (US$)


                                6000
                                                         USA
                                5000                                         GER                    KOR
                                                           HIC

                                4000           NRW
                                                        NTL
                                                      CAN
                                3000                FRC

                                2000                            ARG

                                                                 MEX                     MAL
                                                SAU                 TUR
                                1000              CHL       VNZ PLA                                 CHN        THA
                                                          BRA
                                                                       MIC
                                                    IDN IND SAR
                                   0
                                       0   5   10          15           20          25         30         35         40
                                                               Man. share on GDP (% )


Table 1 shows the industry-space for 2011 divided into four quadrants created
according to the sample’s averages. Countries were mapped out accordingly.
As expected, countries with strong industry and that focused on exports of high
value added industrial products fell into the first quadrant (Q1). This is the case
for Germany, Japan, South Korea and Singapore, or the countries whose
manufacturing could be called “Champions”. Countries with mature industry and
with a modern and sophisticated service sector, such as the United States,
France, Canada, the Netherlands and Norway, fell into the second quadrant
(Q2). Their manufacturing could be called “Mature”. Medium income countries
and those that foster policies to develop and strengthen their industries fell into
the fourth quadrant (Q4). These are the cases for China, Malaysia and
Thailand, or those countries whose manufacturing could be called “Tigers”.
Finally, the third quadrant (Q3) presents countries whose manufacturing sectors
lack drive, that are losing their drive, or those whose primary sectors are either
effectively, or are becoming dominant in the economy. This group includes
Venezuela, Saudi Arabia and Mexico, which depend heavily on oil; Chile, which
prioritized the development of the mining, agricultural and fishing sectors; South
Africa, which focuses heavily on mining, agriculture and services and whose
industry has faced severe hardships related to the apartheid;8 India, the second
world’s most populous country, the one with the largest poor population, and

8
    For more details, see Draper and Alves (2009).
                                                                                                                      11
with a large agriculture and service sectors; and Latin American countries,
                                              whose economies generally rely on commodities and have a significant informal
                                              sector. These are the countries whose manufacturing could be called
                                              “Laggards”. Brazil is in this last group.9

                                                                        Table 1: Mapping out countries -- 2011

                                              Canada                                      Q2      Germany                                 Q1
production) – below average / above average


                                              France                                              Japan
                                              High Income Countries                               Singapore
Industrial density (per capita industrial


                                              Norway                                              South Korea
                                              The Netherlands
                                              United States
                                              Argentina                                   Q3      China                                   Q4
                                              Brazil                                              Middle Income Countries
                                              Chile                                               Malaysia
                                              India                                               Thailand
                                              Indonesia
                                              Latin American Countries
                                              Mexico
                                              Saudi Arabia
                                              South Africa
                                              Turkey
                                              Venezuela
                                                                      Share of manufacturing on GDP (%) – below average / above average


                                              To advance the examination of Brazilian industry’s drive further, we compare
                                              Brazil to select countries. The comparison of the Brazilian experience with
                                              China’s (Chart 11) shows large discrepancies in participation rates and in
                                              industrial density. The participation of Chinese industry in the economy is nearly
                                              twice that of Brazil. Chinese industrial density, however, started at a much lower
                                              level than Brazil’s, at US$ 304 against US$ 551 in Brazil in 2000. However, as it
                                              increased rapidly, among others, due to policies introduced to foster industrial
                                              development, including R&D, credit and export promotion, by 2007 China’s
                                              industrial density overtook Brazil’s, reaching US$ 904 in 2011, while Brazilian
                                              industrial density was practically stagnant. Our simulations suggest that, with
                                              the lasting and increasing rhythm of industrial density seen in the last decade,
                                              China’s industry will fall into Q1 before the end of this decade. The comparison
                                              between the two countries highlights the fact that the industrial density growth
                                              rate is just as, or is even more important than its level. It also emphasizes the
                                              importance of public policies aimed at fostering and supporting industrial
                                              development.


                                              9
                                               The industry-space method is strongly affected by the size and composition of the sample of
                                              countries. The inclusion of several African countries in the sample would significantly alter the
                                              averages and, therefore, the classification of the countries in the quadrants of Table 1.
                                                                                                                                            12
Chart 11: Brazil vs. China

                         35                                                                                                              1000
                                                                                                                                          900
                         30


                                                                                                     Industrial density (constant US$)
                                                                                                                                          800
 Man. share on GDP (%)


                         25                                                                                                               700

                         20                                                                                                               600
                                                                                            Brazil                                        500                                                                 Brazil
                         15                                                                 China                                                                                                             China
                                                                                                                                          400

                         10                                                                                                               300
                                                                                                                                          200
                          5
                                                                                                                                          100
                          0                                                                                                                 0
                              2000 2001 2002 2003 2004 2005 2006 2007 2008 2009 2010 2011                                                       2000 2001 2002 2003 2004 2005 2006 2007 2008 2009 2010 2011


The comparison with South Korea shows that the participation rate of Korean
industry, which was already substantially higher than Brazil’s at the beginning of
the decade, continued on an upward path and, by the end of the period, it was
almost twice Brazil’s participation (Chart 12). Industrial density, in its turn, which
was almost five times that in Brazil at the beginning of the decade, grew rapidly
and, in 2010, was eight times larger. The Korean case also draws attention to
the relevance of public policies, such as educational, technological and export
promotion, for industrial development.

                                                                                  Chart 12: Brazil vs. Korea

                         35                                                                                                              6000

                         30
                                                                                                     Industrial density (constant US$)


                                                                                                                                         5000
 Man. share on GDP (%)


                         25
                                                                                                                                         4000
                         20
                                                                                            Brazil                                                                                                            Brazil
                                                                                                                                         3000
                         15                                                                 Korea                                                                                                             Korea
                                                                                                                                         2000
                         10

                          5                                                                                                              1000

                          0                                                                                                                 0
                              2000 2001 2002 2003 2004 2005 2006 2007 2008 2009 2010                                                            2000 2001 2002 2003 2004 2005 2006 2007 2008 2009 2010


The comparison between Brazil and Thailand reveals a similar path to the
Brazil-Korea analysis. The difference is that industrial densities in Brazil and
Thailand were similar in 2000, but differed throughout the decade due to the
fast growth in Thailand’s density (Chart 13). The Thai case also highlights the
role of public policies in industrial development.

                                                                               Chart 13: Brazil vs. Thailand


                                                                                                                                                                                                                 13
40                                                                                                                  1200

                         35


                                                                                                       Industrial density (constant US$)
 Man. share on GDP (%)                                                                                                                       1000
                         30
                                                                                                                                              800
                         25

                         20                                                                 Brazil                                            600                                                                Brazil
                                                                                            Thailand                                                                                                             Thailand
                         15
                                                                                                                                              400
                         10
                                                                                                                                              200
                          5

                          0                                                                                                                     0
                              2000 2001 2002 2003 2004 2005 2006 2007 2008 2009 2010                                                                2000 2001 2002 2003 2004 2005 2006 2007 2008 2009 2010


The Turkish participation rate follows a falling trend much like Brazil’s. However,
it stabilized in 2009 and has grown since then (Chart 14). Turkish density, in its
turn, presented a growing trend, increasing from US$ 840 in 2000 to US$ 1176
in 2011, up 40%.

                                                                                   Chart 14: Brazil vs. Turkey

                         25                                                                              Industrial density (constant US$)   1400

                                                                                                                                             1200
                         20
 Man. share on GDP (%)


                                                                                                                                             1000

                         15
                                                                                                                                              800
                                                                                            Brazil                                                                                                                Brazil

                         10                                                                 Turkey                                            600                                                                 Turkey

                                                                                                                                              400
                          5
                                                                                                                                              200

                          0                                                                                                                     0
                              2000 2001 2002 2003 2004 2005 2006 2007 2008 2009 2010 2011                                                           2000 2001 2002 20032004 2005 2006 20072008 2009 2010 2011


The path of Mexico’s participation rate is similar to Brazil’s, but has presented a
trend of slight increase since 2009 (Chart 15). Industrial density, which was
approximately twice Brazil’s in the early 2000s, has shown a positive trend
since 2003, despite the break in 2008/09 due to the financial crisis.

                                                                                  Chart 15: Brazil vs. Mexico

                         25                                                                                                                  1200
                                                                                                         Industrial density (constant US$)


                         20                                                                                                                  1000
 Man. share on GDP (%)


                                                                                                                                              800
                         15
                                                                                            Brazil                                                                                                                Brazil
                                                                                                                                              600
                         10                                                                 Mexico                                                                                                                Mexico
                                                                                                                                              400

                          5
                                                                                                                                              200

                          0                                                                                                                     0
                              2000 2001 2002 2003 2004 2005 2006 2007 2008 2009 2010 2011                                                           2000 2001 2002 2003 2004 20052006 2007 2008 2009 2010 2011


The comparison with the United States shows some similarities in the level and
in the path of industry’s participation rate in the economy, but the American rate
contracted more than the Brazilian rate (Chart 16). However, when it comes to
industrial density, there is a substantial difference, since American industrial
density tended to increase in general after 2003, stopping in 2008/09, but
                                                                                                                                                                                                                          14
resuming the pattern in 2010. This exercise reinforces the view that comparing
the participation rates in countries with such different industrial densities might
be inappropriate and could lead to misleading conclusions.10

                                                                                Chart 16: Brazil vs. the US

                             25                                                                                                         7000


                                                                                                    Industrial density (constant US$)
                                                                                                                                        6000
                             20
     Man. share on GDP (%)


                                                                                                                                        5000
                             15
                                                                                                                                        4000
                                                                                           Brazil                                                                                                       Brazil

                             10                                                            USA                                          3000                                                            USA

                                                                                                                                        2000
                              5
                                                                                                                                        1000

                              0                                                                                                            0
                                  2000 2001 2002 2003 2004 2005 2006 2007 2008 2009 2010                                                       2000 2001 2002 2003 2004 2005 2006 2007 2008 2009 2010


The highest level of industrial density ever recorded in Brazil was US$ 623 in
2011. A similar level was recorded for the first time in Korea in 1982-1983.
Based on these simple figures, one could argue that Brazilian industry is about
29 years behind Korea’s. A similar exercise suggests that Brazilian industry was
also behind other countries’ industries, including Thailand (15 years behind),
Malaysia and Turkey (10 years behind).

Although Brazil has a manufacturing participation rate comparable to Q2
countries, it is also well behind them. This is because in the year they first
reached the same participation rate as Brazil’s current rate -- between 14% and
15% -- their industrial densities were substantially higher than Brazil’s, as
follows: Norway’s was US$ 3,522; the US’ was US$ 4,905; France’s was US$
3,319; and Canada’s was US$ 3,953. This exercise suggests that Brazilian
manufacturing contracted prematurely and well before reaching a higher level of
development.

Tidal-wave effect?

To examine whether the fall in Brazilian manufacturing resulted from an across-
the-board shrinking of industrial activity rather than from a movement particular
to Brazil, we calculate the growth rate of the manufacturing share in GDP and
the growth rate of industrial density. If there was indeed a “tidal-wave effect”,
then we should find an across-the-board pattern in these growth rates. Charts
17 and 18 suggest that there is no common pattern, even among commodity
producers and among developed countries. Countries have actually followed
quite different patterns overtime and therefore there are no stylized facts.

10
  Besides the experiences reported here, many others deserve a word, such as India’s density,
which increased 85% from 2000 to 2011, even though it is still at quite a low level, as well as
the Argentine case, which shows a sharp fall in the manufacturing share in output since the
early 1990s.
                                                                                                                                                                                                           15
Germany experienced a drop in manufacturing share, but an increase in
industrial density, whereas France experienced a drop in both indicators.
Indonesia saw a substantial drop in manufacturing share, but a significant rise
in industrial density, whereas Thailand advanced in manufacturing share and in
industrial density. Venezuela and Saudi Arabia, major oil producers, also
experienced quite distinct patterns. While both manufacturing share and
industrial density dropped in Venezuela, these indicators improved in Saudi
Arabia. This simple exercise suggests that there is no such “tidal-wave effect”.
Therefore, it is unlikely to have been the main explanation for the loss of drive of
Brazilian manufacturing.

                       Chart 17: Growth rate of manufacturing on GDP (%) - 2000-2011

    20

    10

        0


                                      d
                           un y


                          iA a
                           Fr a


                 Un Tu e


               co Ge dia


                                     n
                         ou s


                         ou y
                                  sia


                        Th n a
                          M s
                                     e


                       Ar abia
                                     s
                       ut ela

                         ng a


               e r th e zil


                                     a
                           St y


                                     s
                         Ca le


                        M te s
                                 sia


                                 ico
   -10                 Co wa

                                    e


                       C an


                       ud h in
                                   d


                                rie
                                 or


                                pa


                       ut lan
                       C nd
                     Ve a nc


                     ite r ke


                                rie


                                 re
                      Si fric
                                   i


                                a


                               tr i
                              na
                             Ch


                                 i
                             ne


                              In
                   So ezu


                              nt
                             ap


                             ay


                             ex
                              a


                            Ko
                    Ne Br


                            rm


                            Ja
                  ica rla


                             nt
                              r
                             nt


                              r
                   Sa C


                   So ai
                            A


                  m No


                          ge
                         do


                          al
                          h
                         n


                         h
                        d
                       In


   -20
                    e


                    e
                  m
              co
           Am


            In
   -30
            In
       gh


          e
      tin


       dl
    Hi


    id
  La


  M

   -40

   -50

   -60

   -70


                         Chart 18: Growth rate of industrial density (%) - 2000-2011
  250

  200

  150

  100

  50

   0
                                      d
                                      y


                                      a
                          Fr a


                      C pan


                      Ar ore


                         ou ia
                          er y

                           un s


                         ng a


                        T h in a
                          N s
                         ne e


                                      a


                                      s
                                      a


                                      a

                 ica J a l


                                     a
                       M ies


                      I n key
                          Tu e
                       G es


                         i A ia
                                     o


                                    zi
                                 an


                                    e
                                wa


                                  in
                                   d


                                 rie
                      ut an
                      Co nd
                    V e a nc


                     Si esi
                                  bi
                                  el


                                    l


                                 re
                                ric


                                  d
                    ite xic


                                hi
                               ys


  -50
                               ra
                               tr i
                              na


                               at


                              In
                                r


                              ra


                            Ch
                             zu


                              nt
                            ap


                            Ko
                             m

                             la


                             nt
                  So ail
                               r
                             C
                  So o r

                            Af


                            nt


                             n
                            B
                 Un Me


                  Sa ala
                           St
                         Ca


                          ge
                         do
                          er


                         ou
                         h


                         h
                        d


              c o th


                     ud
                      ut


                      C
           I n Ne
                   e


                   e
                 m
                 m


              er


              co
          Am


           In
       gh


         e
     tin


      dl
    Hi


   id
  La


  M


   4. Explaining the low drive in Brazilian industry

The integration of the Brazilian economy in the world economy led to increasing
competition from foreign goods, especially Asian, in the domestic market, and

                                                                                       16
showed the lack of competitiveness in several segments of Brazilian
manufacturing. This section aims to briefly discuss the origins of such
competitiveness challenges.

The so-called Brazil Cost (Custo Brasil) refers to systemic shortcomings in the
Brazilian economy. Although companies in general suffer from domestic
weaknesses, including inadequate planning and poor management,11 the
environment in which they operate also influences their performance. As 71.5%
of the gross value of the output of industrial companies refers to inputs and
taxes (Arbache and Burns 2012), it is reasonable to suppose that the
competitiveness of industrial companies depends largely on conditions outside
the "factory floor".12 Particularly significant external obstacles include
shortcomings in infrastructure and logistics, which are identified by industrial
companies as some of the major constraints to their operations and
competitiveness (World Bank 2012). In fact, the more a company depends on
value chains and logistics to receive inputs and ship their products to
customers, the more it is exposed to the high costs associated with the low
systemic efficiency of Brazilian logistics.

Excessive red tape and taxes are also cited as major obstacles to industrial
competitiveness (World Bank 2012). Compounding taxes that require complex
management and that are high for world standards contribute to significantly
raising the final price of products and thus harming competitiveness. The ICMS
tax subsystem, an extremely complex, costly and fragmented VAT governed by
each federative state, constitutes an important barrier to efficiency. Besides
being high -- it can be as high as 25% -- the ICMS’ state laws are inconsistent
and foster fiscal wars. Of particular note in this area is the conclusion of a study
conducted by the Brazilian National Confederation of Industry (CNI), which has
identified that the tax burden on manufacturing is disproportionately high,
reaching up to 57.3% of the output of certain industries, while in agriculture it
reaches up to 3.7% and in services up to 21.1%.

Markets with few competitors, as well as regulatory and legal issues, also
compromise the competitiveness of industry. The case of energy is illustrative.
Although the price of energy in Brazil is always associated with high taxes, an
important part of the final price is due to a legal framework that leads to a low
number of competitors and discourages investment. Energy costs are among


11
   Bloom et al (2011) show that manufacturing firms in Brazil tend to be poorly managed – joint
with India, Brazil actually ranks among the worst in a cross-country analysis. They also show
that there is a wide spread of management practices and a large tail of very badly managed
firms in the country.
12
   Data are from the IBGE Annual Survey of Industry (PIA). According to the PIA classification,
inputs are the gross value of industrial production minus the industrial value added. Inputs
include workforce, financial services, industrial services, logistics, energy, among other items.
                                                                                              17
the highest in the world, despite Brazil having one of the largest renewable
energy matrix globally.

The increasing dependence of industrial enterprises on service providers and
outsourced services also impacts the competitiveness of the manufacturing
sector. This happens because, as shown by Arbache and Burns (2012),
services are expensive and of poor quality, affecting the cost and the
competitiveness of industry.13 Despite the poor quality and cost, expenses with
service inputs continue to grow – they went from 20.5% in 2007 to 24.5% in
2009.14

One of the most striking characteristics of the Brazilian economy vis-à-vis
comparable countries is poor labor productivity.15 However, as seen above, the
development of labor productivity in manufacturing has been particularly low,
which is a result of several factors, including, but not limited to, poor human
capital. Although Brazil has made significant progress in education over the last
decade – average schooling increased by 17% in the period – many emerging
countries have also made similar or even better improvement in education.16
Despite manufacturing workers having higher average education than the
average of the population, the sector’s indicators fall short. In fact, among
formal workers in manufacturing, some 52.8% has not finished high school and
26% has not finished elementary school. The rate of functional illiteracy among
manufacturing workers from 15 to 64 years of age is 26%, only slightly below
the country as a whole, which is 28.2%.17

Due to educational shortcomings as well as cognitive learning and knowledge
gaps, training and professional education have become increasingly important
to equip employees with labor skills. Such skills are required so that modern
industry can operate within the framework of the new forms of production that
entail more creativity, adaptability and innovation. According to the PNAD-IBGE
(National Household Survey), in 2007 only 34% of industrial workers had
attended a training course, and this shortcoming is partly due to the shortage in
opportunities for training, as well as technical and vocational education.


13
   According to the IBGE, inflation in services has been higher than that for industrial products.
14
   Latest year available.
15
   See, for example, productivity data from the Groningen Growth Development Centre or the
International Labor Organization. Productivity has grown modestly in relation to emerging
countries – between 2000 and 2009, productivity (measured by total factor productivity) grew
approximately 0.4% per year in Brazil, while in China and India it grew 5.2% and 2.8%,
respectively (Wilson 2011).
16
   See Barro and Lee (2010) database.
17
   According to a study conducted by CNI, some 85% of companies indicate that poor quality of
elementary education is the main obstacle for skills development (A Falta de Qualificação dos
Trabalhadores da Indústria, CNI, April 2011).
                                                                                               18
At the same time that manufacturing requires more human capital, the supply of
skilled workers has not kept up with demand, increasing the workforce deficit. In
fact, the lack of skilled workers is identified as an issue for 69% of industrial
companies, pushing wages up thus harming mainly smaller companies. For
industry, which is directly exposed to international competition, the combination
of slow growth in labor productivity and rising labor costs compromises
competitiveness, especially in labor-intensive sectors.

Three simultaneous factors help explain the significant increase in the real
wage in the private sector from 2005 to 2011. The first factor is the heating up
of the economy. The second is the limited supply of skilled workers. The third
factor, and perhaps the most important, is the slowdown in the growth rate of
the working-age population resulting from a profound demographic change in
Brazil (Arbache 2011).

In fact, the cost in dollars of the labor-hour in Brazil’s manufacturing sector
increased from US$ 5.02 in 2005 to US$ 10.08 in 2010, a substantial rise for
international standards (see Chart 19).18 In 2010, labor costs in the
manufacturing sector were already higher than those in Poland and Taiwan (two
countries whose average years of education and whose workers’ skills are well
above those in Brazil), and were much higher than those in China and Mexico,
countries with which Brazilian industry competes directly for markets.

Considering the recent developments in labor productivity and wages in Brazil,
it is reasonable to assume that there has been a significant increase in unit
labor cost (ULC). In fact, Bonelli and Pinheiro (2012) show that between 2005
and 2008, the ULC increased approximately 19% per year and, from 2009 to
2011, rose 11.5%. According to these authors, this increase resulted from three
factors: the rise of real labor costs in Brazilian reais, the appreciation of the
exchange rate, and the stagnation of labor productivity. Along the same lines,
Arbache and Burns (2012) show that there was a significant increase in the
participation of labor costs in total costs for industrial companies, especially in
labor-intensive industries, such as apparel and clothing, leather and footwear,
wood products and miscellaneous goods.


18
     2010 is the latest year available.
                                                                                19
Chart 19: Hourly manufacturing labor cost (US$ - include wages and payroll taxes) and growht (%)
                                                           Source: US Labor Bureau


                                                                                                                               133,3
     25                                                                                                                                      140


                                                                                                                                             120


                                                                                            19,1


                                                                                                              101,1
     20


                                          16,6
                                                                                                                                             100

                             15,1


                                                                                  13,2
     15
                                                                                                                                             80


                                                                          11,7
                                                                                                                                                   2005


                                                                                                                      10,1
                                                                                                                                                   2010


                                                                 9,4
                                                                                                                                             60


                                                                                                     46,4
                                                                                     44,2
     10
                  8,4


                                                                                                                                                   Growth rate


                                                                                                     8,0
          7,9


                                                          6,2
                                                 5,6                                                                                         40


                                                                                                   5,5
                                                                   24,7


                                                                                                            5,0
     5
                                                   11,0

                                                                                                                                             20
                                    9,9


                                                                                                                                       1,4
            5,4


                                                                                                                             0,6
     0                                                                                                                                       0
          Taiwan             Korea               Mexico         Portugal         Singapore         Poland   Brazil           China


The heating up of the labor market in recent years and the lack of skilled labor
also contributed not only to increasing the labor turnover, but also to revealing
the labor law obstacles to manufacturing competitiveness. On the one hand,
legislation encourages workers to look for immediate extra earnings when they
change jobs. On the other hand, strict legislation regarding the adjustment of
working hours and shifts when the economic cycle dwindles encourages
dismissals (Gonzaga 1997). The problem is that the labor turnover is not neutral
in terms of productivity and costs, as it discourages company investment in
training and, for workers, it discourages commitment to the company and
career. According to the Ministry of Labor, the turnover rate, which is already
one of the highest in the world, has increased 30% since 2006, while the
percentage of professionals in the same job for more than five years has been
decreasing.

Another obstacle to manufacturing competitiveness is the poor numbers in the
adoption of new technologies and investment in innovation. Indicators of
PINTEC-IBGE show that Brazilian companies not only invest little in innovation,
but most of those who do in fact invest, do so by acquiring machinery and
equipment. As a result, companies tend to operate in more competitive and
"commoditized" markets, in which little or no extra compensation at all is
received.19

There is also evidence that new equipment does not always work at its optimum
speed nor with the best output due to factors ranging from inadequate training
of workers to variations in electrical current. Among the main consequences of
19
   Economic literature emphasizes that technology and innovation policies should be the main
element of public policies to foster diversification and strengthening of industrial activity,
especially in countries that aim to reduce the technological discrepancy in an era in which
catching-up becomes harder due to the constant and swift evolution of the technological
paradigm (e.g. Dahlman 2012).
                                                                                                                                                       20
low investment in innovation is the large and growing trade deficit for
manufactured goods of high and mid-high technology, as previously discussed,
and the drop in exports of high-technology products, which went from 9.3% of
total exports in 2005 to a mere 6.2% in 2011.

Finally, the lack of access to financing, high interest rates and an appreciated
exchange rate complement those other obstacles to industrial competitiveness.
Although interest rates have fallen significantly since the beginning of 2012,
they are still high compared to world standards, compromising investments and
the financial health of companies, especially small and medium-sized
enterprises. In fact, PIA data show that financial services are one of industry’s
most important cost items (Arbache and Burns 2012). The appreciation of the
exchange rate of more than 46% since 2003, on the other hand, significantly
altered relative prices in favor of imported products, affecting international
competitiveness and the profitability of industrial investment.


     5. The new challenges faced by the Brazilian industry

Brazilian industry has at least six emerging challenges that are likely to
influence its destiny. The first challenge is related to demographic changes.
Brazil is undergoing one of the most rapid demographic changes of the post-
war period, and its effects are already being felt in the declining growth rate of
the working-age population. Estimates from the IBGE indicate that growth in the
PIA will be very low or even zero from mid-2020. This demographic change is
already affecting the general competitiveness of the economy and especially
that of industry, notably through the pressure it places on the labor market in a
context of low growth of labor productivity (Arbache 2011).

The second challenge is related to the entry of Asian countries, such as India,
Vietnam and Indonesia, and African countries in the mass manufacturing sector
encouraged not only by growth in domestic markets, but also by the increase in
labor costs in China, and by multinationals seeking geographical diversification
of production.20 China, in its turn, will increasingly invest in these regions to
mass produce while it is undergoing a technological upgrade.

The third challenge is associated to this technological upgrade in China.21 China
has made remarkable achievements in areas as diverse as space technology,


20
   India is developing an ambitious industrial policy, the National Manufacturing Policy, which
aims high at the international level in several sectors. African countries, even with all their
problems, have increasingly participated in manufacturing in a more active way. An example of
that is the growing shoe industry in Ethiopia.
21
    Science and technology became fundamental chapters in the 11th and 12th National
Development Plans (FYP) and gained more focus with the Medium and Long-Term Plan for
                                                                                            21
supercomputers, nanotechnology, mechanical industry and medicine. With
technological advancement, China’s exports are moving up in the value chain
and competing with developed countries – exports of capital goods might
surpass Germany in 2012, having already left Japanese exports in the dust.22

The fourth challenge is associated with new technologies and increased
investments in manufacturing in developed countries. After decades of lacking
interest, the US began paying attention to industry again, and the sector is
already one of the main contributors to growth in product and employment in the
country (Helper et al 2012).23 Backed by heterodox monetary and industrial
policies, as well as new manufacturing technologies, new shale               gas
technologies, and rising labor costs in China, US industrial investments and
exports are increasing and this is already having an effect even in Brazil – the
bilateral trade balance of manufactured goods moved from historically positive
in favor of Brazil to strongly negative. Although labor costs in the US are much
higher than in developing countries, it seems that the use of sophisticated
technologies, such as 3D printing and robotics, coupled with high labor
productivity, has offset the cost differential and is helping to put the country
back on the industry map.24

The fifth challenge is protectionism. Employing State capitalism policies is
becoming popular worldwide as the economic crisis and uncertainties worsen.
China’s State capitalism coupled with the failure of ultra-liberal economic
policies, like those adopted by the US even before the financial crisis, have
encouraged policymakers to reconsider the use of protectionist measures and
market intervention to favor domestic companies. While it is understandable
that State capitalism is politically attractive in a context of economic crisis, its
multiplication on a global scale will have harmful implications on trade and
economic growth, worsening the already strongly asymmetric competition


National Science and Technology Development (2006-2020). China has vast ambitions and
intends to lead technologies in several areas over the next few decades.
22
   China is now the world’s leader in manufacturing output, with 19.8% of total production in
2011, having surpassed the US, which is now home of 18% of total output (Marsh 2012).
According with Freire (2011), China is the country that has experienced the largest
improvement in productive capacity in the last 25 years. Productive capacity is the set of
capabilities available in a country to produce and market its output of goods and services.
These capabilities include resource endowments (i.e. labor, physical capital, human capital,
land), total factor productivity, mechanisms for the allocation of these endowments to specific
uses, and any other factor that contributes to maximizing the output of the economy, including
trade and transport integration, institutions, policies and regulations (Freire 2011).
23
   Over the last few years the US government has introduced several policies and instruments
to offer support to recover and strengthen industry, such as 2010’s National Manufacturing
Strategy, as well as fiscal stimulus policies to bring back American companies set up abroad.
24
    Because of these technological advances, product customization, rising expenses of
manufacturing in emerging economies and other problems, Marsh (2012) argues of a “New
Industrial Revolution”, in which the opportunities for emerging economies to participate in and to
catch up with manufacturing output in developed countries are beginning to level out.
                                                                                               22
conditions. Boosting the manufacturing sector in such an environment will be
harder.

The sixth challenge is the rising commodities’ revenues and their potential
impacts on exchange rate appreciation, an issue that will probably become
more noticeable when the pre-salt oil layer starts to flow into the market.

The challenges associated with the new geography of production will redesign
the global economy and the consequences will be immense. Immediately, there
will be increasing competition. In the mid-term, there will be deep-seated and
significant changes not only in global production sectors, but also in the global
networks for innovation, international trade, capital flows as well as job creation
and income. This complex transformation process will increase the pressure on
Brazilian industry and force the country to implement policies and actions
needed to significantly lift competitiveness.

Likely consequences arising from the first and second challenges for Brazilian
industry include an increase in production costs and heated competition in
labor-intensive industries. To mitigate the potential effects of these challenges,
industry will have to invest heavily in the use of technologies that save labor and
in innovations to foster a technological and market upgrade.

Likely consequences arising from the third and fourth challenges include an
increase in competition in international markets in general, and in the medium
and high value added markets in particular. If, on one hand, China opens up
space for other economies to produce lower value-added manufactured
products, on the other hand, it will increase competition in markets for goods of
higher value added, including aircraft, capital goods, chemicals, and
telecommunications, sectors that Brazil already holds market share and aims to
expand its presence. For the country to participate more intensively in these
markets, it will be necessary to substantially increase investments in
productivity, efficiency and innovation, and to prioritize investments in sectors
and niche markets.

The probable outcome from the fifth challenge will be the harmful effects arising
from the fallacy of composition of State capitalist policies, egging on mercantilist
wars and political tensions among countries. In this environment, industries in
countries with greater political strength and power to affect markets and
influence institutions, such as the United States, the European Union and
China, will tend to be favored.25


25
   The Brazilian industry will need to tackle the challenges associated with the rising
commodities’ revenues and their potential impacts on exchange rate. This issue will probably
become more noticeable when the Pre-Salt oil starts to get in into the market.
                                                                                         23
Artigo jorge arbache

More Related Content

What's hot

World: Polyethylene - Market Report. Analysis and Forecast to 2025
World: Polyethylene - Market Report. Analysis and Forecast to 2025World: Polyethylene - Market Report. Analysis and Forecast to 2025
World: Polyethylene - Market Report. Analysis and Forecast to 2025
IndexBox Marketing
 
The Swedish Economy No.8 - November 30, 2011
The Swedish Economy No.8 - November 30, 2011 The Swedish Economy No.8 - November 30, 2011
The Swedish Economy No.8 - November 30, 2011
Swedbank
 
Bosnia And Herzegovina: Wheat - Market Report. Analysis And Forecast To 2025
Bosnia And Herzegovina: Wheat - Market Report. Analysis And Forecast To 2025Bosnia And Herzegovina: Wheat - Market Report. Analysis And Forecast To 2025
Bosnia And Herzegovina: Wheat - Market Report. Analysis And Forecast To 2025
IndexBox Marketing
 
World: Sunglasses - Market Report. Analysis and Forecast to 2025
World: Sunglasses - Market Report. Analysis and Forecast to 2025World: Sunglasses - Market Report. Analysis and Forecast to 2025
World: Sunglasses - Market Report. Analysis and Forecast to 2025
IndexBox Marketing
 
Daily Newsletter: 31st May, 2011
Daily Newsletter: 31st May, 2011Daily Newsletter: 31st May, 2011
Daily Newsletter: 31st May, 2011
Fullerton Securities
 
Electrolux Interim Report Q3 2012
Electrolux Interim Report Q3 2012Electrolux Interim Report Q3 2012
Electrolux Interim Report Q3 2012
Electrolux Group
 
EU: Domestic, Non-electric, Cooking Or Heating Appliances - Market Report. An...
EU: Domestic, Non-electric, Cooking Or Heating Appliances - Market Report. An...EU: Domestic, Non-electric, Cooking Or Heating Appliances - Market Report. An...
EU: Domestic, Non-electric, Cooking Or Heating Appliances - Market Report. An...
IndexBox Marketing
 
World: Magnesite - Market Report. Analysis and Forecast to 2025
World: Magnesite - Market Report. Analysis and Forecast to 2025World: Magnesite - Market Report. Analysis and Forecast to 2025
World: Magnesite - Market Report. Analysis and Forecast to 2025
IndexBox Marketing
 
Iran: Lentils - Market Report. Analysis And Forecast To 2025
Iran: Lentils - Market Report. Analysis And Forecast To 2025Iran: Lentils - Market Report. Analysis And Forecast To 2025
Iran: Lentils - Market Report. Analysis And Forecast To 2025
IndexBox Marketing
 
Brazil: Potato - Market Report. Analysis And Forecast To 2025
Brazil: Potato - Market Report. Analysis And Forecast To 2025Brazil: Potato - Market Report. Analysis And Forecast To 2025
Brazil: Potato - Market Report. Analysis And Forecast To 2025
IndexBox Marketing
 
World: Printers - Market Report. Analysis and Forecast to 2025
World: Printers - Market Report. Analysis and Forecast to 2025World: Printers - Market Report. Analysis and Forecast to 2025
World: Printers - Market Report. Analysis and Forecast to 2025
IndexBox Marketing
 
Kenya: Onion (Dry) - Market Report. Analysis And Forecast To 2025
Kenya: Onion (Dry) - Market Report. Analysis And Forecast To 2025Kenya: Onion (Dry) - Market Report. Analysis And Forecast To 2025
Kenya: Onion (Dry) - Market Report. Analysis And Forecast To 2025
IndexBox Marketing
 
Stats SA Quartely Labour Force Survey 2018
Stats SA Quartely Labour Force Survey 2018Stats SA Quartely Labour Force Survey 2018
Stats SA Quartely Labour Force Survey 2018
SABC News
 

What's hot (13)

World: Polyethylene - Market Report. Analysis and Forecast to 2025
World: Polyethylene - Market Report. Analysis and Forecast to 2025World: Polyethylene - Market Report. Analysis and Forecast to 2025
World: Polyethylene - Market Report. Analysis and Forecast to 2025
 
The Swedish Economy No.8 - November 30, 2011
The Swedish Economy No.8 - November 30, 2011 The Swedish Economy No.8 - November 30, 2011
The Swedish Economy No.8 - November 30, 2011
 
Bosnia And Herzegovina: Wheat - Market Report. Analysis And Forecast To 2025
Bosnia And Herzegovina: Wheat - Market Report. Analysis And Forecast To 2025Bosnia And Herzegovina: Wheat - Market Report. Analysis And Forecast To 2025
Bosnia And Herzegovina: Wheat - Market Report. Analysis And Forecast To 2025
 
World: Sunglasses - Market Report. Analysis and Forecast to 2025
World: Sunglasses - Market Report. Analysis and Forecast to 2025World: Sunglasses - Market Report. Analysis and Forecast to 2025
World: Sunglasses - Market Report. Analysis and Forecast to 2025
 
Daily Newsletter: 31st May, 2011
Daily Newsletter: 31st May, 2011Daily Newsletter: 31st May, 2011
Daily Newsletter: 31st May, 2011
 
Electrolux Interim Report Q3 2012
Electrolux Interim Report Q3 2012Electrolux Interim Report Q3 2012
Electrolux Interim Report Q3 2012
 
EU: Domestic, Non-electric, Cooking Or Heating Appliances - Market Report. An...
EU: Domestic, Non-electric, Cooking Or Heating Appliances - Market Report. An...EU: Domestic, Non-electric, Cooking Or Heating Appliances - Market Report. An...
EU: Domestic, Non-electric, Cooking Or Heating Appliances - Market Report. An...
 
World: Magnesite - Market Report. Analysis and Forecast to 2025
World: Magnesite - Market Report. Analysis and Forecast to 2025World: Magnesite - Market Report. Analysis and Forecast to 2025
World: Magnesite - Market Report. Analysis and Forecast to 2025
 
Iran: Lentils - Market Report. Analysis And Forecast To 2025
Iran: Lentils - Market Report. Analysis And Forecast To 2025Iran: Lentils - Market Report. Analysis And Forecast To 2025
Iran: Lentils - Market Report. Analysis And Forecast To 2025
 
Brazil: Potato - Market Report. Analysis And Forecast To 2025
Brazil: Potato - Market Report. Analysis And Forecast To 2025Brazil: Potato - Market Report. Analysis And Forecast To 2025
Brazil: Potato - Market Report. Analysis And Forecast To 2025
 
World: Printers - Market Report. Analysis and Forecast to 2025
World: Printers - Market Report. Analysis and Forecast to 2025World: Printers - Market Report. Analysis and Forecast to 2025
World: Printers - Market Report. Analysis and Forecast to 2025
 
Kenya: Onion (Dry) - Market Report. Analysis And Forecast To 2025
Kenya: Onion (Dry) - Market Report. Analysis And Forecast To 2025Kenya: Onion (Dry) - Market Report. Analysis And Forecast To 2025
Kenya: Onion (Dry) - Market Report. Analysis And Forecast To 2025
 
Stats SA Quartely Labour Force Survey 2018
Stats SA Quartely Labour Force Survey 2018Stats SA Quartely Labour Force Survey 2018
Stats SA Quartely Labour Force Survey 2018
 

Similar to Artigo jorge arbache

CBO’s Economic Forecast: Understanding Productivity Growth
CBO’s Economic Forecast: Understanding Productivity GrowthCBO’s Economic Forecast: Understanding Productivity Growth
CBO’s Economic Forecast: Understanding Productivity Growth
Congressional Budget Office
 
growth and_investment
growth and_investmentgrowth and_investment
growth and_investment
AhtishamRajput
 
Doing business in Peru 2009
Doing business in Peru 2009Doing business in Peru 2009
Doing business in Peru 2009
Juan José Sandoval Zapata
 
Picture of labor force conditions in indonesia
Picture of labor force conditions in indonesiaPicture of labor force conditions in indonesia
Picture of labor force conditions in indonesia
Rustan Amarullah
 
MacroEconomics Of India - Fiscal & Monetary Outlook 2007 - SPJCM
MacroEconomics Of India - Fiscal & Monetary Outlook 2007 - SPJCMMacroEconomics Of India - Fiscal & Monetary Outlook 2007 - SPJCM
MacroEconomics Of India - Fiscal & Monetary Outlook 2007 - SPJCM
Apurva Chiranewala
 
World Bank Quarterly December 2008
World Bank Quarterly December 2008World Bank Quarterly December 2008
World Bank Quarterly December 2008
Glenn Klith Andersen
 
Tjif Budget Overview 2011
Tjif Budget Overview 2011Tjif Budget Overview 2011
Tjif Budget Overview 2011
Kausar Fecto
 
CBO’s Economic Forecast: Understanding the Slowdown of Productivity Growth
CBO’s Economic Forecast: Understanding the Slowdown of Productivity GrowthCBO’s Economic Forecast: Understanding the Slowdown of Productivity Growth
CBO’s Economic Forecast: Understanding the Slowdown of Productivity Growth
Congressional Budget Office
 
Fdi in bangladesh problems & prospects
Fdi in bangladesh problems & prospectsFdi in bangladesh problems & prospects
Fdi in bangladesh problems & prospects
Mushfiq Rayan
 
Brazil economics
Brazil economicsBrazil economics
Brazil economics
Ravi Gandhi
 
Country profile Bahrain (by Naeem Saba)
Country profile Bahrain (by Naeem Saba)Country profile Bahrain (by Naeem Saba)
Country profile Bahrain (by Naeem Saba)
Naeem Saba
 
A2 & AS Economics: UK Economy Revision Briefing
A2 & AS Economics: UK Economy Revision BriefingA2 & AS Economics: UK Economy Revision Briefing
A2 & AS Economics: UK Economy Revision Briefing
tutor2u
 
Budget Preview 2015-16: 'Acche din' for capital market?
Budget Preview 2015-16: 'Acche din' for capital market?Budget Preview 2015-16: 'Acche din' for capital market?
Budget Preview 2015-16: 'Acche din' for capital market?
IndiaNotes.com
 
PwC Global Economy watch (mars 2014)
PwC Global Economy watch (mars 2014)PwC Global Economy watch (mars 2014)
PwC Global Economy watch (mars 2014)
PwC France
 
Fiscal Policy Response to COVID-19 Pandemic in Pakistan
Fiscal Policy Response to COVID-19 Pandemic in PakistanFiscal Policy Response to COVID-19 Pandemic in Pakistan
Fiscal Policy Response to COVID-19 Pandemic in Pakistan
Sustainable Development Policy Institute
 
Gregory mankiw macroeconomic 7th edition chapter (2)
Gregory mankiw macroeconomic 7th edition chapter  (2)Gregory mankiw macroeconomic 7th edition chapter  (2)
Gregory mankiw macroeconomic 7th edition chapter (2)
Kyaw Thiha
 
U.S. Household Cooking Appliance Market. Analysis And Forecast to 2020
U.S. Household Cooking Appliance Market. Analysis And Forecast to 2020U.S. Household Cooking Appliance Market. Analysis And Forecast to 2020
U.S. Household Cooking Appliance Market. Analysis And Forecast to 2020
IndexBox Marketing
 
07.2009, REPORT, Mongolia Monthly Economic Update, The World Bank
07.2009, REPORT, Mongolia Monthly Economic Update, The World Bank07.2009, REPORT, Mongolia Monthly Economic Update, The World Bank
07.2009, REPORT, Mongolia Monthly Economic Update, The World Bank
The Business Council of Mongolia
 
U.S. Bottled Water Market. Analysis And Forecast to 2020
U.S. Bottled Water Market. Analysis And Forecast to 2020U.S. Bottled Water Market. Analysis And Forecast to 2020
U.S. Bottled Water Market. Analysis And Forecast to 2020
IndexBox Marketing
 
2009 Real Gdp
2009 Real Gdp2009 Real Gdp
2009 Real Gdp
guestdbe479
 

Similar to Artigo jorge arbache (20)

CBO’s Economic Forecast: Understanding Productivity Growth
CBO’s Economic Forecast: Understanding Productivity GrowthCBO’s Economic Forecast: Understanding Productivity Growth
CBO’s Economic Forecast: Understanding Productivity Growth
 
growth and_investment
growth and_investmentgrowth and_investment
growth and_investment
 
Doing business in Peru 2009
Doing business in Peru 2009Doing business in Peru 2009
Doing business in Peru 2009
 
Picture of labor force conditions in indonesia
Picture of labor force conditions in indonesiaPicture of labor force conditions in indonesia
Picture of labor force conditions in indonesia
 
MacroEconomics Of India - Fiscal & Monetary Outlook 2007 - SPJCM
MacroEconomics Of India - Fiscal & Monetary Outlook 2007 - SPJCMMacroEconomics Of India - Fiscal & Monetary Outlook 2007 - SPJCM
MacroEconomics Of India - Fiscal & Monetary Outlook 2007 - SPJCM
 
World Bank Quarterly December 2008
World Bank Quarterly December 2008World Bank Quarterly December 2008
World Bank Quarterly December 2008
 
Tjif Budget Overview 2011
Tjif Budget Overview 2011Tjif Budget Overview 2011
Tjif Budget Overview 2011
 
CBO’s Economic Forecast: Understanding the Slowdown of Productivity Growth
CBO’s Economic Forecast: Understanding the Slowdown of Productivity GrowthCBO’s Economic Forecast: Understanding the Slowdown of Productivity Growth
CBO’s Economic Forecast: Understanding the Slowdown of Productivity Growth
 
Fdi in bangladesh problems & prospects
Fdi in bangladesh problems & prospectsFdi in bangladesh problems & prospects
Fdi in bangladesh problems & prospects
 
Brazil economics
Brazil economicsBrazil economics
Brazil economics
 
Country profile Bahrain (by Naeem Saba)
Country profile Bahrain (by Naeem Saba)Country profile Bahrain (by Naeem Saba)
Country profile Bahrain (by Naeem Saba)
 
A2 & AS Economics: UK Economy Revision Briefing
A2 & AS Economics: UK Economy Revision BriefingA2 & AS Economics: UK Economy Revision Briefing
A2 & AS Economics: UK Economy Revision Briefing
 
Budget Preview 2015-16: 'Acche din' for capital market?
Budget Preview 2015-16: 'Acche din' for capital market?Budget Preview 2015-16: 'Acche din' for capital market?
Budget Preview 2015-16: 'Acche din' for capital market?
 
PwC Global Economy watch (mars 2014)
PwC Global Economy watch (mars 2014)PwC Global Economy watch (mars 2014)
PwC Global Economy watch (mars 2014)
 
Fiscal Policy Response to COVID-19 Pandemic in Pakistan
Fiscal Policy Response to COVID-19 Pandemic in PakistanFiscal Policy Response to COVID-19 Pandemic in Pakistan
Fiscal Policy Response to COVID-19 Pandemic in Pakistan
 
Gregory mankiw macroeconomic 7th edition chapter (2)
Gregory mankiw macroeconomic 7th edition chapter  (2)Gregory mankiw macroeconomic 7th edition chapter  (2)
Gregory mankiw macroeconomic 7th edition chapter (2)
 
U.S. Household Cooking Appliance Market. Analysis And Forecast to 2020
U.S. Household Cooking Appliance Market. Analysis And Forecast to 2020U.S. Household Cooking Appliance Market. Analysis And Forecast to 2020
U.S. Household Cooking Appliance Market. Analysis And Forecast to 2020
 
07.2009, REPORT, Mongolia Monthly Economic Update, The World Bank
07.2009, REPORT, Mongolia Monthly Economic Update, The World Bank07.2009, REPORT, Mongolia Monthly Economic Update, The World Bank
07.2009, REPORT, Mongolia Monthly Economic Update, The World Bank
 
U.S. Bottled Water Market. Analysis And Forecast to 2020
U.S. Bottled Water Market. Analysis And Forecast to 2020U.S. Bottled Water Market. Analysis And Forecast to 2020
U.S. Bottled Water Market. Analysis And Forecast to 2020
 
2009 Real Gdp
2009 Real Gdp2009 Real Gdp
2009 Real Gdp
 

More from farbache

Manzan et al_work
Manzan et al_workManzan et al_work
Manzan et al_work
farbache
 
Definição tema tcc
Definição tema tccDefinição tema tcc
Definição tema tcc
farbache
 
Grupo 3 jan 2013
Grupo 3   jan 2013Grupo 3   jan 2013
Grupo 3 jan 2013
farbache
 
Tcc grupo
Tcc grupoTcc grupo
Tcc grupo
farbache
 
Trabalho simulado
Trabalho simuladoTrabalho simulado
Trabalho simulado
farbache
 
Slide aula metodologia científica
Slide aula metodologia científicaSlide aula metodologia científica
Slide aula metodologia científica
farbache
 
O Papel da Advocacia Geral da União Nas Licitações Sustentáveis
O Papel da Advocacia Geral da União Nas Licitações SustentáveisO Papel da Advocacia Geral da União Nas Licitações Sustentáveis
O Papel da Advocacia Geral da União Nas Licitações Sustentáveis
farbache
 
Análise Viabilidade Econômica de Uma Nova Cachaça
Análise Viabilidade Econômica de Uma Nova CachaçaAnálise Viabilidade Econômica de Uma Nova Cachaça
Análise Viabilidade Econômica de Uma Nova Cachaça
farbache
 
Portal Eletrônico - Transparência Política
Portal Eletrônico - Transparência PolíticaPortal Eletrônico - Transparência Política
Portal Eletrônico - Transparência Política
farbache
 
PMBok
PMBokPMBok
PMBok
farbache
 
Pets Nursery
Pets NurseryPets Nursery
Pets Nursery
farbache
 
Brazilian Coaching
Brazilian CoachingBrazilian Coaching
Brazilian Coaching
farbache
 
Sustentabilidade na Administração Pública
Sustentabilidade na Administração PúblicaSustentabilidade na Administração Pública
Sustentabilidade na Administração Pública
farbache
 
Apresentação Jorge Arbache Rio +20
Apresentação Jorge Arbache Rio +20Apresentação Jorge Arbache Rio +20
Apresentação Jorge Arbache Rio +20
farbache
 
Assédio Moral
Assédio MoralAssédio Moral
Assédio Moral
farbache
 
Arbache O canto da sereia
Arbache   O canto da sereiaArbache   O canto da sereia
Arbache O canto da sereia
farbache
 
Grupo walmart
Grupo  walmartGrupo  walmart
Grupo walmart
farbache
 
Grupo mc donalds
Grupo mc donaldsGrupo mc donalds
Grupo mc donalds
farbache
 
Grupo mapfre
Grupo mapfreGrupo mapfre
Grupo mapfre
farbache
 
Grupo avon
Grupo avonGrupo avon
Grupo avon
farbache
 

More from farbache (20)

Manzan et al_work
Manzan et al_workManzan et al_work
Manzan et al_work
 
Definição tema tcc
Definição tema tccDefinição tema tcc
Definição tema tcc
 
Grupo 3 jan 2013
Grupo 3   jan 2013Grupo 3   jan 2013
Grupo 3 jan 2013
 
Tcc grupo
Tcc grupoTcc grupo
Tcc grupo
 
Trabalho simulado
Trabalho simuladoTrabalho simulado
Trabalho simulado
 
Slide aula metodologia científica
Slide aula metodologia científicaSlide aula metodologia científica
Slide aula metodologia científica
 
O Papel da Advocacia Geral da União Nas Licitações Sustentáveis
O Papel da Advocacia Geral da União Nas Licitações SustentáveisO Papel da Advocacia Geral da União Nas Licitações Sustentáveis
O Papel da Advocacia Geral da União Nas Licitações Sustentáveis
 
Análise Viabilidade Econômica de Uma Nova Cachaça
Análise Viabilidade Econômica de Uma Nova CachaçaAnálise Viabilidade Econômica de Uma Nova Cachaça
Análise Viabilidade Econômica de Uma Nova Cachaça
 
Portal Eletrônico - Transparência Política
Portal Eletrônico - Transparência PolíticaPortal Eletrônico - Transparência Política
Portal Eletrônico - Transparência Política
 
PMBok
PMBokPMBok
PMBok
 
Pets Nursery
Pets NurseryPets Nursery
Pets Nursery
 
Brazilian Coaching
Brazilian CoachingBrazilian Coaching
Brazilian Coaching
 
Sustentabilidade na Administração Pública
Sustentabilidade na Administração PúblicaSustentabilidade na Administração Pública
Sustentabilidade na Administração Pública
 
Apresentação Jorge Arbache Rio +20
Apresentação Jorge Arbache Rio +20Apresentação Jorge Arbache Rio +20
Apresentação Jorge Arbache Rio +20
 
Assédio Moral
Assédio MoralAssédio Moral
Assédio Moral
 
Arbache O canto da sereia
Arbache   O canto da sereiaArbache   O canto da sereia
Arbache O canto da sereia
 
Grupo walmart
Grupo  walmartGrupo  walmart
Grupo walmart
 
Grupo mc donalds
Grupo mc donaldsGrupo mc donalds
Grupo mc donalds
 
Grupo mapfre
Grupo mapfreGrupo mapfre
Grupo mapfre
 
Grupo avon
Grupo avonGrupo avon
Grupo avon
 

Artigo jorge arbache

  • 1. Is Brazilian Manufacturing Losing its Drive? Jorge Arbache1 Abstract Brazil has built over the decades, with great effort and sacrifice, a dynamic, integrated manufacturing sector that has helped the country grow and become one of the world’s largest economies. Recently, though, basic indicators, such as the performance of output and employment, have suggested that manufacturing is growing slower than other sectors and its share in total output is on the wane. The problem with this type of analysis is that it may lead to misleading conclusions due to the substantial transformations which industrial activity has undergone, such as the vertical specialization that decentralizes and fragments production with gains in efficiency and innovation, and the more than proportional increase in consumption of services in economies that have urbanized and modernized. For this reason, a careful examination of the evolution of the drive of the Brazilian manufacturing sector requires broader, comparative analyses, combined with the usual analysis of performance indicators at the domestic level. This article employs the industry-space method (Arbache 2012), a simple but useful tool for comparative analysis of industrial development, to assess the case of Brazil. We find evidence that the Brazilian manufacturing sector is indeed losing its drive both at national and international levels. The article discusses the origins of the slowdown, and the new challenges faced by Brazilian industry. The article argues that, although challenges are extensive and complex, several business and investment opportunities emerging in Brazil can give a new boost to the manufacturing sector and take it to a new level of development, provided that the public and private sectors undertake the reforms and actions needed for industry to benefit fully from such opportunities. The article closes by discussing policy strategies that can boost the industrial sector. October 2012 Keywords: Manufacturing sector, competitiveness, productivity, international trade, innovation, industrial policies, Brazil JEL Codes: F14, L60, O14, 025 1 Professor of Economics at the University of Brasilia and Advisor to the President of the Brazilian Development Bank (BNDES). This article does not necessarily represent the opinions and views of the BNDES and its Board of Directors. I would like to thank Andrea Goldstein, Ernesto Lozardo, Philip Schellekens, Victor Burns, Gianna Sagazio, and Fabiano Bastos for their useful comments and suggestions on an earlier version of this article. Contact: Jarbache@gmail.com. 1
  • 2. 1. Introduction With great effort and sacrifice, Brazil has built a dynamic, integrated manufacturing that has helped the country grow and become one of the world’s largest economies.2 Recently, though, basic indicators, such as the performance of output and employment, have suggested that the manufacturing sector is growing slower than other sectors and its share of the economy is on the wane. These transformations, which are not particular to Brazil, but rather to emerging economies that integrate the world economy, have led many to claim an across-the-board reduction in manufacturing’s share in GDP. The problem with this type of analysis is that it may lead to misleading conclusions. This is because of (i) the substantial transformations which industrial activity has undergone, such as the vertical specialization that decentralizes and fragments production with gains in efficiency and innovation;3 (ii) the more than proportional increase in consumption of services in economies that have been urbanized and modernized (Rowthorn and Ramaswamy 1997); and (iii) the methodological difficulties in calculating the sectorial share of manufacturing in GDP associated with the increasingly complex relationship between this and the service sector. Besides these factors, there are others specifically related to Brazil, such as the “overindustrialization” in the 1970s associated with the import substitution industrialization era (Bonelli and Pessoa 2010), problems with relative prices and deflators of output and investment (Ferreira et al 2008), changes in national statistics, among others. For these reasons, an examination of the drive in Brazilian manufacturing requires broader and comparative analyses, combined with the usual analysis of performance indicators at the domestic level. In order to do so, this article employs the industry-space method (Arbache 2012), a simple but useful tool for comparative analysis of industrial development over time. We find evidence that Brazilian industry is indeed losing its drive at the international level. This result confirms and strengthens previous findings using domestic level data. This article is organized as follows. Section 2 examines basic industry performance indicators at the domestic level. Section 3 undertakes a comparative analysis of industrial development at the international level. Section 4 discusses the origins of the slowdown in the drive of the Brazilian manufacturing, highlighting issues such as low labor productivity and low 2 There is a rich empirical literature suggesting that economic development and long term growth are associated with a modern, diversified and integrated industrial sector (e.g. United Nations 2007). 3 Cross-border investment, offshore trade, outsourcing and value chains brought substantial changes to trade pattern and industrial production. The existing international trade statistics are still based on traditional trade, which is difficult to accurately reflect the entire process of global production chain and unable to consider changes in international trade and production. 2
  • 3. investment in infrastructure and innovation. Section 5 discusses the new challenges faced by Brazilian industry, such as the rapid demographic transformation, the new geography of production and innovation, and the rise of State capitalism. Section 6 argues that, although industry’s challenges are extensive and complex, the several business and investment opportunities emerging in Brazil can give it a new boost and take it to a new level of development, provided that the public and private sectors take on the reforms and investments needed for the sector to benefit fully from such opportunities. Finally, the last section concludes with suggestions for policy strategies to boost industry. 2. The recent performance of Brazilian manufacturing sector Chart 1 shows the sectorial output performance from 2000 to early 2012.4 Manufacturing was, arguably, the sector with the slower pace and also the most affected by the financial crises of 2008/09. Output has stagnated since then. Chart 1: Sectoral output (1995=100) Quarterly output, moving average 12 months Source: IBGE 200 180 160 140 120 100 80 60 Q 0 Q 0 Q 2 Q 3 Q 5 Q 5 Q 6 Q 7 Q 8 Q 8 Q 0 Q 1 Q 1 Q 1 Q 1 Q 2 Q 3 Q 4 Q 4 Q 6 Q 7 Q 9 Q 9 Q 0 2 3° 200 1° 00 1° 200 3° 200 3° 0 0 1° 200 3° 00 1° 0 0 3° 200 1° 200 1° 0 1 3° 201 1° 01 3° 00 1° 00 3° 00 1° 00 3° 00 1° 00 1° 00 3° 00 3° 00 1° 00 3° 01 01 .2 .2 .2 .2 .2 .2 .2 .2 .2 .2 .2 .2 .2 .2 .2 .2 .2 .2 . . . . . . . Q 1° Agriculture Mining Manufacturing Service Chart 2 shows the sectorial job performance. Growth in manufacturing employment was on par with other sectors until the onset of the financial crisis. Since then, it has grown at a much slower pace than the service and mineral sectors. Job performance in the agriculture sector is also slow, but the main reason is the substantial improvement in labor productivity. 4 Due to availability and quality of data, and to mitigate problems arising from changes in the statistics series of the IBGE, the article focuses on the period starting in 2000. 3
  • 4. Chart 3 shows that, except for 2004, growth in manufacturing employment has always been smaller than that of the economy as a whole and the gap has widened since 2008. As a consequence, manufacturing’s share in job creation went from 20.6% of the total in 2002-2007 to 11.8% in 2008-2011.5 Chart 2: Sectoral formal job - Moving average 12 months Source: Ministry of Labor 130 120 110 100 90 80 70 60 00 0 01 1 02 2 03 3 04 4 05 5 06 6 07 7 08 8 09 9 10 0 11 1 12 l/0 l/0 l/0 l/0 l/0 l/0 l/0 l/0 l/0 l/0 l/1 l/1 n/ n/ n/ n/ n/ n/ n/ n/ n/ n/ n/ n/ n/ ju ju ju ju ju ju ju ju ju ju ju ju ja ja ja ja ja ja ja ja ja ja ja ja ja Mining Manufacturing Service Agriculture Chart 3: Job creation (%) Source: Ministry of Labor 12 9,6 10 7,7 7,9 8 7,5 6,9 6,6 6,2 5,8 5,7 6 5,4 4,7 4,5 4,4 3,6 3,8 4 3,5 2,8 2,8 2,7 2 0,7 0 2002 2003 2004 2005 2006 2007 2008 2009 2010 2011 Brazil Manufacturing Sectorial labor productivity in manufacturing has also lost pace compared to other sectors. Ambrozio and Souza (2012) show that while labor productivity in manufacturing grew -0.2% per year between 1995-2008, agriculture and mining 5 Despite the modest job creation in manufacturing, Arbache and Amorim (2012) found that the inter-industry wage premium paid in this sector remained at around 12% throughout the 2000s after controlling for human capital, demographic, geographic, sectorial traits, among other variables. This result seems to be related to factors such as market structure, technological intensity and market regulation. 4
  • 5. grew 6.7% and 4.4%, respectively. Using a different set of data, IPEA (2012) finds that labor productivity in manufacturing grew -0.9% per year between 2000-2009, while it grew 4.3%, 1.8% and 0.5% in the agriculture, mining and service sectors, respectively. Chart 4 shows that manufacturing goods represented 54.7% of total exports in the beginning of the decade, but by 2011 their participation fell to 36%. Primary products, in their turn, increased from 28% to 47.8%, becoming the defining sector for the insertion of the Brazilian economy in the global trade arena.6 There were also significant changes in export coefficients and import penetration, as shown in chart 5. Import penetration increased rapidly in several sectors, including those which were traditionally occupied by domestic companies, such as consumer goods. In the beginning of 2012, some 23.7% of apparent consumption in the textile sector was being imported against 8.1% in 2000; clothes, 10.6% against 1.2%; leather artifacts, 46.1% against 6.6%; chemicals, 25.7% against 15.3%; and rubber, 25.6% from 11.1%. Puga and Nascimento (2010) show that import penetration increased more rapidly in the labor and scale-intensive sectors. Manufacturing trade, which was in surplus for several years, fell rapidly from 2006 and became a deficit by end of the decade – in 2011 the trade balance of manufactured products was minus US$ 43.2 billion. If we exclude for a moment the surplus in the low technological products group, which includes foodstuff, lumber and pulp sectors, the manufacturing trade deficit would jump to US$ 86.1 billion, almost three times the total trade surplus in that year. The Brazilian trade balance is still in surplus thanks to primary products. Sarquis (2011) identified a falling trend in the Brazilian intra-industry trade, while Baumann (2012) found that Brazilian industrial exports are increasingly out of synch with trends in the worldwide demand for manufactured products. Such evidence is a strong sign that Brazilian industry is being left by the wayside in relation to global manufacturing. 6 Part of this fall is related to the high prices of primary products in the 2000s. 5
  • 6. Chart 4: Exports by sector - % of total Source: Ministry of Trade and Development 65 60 55 50 45 40 35 30 25 20 15 10 5 0 2000 2001 2002 2003 2004 2005 2006 2007 2008 2009 2010 2011 2012 Jan- Apr Basic products Semi-basic products Manufacturing Chart 5: Export coefficient and import penetration (%) Source: Confederation of National Industry 25 20,7 19,1 18,7 18,5 20 18,0 17,3 17,3 16,8 15,7 15,4 15,3 15,0 15,0 14,6 13,5 13,4 15 12,3 11,8 11,9 11,6 11,4 11,1 10,5 10,3 10 5 0 2000 2001 2002 2003 2004 2005 2006 2007 2008 2009 2010 2011 Export coefficient Import penetration Chart 6 shows a falling trend in the manufacturing share in GDP. In 2011, the manufacturing share was 14.6%, less than half of the figures recorded in the early 1980s. The falling trend in manufacturing together with previous indicators, suggest that the Brazilian manufacturing sector is losing its drive at the domestic level. 6
  • 7. Chart 6: Manufacturing share on GDP (%) Source: WDI - World Bank 20 19,2 19 18 18,0 18,1 17,2 17,1 17 16,9 16,6 16,7 16,4 16,2 16 15,4 15 14,6 14 2000 2001 2002 2003 2004 2005 2006 2007 2008 2009 2010 2011 3. International comparison To further analyze whether Brazilian industry is truly losing its drive, it is necessary to go beyond the usual analysis of performance indicators, as previously discussed, and assess it from the international perspective. To do so, we make use of the industry-space analysis (Arbache 2012). Industry-space is the locus where two simple, but revealing variables for analyzing industrial development over time meet. The first variable is the manufacturing share in GDP. The second is industrial density, which is manufacturing’s value added per-capita. Industrial density captures the capacity, and perhaps the willingness, of a society to build infrastructure, invest in physical and human capital and in R&D, and to reform institutions and manage such resources so as to foster industrial development (Arbache 2012). As this variable is strongly affected by the size of the population and the demographic development, the focus of analysis of this variable should go to the rate of growth rather than to its level only. As put forward by Arbache (2012), the relationship between the manufacturing share in GDP and industrial density is complex and in fact it is difficult to predict whether it will be positive or negative. The positive relationship is more likely to occur in emerging economies that are still building and developing industrial infrastructure. The weak or negative relationship is more likely to occur in advanced economies whose industries are already mature and have specialized in high-end manufactured products with lots of technological services embodied, such as the iPad. Arbache (2012) finds empirical evidence of a positive relationship up to a point; afterwards the manufacturing share stagnates or even retreats, while industrial density keeps rising. Brazilian industrial development from the international perspective 7
  • 8. Charts 7 and 8 present the averages of the manufacturing share in Brazil’s output and industrial density and in a sample of countries from 2000 to 2011.7 The average share of Brazilian manufacturing was 16.9%, comparable to that in developed countries such as the United States, Canada, France and the Netherlands, but quite below that in East Asian countries, such as South Korea, China, Thailand, and Malaysia. Chart 7 shows that Brazil’s industrial density, with an average of US$ 590, was closer to that in emerging economies such as China, South Africa and Latin American countries, but substantially smaller than that in developed economies. Therefore, comparing the share of manufacturing in GDP in countries at very different stages of industrial development may be misleading. Chart 7: Manufacturing share on GDP (%) average 2000-2011 Source: WDI - World Bank 34,5 40 32,0 35 28,6 27,5 26,1 24,2 30 22,5 20,9 20,9 19,8 19,6 25 18,6 18,2 17,7 17,2 16,9 16,6 15,8 15,4 15,1 14,0 14,1 20 13,5 10,0 15 9,8 10 5 0 nd Un Fr y Th ina a co ada un n e s ng y G tin a ia No ia ce e r ut h la co ca ne zil M rea ey es ile er s M s Ar r ies ic o sia Si an a In or pa di nd te e ou es ab e rw Ve a ite a n la rk Ch t ri f ri t ri In Ch Am So zu Ne St a ap ex ay Ko Br m Ca n Ja m la n t S on ai Ar ica A un Tu un ge er al d th co i d th ud e e Sa m co co in in gh e tin dl Hi id La M 7 All the data pertaining to the industry-space analysis is from the World Development Indicators, World Bank. Industry value added is in constant dollars of 2000. The sample of countries is highly diversified in terms of geography, income per capita and economic characteristics. 8
  • 9. Chart 8: Industrial density (constant US$) - average 2000-2011 8249 9000 8000 6761 7000 5406 4998 6000 4478 3826 5000 3719 3731 3431 3125 4000 3000 1454 1336 1026 1003 2000 966 954 829 843 729 590 558 562 369 259 1000 88 0 ne d Ca a y a co Ind dia co th da co esia Fr a e n No s St y a M ia th nce un l a co rea iA y G ies ile Th ies ng e s es M ico Ar ysia co z i an in or pa Ve lan nd ud r ke in el ric b rw n Bra ou na Ch tr i at In Ch ra tr zu nt ap ex tr Ko m Ja la Ne a Af m on ai a S a Tu un un ge er er al h d ut Si ite So e e Un S m ica er in in Am gh e dl tin Hi id La M Charts 9 and 10 present the industry-space in 2000 and 2011. It is worth noting the significant increase in industrial density in Korea, Singapore and China, as well as the drop in the manufacturing share in total output in France, Argentina and Chile. Brazil’s manufacturing share also fell, as discussed before, while industrial density increased slightly in the period. The gap between Brazil’s manufacturing share and the sample’s average remained almost the same in 2000 and in 2011, at around 17% below the sample’s average. The same persistence applied to industrial density, which remained at around 76% below the sample’s average. More important than this persistence is the deterioration of Brazil’s relative position compared to industrial competitors such as China, Korea and Singapore, and even in relation to rising industrial powerhouses such as Malaysia and Thailand. The industry-space analysis suggests that Brazilian manufacturing is losing its drive at the international level as well, while the economy is increasingly relying on primary products. Among the expected implications of this impoverished insertion of Brazil internationally are the exposure to sudden changes in terms of trade, reduced capacity for technological and innovation development, and lower and more volatile long-term economic growth. Indeed, stylized facts show that commodity prices are extremely volatile, and the experience in the last decades indicates that such prices are highly subjected to public and even private interventions. Empirical evidence also reveals that countries that depend on commodity exports present economic growth that is slower than that in countries with a more diverse export portfolio, which is related to its higher exposure to shocks and to the negative impacts of volatility in investment decisions, fiscal revenue, export revenue and productivity (Loayza, Servén and Ventura 2007). Lederman and Maloney (2007, 2008) show that this is not due to the export of primary goods per se, but rather to the low diversification of exports associated to low growth. Cavalcanti, Mohaddes and Raissi (2011) 9
  • 10. present empirical evidence that rising commodity prices might bring some benefits, but they also reveal that these benefits tend to be dominated by the downside of commodity price volatility, which would explain the long-term low growth tendency in countries that depend more on primary goods. Arbache and Page (2007) show that countries that depend more on commodity exports grow little, not because of a lack of the capacity to grow, but because they experience stronger growth accelerations and stronger growth collapses, which make average growth low in the long term. The authors also show that shocks in the terms of trade are among the main causes of growth accelerations and collapses in these countries. Cardoso and Teles (2010) show that fluctuations in Brazilian output around the potential output between 1900 and 2008 are strongly associated with shocks in the terms of trade. Chart 9: Industry-space 2000 10000 9000 8000 JPN 7000 Industrial density (US$) 6000 SGP USA 5000 GER HIC CAN 4000 NRW NTL FRC 3000 KOR 2000 ARG MEX MAL 1000 SAU VNZ LAC CHL TUR BRA THA IND SAR MIC CHN IDN 0 0 5 10 15 20 25 30 35 40 Man. share on GDP (% ) 10
  • 11. Chart 10: Industry-space 2011 10000 9000 JPN CIN 8000 7000 Industrial density (US$) 6000 USA 5000 GER KOR HIC 4000 NRW NTL CAN 3000 FRC 2000 ARG MEX MAL SAU TUR 1000 CHL VNZ PLA CHN THA BRA MIC IDN IND SAR 0 0 5 10 15 20 25 30 35 40 Man. share on GDP (% ) Table 1 shows the industry-space for 2011 divided into four quadrants created according to the sample’s averages. Countries were mapped out accordingly. As expected, countries with strong industry and that focused on exports of high value added industrial products fell into the first quadrant (Q1). This is the case for Germany, Japan, South Korea and Singapore, or the countries whose manufacturing could be called “Champions”. Countries with mature industry and with a modern and sophisticated service sector, such as the United States, France, Canada, the Netherlands and Norway, fell into the second quadrant (Q2). Their manufacturing could be called “Mature”. Medium income countries and those that foster policies to develop and strengthen their industries fell into the fourth quadrant (Q4). These are the cases for China, Malaysia and Thailand, or those countries whose manufacturing could be called “Tigers”. Finally, the third quadrant (Q3) presents countries whose manufacturing sectors lack drive, that are losing their drive, or those whose primary sectors are either effectively, or are becoming dominant in the economy. This group includes Venezuela, Saudi Arabia and Mexico, which depend heavily on oil; Chile, which prioritized the development of the mining, agricultural and fishing sectors; South Africa, which focuses heavily on mining, agriculture and services and whose industry has faced severe hardships related to the apartheid;8 India, the second world’s most populous country, the one with the largest poor population, and 8 For more details, see Draper and Alves (2009). 11
  • 12. with a large agriculture and service sectors; and Latin American countries, whose economies generally rely on commodities and have a significant informal sector. These are the countries whose manufacturing could be called “Laggards”. Brazil is in this last group.9 Table 1: Mapping out countries -- 2011 Canada Q2 Germany Q1 production) – below average / above average France Japan High Income Countries Singapore Industrial density (per capita industrial Norway South Korea The Netherlands United States Argentina Q3 China Q4 Brazil Middle Income Countries Chile Malaysia India Thailand Indonesia Latin American Countries Mexico Saudi Arabia South Africa Turkey Venezuela Share of manufacturing on GDP (%) – below average / above average To advance the examination of Brazilian industry’s drive further, we compare Brazil to select countries. The comparison of the Brazilian experience with China’s (Chart 11) shows large discrepancies in participation rates and in industrial density. The participation of Chinese industry in the economy is nearly twice that of Brazil. Chinese industrial density, however, started at a much lower level than Brazil’s, at US$ 304 against US$ 551 in Brazil in 2000. However, as it increased rapidly, among others, due to policies introduced to foster industrial development, including R&D, credit and export promotion, by 2007 China’s industrial density overtook Brazil’s, reaching US$ 904 in 2011, while Brazilian industrial density was practically stagnant. Our simulations suggest that, with the lasting and increasing rhythm of industrial density seen in the last decade, China’s industry will fall into Q1 before the end of this decade. The comparison between the two countries highlights the fact that the industrial density growth rate is just as, or is even more important than its level. It also emphasizes the importance of public policies aimed at fostering and supporting industrial development. 9 The industry-space method is strongly affected by the size and composition of the sample of countries. The inclusion of several African countries in the sample would significantly alter the averages and, therefore, the classification of the countries in the quadrants of Table 1. 12
  • 13. Chart 11: Brazil vs. China 35 1000 900 30 Industrial density (constant US$) 800 Man. share on GDP (%) 25 700 20 600 Brazil 500 Brazil 15 China China 400 10 300 200 5 100 0 0 2000 2001 2002 2003 2004 2005 2006 2007 2008 2009 2010 2011 2000 2001 2002 2003 2004 2005 2006 2007 2008 2009 2010 2011 The comparison with South Korea shows that the participation rate of Korean industry, which was already substantially higher than Brazil’s at the beginning of the decade, continued on an upward path and, by the end of the period, it was almost twice Brazil’s participation (Chart 12). Industrial density, in its turn, which was almost five times that in Brazil at the beginning of the decade, grew rapidly and, in 2010, was eight times larger. The Korean case also draws attention to the relevance of public policies, such as educational, technological and export promotion, for industrial development. Chart 12: Brazil vs. Korea 35 6000 30 Industrial density (constant US$) 5000 Man. share on GDP (%) 25 4000 20 Brazil Brazil 3000 15 Korea Korea 2000 10 5 1000 0 0 2000 2001 2002 2003 2004 2005 2006 2007 2008 2009 2010 2000 2001 2002 2003 2004 2005 2006 2007 2008 2009 2010 The comparison between Brazil and Thailand reveals a similar path to the Brazil-Korea analysis. The difference is that industrial densities in Brazil and Thailand were similar in 2000, but differed throughout the decade due to the fast growth in Thailand’s density (Chart 13). The Thai case also highlights the role of public policies in industrial development. Chart 13: Brazil vs. Thailand 13
  • 14. 40 1200 35 Industrial density (constant US$) Man. share on GDP (%) 1000 30 800 25 20 Brazil 600 Brazil Thailand Thailand 15 400 10 200 5 0 0 2000 2001 2002 2003 2004 2005 2006 2007 2008 2009 2010 2000 2001 2002 2003 2004 2005 2006 2007 2008 2009 2010 The Turkish participation rate follows a falling trend much like Brazil’s. However, it stabilized in 2009 and has grown since then (Chart 14). Turkish density, in its turn, presented a growing trend, increasing from US$ 840 in 2000 to US$ 1176 in 2011, up 40%. Chart 14: Brazil vs. Turkey 25 Industrial density (constant US$) 1400 1200 20 Man. share on GDP (%) 1000 15 800 Brazil Brazil 10 Turkey 600 Turkey 400 5 200 0 0 2000 2001 2002 2003 2004 2005 2006 2007 2008 2009 2010 2011 2000 2001 2002 20032004 2005 2006 20072008 2009 2010 2011 The path of Mexico’s participation rate is similar to Brazil’s, but has presented a trend of slight increase since 2009 (Chart 15). Industrial density, which was approximately twice Brazil’s in the early 2000s, has shown a positive trend since 2003, despite the break in 2008/09 due to the financial crisis. Chart 15: Brazil vs. Mexico 25 1200 Industrial density (constant US$) 20 1000 Man. share on GDP (%) 800 15 Brazil Brazil 600 10 Mexico Mexico 400 5 200 0 0 2000 2001 2002 2003 2004 2005 2006 2007 2008 2009 2010 2011 2000 2001 2002 2003 2004 20052006 2007 2008 2009 2010 2011 The comparison with the United States shows some similarities in the level and in the path of industry’s participation rate in the economy, but the American rate contracted more than the Brazilian rate (Chart 16). However, when it comes to industrial density, there is a substantial difference, since American industrial density tended to increase in general after 2003, stopping in 2008/09, but 14
  • 15. resuming the pattern in 2010. This exercise reinforces the view that comparing the participation rates in countries with such different industrial densities might be inappropriate and could lead to misleading conclusions.10 Chart 16: Brazil vs. the US 25 7000 Industrial density (constant US$) 6000 20 Man. share on GDP (%) 5000 15 4000 Brazil Brazil 10 USA 3000 USA 2000 5 1000 0 0 2000 2001 2002 2003 2004 2005 2006 2007 2008 2009 2010 2000 2001 2002 2003 2004 2005 2006 2007 2008 2009 2010 The highest level of industrial density ever recorded in Brazil was US$ 623 in 2011. A similar level was recorded for the first time in Korea in 1982-1983. Based on these simple figures, one could argue that Brazilian industry is about 29 years behind Korea’s. A similar exercise suggests that Brazilian industry was also behind other countries’ industries, including Thailand (15 years behind), Malaysia and Turkey (10 years behind). Although Brazil has a manufacturing participation rate comparable to Q2 countries, it is also well behind them. This is because in the year they first reached the same participation rate as Brazil’s current rate -- between 14% and 15% -- their industrial densities were substantially higher than Brazil’s, as follows: Norway’s was US$ 3,522; the US’ was US$ 4,905; France’s was US$ 3,319; and Canada’s was US$ 3,953. This exercise suggests that Brazilian manufacturing contracted prematurely and well before reaching a higher level of development. Tidal-wave effect? To examine whether the fall in Brazilian manufacturing resulted from an across- the-board shrinking of industrial activity rather than from a movement particular to Brazil, we calculate the growth rate of the manufacturing share in GDP and the growth rate of industrial density. If there was indeed a “tidal-wave effect”, then we should find an across-the-board pattern in these growth rates. Charts 17 and 18 suggest that there is no common pattern, even among commodity producers and among developed countries. Countries have actually followed quite different patterns overtime and therefore there are no stylized facts. 10 Besides the experiences reported here, many others deserve a word, such as India’s density, which increased 85% from 2000 to 2011, even though it is still at quite a low level, as well as the Argentine case, which shows a sharp fall in the manufacturing share in output since the early 1990s. 15
  • 16. Germany experienced a drop in manufacturing share, but an increase in industrial density, whereas France experienced a drop in both indicators. Indonesia saw a substantial drop in manufacturing share, but a significant rise in industrial density, whereas Thailand advanced in manufacturing share and in industrial density. Venezuela and Saudi Arabia, major oil producers, also experienced quite distinct patterns. While both manufacturing share and industrial density dropped in Venezuela, these indicators improved in Saudi Arabia. This simple exercise suggests that there is no such “tidal-wave effect”. Therefore, it is unlikely to have been the main explanation for the loss of drive of Brazilian manufacturing. Chart 17: Growth rate of manufacturing on GDP (%) - 2000-2011 20 10 0 d un y iA a Fr a Un Tu e co Ge dia n ou s ou y sia Th n a M s e Ar abia s ut ela ng a e r th e zil a St y s Ca le M te s sia ico -10 Co wa e C an ud h in d rie or pa ut lan C nd Ve a nc ite r ke rie re Si fric i a tr i na Ch i ne In So ezu nt ap ay ex a Ko Ne Br rm Ja ica rla nt r nt r Sa C So ai A m No ge do al h n h d In -20 e e m co Am In -30 In gh e tin dl Hi id La M -40 -50 -60 -70 Chart 18: Growth rate of industrial density (%) - 2000-2011 250 200 150 100 50 0 d y a Fr a C pan Ar ore ou ia er y un s ng a T h in a N s ne e a s a a ica J a l a M ies I n key Tu e G es i A ia o zi an e wa in d rie ut an Co nd V e a nc Si esi bi el l re ric d ite xic hi ys -50 ra tr i na at In r ra Ch zu nt ap Ko m la nt So ail r C So o r Af nt n B Un Me Sa ala St Ca ge do er ou h h d c o th ud ut C I n Ne e e m m er co Am In gh e tin dl Hi id La M 4. Explaining the low drive in Brazilian industry The integration of the Brazilian economy in the world economy led to increasing competition from foreign goods, especially Asian, in the domestic market, and 16
  • 17. showed the lack of competitiveness in several segments of Brazilian manufacturing. This section aims to briefly discuss the origins of such competitiveness challenges. The so-called Brazil Cost (Custo Brasil) refers to systemic shortcomings in the Brazilian economy. Although companies in general suffer from domestic weaknesses, including inadequate planning and poor management,11 the environment in which they operate also influences their performance. As 71.5% of the gross value of the output of industrial companies refers to inputs and taxes (Arbache and Burns 2012), it is reasonable to suppose that the competitiveness of industrial companies depends largely on conditions outside the "factory floor".12 Particularly significant external obstacles include shortcomings in infrastructure and logistics, which are identified by industrial companies as some of the major constraints to their operations and competitiveness (World Bank 2012). In fact, the more a company depends on value chains and logistics to receive inputs and ship their products to customers, the more it is exposed to the high costs associated with the low systemic efficiency of Brazilian logistics. Excessive red tape and taxes are also cited as major obstacles to industrial competitiveness (World Bank 2012). Compounding taxes that require complex management and that are high for world standards contribute to significantly raising the final price of products and thus harming competitiveness. The ICMS tax subsystem, an extremely complex, costly and fragmented VAT governed by each federative state, constitutes an important barrier to efficiency. Besides being high -- it can be as high as 25% -- the ICMS’ state laws are inconsistent and foster fiscal wars. Of particular note in this area is the conclusion of a study conducted by the Brazilian National Confederation of Industry (CNI), which has identified that the tax burden on manufacturing is disproportionately high, reaching up to 57.3% of the output of certain industries, while in agriculture it reaches up to 3.7% and in services up to 21.1%. Markets with few competitors, as well as regulatory and legal issues, also compromise the competitiveness of industry. The case of energy is illustrative. Although the price of energy in Brazil is always associated with high taxes, an important part of the final price is due to a legal framework that leads to a low number of competitors and discourages investment. Energy costs are among 11 Bloom et al (2011) show that manufacturing firms in Brazil tend to be poorly managed – joint with India, Brazil actually ranks among the worst in a cross-country analysis. They also show that there is a wide spread of management practices and a large tail of very badly managed firms in the country. 12 Data are from the IBGE Annual Survey of Industry (PIA). According to the PIA classification, inputs are the gross value of industrial production minus the industrial value added. Inputs include workforce, financial services, industrial services, logistics, energy, among other items. 17
  • 18. the highest in the world, despite Brazil having one of the largest renewable energy matrix globally. The increasing dependence of industrial enterprises on service providers and outsourced services also impacts the competitiveness of the manufacturing sector. This happens because, as shown by Arbache and Burns (2012), services are expensive and of poor quality, affecting the cost and the competitiveness of industry.13 Despite the poor quality and cost, expenses with service inputs continue to grow – they went from 20.5% in 2007 to 24.5% in 2009.14 One of the most striking characteristics of the Brazilian economy vis-à-vis comparable countries is poor labor productivity.15 However, as seen above, the development of labor productivity in manufacturing has been particularly low, which is a result of several factors, including, but not limited to, poor human capital. Although Brazil has made significant progress in education over the last decade – average schooling increased by 17% in the period – many emerging countries have also made similar or even better improvement in education.16 Despite manufacturing workers having higher average education than the average of the population, the sector’s indicators fall short. In fact, among formal workers in manufacturing, some 52.8% has not finished high school and 26% has not finished elementary school. The rate of functional illiteracy among manufacturing workers from 15 to 64 years of age is 26%, only slightly below the country as a whole, which is 28.2%.17 Due to educational shortcomings as well as cognitive learning and knowledge gaps, training and professional education have become increasingly important to equip employees with labor skills. Such skills are required so that modern industry can operate within the framework of the new forms of production that entail more creativity, adaptability and innovation. According to the PNAD-IBGE (National Household Survey), in 2007 only 34% of industrial workers had attended a training course, and this shortcoming is partly due to the shortage in opportunities for training, as well as technical and vocational education. 13 According to the IBGE, inflation in services has been higher than that for industrial products. 14 Latest year available. 15 See, for example, productivity data from the Groningen Growth Development Centre or the International Labor Organization. Productivity has grown modestly in relation to emerging countries – between 2000 and 2009, productivity (measured by total factor productivity) grew approximately 0.4% per year in Brazil, while in China and India it grew 5.2% and 2.8%, respectively (Wilson 2011). 16 See Barro and Lee (2010) database. 17 According to a study conducted by CNI, some 85% of companies indicate that poor quality of elementary education is the main obstacle for skills development (A Falta de Qualificação dos Trabalhadores da Indústria, CNI, April 2011). 18
  • 19. At the same time that manufacturing requires more human capital, the supply of skilled workers has not kept up with demand, increasing the workforce deficit. In fact, the lack of skilled workers is identified as an issue for 69% of industrial companies, pushing wages up thus harming mainly smaller companies. For industry, which is directly exposed to international competition, the combination of slow growth in labor productivity and rising labor costs compromises competitiveness, especially in labor-intensive sectors. Three simultaneous factors help explain the significant increase in the real wage in the private sector from 2005 to 2011. The first factor is the heating up of the economy. The second is the limited supply of skilled workers. The third factor, and perhaps the most important, is the slowdown in the growth rate of the working-age population resulting from a profound demographic change in Brazil (Arbache 2011). In fact, the cost in dollars of the labor-hour in Brazil’s manufacturing sector increased from US$ 5.02 in 2005 to US$ 10.08 in 2010, a substantial rise for international standards (see Chart 19).18 In 2010, labor costs in the manufacturing sector were already higher than those in Poland and Taiwan (two countries whose average years of education and whose workers’ skills are well above those in Brazil), and were much higher than those in China and Mexico, countries with which Brazilian industry competes directly for markets. Considering the recent developments in labor productivity and wages in Brazil, it is reasonable to assume that there has been a significant increase in unit labor cost (ULC). In fact, Bonelli and Pinheiro (2012) show that between 2005 and 2008, the ULC increased approximately 19% per year and, from 2009 to 2011, rose 11.5%. According to these authors, this increase resulted from three factors: the rise of real labor costs in Brazilian reais, the appreciation of the exchange rate, and the stagnation of labor productivity. Along the same lines, Arbache and Burns (2012) show that there was a significant increase in the participation of labor costs in total costs for industrial companies, especially in labor-intensive industries, such as apparel and clothing, leather and footwear, wood products and miscellaneous goods. 18 2010 is the latest year available. 19
  • 20. Chart 19: Hourly manufacturing labor cost (US$ - include wages and payroll taxes) and growht (%) Source: US Labor Bureau 133,3 25 140 120 19,1 101,1 20 16,6 100 15,1 13,2 15 80 11,7 2005 10,1 2010 9,4 60 46,4 44,2 10 8,4 Growth rate 8,0 7,9 6,2 5,6 40 5,5 24,7 5,0 5 11,0 20 9,9 1,4 5,4 0,6 0 0 Taiwan Korea Mexico Portugal Singapore Poland Brazil China The heating up of the labor market in recent years and the lack of skilled labor also contributed not only to increasing the labor turnover, but also to revealing the labor law obstacles to manufacturing competitiveness. On the one hand, legislation encourages workers to look for immediate extra earnings when they change jobs. On the other hand, strict legislation regarding the adjustment of working hours and shifts when the economic cycle dwindles encourages dismissals (Gonzaga 1997). The problem is that the labor turnover is not neutral in terms of productivity and costs, as it discourages company investment in training and, for workers, it discourages commitment to the company and career. According to the Ministry of Labor, the turnover rate, which is already one of the highest in the world, has increased 30% since 2006, while the percentage of professionals in the same job for more than five years has been decreasing. Another obstacle to manufacturing competitiveness is the poor numbers in the adoption of new technologies and investment in innovation. Indicators of PINTEC-IBGE show that Brazilian companies not only invest little in innovation, but most of those who do in fact invest, do so by acquiring machinery and equipment. As a result, companies tend to operate in more competitive and "commoditized" markets, in which little or no extra compensation at all is received.19 There is also evidence that new equipment does not always work at its optimum speed nor with the best output due to factors ranging from inadequate training of workers to variations in electrical current. Among the main consequences of 19 Economic literature emphasizes that technology and innovation policies should be the main element of public policies to foster diversification and strengthening of industrial activity, especially in countries that aim to reduce the technological discrepancy in an era in which catching-up becomes harder due to the constant and swift evolution of the technological paradigm (e.g. Dahlman 2012). 20
  • 21. low investment in innovation is the large and growing trade deficit for manufactured goods of high and mid-high technology, as previously discussed, and the drop in exports of high-technology products, which went from 9.3% of total exports in 2005 to a mere 6.2% in 2011. Finally, the lack of access to financing, high interest rates and an appreciated exchange rate complement those other obstacles to industrial competitiveness. Although interest rates have fallen significantly since the beginning of 2012, they are still high compared to world standards, compromising investments and the financial health of companies, especially small and medium-sized enterprises. In fact, PIA data show that financial services are one of industry’s most important cost items (Arbache and Burns 2012). The appreciation of the exchange rate of more than 46% since 2003, on the other hand, significantly altered relative prices in favor of imported products, affecting international competitiveness and the profitability of industrial investment. 5. The new challenges faced by the Brazilian industry Brazilian industry has at least six emerging challenges that are likely to influence its destiny. The first challenge is related to demographic changes. Brazil is undergoing one of the most rapid demographic changes of the post- war period, and its effects are already being felt in the declining growth rate of the working-age population. Estimates from the IBGE indicate that growth in the PIA will be very low or even zero from mid-2020. This demographic change is already affecting the general competitiveness of the economy and especially that of industry, notably through the pressure it places on the labor market in a context of low growth of labor productivity (Arbache 2011). The second challenge is related to the entry of Asian countries, such as India, Vietnam and Indonesia, and African countries in the mass manufacturing sector encouraged not only by growth in domestic markets, but also by the increase in labor costs in China, and by multinationals seeking geographical diversification of production.20 China, in its turn, will increasingly invest in these regions to mass produce while it is undergoing a technological upgrade. The third challenge is associated to this technological upgrade in China.21 China has made remarkable achievements in areas as diverse as space technology, 20 India is developing an ambitious industrial policy, the National Manufacturing Policy, which aims high at the international level in several sectors. African countries, even with all their problems, have increasingly participated in manufacturing in a more active way. An example of that is the growing shoe industry in Ethiopia. 21 Science and technology became fundamental chapters in the 11th and 12th National Development Plans (FYP) and gained more focus with the Medium and Long-Term Plan for 21
  • 22. supercomputers, nanotechnology, mechanical industry and medicine. With technological advancement, China’s exports are moving up in the value chain and competing with developed countries – exports of capital goods might surpass Germany in 2012, having already left Japanese exports in the dust.22 The fourth challenge is associated with new technologies and increased investments in manufacturing in developed countries. After decades of lacking interest, the US began paying attention to industry again, and the sector is already one of the main contributors to growth in product and employment in the country (Helper et al 2012).23 Backed by heterodox monetary and industrial policies, as well as new manufacturing technologies, new shale gas technologies, and rising labor costs in China, US industrial investments and exports are increasing and this is already having an effect even in Brazil – the bilateral trade balance of manufactured goods moved from historically positive in favor of Brazil to strongly negative. Although labor costs in the US are much higher than in developing countries, it seems that the use of sophisticated technologies, such as 3D printing and robotics, coupled with high labor productivity, has offset the cost differential and is helping to put the country back on the industry map.24 The fifth challenge is protectionism. Employing State capitalism policies is becoming popular worldwide as the economic crisis and uncertainties worsen. China’s State capitalism coupled with the failure of ultra-liberal economic policies, like those adopted by the US even before the financial crisis, have encouraged policymakers to reconsider the use of protectionist measures and market intervention to favor domestic companies. While it is understandable that State capitalism is politically attractive in a context of economic crisis, its multiplication on a global scale will have harmful implications on trade and economic growth, worsening the already strongly asymmetric competition National Science and Technology Development (2006-2020). China has vast ambitions and intends to lead technologies in several areas over the next few decades. 22 China is now the world’s leader in manufacturing output, with 19.8% of total production in 2011, having surpassed the US, which is now home of 18% of total output (Marsh 2012). According with Freire (2011), China is the country that has experienced the largest improvement in productive capacity in the last 25 years. Productive capacity is the set of capabilities available in a country to produce and market its output of goods and services. These capabilities include resource endowments (i.e. labor, physical capital, human capital, land), total factor productivity, mechanisms for the allocation of these endowments to specific uses, and any other factor that contributes to maximizing the output of the economy, including trade and transport integration, institutions, policies and regulations (Freire 2011). 23 Over the last few years the US government has introduced several policies and instruments to offer support to recover and strengthen industry, such as 2010’s National Manufacturing Strategy, as well as fiscal stimulus policies to bring back American companies set up abroad. 24 Because of these technological advances, product customization, rising expenses of manufacturing in emerging economies and other problems, Marsh (2012) argues of a “New Industrial Revolution”, in which the opportunities for emerging economies to participate in and to catch up with manufacturing output in developed countries are beginning to level out. 22
  • 23. conditions. Boosting the manufacturing sector in such an environment will be harder. The sixth challenge is the rising commodities’ revenues and their potential impacts on exchange rate appreciation, an issue that will probably become more noticeable when the pre-salt oil layer starts to flow into the market. The challenges associated with the new geography of production will redesign the global economy and the consequences will be immense. Immediately, there will be increasing competition. In the mid-term, there will be deep-seated and significant changes not only in global production sectors, but also in the global networks for innovation, international trade, capital flows as well as job creation and income. This complex transformation process will increase the pressure on Brazilian industry and force the country to implement policies and actions needed to significantly lift competitiveness. Likely consequences arising from the first and second challenges for Brazilian industry include an increase in production costs and heated competition in labor-intensive industries. To mitigate the potential effects of these challenges, industry will have to invest heavily in the use of technologies that save labor and in innovations to foster a technological and market upgrade. Likely consequences arising from the third and fourth challenges include an increase in competition in international markets in general, and in the medium and high value added markets in particular. If, on one hand, China opens up space for other economies to produce lower value-added manufactured products, on the other hand, it will increase competition in markets for goods of higher value added, including aircraft, capital goods, chemicals, and telecommunications, sectors that Brazil already holds market share and aims to expand its presence. For the country to participate more intensively in these markets, it will be necessary to substantially increase investments in productivity, efficiency and innovation, and to prioritize investments in sectors and niche markets. The probable outcome from the fifth challenge will be the harmful effects arising from the fallacy of composition of State capitalist policies, egging on mercantilist wars and political tensions among countries. In this environment, industries in countries with greater political strength and power to affect markets and influence institutions, such as the United States, the European Union and China, will tend to be favored.25 25 The Brazilian industry will need to tackle the challenges associated with the rising commodities’ revenues and their potential impacts on exchange rate. This issue will probably become more noticeable when the Pre-Salt oil starts to get in into the market. 23